Introduction
Metastases are the leading cause of mortality in
patients diagnosed with cancer (1). Cancer metastasis occurs when tumor
cells dissociate from the primary tumor and migrate to distant
organs through the peripheral bloodstream or lymphatic drainage.
Circulating cells with the characteristics of tumor cells of
epithelial origin, or circulating tumor cells (CTCs), have been
detected in the blood and bone marrow of patients with breast,
prostate and colon cancer (2).
These cells have been detected in patients with metastatic disease,
as well as in those whose tumors are apparently localized. The
identification and characterization of such cells and the
determination of their clinical significance have attracted
attention in the field of cancer research (3–5).
The CellSearch™ system is the first rare cell
isolation technology that demonstrated its clinical validity in
predicting progression-free and overall survival of metastatic
breast cancer patients based on CTC enumeration (2). Further characterization of CTCs, such
as assessment of CTC gene expression markers, may provide insight
into the mechanisms of metastasis and the optimal treatment
modalities for the patients. In a previous study, 55 mRNAs
abundantly expressed in CTCs were identified, suggesting that this
approach is feasible (5).
Breast cancer comprises 22.9% of all cancers in
women worldwide. It is responsibe for ∼13.7% of all the cases of
cancer-related mortality in women and ∼70% of breast cancer
patients with bone metastases eventually succumb to the disease
(6). Attempts have been made to
identify molecular markers that may predict the site of metastasis
in breast cancer (7–9). For example, in an earlier study, we
identified a 31-gene signature from primary tumor tissues that was
shown to be significantly associated with bone metastasis of breast
cancer; among these, trefoil factor 1 (TFF1) was identified as the
most differentially expressed gene associated with bone metastasis
(6).
In this study, we investigated breast cancer gene
expression markers in CTCs as potential predictive markers for the
site of metastasis and the response to treatment. We analyzed the
genes selected from previous studies in the baseline CTC samples of
80 metastatic breast cancer patients (first blood draw prior to the
initiation of chemotherapy) and the follow-up CTC samples of 30
patients. In addition, 40 healthy blood donors (HBDs) were used as
controls. The assay was performed by using quantitative reverse
transcriptase polymerase chain reaction (qRT-PCR) with RNA
extracted from the CTCs captured by the CellSearch™ System.
Materials and methods
Patient samples and characteristics
This study was coordinated by Mayo Clinic, Mayo
Validation Support Services, Rochester, MN, USA. The study was
approved by the Institutional Review Board (IRB). All the patients
were enrolled using IRB-approved protocols and provided written
informed consent. Between 2009 and 2011, a total of 80 patients who
were treated for metastatic breast cancer with specific
chemotherapy, hormonal and radiation therapy were enrolled.
Detailed patient clinicopathological information is presented in
Table I. This study was approved
by the Institutional Review Board (IRB) at the Mayo Clinic. All
patients were enrolled using IRB-approved protocols and provided
written informed consent.
 | Table I.Patient characteristics. |
Table I.
Patient characteristics.
| Characteristics | n (%) |
|---|
| Age (years) | |
| Mean | 59 |
| Range | 32–79 |
| Family history | |
| Yes | 24 (30%) |
| No | 55 (70%) |
| ER | |
| Negative | 9 (12%) |
| Positive | 66 (88%) |
| PR | |
| Negative | 17 (24%) |
| Positive | 54 (76%) |
| HER2/neu | |
| Negative | 40 (80%) |
| Positive | 10 (20%) |
| T stage | |
| 1 | (5 (13%) |
| 2:2A:2B | 5 (13%):6 (16%):5
(13%) |
| 3:3A:3C | 5 (13%):3 (8%):3
(8%) |
| 4 | 6 (16%) |
| Baseline
metastases | |
| Bone | |
| Yes | 60 (75%) |
| No | 20 (25%) |
| Lung | |
| Yes | 30 (38%) |
| No | 50 (62%) |
| Brain | |
| Yes | 13 (16%) |
| No | 67 (84%) |
| Treatment | |
| Chemotherapy | |
| Yes | 62 (78%) |
| No | 17 (22%) |
| Radiation | |
| Yes | 12 (15%) |
| No | 67 (85%) |
| Hormonal | |
| Yes | 15 (19%) |
| No | 63 (81%) |
| Follow-up | |
| Disease
progression | |
| No | 44 (60%) |
| Yes, new
metastases | 3 (4%) |
| Yes,
progression | 26 (36%) |
| Baseline CTC count
(n=80) | |
| 25th
percentile | 0.0 |
| 50th
percentile | 2.0 |
| 75th
percentile | 33.5 |
| 95th
percentile | 341.4 |
| Follow-up CTC count
(n=30) | |
| 25th
percentile | 0.0 |
| 50th
percentile | 1.0 |
| 75th
percentile | 5.5 |
| 95th
percentile | 59.0 |
Blood collection and sample
preparation
Two 7.5-ml blood samples were drawn from each
patient and collected into evacuated 10-ml blood collection tubes
containing EDTA (Becton Dickinson, Franklin Lakes, NJ, USA) and
10-ml CellSave tubes (Veridex, Raritan, NJ, USA). The samples were
maintained at room temperature and processed within 36 h of
collection. The CellTracks®AutoPrep® system
was used in conjunction with the CellSearch®CTC kit and
the CellSearch®profile kit (Veridex) to enrich and
enumerate CTCs. The enriched CTC samples were analyzed with
CellTracks®Analyzer II and the number of CTCs in the
sample was determined. For CTC profiling, the AutoPrep tube with
the sample from the CellTracks AutoPrep system was removed and
placed into the MagCellect Magnet for a 10-min incubation. With the
tube still in the MagCellect Magnet, the supernatant liquid was
aspirated with a Pasteur pipette without disrupting the ferrofluid
bound cells. A 350-μl aliquot of RLT lysis buffer with
β-mercaptoethanol (Qiagen, Valencia, CA, USA) was added to the
ferrofluid bound cells and vortexed for 30 sec to lyse the cells.
The cell lysate was briefly centrifuged at 800 × g to pellet
ferrofluid and insoluble debris.
CTC RNA isolation
CTC-derived RNA was isolated using RNeasy Micro kit
(Qiagen) according to the manufacturer’s instructions, with the
following modifications: To each cell lysate, 4 μl of
Polyinosinic:polycytidylic acid [Poly(I:C)] was added and vortexed
for 30 sec. An equal volume of 70% ethanol was added to the sample
and mixed by pipetting. The sample was loaded onto a micro-column,
provided in the kit, and centrifuged for 15 sec at 8,000 × g (the
time and speed were maintained in the following steps). RW1 wash
buffer (700 μl) was added to the column and centrifuged. RPE
buffer (500 μl) was added to the column and centrifuged and
500 μl of 80% ethanol was added to the column and spun for 2
min to dry the column. The columns were added to a new collection
tube and centrifuged for 5 min at maximum speed. RNA was eluted in
14 μl of RNase-free water by a spin for 1 min at 10,000 × g.
Subsequently, the extracted RNA was quantified on a NanoDrop 2000
spectrophotometer (Thermo Fisher Scientific, Wilmington, DE, USA)
according to the manufacturer’s instructions and stored at −80°C
until later use.
cDNA synthesis, pre-amplification and
qRT-PCR analysis
First-strand cDNA was synthesized using 10 ng of
total RNA and High-Capacity cDNA Archive kit (Applied Biosystems,
Foster City, CA, USA). The cDNA was amplified with the ABI TaqMan
PreAmp method (Applied Biosystems) and reagents according to the
manufacturer’s instructions. The selected candidate genes and the
housekeeping control genes were evaluated using the qRT-PCR assay
with the pre-amplified material. PCR amplification was performed on
the ABI PRISM 7900HT Sequence Detection system (Applied Biosystems)
using the 384-well block format with a 10-μl reaction
volume. The concentration of the primers and the probes was 4 and
2.5 μmol/l, respectively. The reaction mixture was incubated
at 95°C for 10 min to activate AmpliTaq®, followed by 40
cycles at 95°C for 15 sec for denaturing and at 60°C for 1 min for
annealing and extension. In addition, the primers and probes were
optimized towards the same amplification efficiency according to
the manufacturer’s protocol. The sequences for the primers and
probes for the 22 breast cancer-specific genes and 3 control genes
are listed in Table II, in the
5′-3′ direction. All the oligonucleotides, primers and probes, were
manufactured by Biosearch Technologies (Novato, CA, USA). The
probes were modified by fluorophore dye labeling at the 5′ ends and
BHQ labeling at the 3′ ends and were synthesized according to the
manufacturer’s instructions.
| Table II.Quantitative reverse transcriptase
polymerase chain reaction primers and probes. |
Table II.
Quantitative reverse transcriptase
polymerase chain reaction primers and probes.
| Gene | RefSeq | 5′-3′ Sequence
(forward, reverse and probe) |
|---|
| ERβ | NM_001437.1 |
ACCTGTAAACAGAGAGACACTGA |
| |
AGCGCAGAAGTGAGCAT |
| |
ACCGTTGCGCCAGCCCTGTTACT |
| MAGE-A3 | NM_005362.3 |
GAAGGAGAAGATCTGCCAGT |
| |
TGCTGACTCCTCTGCTCA |
| |
ATTGCCCAGCTCCTGCCCACA |
| SERPINB5a | NM_002639.2 |
AGATCATAGAGCTTCCTTTTCA |
| |
AGTTGTTTTTCAATCTTCTCCA |
| |
TCTCAGCATGTTCATCCTACTACCCA |
| ERBB4 | NM_005235.1 |
ACAGTCAGAGAGATAACAGGTTT |
| |
ACAGGCCACTATAGAGTACTCTT |
| |
ATGGCCACCAAACATGACTGACT |
| PR | NM_000926.2 |
TCTTGATAACTTGCATGATCTTGT |
| |
AGACATCATTTCTGGAAATTCA |
| |
AATACATTTATCCAGTCCCGGGCACT |
| TFF3 | NM_003226.2 |
GTGGGCCTGTCTGCAA |
| |
ACTCCTTGGGGGTGACAT |
| |
AGGACAGGGTGGACTGCGGCTA |
| TFF1 | NM_003225.2 |
GCCCAGACAGAGACGTGT |
| |
TCGAAACAGCAGCCCTTA |
| |
TGGCCCCCCGTGAAAGACAGA |
| MG | NM_002411 |
AGTTGCTGATGGTCCTCATGC |
| |
CACTTGTGGATTGATTGTCTTGGA |
| |
CCCTCTCCCAGCACTGCTACGCA |
| SPDEF | NM_012391 |
CGCCCACCTGGACATCTGGA |
| |
CACTGGTCGAGGCACAGTAGTGA |
| |
GTCAGCGGCCTGGATGAAAGAGCGG |
| EGFR | NM_005228 |
TCCTTCTTAAAGACCATCCA |
| |
GATCTGCAGGTTTTCCAA |
| |
TGGTTATGTCCTCATTGCCCTCA |
| S100A16 | NM_080388.1 |
CCCTGCTGGAGAGGAGGC |
| |
GACATCTCCCTGCTTCGCC |
| |
TGAGGCAGCAGGCCCCGC |
| PKP3 | NM_007183.2 |
ACCTGTCTCGGAACGCTAGGA |
| |
GGCAGCTTCTCGATCAGGTG |
| |
GGACGAGATGTCCACGAAGGTGGTGA |
| SCGB1D2 | NM_006551.3 |
TGCTACCAGGCCAATGCC |
| |
GGCAAGACTTAACTTGAACAGAGGTT |
| |
GCCCAGCTCTTGTTTCTGAGCTGTTAGACTT |
| FOXA1 | NM_004496.2 |
CCAGCGACTGGAACAGCTACTAC |
| |
CTGAGTTCATGTTGCTGACCG |
| |
ACACGCAGGAGGCCTACTCCTCCGT |
| AGR2 | NM_006408.3 |
CAGATACAGCTCTGTTGCTTGACA |
| |
GACAGACAGAAGGGCTTGGAGA |
| |
AGAAAGCTCTCAAGTTGCTGAAGACTGA |
| PIP | NM_002652.2 |
AGGACAACACTCGGAAGAT |
| |
TGCATTCTTTCAATTCTGTTT |
| |
ACATTCCCAAGTCAGTACGTCCAA |
| CEA | NM_004363.2 |
CAATAATTCCATAGTCAAGAGCA |
| |
CAACCAGCACTCCAATCAT |
| |
TGCATCTGGAACTTCTCCTGGTCT |
| TNRC9 | NM_001080430 |
TACGGCTACAGCAAGTTTGGA |
| |
TGGTGTGTGGAATGTCTGCT |
| |
ATATGGCTGAGGCGAACAATGCGT |
| LAD1 | NM_005558.3 |
ACTCGCAGTGCCAGCAT |
| |
ACCCCGAGACTTGACAGATT |
| |
TGAAGTTGGGAGAGAAGCTGGAGAGA |
| FGFR3 | NM_022965.3 |
CGTACTGTGCCACTTCAGTGT |
| |
AGTAAGGGGCCCCTGTGT |
| |
ATGACGAAGACGGGGAGGACGA |
| IGFBP5 | NM_000599.3 |
AGCAAGTCAAGATCGAGAGA |
| |
ATCTTGGGGGAGTAGGTCT |
| |
AGGAGCCCACCACCTCTGAGAT |
| KRT19 | NM_002276 |
AGCAGGTCCGAGGTTACT |
| |
TCCAAGGCAGCTTTCAT |
| |
TCTTGAGATTGAGCTGCAGTCACA |
| ACTB | NM_001101 |
ACAGGATGCAGAAGGAGAT |
| |
TCCACACGGAGTACTTGC |
| |
ATCAAGATCATTGCTCCTCCTGAG |
| TACSTD1 | NM_002354 |
GTAAAAGTTTGCGGACTGC |
| |
AATACTCGTGATAAATTTTGGATC |
| |
TCAGAAGGAGATCACAACGCGTTA |
| BST1 | NM_004334 |
AGCAGCGGAACAAGAA |
| |
AGTTAATAAAAAGGTCATAGTCTGA |
| |
AGCCATCTGGGAAGCCTTTAAAGT |
Data analysis
qRT-PCR data were analyzed by a manual threshold of
0.2 and a baseline of 5–15 to obtain cycle threshold (Ct) values
for both channels. The results were considered valid when the Ct
value of actin was ≤25 and no template control had undetectable Ct.
By using this threshold, only one of the 80 patient CTC samples
(1.2%) was excluded from further analysis. The significance of the
gene markers was evaluated by univariate and multivariate analysis
using R software, A Language and Environment for Statistical
Computing (R Foundation for Statistical Computing 2012, Vienna,
Austria).
Results
Patient characteristics
The clinical and pathological characteristics of the
patients are summarized in Table
I. All the patients suffered from metastatic breast cancer and
received their treatments at Mayo Clinic. The information included
site of metastatic disease, type of treatment (chemotherapy,
radiation and hormonal therapy) and response to treatment. A total
of 78% of the patients were treated with chemotherapy, whereas 15
and 19% of the patients were treated with radiation and hormonal
therapy, respectively, after being diagnosed with metastatic
disease. A total of 60 patients (75%) had bone metastasis, 30 (38%)
had lung metastasis and 13 (16%) had brain metastasis. Of the 80
patients, 23 presented with metastatic disease at multiple sites.
In order to evaluate their response to treatment, disease
progression was monitored approximately every 3 months by one or
more of the following: computed tomography scan, positron emission
tomography scan, magnetic resonance imaging, X-ray specific to the
site of metastasis or concern, ultrasound or biopsy. The diagnosis
of progression or lack thereof was confirmed by an oncologist based
on the review of the test results.
CTC enumeration
Blood samples of 7.5 ml were obtained from the
patients and collected into CellSave tubes. The number of CTCs in
each blood sample was identified and counted with the CellSearch
system. CTCs were identified in the 7.5-ml blood sample of 48
patients (61%). Of these, 32 patients (66.7%) had ≥5 CTCs. One
patient, MAY_B_031, had >1,100 CTCs. The average number of CTCs
at baseline in the 80 patients was 66 (Table I). No CTCs were detected in any of
the HBDs.
Gene expression analysis of CTCs
A total of 25 gene markers were selected and
analyzed in the 80 baseline samples, the 30 follow-up samples and
the 40 HBD samples. The 25 markers included 22 breast-specific
genes, 1 epithelial cell-specific gene, 1 leukocyte-specific gene
and 1 housekeeping gene (Table
II). The qRT-PCR assays for individual genes were optimized by
testing various primers and probes in breast cancer cells,
including the MCF7 and SKBR3 cell lines, as well as HBD samples
(data not shown). The results demonstrated that 12 genes were
specifically expressed in CTCs, without detectable expression in
the HBD samples (Table III). Among
the highly expressed genes in CTCs, 27 (33.8%) and 25 (31.3%)
patients expressed TFF1 and mammaglobin, respectively. In addition,
the keratin 19 (KRT19) gene was highly correlated with the CTC
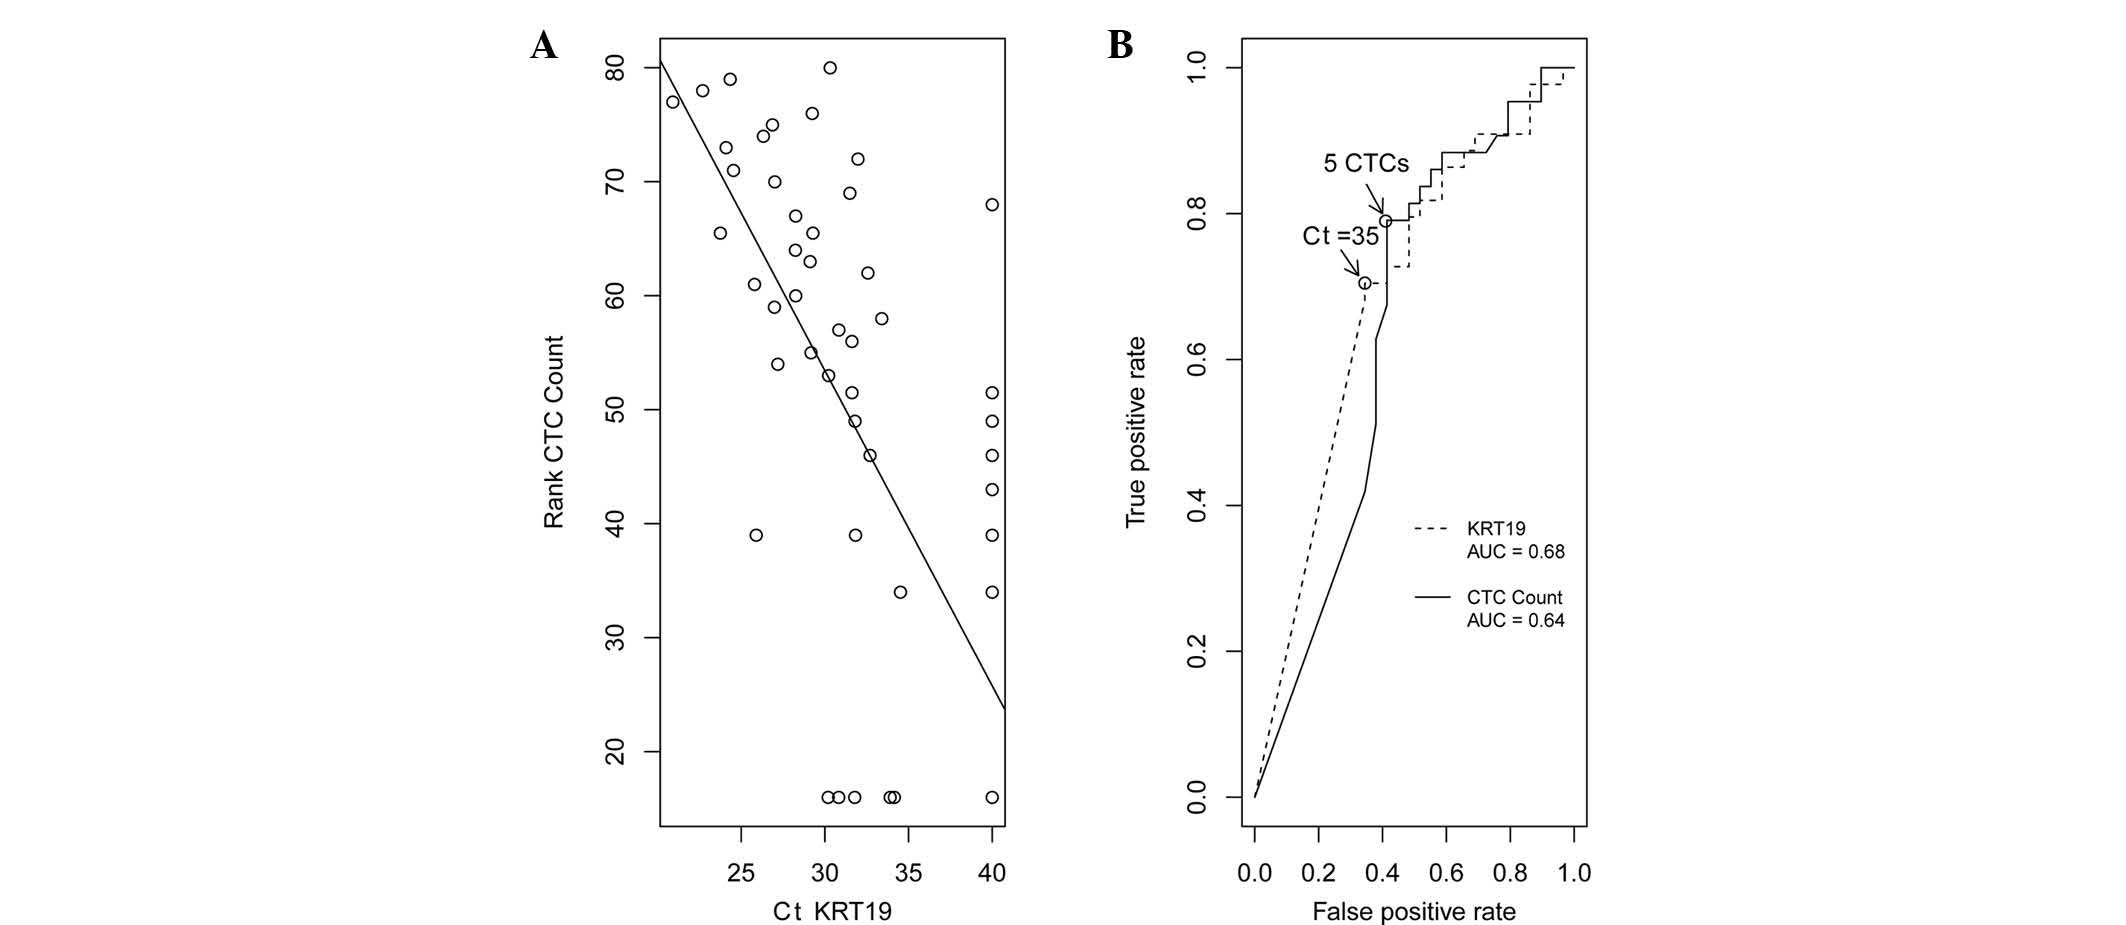
count, consistent with previously reported findings (10). The scatter plot of the correlation
between KRT19 and the rank order of the CTC count is presented in
Fig. 1A; the correlation
coefficient was 0.7. A receiver operating characteristic curve was
generated using the baseline measurements of either the KRT19
expression [area under the curve (AUC= 0.68)] or the CTC count
(AUC=0.64), to distinguish between patients with and those without
disease progression (Fig. 1B). The
expression of β-actin and bone marrow stromal cell antigen 1 (BST1)
was prominent in the samples purified through the
CellSearch® system (data not shown). The correlation of
expression between these two genes was 0.953. Since β-actin is
expressed in all cell types, whereas BST1 is specific to
leukocytes, the detection of BST1 expression demonstrated that the
cells purified through the CellSearch System exhibited a
significant amount of leukocyte carryover, as previously
demonstrated (11). The highly
correlated expression profile between β-actin and BST1 also
suggested that the leukocyte carryover contributed to the
expression of β-actin.
| Table III.Gene markers specifically expressed
in circulating tumor cells (CTCs). |
Table III.
Gene markers specifically expressed
in circulating tumor cells (CTCs).
| Gene | No. of CTC samples
detected | Correlation
coefficient between Ct and CTC count | P-value |
|---|
| TFF1 | 27 | −0.53 | 5.13E-07 |
| ERBB4 | 12 | −0.55 | 1.59E-07 |
| CEA | 10 | −0.48 | 9.31E-06 |
| IGFBP5 | 17 | −0.47 | 1.21E-05 |
| MAGE-A3 | 7 | −0.43 | 9.35E-05 |
| MG | 25 | −0.40 | 2.36E-04 |
| TNRC9 | 5 | −0.38 | 6.33E-04 |
| PIP | 16 | −0.35 | 1.76E-03 |
| PR | 5 | −0.29 | 9.44E-03 |
| SERPINB5 | 3 | −0.28 | 1.31E-02 |
| SCGB1D2 | 1 | −0.16 | 1.62E-01 |
| EGFR | 4 | −0.09 | 4.55E-01 |
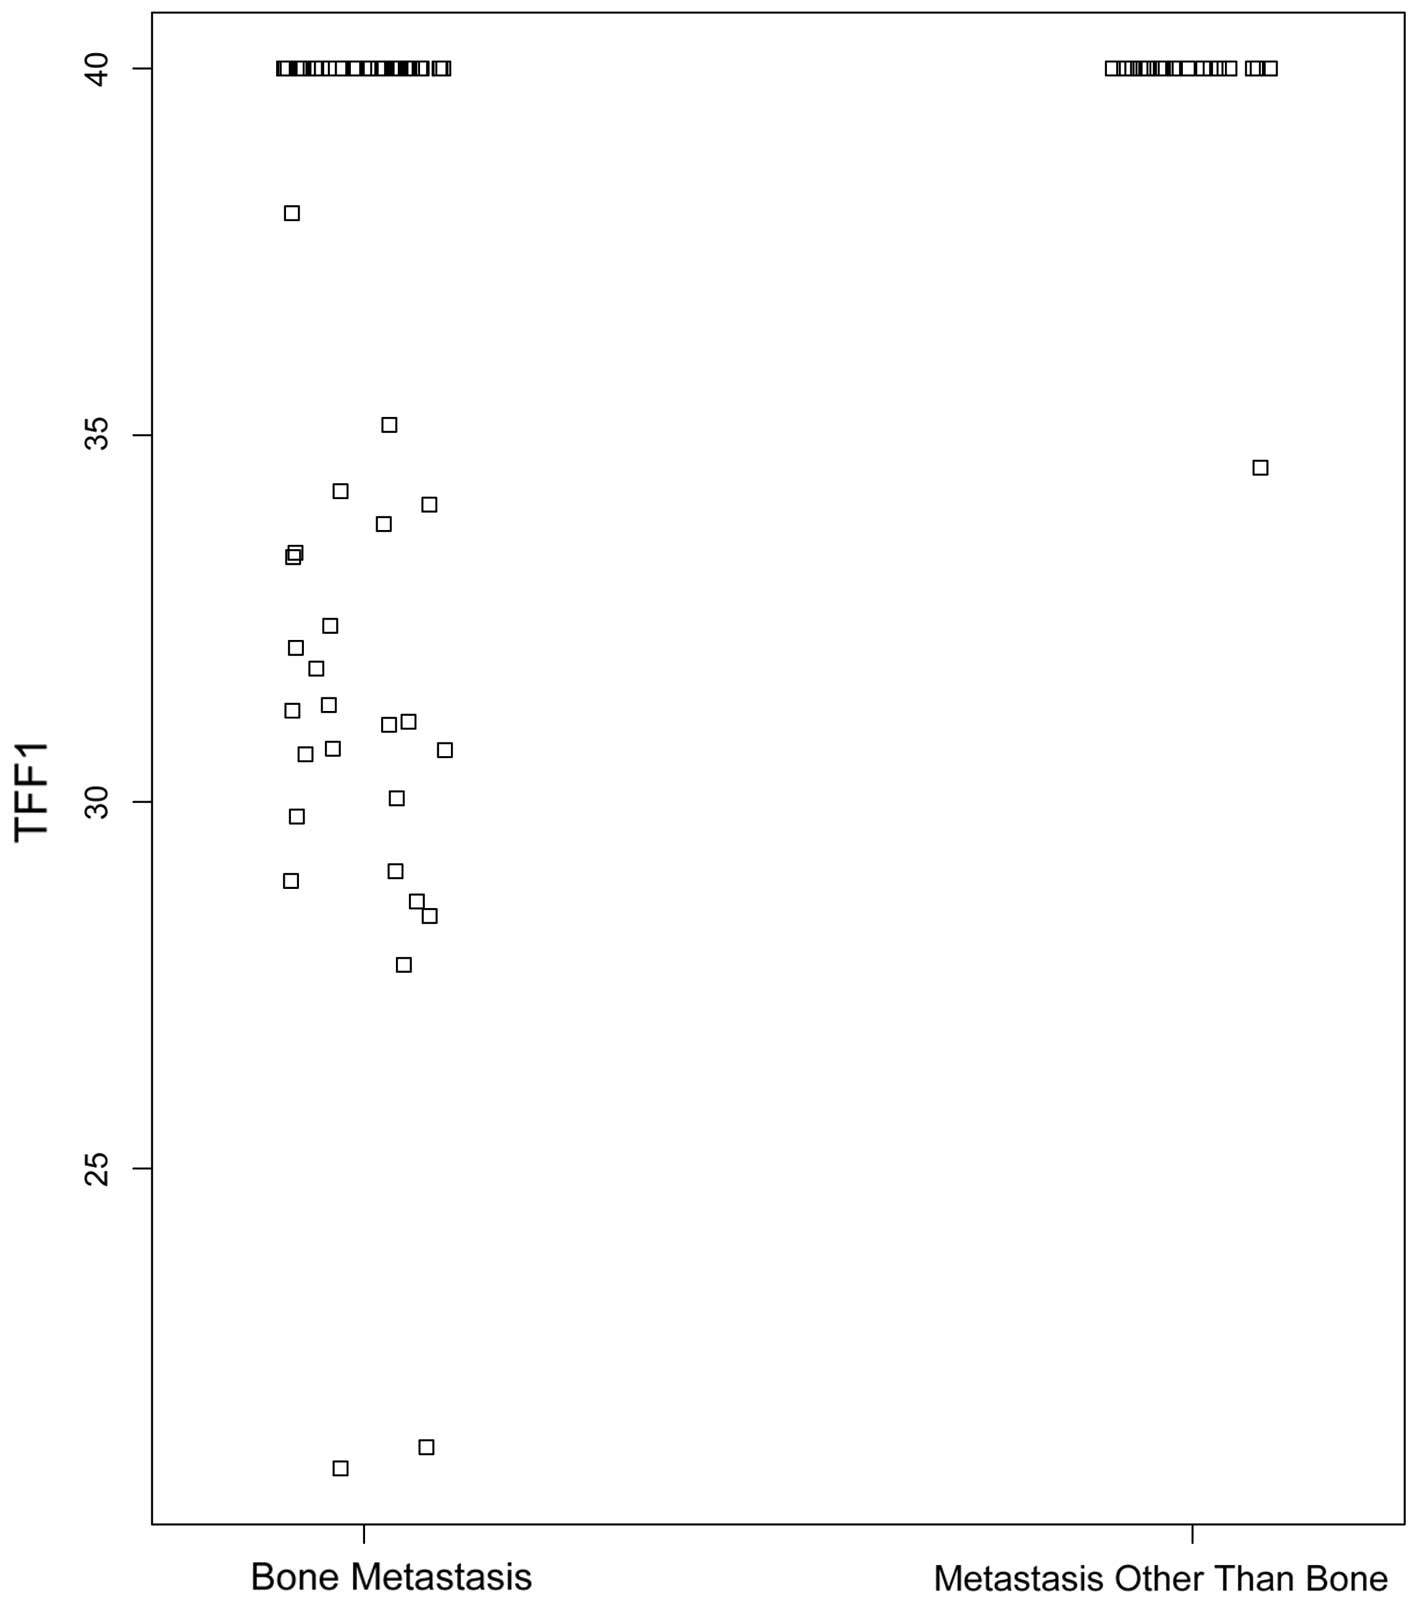
TTF1 expression is associated with bone
metastasis
In our earlier study, TFF1 was identified as the
most differentially expressed gene associated with bone metastasis
(6). Consistently, the results of
this study demonstrated that TFF1 expression in CTCs is strongly
associated with bone metastasis and this association is independent
of the CTC count (Fig. 2). A total
of 26 (43.3%) of the 60 patients with bone metastasis exhiibited a
high expression level of TFF1. By contrast, only 1 patient (5%)
with metastasis at a site other than bone exhibited detectable
levels of TFF1 expression. In addition, there was no significant
correlation between any other single gene expression and lung or
brain metastasis among the 22 genes tested (P>0.5, data not
shown).
Association of estrogen receptor β (ERβ)
expression with treatment response
ERβ expression and its potential role as a predictor
of hormonal treatment response in breast cancer has been well
established based on studies of primary breast cancer tissues
(12–14). To assess the involvement of ERβ
expression in CTCs, 73 patients were analyzed. One sample
exhibiting no disease progression was excluded during data analysis
due to the lack of available information on hormonal treatment
(Table IVA). The ERβ expression
was found to be correlated with disease progression following
hormonal treatment. A total of 51 of the remaining 72 patients
(70%) had undetectable ERβ gene expression levels in CTCs after 40
cycles of PCR (Table IVA). In this
group of patients, there was no significant difference in disease
progression between the patients with and those without hormonal
treatment. By contrast, 21 of the 72 patients (29%) exhibited ERβ
expression (Ct<35) in CTCs (Table
IVB). In this group, the patients with high ERβ expression in
CTCs exhibited significantly improved outcomes with hormonal
treatment (P=0.02). In this group, 9 of 10 patients (90%) did not
exhibit disease progression following hormonal treatment. However,
4 of 11 patients (36%) that received hormonal treatment did not
have progression and 7 of 11 patients (64%) that did not receive
the treatment had disease progression. Furthermore, there was no
correlation between the expression of ERβ and the CTC count.
| Table IV.Contingency table of baseline
hormonal treatment and disease progression. |
Table IV.
Contingency table of baseline
hormonal treatment and disease progression.
| A, Patients with no
detectable ERβ expression in CTCsb. |
|
| Hormonal
treatment | No
progressiona | Progression |
|
| Yes | 3 | 2 |
| No | 27 | 19 |
|
| B, Patients with
detectable ERβ expression in CTCs (Ct<34)c. |
|
| Yes | 9 | 1 |
| No | 4 | 7 |
Discussion
The detection of CTCs in the blood of cancer
patients has been shown to be a prognostic factor. In addition,
post-therapy changes in the CTC count are associated with disease
progression in patients with metastatic breast cancer (2,14,15).
qRT-PCR is a sensitive and specific method for the assessment of
gene expression and is commonly used in research and clinical
applications. In this study, CTC enrichment and specific gene
expression evaluation by qRT-PCR were used in combination (2,16,17).
We demonstrated that CTCs were detected in 61% of the study
population; among these, 66.7% had ≥5 CTCs and 33.3% had 1–4 CTCs
in the 7.5-ml blood samples. Moreover, we evaluated specific gene
expressions in CTCs and our results suggested that CTC-derived gene
expression markers may be used as specific indicators for the
research and treatment of breast cancer.
The genes selected for this study were specific to
breast epithelial cells and their upregulation had been previously
associated with breast cancer tumorigenesis (3,18).
The detection of several markers in the isolated CTCs confirmed
that the CTCs originated from the breast and revealed that the
majority of the CTCs maintained the properties of breast cancer
cells. Previous studies by Ignatiadis et al (19) and Xenidis et al (20) reported that the presence of KRT19
mRNA-positive CTCs prior to the initiation of adjuvant therapy was
associated with a shortened disease-free survival and that the
presence of KRT19 mRNA-positive CTCs was associated with early
clinical relapse and disease-related mortality in 167 node-negative
breast cancer patients. In our study, ∼50% of the patients
exhibited KRT19 overexpression. Therefore, similar to the CTC
count, the measurement of the KRT19 expression level in CTCs may be
used to predict disease progression. However, the significance of
this association has not been fully elucidated.
It has been documented that breast cancer spreads to
distant organs, particularly regional lymph nodes, bone, liver,
lung and brain (1). TFF1 has been
shown to be associated with breast cancer bone metastases. In this
study, we demonstrated that 43.3% of the patients with bone
metastasis had a high expression level of TFF1 in the CTCs, with
only 5% of the patients with metastases in sites other than bone
exhibiting detectable TFF1 expression in the CTCs. Furthermore, the
strong correlation between the TFF1 expression in CTCs and bone
metastasis appears to be independent of the CTC count.
Various observations have been made on the
relationship between ERβ expression and response to endocrine
therapy. Lee et al (13)
reported that the increased expression of ERβ is associated with
increased likelihood of response to endocrine therapy. Hartman
et al (14) reported that
overexpression of ERβ mRNA was observed in the tumors of breast
cancer patients who relapsed while receiving adjuvant hormone
treatment. A positive correlation was also reported between the
expression of ERβ and epidermal growth factor receprtor, frequently
associated with endocrine insensitivity (21). The contradictory results may be
attributed to the differences in the patient characteristics
between the different study cohorts. In our study, 31% of the
patients exhibited ERβ overexpression, which was significantly
associated with endocrine sensitivity. In addition, there was no
significant correlation between the expression of ERβ and that of
other markers, including ERα. Further investigations are required
to determine whether ERβ is of clinical value in the prediction of
the response to hormone therapy and disease progression.
We also observed that BST1, a leukocyte-specific
marker, was expressed in the majority of the HBD and the metastatic
breast cancer patient samples. This result was consistent with the
detection of leukocytes in the CTC-enriched populations, which may
affect the analytical sensitivity of CTC-specific genes and
represent a challenge regarding the detection of genes that are not
specifically expressed in CTCs, although they may be of important
diagnostic or therapeutic value. Further improvements on the CTC
technology or development of additional negative selection methods
for the reduction of leukocytes are required for CTC molecular
characterization.
In summary, clinical oncology is challenged by the
lack of predictive models for therapy selection and response to
treatment that are simple, non-invasive and cost-effective. CTC
technologies may represent a promising tool that enables
enumeration and molecular characterization of metastatic cancer
cells and estimate the prognosis and therapeutic response of cancer
patients. Ongoing investigations continue to accumulate knowledge
on the molecular and cellular processes implicated in the clinical
behavior of cancer. Although in need of further validation, the
findings of the present study may benefit patients through the
earlier detection of organ-specific metastasis and the design of
personalized treatment strategies, leading to improved patient
management and outcomes.
References
|
1.
|
Weigelt B, Peterse JL and van ‘t Veer LJ:
Breast cancer metastasis: markers and models. Nat Rev Cancer.
5:591–602. 2005. View
Article : Google Scholar : PubMed/NCBI
|
|
2.
|
Cristofanilli M, Budd GT, Ellis MJ,
Stopeck A, Matera J, Miller MC, Reuben JM, Doyle GV, Allard WJ,
Terstappen LW and Hayes DF: Circulating tumor cells, disease
progression, and survival in metastatic breast cancer. N Engl J
Med. 351:781–791. 2004. View Article : Google Scholar : PubMed/NCBI
|
|
3.
|
Smirnov DA, Zweitzig DR, Foulk BW, Miller
MC, Doyle GV, Pienta KJ, Meropol NJ, Weiner LM, Cohen SJ, Moreno
JG, Connelly MC, Terstappen LW and O’Hara SM: Global gene
expression profiling of circulating tumor cells. Cancer Res.
65:4993–4997. 2005. View Article : Google Scholar : PubMed/NCBI
|
|
4.
|
Cristofanilli M, Hayes DF, Budd GT, Ellis
MJ, Stopeck A, Reuben JM, Doyle GV, Matera J, Allard WJ, Miller MC,
Fritsche HA, Hortobagyi GN and Terstappen LW: Circulating tumor
cells: a novel prognostic factor for newly diagnosed metastatic
breast cancer. J Clin Oncol. 23:1420–1430. 2005. View Article : Google Scholar
|
|
5.
|
Sieuwerts AM, Mostert B, Bolt-de Vries J,
et al: mRNA and microRNA expression profiles in circulating tumor
cells and primary tumors of metastatic breast cancer patients. Clin
Cancer Res. 17:3600–3618. 2011. View Article : Google Scholar : PubMed/NCBI
|
|
6.
|
Smid M, Wang Y, Klijn JG, Sieuwerts AM,
Zhang Y, Atkins D, Martens JW and Foekens JA: Genes associated with
breast cancer metastatic to bone. J Clin Oncol. 24:2261–2267. 2006.
View Article : Google Scholar : PubMed/NCBI
|
|
7.
|
Kang Y, Siegel PM, Shu W, Drobnjak M,
Kakonen SM, Cordón-Cardo C, Guise TA and Massagué J: A multigenic
program mediating breast cancer metastasis to bone. Cancer Cell.
3:537–549. 2003. View Article : Google Scholar : PubMed/NCBI
|
|
8.
|
Minn AJ, Gupta GP, Siegel PM, Bos PD, Shu
W, Giri DD, Viale A, Olshen AB, Gerald WL and Massagué J: Genes
that mediate breast cancer metastasis to lung. Nature. 436:518–524.
2005. View Article : Google Scholar : PubMed/NCBI
|
|
9.
|
Bos PD, Zhang XH, Nadal C, Shu W, Gomis
RR, Nguyen DX, Minn AJ, van de Vijver MJ, Gerald WL, Foekens JA and
Massagué J: Genes that mediate breast cancer metastasis to the
brain. Nature. 459:1005–1009. 2009. View Article : Google Scholar : PubMed/NCBI
|
|
10.
|
Saloustros E, Perraki M, Apostolaki S,
Kallergi G, Xyrafas A, Kalbakis K, Agelaki S, Kalykaki A,
Georgoulias V and Mavroudis D: Cytokeratin-19 mRNA-positive
circulating tumor cells during follow-up of patients with operable
breast cancer: prognostic relevance for late relapse. Breast Cancer
Research. 13:R602011. View
Article : Google Scholar
|
|
11.
|
Reinholz MM, Nibbe A, Jonart LM, Kitzmann
K, Suman VJ, Ingle JN, Houghton R, Zehentner B, Roche PC and Lingle
WL: Evaluation of a panel of tumor markers for molecular detection
of circulating cancer cells in women with suspected breast cancer.
Clin Cancer Res. 11:3722–3732. 2005. View Article : Google Scholar : PubMed/NCBI
|
|
12.
|
Speirs V: Oestrogen receptor beta in
breast cancer: good, bad or still too early to tell? J Pathol.
197:143–147. 2002. View Article : Google Scholar : PubMed/NCBI
|
|
13.
|
Lee GS, Choi KC, Kim HJ and Jeung EB:
Effect of genistein as a selective estrogen receptor beta agonist
on the expression of calbindin-D9k in the uterus of immature rats.
Toxicological Sci. 82:451–457. 2004. View Article : Google Scholar : PubMed/NCBI
|
|
14.
|
Hartman J, Ström A and Gustafsson JA:
Estrogen receptor beta in breast cancer - diagnostic and
therapeutic implications. Steroids. 74:635–641. 2009. View Article : Google Scholar : PubMed/NCBI
|
|
15.
|
Hayes DF, Cristofanilli M, Budd GT, Ellis
MJ, Stopeck A, Miller MC, Matera J, Allard WJ, Doyle GV and
Terstappen LW: Circulating tumor cells at each follow-up time point
during therapy of metastatic breast cancer patients predict
progression-free and overall survival. Clin Cancer Res.
12:4218–4224. 2006. View Article : Google Scholar
|
|
16.
|
O’Hara SM, Moreno JG, Zweitzig DR, Gross
S, Gomella LG and Terstappen LW: Multigene reverse
transcription-PCR profiling of circulating tumor cells in
hormone-refractory prostate cancer. Clin Chem. 50:826–835.
2004.PubMed/NCBI
|
|
17.
|
Ring AE, Zabaglo L, Ormerod MG, Smith IE
and Dowsett M: Detection of circulating epithelial cells in the
blood of patients with breast cancer: comparison of three
techniques. Br J Cancer. 92:906–912. 2005. View Article : Google Scholar : PubMed/NCBI
|
|
18.
|
Ghadersohi A and Sood AK: Prostate
epithelium-derived Ets transcription factor mRNA is overexpressed
in human breast tumors and is a candidate breast tumor marker and a
breast tumor antigen. Clin Cancer Res. 7:2731–2738. 2001.
|
|
19.
|
Ignatiadis M, Kallergi G, Ntoulia M,
Perraki M, Apostolaki S, Kafousi M, Chlouverakis G, Stathopoulos E,
Lianidou E, Georgoulias V and Mavroudis D: Prognostic value of the
molecular detection of circulating tumor cells using a multi-marker
reverse transcription-PCR assay for cytokeratin 19, mammaglobin A,
and HER2 in early breast cancer. Clin Cancer Res. 14:2593–2600.
2008. View Article : Google Scholar
|
|
20.
|
Xenidis N, Ignatiadis M, Apostolaki S,
Perraki M, Kalbakis K, Agelaki S, Stathopoulos EN, Chlouverakis G,
Lianidou E, Kakolyris S, Georgoulias V and Mavroudis D:
Cytokeratin-19 mRNA-positive circulating tumor cells after adjuvant
chemotherapy in patients with early breast cancer. J Clin Oncol.
27:2177–2184. 2009. View Article : Google Scholar : PubMed/NCBI
|
|
21.
|
Knowlden JM, Gee JM, Robertson JF, Ellis
IO and Nicholson RI: A possible divergent role for the oestrogen
receptor alpha and beta subtypes in clinical breast cancer. Int J
Cancer. 89:209–212. 2000. View Article : Google Scholar : PubMed/NCBI
|