Introduction
The standard treatment for unresectable gastric
cancer is combination chemotherapy using fluoropyrimidine and
platinum agents (1–3). The fluoropyrimidine agents
fluorouracil, capecitabine and tegafur/gimeracil/oteracil (S-1),
and the platinum agents cisplatin and oxaliplatin, are used in the
treatment of gastric cancer. Although chemotherapeutic regimens are
selected based on the results of clinical trials, the effectiveness
of treatment regimens varies among patients. In cancer cells, drug
resistance to chemotherapeutic agents is an important problem that
results in ineffective treatment. For some molecular-targeted
agents, there are useful predictive markers, such as epidermal
growth factor receptor (EGFR) mutation, RAS mutation and HER2
amplification. However, for the majority of cytotoxic drugs, few
biomarkers are available that are able to predict the sensitivity
and resistance of the cancer cells to chemotherapeutic agents.
Although the acquisition of drug resistance is associated with
alterations in the functions of molecules and signaling pathways
(4), the mechanisms underlying
resistance have yet to be fully elucidated.
Malignant ascites due to the peritoneal
dissemination of advanced cancer, including gastric cancer, causes
distressing symptoms, including abdominal fullness and appetite
loss. When chemotherapy is effective, the volume of malignant
ascites is decreased, causing symptoms to improve. Although
diuretics are used to relieve certain of the symptoms, their
effects are often insufficient, and they can cause adverse effects,
including dehydration and electrolyte abnormalities. Paracentesis
is also performed to decrease abdominal fullness, although repeated
procedures are often necessary since its effects are not
long-lasting (5). The drained
ascites contain malignant cells mixed with normal cells, including
blood and mesothelial cells. In the present study, malignant cells
were extracted from malignant ascites, and the biological features
of these cells were analyzed with the expectation that important
information concerning drug resistance would be revealed.
Gene alterations observed following the acquisition
of drug resistance could be associated with the mechanisms
underlying drug resistance; therefore, improving our understanding
of these alterations may provide us with biomarkers that could be
used to ensure selection of appropriate treatments. In the present
study, early passage cells, that were passaged only a few times,
were used. The cells were derived from malignant ascites collected
from a patient with gastric cancer. Alterations in the gene
expression and DNA methylation profiles of cancer cells obtained
from the ascites were analyzed, which was repeatedly collected
during the clinical course of chemotherapy.
Materials and methods
Patient
A 56-year-old man was diagnosed with gastric cancer
with peritoneal dissemination, who underwent chemotherapy with
capecitabine and oxaliplatin [CapeOX; specifically, capecitabine
(2,000 mg/m2/day) was administered on days 1–14, and
oxaliplatin (130 mg/m2) was given on day 1 every 3
weeks]. After two cycles of CapeOX, computed tomography revealed
that the para-aortic lymph nodes were reduced in size; therefore,
CapeOX treatment was judged to have been effective. However, after
three courses of CapeOX, the ascites had become uncontrollable, and
the disease was judged to be refractory to CapeOX. Since the
patient had abdominal distention with massive ascites, repeated
paracentesis was necessary to relieve his symptoms.
Ethics approval and consent to
participate
The present study was conducted in accordance with
the principles of the Declaration of Helsinki and all local
regulations. Written informed consent was obtained from the
patients. The study protocol was approved by the institutional
ethics committee of Nagoya University Hospital.
Culture of ascitic fluid cells and
cell lines
Ascitic fluid was drained, and cells were collected
prior to CapeOX initiation, immediately before the third cycle of
CapeOX, and after completion of the third cycle of CapeOX. Aliquots
of ascitic fluid (40 ml) were centrifuged at 190 × g for 10 min at
4°C, and the resulting cell pellets were resuspended in RPMI-1640
(Thermo Fisher Scientific, Inc.) supplemented with 10% fetal bovine
serum (Equitech-Bio) and 1X antibiotic-antimycotic (Thermo Fisher
Scientific, Inc.) at 37°C. The cells were subsequently plated in
75-cm2 culture flasks and incubated in a humidified
incubator containing 5% CO2 for 10 days. The culture
medium was exchanged twice a week. Subconfluent cells were
subsequently passaged to new flasks at a 1:4 ratio, and cultured
for an additional 2 weeks. It was assumed that a small percentage
of normal cells, including mesothelial cells and white blood cells,
would be able to survive under culture conditions that are not
optimized for non-cancerous cells. However, the morphology of the
cultured cells was checked to confirm that the majority of the
cultured cells were cancer cells.
AGS gastric cancer cells were purchased from the
American Type Tissue Culture Collection (ATCC). In experiments
involving treatment with the demethylating agent, decitabine (also
known as 5-aza-dC), cells were seeded on day 0 and subsequently
exposed to freshly prepared 10 µmol/l 5-aza-dC (Sigma-Aldrich;
Merck KGaA) for 24 h on days 1 and 3. After each treatment, the
cells were placed in fresh medium, and cells were harvested on day
4.
Drug-resistant AGS cells
Oxaliplatin-resistant AGS cells were generated by
continuously exposing AGC cells to increasing concentrations of
oxaliplatin for 5 months. Cell viability was measured by analyzing
MTS-formazan reduction using a CellTiter 96® AQueous One
Solution Cell Proliferation assay (Promega Corporation). AGS cells
(2×10³) were cultured at 37°C in 96-well microplates for
24 h, and subsequently exposed to various concentrations of
oxaliplatin for 48 h to calculate the IC50 of
oxaliplatin (i.e., the concentration required to give half-maximal
inhibition). Cells with 5-fluorouracil resistance were previously
established, as reported elsewhere (4).
Extraction of DNA and RNA from
cultured cells
Cultured cells were grown to subconfluence,
collected and stored at −80°C for DNA extraction;
Ambion® RNAlater tissue storage reagent (Thermo Fisher
Scientific, Inc.) was used to store the cells in advance of RNA
extraction. To extract DNA and RNA, DNA Mini kits and RNA Mini kits
(both from Qiagen) were used, respectively.
Gene expression analysis using a
microarray
Expression analysis was performed using a SurePrint
G3 Human GE 8×60K microarray (Agilent Technologies, Inc.). A
>2-fold difference in signal intensity was judged to be
significant (4). The expression
level in cells before treatment with anticancer drugs was set
arbitrarily to one, in order that the relative expression levels in
cells after treatment could be calculated.
DNA methylation microarray
Bisulfite-converted DNA was used for hybridization
on an Infinium HumanMethylation450 BeadChip (Illumina, Inc.). The
β-value [calculated as follows: intensity of the methylated allele
(M)/(intensity of the unmethylated allele (U) + intensity of the
methylated allele (M) + 100)] was calculated for each CpG site.
Genes exhibiting a difference in β-values >0.1 were
extracted.
Pathway analysis
Pathway analysis was performed using TargetMine
(http://targetmine.mizuguchilab.org/targetmine/begin.do;
National Institute of Biomedical Innovation). Pathways with
P<0.05, according to the Benjamini-Hochberg method (6), were judged to be significantly
enriched.
Reverse transcription-quantitative
polymerase chain reaction (RT-qPCR)
cDNA was generated from 8 µg RNA using
SuperScript® III Reverse Transcriptase (Thermo Fisher
Scientific, Inc.). To validate the mRNA expression profiles of
genes of interest, RT-qPCR was performed using Applied
Biosystems® TaqMan™ Gene Expression assays and TaqMan™
Gene Expression Master mix (Thermo Fisher Scientific, Inc.). The
assay IDs of the genes defensin β4A (DEFB4A), protocadherin-20
(PCDH20), and GAPDH were Hs00823638_m1, Hs00276707_m1 and
Hs02758991_g1, respectively. GAPDH expression was used as the
reference, and a serial dilution of cDNA from non-cancerous tissue
(qPCR Human Reference cDNA; Takara Bio, Inc.) was set up for the
purposes of normalization. The thermal cycler program conditions
consisted of an initial step at 50°C for 2 min, a denaturation step
at 95°C for 10 min, and 40 amplification cycles comprising
denaturation at 95°C for 15 sec and annealing and extension at 60°C
for 1 min. The expression level in cells before treatment with
anticancer drugs was set to one, in order that the relative
expression levels in cells after treatment could be calculated.
Statistical analysis
A one-way analysis of variance and a Games-Howell
post hoc test were used to compare the levels of gene expression
obtained by RT-qPCR. P<0.05 was considered to indicate a
statistically significant difference.
Results
Early passage gastric cancer cells
from ascitic fluid
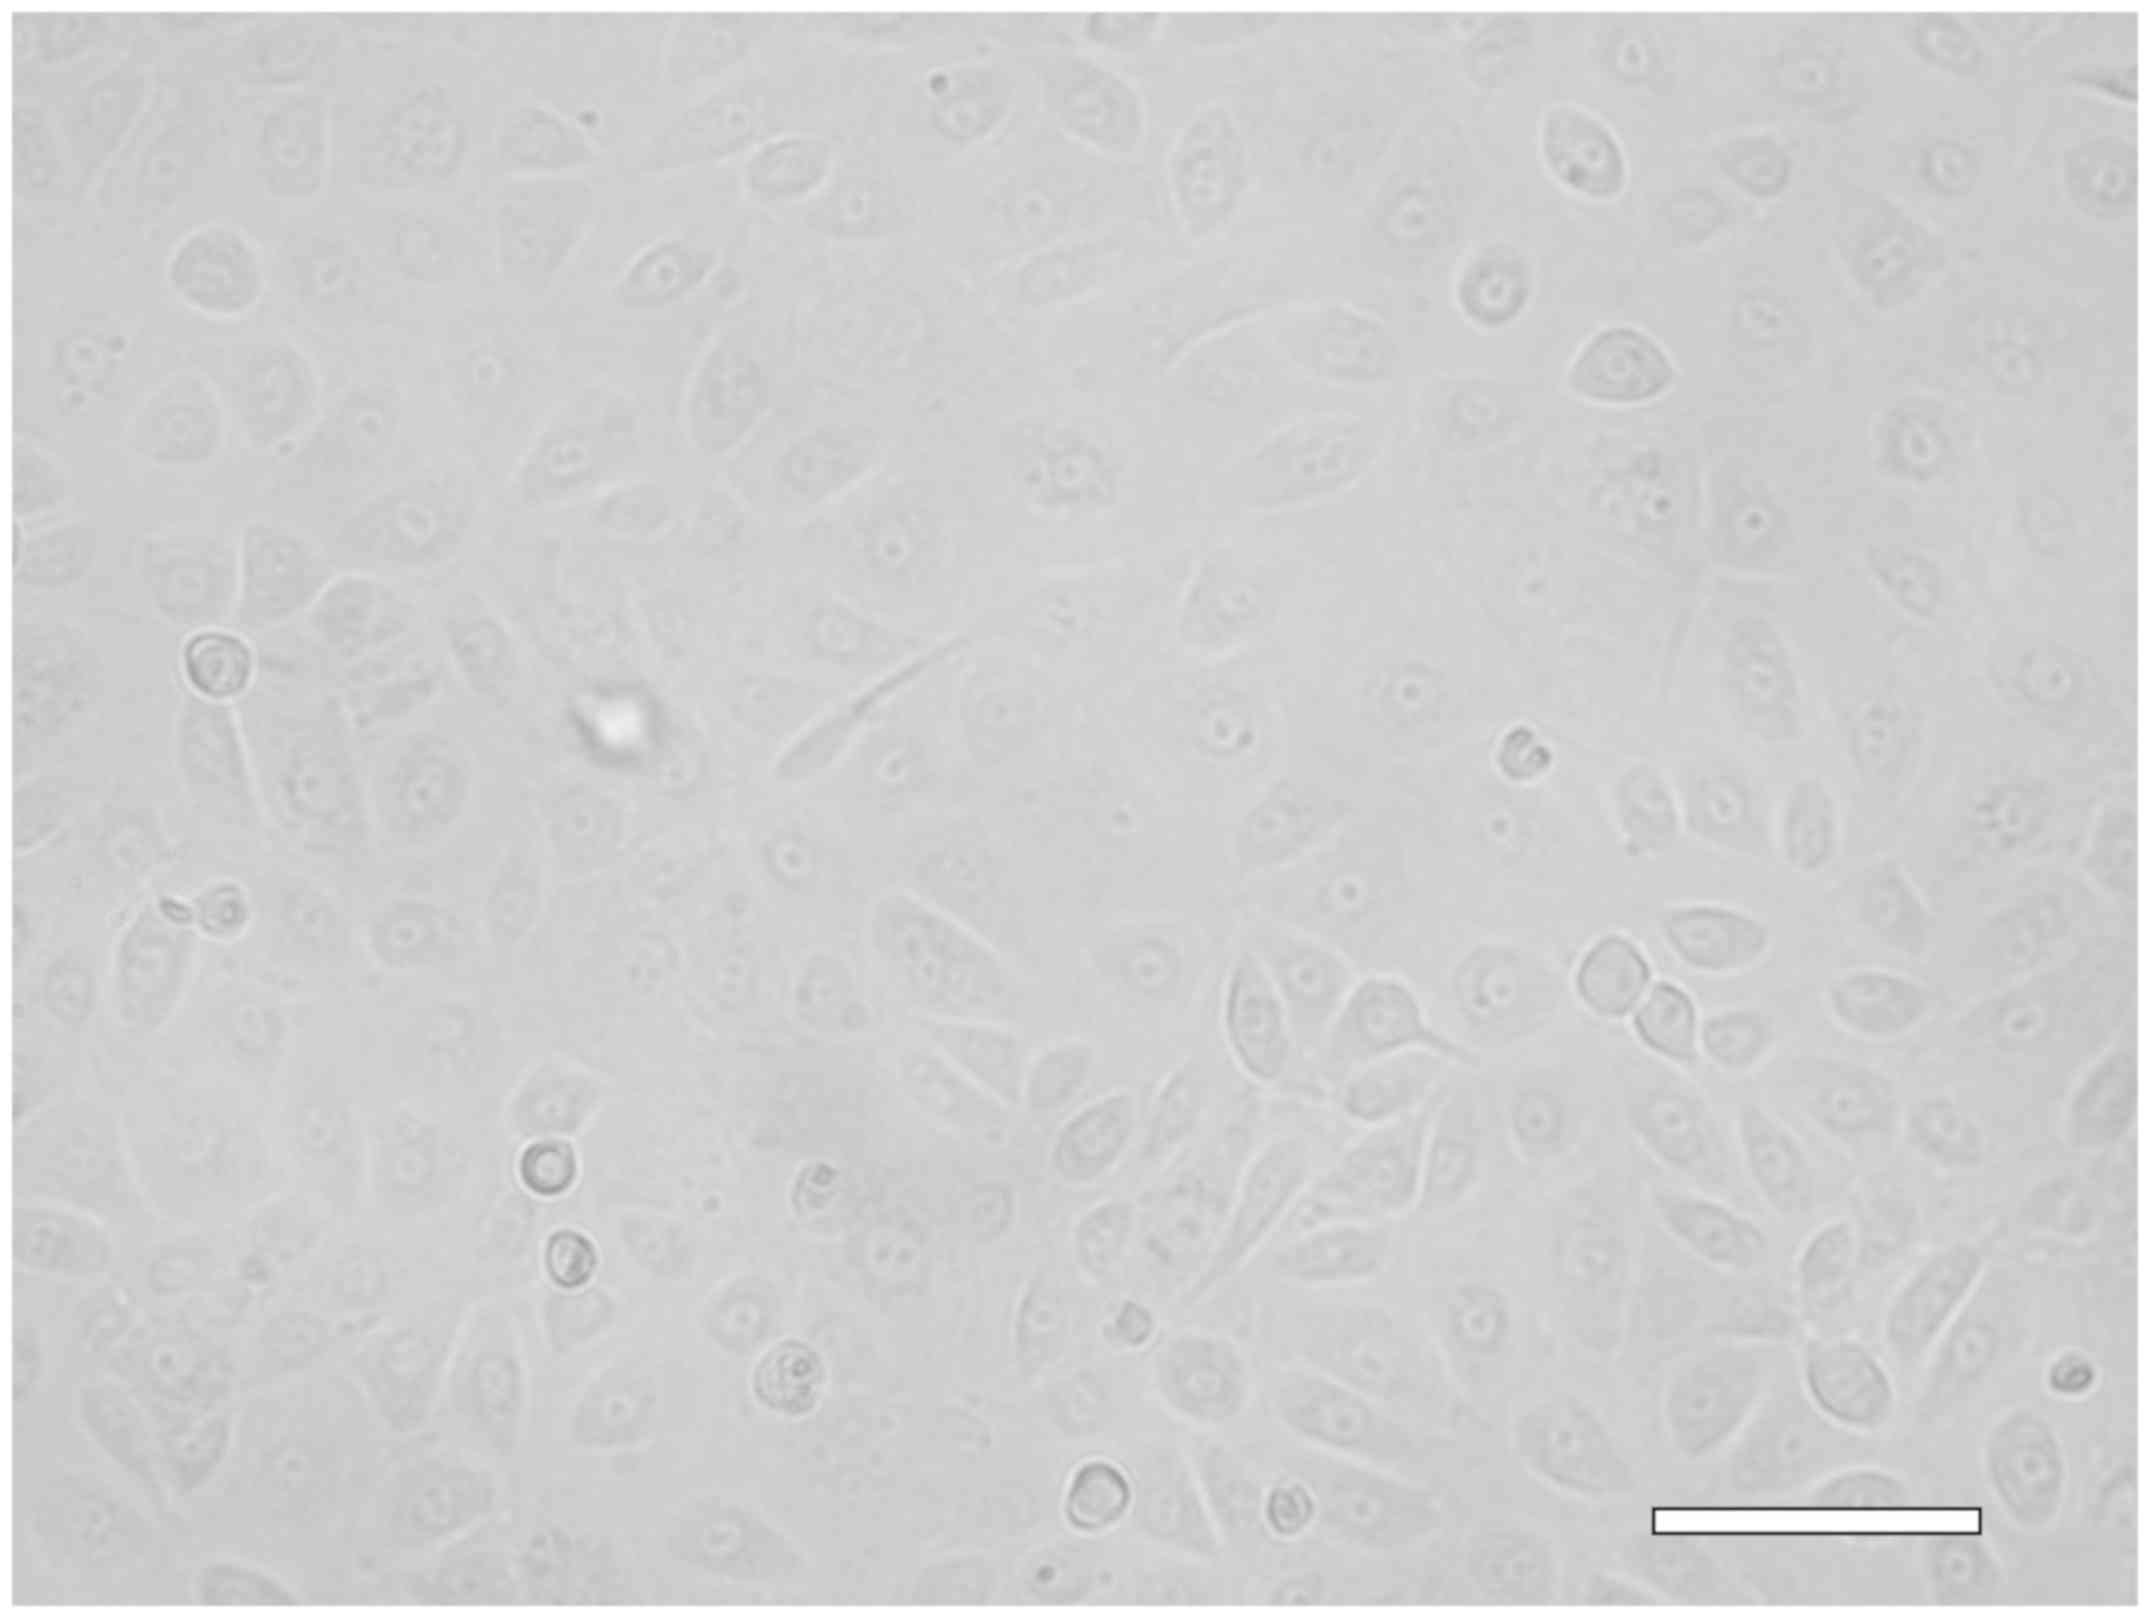
Ascitic fluids from gastric cancer were cultured for
10 days, passaged to new flasks, and cultured for an additional 2
weeks. The morphology of cells isolated from ascitic fluids was
assessed (Fig. 1), and it was
determined that atypical cells had been derived from the gastric
cancer cells.
Alterations in the gene expression and
DNA methylation profiles of cancer cells in ascitic fluids
collected before and after chemotherapy
Cells collected before and after three courses of
CapeOX treatment were used to analyze the expression and DNA
methylation profiles of 18,185 genes. The expression profiles of
530 of those genes revealed that they were expressed at lower
levels after, rather than before, CapeOX, whereas the DNA
methylation profiles of 25 genes showed that they were expressed at
higher levels after, rather than before, CapeOX (Table SI). Of the 530 genes shown to have a
lower level of expression after CapeOX treatment, a pathway
analysis revealed that 32 were associated with ‘signaling by
G-protein-coupled receptor (GPCR)’, 15 were associated with
‘peptide ligand-binding receptors’, and 48 were associated with
‘GPCR downstream signaling’ (Tables
I and SII). Additionally, of
those 530 genes, four [nephrin (NPHS1), FXYD domain containing ion
transport regulator 1 (FXYD1), WNT1-inducible-signaling pathway
protein 1 (WISP1) and flavin-containing monooxygenase 1 (FMO1)]
exhibited increased DNA methylation profiles.
 | Table I.Pathways associated with genes
expressed at lower levels after CapeOX treatment. |
Table I.
Pathways associated with genes
expressed at lower levels after CapeOX treatment.
| Pathway | P-value | No. of genes |
|---|
| GPCR ligand
binding | 0.0001 | 32 |
| Class A/1 (rhodopsin
like receptors) | 0.0037 | 23 |
| Signaling by
GPCRs | 0.0077 | 52 |
| Peptide ligand
binding receptors | 0.0190 | 15 |
| GPCR downstream
signaling | 0.0190 | 48 |
| Neuroactive ligand
receptor interaction | 0.0190 | 19 |
| NGF independent TRKA
activation | 0.0463 | 3 |
On the other hand, the expression profiles of 703
genes revealed that they were expressed at higher levels after
CapeOX, and the DNA methylation profiles of four genes showed they
were expressed at lower levels after CapeOX (Table SI). Of those 703 genes, a pathway
analysis revealed that 134 were associated with the ‘immune
system’, and 52 were associated with ‘neutrophil degranulation’
(Tables II and SIII). In addition, no genes simultaneously
showed an increase in expression and a decrease in DNA methylation
among the cells collected before and after CapeOX treatment.
| Table II.Pathways associated with genes
expressed at higher levels after CapeOX treatment. |
Table II.
Pathways associated with genes
expressed at higher levels after CapeOX treatment.
| Pathway | P-value | No. of genes |
|---|
| Immune system |
1.63E−8 | 134 |
| Neutrophil
degranulation |
1.63E−8 | 52 |
| Staphylococcus
aureus infection |
1.63E−8 | 17 |
| Innate immune
system |
1.67E−7 | 83 |
| Osteoclast
differentiation |
3.42E−7 | 23 |
| Signaling by
GPCRs |
5.50E−7 | 88 |
| Immunoregulatory
interactions between lymphoid and non lymphoid cells |
1.01E−6 | 22 |
| GPCR downstream
signaling |
8.76E−6 | 81 |
| Gα (i) signaling
events |
9.29E−6 | 40 |
| Chemokine signaling
pathway |
1.25E−5 | 25 |
| Rheumatoid
arthritis |
1.25E−5 | 17 |
| Interleukin-10
signaling |
5.47E−5 | 12 |
| Phagosome |
8.19E−5 | 21 |
| Leishmaniasis |
1.45E−4 | 14 |
| CXCR4 mediated
signaling events |
2.38E−4 | 16 |
| Extracellular matrix
organization |
2.42E−4 | 30 |
| Tuberculosis |
2.54E−4 | 22 |
| Cytokine cytokine
receptor interaction |
3.08E−4 | 28 |
| Inflammatory bowel
disease |
8.56E−4 | 12 |
| Toxoplasmosis |
9.22E−4 | 16 |
| Chagas disease
(American trypanosomiasis) |
1.06E−3 | 15 |
| Class A/1
(Rhodopsin like receptors) |
1.10E−3 | 30 |
| Complement and
coagulation cascades |
1.10E−3 | 13 |
| Peptide ligand
binding receptors |
1.42E−3 | 21 |
| Intestinal immune
network for IgA production |
1.42E−3 | 10 |
| Malaria |
1.42E−3 | 10 |
| Viral
myocarditis |
1.42E−3 | 11 |
| Asthma |
1.60E−3 | 8 |
| GPCR ligand
binding |
1.68E−3 | 37 |
| Fc γ receptor
activation |
4.64E−3 | 5 |
| Other semaphorin
interactions |
4.82E−3 | 6 |
| Interleukin-8 and
CXCR1 mediated signaling events |
5.92E−3 | 7 |
| Platelet
activation |
6.40E−3 | 15 |
| Allograft
rejection |
6.42E−3 | 8 |
| Hematopoietic cell
lineage |
6.74E−3 | 13 |
| Cholinergic
synapse |
7.69E−3 | 14 |
| Formyl peptide
receptors that bind formyl peptides and other ligands |
9.54E−3 | 4 |
| Cortisol synthesis
and secretion |
9.62E−3 | 10 |
| Graft versus host
disease |
9.86E−3 | 8 |
| Binding and uptake
of ligands by scavenger receptors |
1.15E−2 | 8 |
| Glycoprotein VI
mediated activation cascade |
1.30E−2 | 9 |
| Type I diabetes
mellitus |
1.30E−2 | 8 |
| Regulation of TLR
by endogenous ligand |
1.57E−2 | 5 |
| Interleukin-4 and
−13 signaling |
1.57E−2 | 13 |
| Interleukin-8 and
CXCR2 mediated signaling events |
1.57E−2 | 7 |
| Oxytocin signaling
pathway |
1.66E−2 | 16 |
| Amoebiasis |
1.80E−2 | 12 |
| Cell adhesion
molecules |
2.73E−2 | 15 |
| Adaptive immune
system |
3.05E−2 | 47 |
| Scavenging by Class
A receptors |
3.26E−2 | 5 |
| Natural killer cell
mediated cytotoxicity |
3.29E−2 | 14 |
| Collagen
formation |
3.40E−2 | 11 |
| Dilated
cardiomyopathy |
3.40E−2 | 11 |
| Antigen processing
and presentation |
3.58E−2 | 10 |
| Signaling
pathways |
3.85E−2 | 130 |
| Interferon-γ
signaling |
3.88E−2 | 11 |
| Elastic fiber
formation |
4.08E−2 | 7 |
| Rho GTPase
cycle |
4.17E−2 | 14 |
| Integrin cell
surface interactions |
4.17E−2 | 9 |
| Classical antibody
mediated complement activation |
4.51E−2 | 3 |
Consistency of gene expression levels
between microarray and RT-qPCR analyses
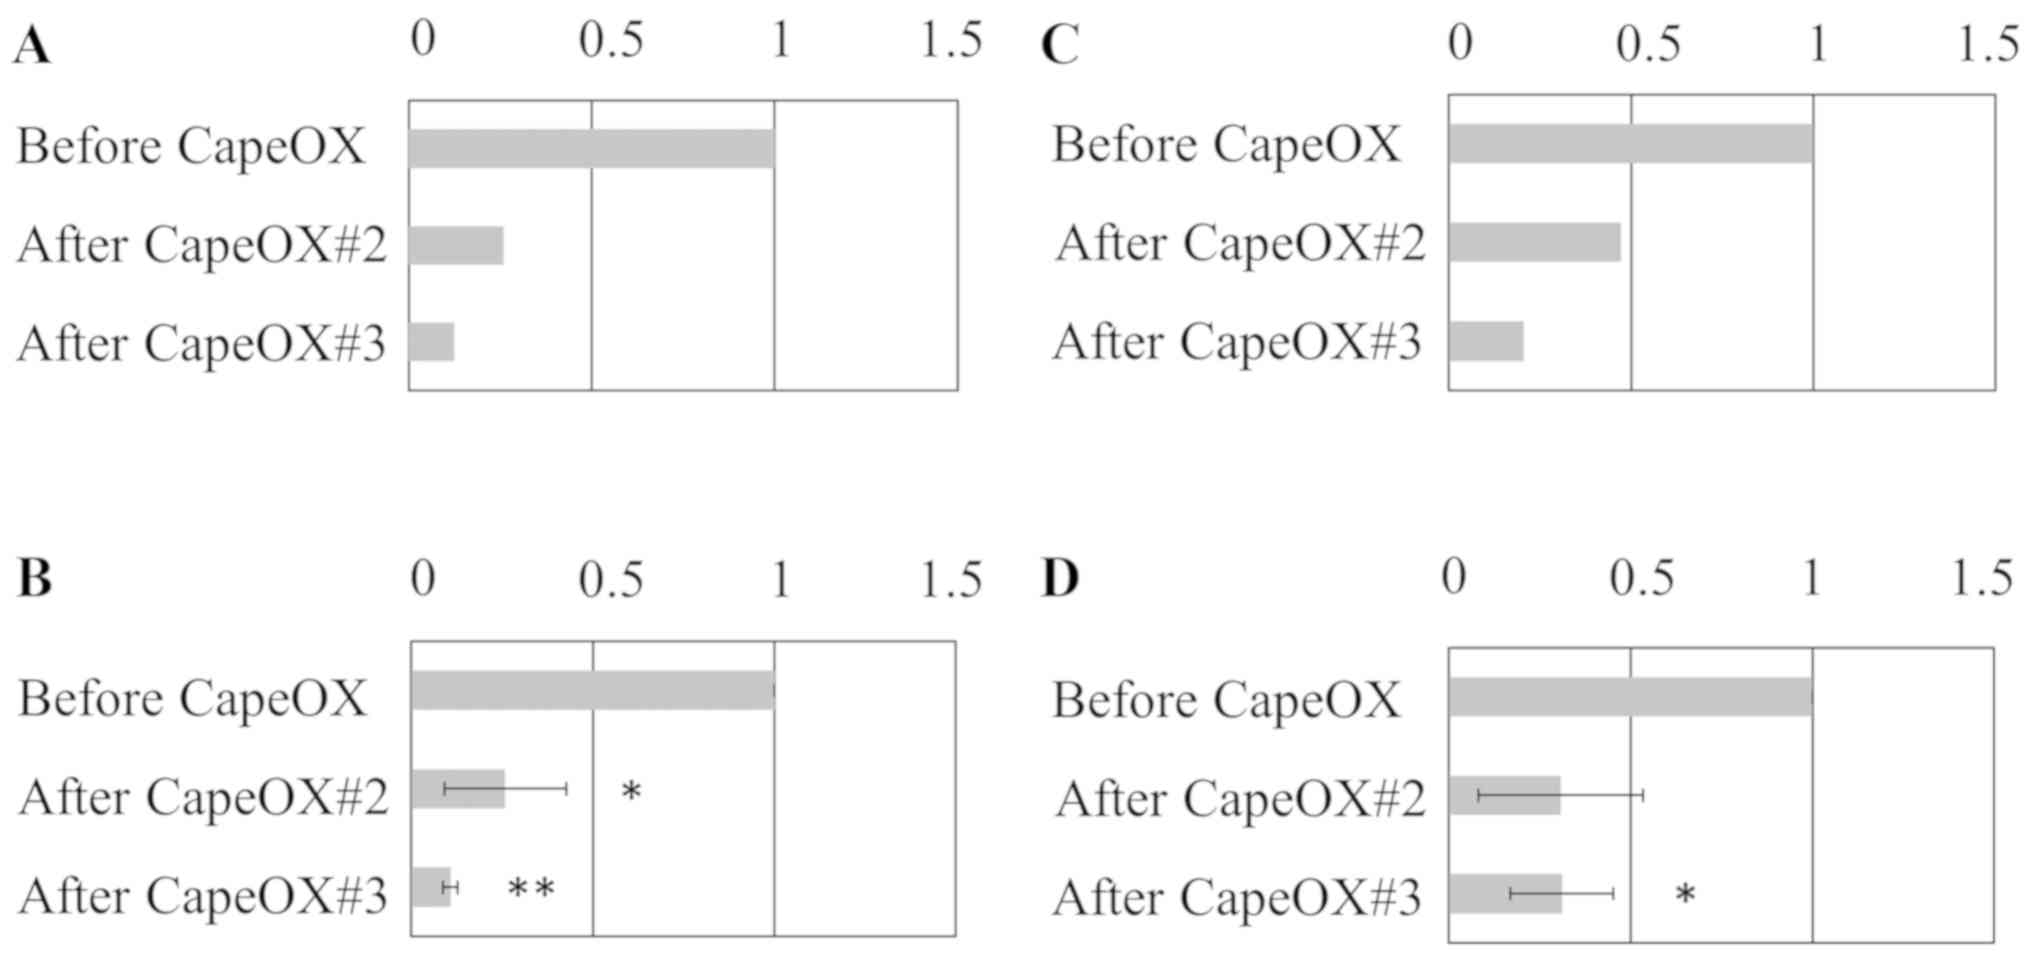
To validate the microarray-based results obtained
for gene expression levels, RT-qPCR for two genes, DEFB4A and
PCDH20, that were identified to be expressed at lower levels after,
rather than before, CapeOX was performed (Fig. 2). A high level of consistency was
noted between the results obtained using these two methods.
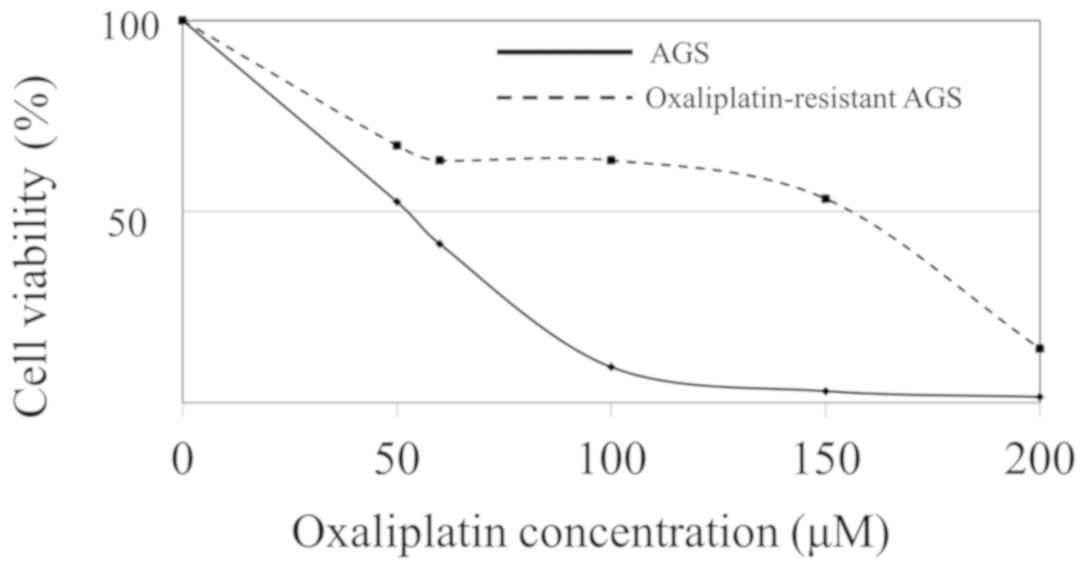
Establishment of oxaliplatin-resistant
AGS cells
Subsequently, three oxaliplatin-resistant cell lines
were established. To confirm that the gastric cancer cells cultured
in oxaliplatin had acquired drug resistance, IC50 values
were measured. The IC50 value for oxaliplatin was 52 µM
in parent AGS cells, whereas those of the three
oxaliplatin-resistant AGS cells were 154, 168 and 209 µM (Fig. 3).
Comparison of gene expression and DNA
methylation profiles between cells collected from ascites and
gastric cancer cell lines
The expression profiles of 18,185 genes were
analyzed by microarray and compared among ascitic fluid cells
collected before and after CapeOX treatment, drug-resistant AGS
cells, and decitabine-treated AGS cells. The expression profiles of
29 genes showed that their expression levels were higher, whereas
those of 368 genes revealed that their expression levels were
lower, in CapeOX-resistant cells and three oxaliplatin-resistant
cell lines compared with cells collected before CapeOX treatment
(Table SIV). The pathways
associated with these 397 genes with altered expression profiles in
CapeOX-resistant cells and oxaliplatin-resistant cells were
connected with interferon signaling (Tables III and SV).
| Table III.Pathways associated with genes that
showed common changes between CapeOX resistant and oxaliplatin
resistant cells. |
Table III.
Pathways associated with genes that
showed common changes between CapeOX resistant and oxaliplatin
resistant cells.
| Pathway | P-value | No. of genes |
|---|
| Interferon-α/β
signaling |
4.00E−7 | 14 |
| Interferon-γ
signaling |
1.49E−3 | 17 |
| Endosomal/vacuolar
pathway |
1.55E−3 | 5 |
| Interferon
signaling |
2.69E−3 | 11 |
| Human
papillomavirus infection |
2.71E−3 | 21 |
| Immune system |
8.03E−3 | 69 |
| Signaling by
GPCRs |
8.95E−3 | 47 |
| Cytokine signaling
in the immune system |
1.02E−2 | 32 |
| Olfactory signaling
pathway |
3.05E−2 | 21 |
| GPCR downstream
signaling |
3.05E−2 | 43 |
| Antigen
presentation: folding, assembly and peptide loading class I
MHC |
3.05E−2 | 5 |
| Allograft
rejection |
3.05E−2 | 6 |
| Gα (s)
signaling events |
4.33E−2 | 25 |
| Antigen processing
and presentation |
4.33E−2 | 8 |
The expression profiles of 107 genes showed that
they were expressed at higher levels, and 55 genes were expressed
at lower levels, in CapeOX-resistant cells and
fluorouracil-resistant AGS cells compared with the cells obtained
prior to CapeOX treatment (Table
SVI). Pathway analysis of these 162 genes, however, revealed
that no particular pathway was enriched.
The expression profiles of 23 genes showed that they
were expressed at higher levels in CapeOX-resistant ascitic cells,
fluorouracil-resistant AGS cells and oxaliplatin-resistant AGS
cells compared with cells obtained prior to CapeOX. These genes
included telomerase reverse transcriptase (TERT), apolipoprotein C1
(APOC1) and serine/threonine/tyrosine kinase 1 (STYK1). On the
other hand, 18 genes, including DEFB4A, were expressed at higher
levels in the pre-CapeOX cells (Table
IV).
| Table IV.Genes with commonly altered
expression levels in CapeOX resistant ascitic cells, fluorouracil
resistant AGS cells and oxaliplatin resistant AGS cells. |
Table IV.
Genes with commonly altered
expression levels in CapeOX resistant ascitic cells, fluorouracil
resistant AGS cells and oxaliplatin resistant AGS cells.
| Commonly
increased | Commonly
decreased |
|---|
| ABCA12 | ANXA13 |
| APOBEC4 | CASQ1 |
| APOC1 | DEFB4A |
| ARHGDIB | ELANE |
| C19orf77 | FAIM3 |
| EPN3 | FBLN7 |
| FAM105A | HSD3B2 |
| FGD3 | IL10 |
| FGFBP1 | MYH6 |
| FOLR3 | OR1L3 |
| HLA DMA | OR7A17 |
| IFI30 | PLA2G4D |
| IGF2BP3 | PLA2G7 |
| IRF8 | S100A7A |
| LILRA4 | SLC34A2 |
| MFSD2A | SNORA22 |
| MGAT3 | TLR9 |
| NPPB | TMC5 |
| SLCO2B1 |
|
| STXBP6 |
|
| STYK1 |
|
| TERT |
|
| VTN |
|
The number of genes for which methylation levels
were different between drug-resistant AGS cells and parent AGS
cells was analyzed. We found that, in fluorouracil-resistant AGS
cells and oxaliplatin-resistant AGS cells, 1,483 and 1,579 genes,
respectively, were hypermethylated, whereas 525 and 350 genes,
respectively, were hypomethylated (Tables V and SVII). In contrast, only 25 and 4 genes
were hyper- and hypomethylated, respectively, in cells obtained
after CapeOX treatment compared with their methylation status in
cells obtained prior to CapeOX. Out of the 25 genes that were
hypermethylated in ascites cells collected after CapeOX, three
genes [amyloid-β precursor protein binding family B member 2
(APBB2), prostate androgen-regulated transcript 1 (PART1), and
complement C1q subcomponent subunit A (C1QA)] were hypermethylated
in fluorouracil-resistant AGS cells, and three other genes
[serine/threonine-protein kinase 38-like (STK38L),
kallikrein-related peptidase 11 (KLK11), and mesothelin (MSLN)]
were hypermethylated in oxaliplatin-resistant AGS cells. In
addition, PDCD1LG2 was hypomethylated in ascitic cells obtained
after CapeOX and fluorouracil-resistant AGS cells.
| Table V.Genes with altered methylation levels
comparing between ascetic fluid cancer cells collected before and
after CapeOX treatment. |
Table V.
Genes with altered methylation levels
comparing between ascetic fluid cancer cells collected before and
after CapeOX treatment.
| Gene | Increase in
methylation levels after CapeOX | Gene | Decrease in
methylation levels after CapeOX |
|---|
| FAM193A | 0.228 | PI3 | 0.400 |
| FMO1 | 0.165 | PDCD1LG2 | 0.258 |
| GPR75 | 0.142 | IFI44L | 0.160 |
| NPHS1 | 0.140 | SFTA1P | 0.106 |
| SEMA3B | 0.139 |
|
|
| ANGPTL7 | 0.139 |
|
|
| YPEL3 | 0.136 |
|
|
| WISP1 | 0.126 |
|
|
| STK38L | 0.126 |
|
|
| ARHGEF25 | 0.118 |
|
|
| SLC44A2 | 0.117 |
|
|
| MAB21L2 | 0.114 |
|
|
| OR10J1 | 0.111 |
|
|
| KLK11 | 0.110 |
|
|
| FXYD1 | 0.108 |
|
|
| GPR110 | 0.106 |
|
|
| APBB2 | 0.106 |
|
|
| AREG | 0.106 |
|
|
| ELF3 | 0.105 |
|
|
| PART1 | 0.105 |
|
|
| LOC285419 | 0.102 |
|
|
| MSLN | 0.102 |
|
|
| ECEL1P2 | 0.102 |
|
|
| C1QA | 0.101 |
|
|
| PYGM | 0.100 |
|
|
Genes with increased expression levels
in AGS cells after decitabine treatment
Out of 18,185 analyzed genes, 1,902 genes were
expressed at >2-fold higher levels in AGS cells treated with a
demethylating agent, decitabine. Among these genes, 61 exhibited
lower methylation levels, and 35 (57%) were expressed at higher
levels in fluorouracil-resistant AGS cells. By contrast, among the
16,283 genes that were not significantly increased by decitabine,
only 77 of the 464 genes (17%) that were expressed at higher levels
in fluorouracil-resistant AGS cells also exhibited lower
methylation levels.
Discussion
Among the four genes that were expressed at lower
levels and exhibited higher levels of DNA methylation after CapeOX,
WISP1 has previously been reported to be associated with WNT1
signaling and carcinogenesis (7).
However, the significance of the changes in methylation of these
four genes remains unclear. In addition, some discrepancies were
identified between the expression and methylation profiles. For
example, C1QA showed increased expression and hypermethylation
after CapeOX treatment (data not shown). In the case of such genes,
mechanisms other than DNA methylation could serve roles in
regulating the expression.
The expression levels of 23 genes, including TERT,
APOC1 and STYK1, were higher in CapeOX-resistant ascitic cells,
fluorouracil-resistant AGS cells and oxaliplatin-resistant AGS
cells compared with ascitic cells obtained before CapeOX treatment.
TERT maintains telomere ends due to the addition of the telomere
repeat, TTAGGG. Thus, telomerase expression has a role in cellular
senescence since it is normally repressed in postnatal somatic
cells, resulting in the progressive shortening of telomeres
(8). APOC1 is a member of the
apolipoprotein C1 family, and has been reported to be upregulated
in gastric cancer (9); it has also
been identified as a prognostic marker in lung cancer, as it is
highly expressed in late-stage lung cancer (10). Our research group previously reported
on gene alterations that were detected in gastric cancer treated
with an oral fluoropyrimidine S-1 plus cisplatin (SP) regimen;
expression levels of the identified genes were altered after
chemotherapy, and in fluorouracil-resistant cells and
cisplatin-resistant cells (4). In
the present study, it was observed that, among those previously
identified genes, APOC1 exhibited an elevated level of expression
following CapeOX treatment, after the SP regimen, and in
drug-resistant cells. STYK1 is a receptor protein tyrosine kinase
that serves important roles in a diverse array of cellular and
developmental processes, including cell proliferation,
differentiation, and survival (11).
However, the 19 genes that were expressed at lower levels included
DEFB4A, which has previously been reported to be a potential tumor
suppressor gene (12).
Among the genes in which methylation was altered
after CapeOX, PART1 is induced by androgens in prostate
adenocarcinoma cells, and its expression has been reported to be
associated with a poor prognosis in lung cancer (13); C1QA acts in the tumor
microenvironment as a cancer-promoting factor independent of
complement activation (14); KLK11
has been implicated in carcinogenesis, could potentially be a novel
cancer biomarker, and is expressed at lower levels in gastric
cancer, for which it might serve as a novel independent prognostic
marker (15); and PDCD1LG2
expression has been reported to be inversely associated with a
Crohn-like lymphoid reaction in colorectal cancer, suggesting a
possible role for PDCD1LG2-expressing tumor cells in inhibiting the
development of tertiary lymphoid tissues during colorectal
carcinogenesis (16). No association
has been found between the methylation levels of these genes and
cancer, and the significance of the altered methylation levels that
were observed in ascitic cells remains to be determined. However,
the MSLN promoter was reported to be hypomethylated in malignant
mesothelioma, although its expression was not associated with the
methylation status of the promoter (17).
Among pathways potentially associated with
resistance to CapeOX, GPCRs and their ligands have been reported to
be involved in cancer initiation and progression, including
aberrant cell proliferation, invasion, metastasis, migration,
adhesion and angiogenesis, and they are considered as one of the
most useful therapeutic targets for treating cancer (18). Pathways associated with ‘immune
system’ include chemokines and interleukins, and these have also
been suggested to be connected with CapeOX resistance. These
results indicate that sensitivity to chemotherapeutic agents could
be associated with immunological responses.
In AGS cells, the majority of genes that showed
lower methylation levels following treatment with decitabine were
expressed at higher levels in fluorouracil-resistant AGS cells,
suggesting that the biological changes induced by chemotherapy
drugs are associated with epigenetic mechanisms. However, due to
the lack of success of experiments in which cancer cells from
ascetic fluid were treated with a demethylating agent, the
influence of epigenetics on peritoneal cancer cells remains
unclear. In addition, the number of genes that showed abnormalities
in DNA methylation between ascitic fluid cells collected before and
after chemotherapy was lower compared with the number of genes that
showed similar differences between drug-resistant and parental AGS
cells. These results suggested that the drug-resistance mechanisms
that act in the short term are not strongly associated with the DNA
methylation changes observed in cultured cell lines.
Certain limitations of the present study should be
mentioned. First, ascitic fluids from only one patient were
collected and used for microarray, which is a severe limitation.
Samples obtained from many more patients need to be analyzed to
identify biomarkers that are more generally applicable in a
clinical setting. Secondly, although it is the opinion of the
present authors that the cultured cells from ascites were gastric
cancer cells, the possibility of contamination with non-cancer
cells cannot be excluded. Thirdly, cancer cells cultured to exclude
normal cells might exhibit biological features different from
cancer cells that have not been cultured in this manner. Fourthly,
the cultured ascitic cells did not exhibit as much proliferative
activity as other cultured cells, such as AGS cells, and were not
viable enough to evaluate either drug-sensitivity or the effects of
treatment with decitabine. Fifthly, AGS cells were used as the only
gastric cancer cell line; using multiple cell lines with different
biological features would provide more precise findings, that could
be applied more universally. However, in conclusion and considering
the findings of the present study as a whole, the repetitive
collection of gastric cancer cells from ascitic fluids obtained
before and after chemotherapy has been demonstrated to be useful in
terms of analyzing the biological alterations associated with
drug-resistance mechanisms.
Supplementary Material
Supporting Data
Acknowledgements
We thank Ms Chie Moriyama for providing technical
support. Note that this paper was presented in part at the
Gastrointestinal Cancers Symposium, San Francisco, CA, USA, on Jan
21–23, 2016 (J Clin Oncol: 34(4) S abstract 60, Feb 1, 2016).
Funding
This work was supported by grants from the Ministry
of Education, Culture, Sports, Science and Technology of Japan
(grant no. 26460936) and the Nitto Foundation.
Availability of data and materials
All data generated or analyzed during this study are
included in this published article.
Authors' contributions
OM and YA designed the study and conducted the
experiments; AM, KF, RM and YH made substantial contributions
during the course of chemotherapy; and YA reviewed and edited the
manuscript. All authors read and approved the final manuscript.
Ethics approval and consent to
participate
The present study was approved by the Ethics
Committee of Nagoya University Hospital (Nagoya, Japan). Informed
consent was obtained from all patients.
Patient consent for publication
All participants provided written informed consent
for the whole study.
Competing interests
YA has received research funding from Chugai
Pharmaceutical Co., Ltd. and Yakult Honsya Co., Ltd.
Authors' information
ORCID numbers: OM (0000-0003-4700-6541), AM
(0000-0001-9667-404X), KF (0000-0003-0980-9095), RM
(0000-0001-7172-4602), YH (0000-0001-9639-7425), YA
(0000-0002-6849-2297).
References
|
1
|
Koizumi W, Narahara H, Hara T, Takagane A,
Akiya T, Takagi M, Miyashita K, Nishizaki T, Kobayashi O, Takiyama
W, et al: S-1 plus cisplatin versus S-1 alone for first-line
treatment of advanced gastric cancer (SPIRITS trial): A phase III
trial. Lancet Oncol. 9:215–221. 2008. View Article : Google Scholar : PubMed/NCBI
|
|
2
|
Tsuburaya A, Morita S, Kodera Y, Kobayashi
M, Shitara K, Yamaguchi K, Yoshikawa T, Yoshida K, Yoshino S and
Sakamoto J: A randomized phase II trial to elucidate the efficacy
of capecitabine plus cisplatin (XP) and S-1 plus cisplatin (SP) as
a first-line treatment for advanced gastric cancer: XP
ascertainment vs. SP randomized PII trial (XParTS II). BMC Cancer.
12:3072012. View Article : Google Scholar : PubMed/NCBI
|
|
3
|
Yamada Y, Higuchi K, Nishikawa K, Gotoh M,
Fuse N, Sugimoto N, Nishina T, Amagai K, Chin K, Niwa Y, et al:
Phase III study comparing oxaliplatin plus S-1 with cisplatin plus
S-1 in chemotherapy-naïve patients with advanced gastric cancer.
Ann Oncol. 26:141–148. 2015. View Article : Google Scholar : PubMed/NCBI
|
|
4
|
Maeda O, Ando T, Ohmiya N, Ishiguro K,
Watanabe O, Miyahara R, Hibi Y, Nagai T, Yamada K and Goto H:
Alteration of gene expression and DNA methylation in drug-resistant
gastric cancer. Oncol Rep. 31:1883–1890. 2014. View Article : Google Scholar : PubMed/NCBI
|
|
5
|
Maeda O, Ando T, Ishiguro K, Watanabe O,
Miyahara R, Nakamura M, Funasaka K, Kazuhiro F, Ando Y and Goto H:
Safety of repeated cell-free and concentrated ascites reinfusion
therapy for malignant ascites from gastrointestinal cancer. Mol
Clin Oncol. 2:1103–1106. 2014. View Article : Google Scholar : PubMed/NCBI
|
|
6
|
Benjamini Y and Hochberg Y: Controlling
the false discovery rate: A practical and powerful approach to
multiple testing. J R Stat Soc B. 57:289–300. 1995.
|
|
7
|
Xu L, Corcoran RB, Welsh JW, Pennica D and
Levine AJ: WISP-1 is a Wnt-1- and beta-catenin-responsive oncogene.
Genes Dev. 14:585–595. 2000.PubMed/NCBI
|
|
8
|
Kyo S, Takakura M, Fujiwara T and Inoue M:
Understanding and exploiting hTERT promoter regulation for
diagnosis and treatment of human cancers. Cancer Sci. 99:1528–1538.
2008. View Article : Google Scholar : PubMed/NCBI
|
|
9
|
Yasui W, Oue N, Ito R, Kuraoka K and
Nakayama H: Search for new biomarkers of gastric cancer through
serial analysis of gene expression and its clinical implications.
Cancer Sci. 95:385–392. 2004. View Article : Google Scholar : PubMed/NCBI
|
|
10
|
Ko HL, Wang YS, Fong WL, Chi MS, Chi KH
and Kao SJ: Apolipoprotein C1 (APOC1) as a novel diagnostic and
prognostic biomarker for lung cancer: A marker phase I trial.
Thorac Cancer. 5:500–508. 2014. View Article : Google Scholar : PubMed/NCBI
|
|
11
|
Liu L, Yu XZ, Li TS, Song LX, Chen PL, Suo
TL, Li YH, Wang SD, Chen Y, Ren YM, et al: A novel protein tyrosine
kinase NOK that shares homology with platelet- derived growth
factor/fibroblast growth factor receptors induces tumorigenesis and
metastasis in nude mice. Cancer Res. 64:3491–3499. 2004. View Article : Google Scholar : PubMed/NCBI
|
|
12
|
Kamino Y, Kurashige Y, Uehara O, Sato J,
Nishimura M, Yoshida K, Arakawa T, Nagayasu H, Saitoh M and Abiko
Y: HBD-2 is downregulated in oral carcinoma cells by DNA
hypermethylation, and increased expression of hBD-2 by DNA
demethylation and gene transfection inhibits cell proliferation and
invasion. Oncol Rep. 32:462–468. 2014. View Article : Google Scholar : PubMed/NCBI
|
|
13
|
Li M, Zhang W, Zhang S, Wang C and Lin Y:
PART1 expression is associated with poor prognosis and tumor
recurrence in stage I–III non-small cell lung cancer. J Cancer.
8:1795–1800. 2017. View Article : Google Scholar : PubMed/NCBI
|
|
14
|
Bulla R, Tripodo C, Rami D, Ling GS,
Agostinis C, Guarnotta C, Zorzet S, Durigutto P, Botto M and
Tedesco F: C1q acts in the tumour microenvironment as a
cancer-promoting factor independently of complement activation. Nat
Commun. 7:103462016. View Article : Google Scholar : PubMed/NCBI
|
|
15
|
Wen YG, Wang Q, Zhou CZ, Yan DW, Qiu GQ,
Yang C, Tang HM and Peng ZH: Identification and validation of
Kallikrein-ralated peptidase 11 as a novel prognostic marker of
gastric cancer based on immunohistochemistry. J Surg Oncol.
104:516–524. 2011. View Article : Google Scholar : PubMed/NCBI
|
|
16
|
Masugi Y, Nishihara R, Hamada T, Song M,
da Silva A, Kosumi K, Gu M, Shi Y, Li W, Liu L, et al: Tumor
PDCD1LG2 (PD-L2) Expression and the Lymphocytic Reaction to
Colorectal Cancer. Cancer Immunol Res. 5:1046–1055. 2017.
View Article : Google Scholar : PubMed/NCBI
|
|
17
|
Tan K, Kajino K, Momose S, Masaoka A,
Sasahara K, Shiomi K, Izumi H, Abe M, Ohtsuji N, Wang T, et al:
Mesothelin (MSLN) promoter is hypomethylated in malignant
mesothelioma, but its expression is not associated with methylation
status of the promoter. Hum Pathol. 41:1330–1338. 2010. View Article : Google Scholar : PubMed/NCBI
|
|
18
|
Liu Y, An S, Ward R, Yang Y, Guo XX, Li W
and Xu TR: G protein-coupled receptors as promising cancer targets.
Cancer Lett. 376:226–239. 2016. View Article : Google Scholar : PubMed/NCBI
|