Introduction
Proton beam therapy (PBT) is characterized by the
emission of high radiation energy after penetration of the beam up
to a certain depth (1,2), and this therapeutic modality is
widely used for the treatment of various cancers (3-5).
Techniques for the delivery of PBT have advanced over the last few
decades. One of the most representative advances is the development
of the spot scanning technique using pencil beams. In the spot
scanning irradiation technique, a lesion is visualized as a mass of
points and each point is irradiated individually, unlike in
conventional passive-scattered broad beam irradiation, in which a
bundle of proton beams that are shaped to match the lesion is used.
Scanning PBT is associated with superior beam flexibility that
allows adaptation to complex-shaped targets. Other advantages are
the reduced cost of manufacture of patient-specific apertures or
compensators and the reduced time needed during delivery to change
the devices (6-8).
The number of facilities offering spot scanning PBT is growing
rapidly worldwide. Spot scanning PBT has been applied for the
treatment of prostate cancers (9,10).
Several studies have investigated means to improve
the image quality and/or shorten the beam delivery time, such as
hardware or software modifications, including use of an improved
collimator, spot resampling, or beam intensity adjustment (6,11-18).
Each of the methods has its own advantages, including reduction of
the dose to the organs at risk (OAR), reduction of the out-of-field
dose, improved optimization time, and shortened beam delivery time.
However, some of these methods involve the use of special equipment
that might entail huge costs and efforts for development and are
not universally applicable in every facility. RayStation (RaySearch
Medical Laboratories, Stockholm, Sweden) is a treatment planning
system (TPS) which integrates a software package that allows
definition of the doses to the target and OAR, management of the
treatment plan and plan optimization, and provides delivery quality
assurance (19). The TPS has the
capability of allowing editing of the energy dose deposited on each
spot even after optimization, such as adding, removing and/or
multiplying the energy dose levels. Thus, it may be expected to
allow modification of the dose distribution to make it closer to
the ideal by deleting energy depositions of low importance.
The aim of this study was to investigate the effects
of the spot deletion technique in spot scanning PBT in patients
with prostate cancer, in whom the doses to the OAR are often
controversial.
Materials and methods
All the study procedures, which involved human
participants, were conducted in accordance with the ethical
standards of the institutional research committee and in compliance
with the Declaration of Helsinki, and were approved by the Kobe
Proton Center institutional review board. Patients' planning
computed tomography data were used.
Simulation planning
Simulation planning was performed in 30 patients
with prostate cancer (47-82 years old, T1 or T2 disease in all,
according to the TNM classification). The clinical target volume
(CTV) was defined as the whole prostate gland and the dose fraction
to the isocenter of the CTV was 63 gray relative biological
effectiveness [Gy (RBE)] with 21 fractions (20) The main parameter of the beam
delivery system is shown in Table
I; the beam direction was left and right opposition. The
RayStation optimization algorithm is a sequential quadratic
programming method that uses Broyden-Fletcher-Goldfarb-Shanno
updates of the quasi-Newton approximation of the Hessian of the
Lagrangian. Each beam included the range shifter of 0-6 mm water
equivalent thickness made up of polyethylene. Robust optimization
with a 3-mm setup and 3.5% range uncertainty for CTV was used. The
robustness parameters were decided by our accumulated set-up
reproducibility data. Next, we calculated the perturbed doses due
to the patient's positional variations (±3-mm in 6 directions and
±3.5% in range) and confirmed that the dose constraint was met. The
dose constraints were determined by referring to a
multi-institutional research on Japanese proton beam facilities and
a treatment plan was created (initial plan). Default optimization
parameters and clinical goal are shown in Table II. The maximum number of iteration
was 40.
 | Table IBeam parameters. |
Table I
Beam parameters.
| Parameters | Value |
|---|
| Energy, MeV | 70.7-235 |
| Energy steps,
steps | 92 |
| Pulse frequency,
Hz | 1/2.8 |
| Field size, cm | 20x15 |
| Source-axis
distance, X, Y, m | 2.696, 3.029 |
| Scanning speed, X,
Y, mm/msec | 60, 120 |
| Spot size at
isocenter in air, mm, one σ | 3.3-12 |
| Dose rate, Gy/(l
min) | 1 |
| Table IIOptimization parameters and dose
constraints. |
Table II
Optimization parameters and dose
constraints.
| Organs | Optimization
parameters | Weight | Clinical goal |
|---|
| CTV | Uniform dose, 63
Gy(RBE) | 100 | D2%
<107% |
| | | | D98%
>93% |
| | | | V60
Gy(RBE) 100% |
| Rectum | Max DVH, 30
Gy(RBE), 30% | 5 | V30
Gy(RBE) <30% |
| | Max DVH, 50
Gy(RBE), 20% | 5 | V50
Gy(RBE) <20% |
| | Max DVH, 60
Gy(RBE), 10% | 5 | V60
Gy(RBE) <10% |
| Bladder | Max DVH, 50
Gy(RBE), 30% | 5 | V50
Gy(RBE) <30% |
| | Max DVH, 60
Gy(RBE), 30% | 5 | V60
Gy(RBE) <15% |
| Femoral head | Max dose, 45
Gy(RBE) | 5 | Dmax
<45 Gy(RBE) |
| Colon and small
intestine | Max DVH, 50
Gy(RBE), 0.5 cm3 | 5 | V50
Gy(RBE) <0.5 cm3 |
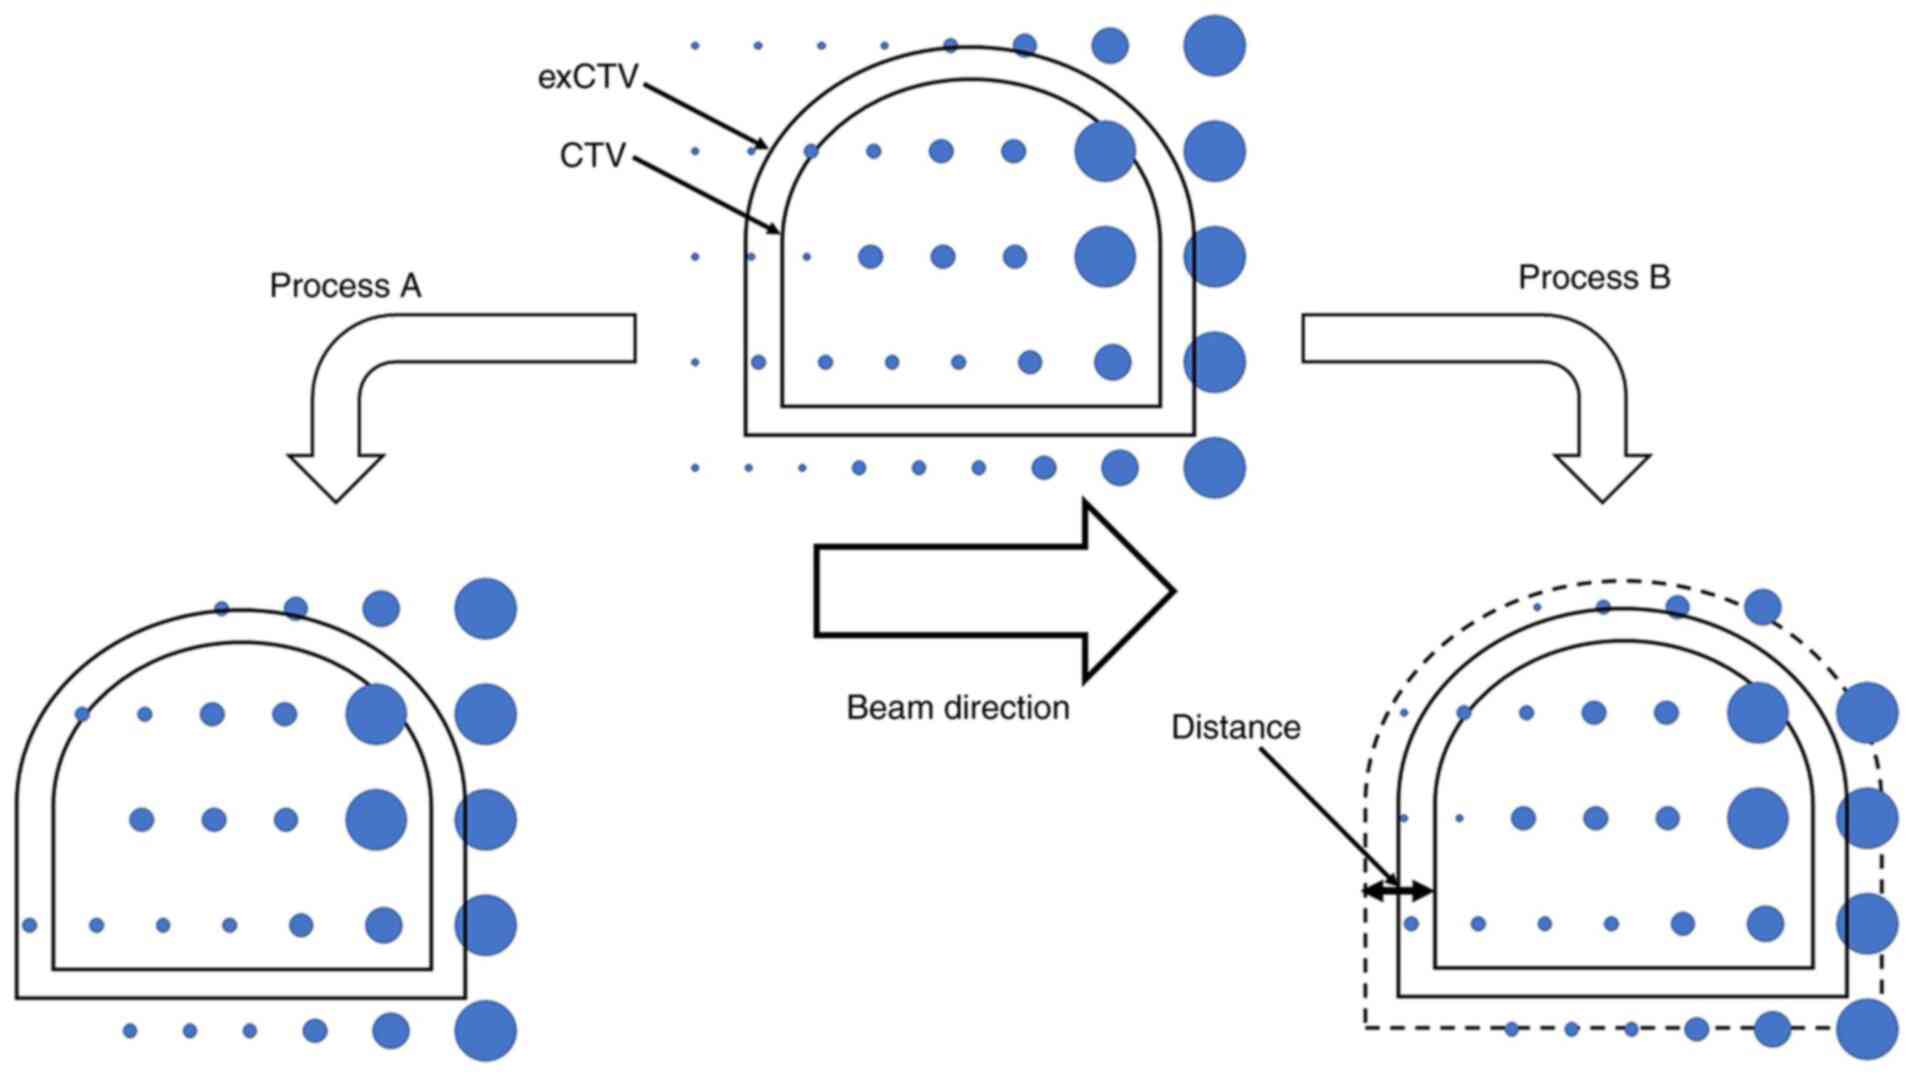
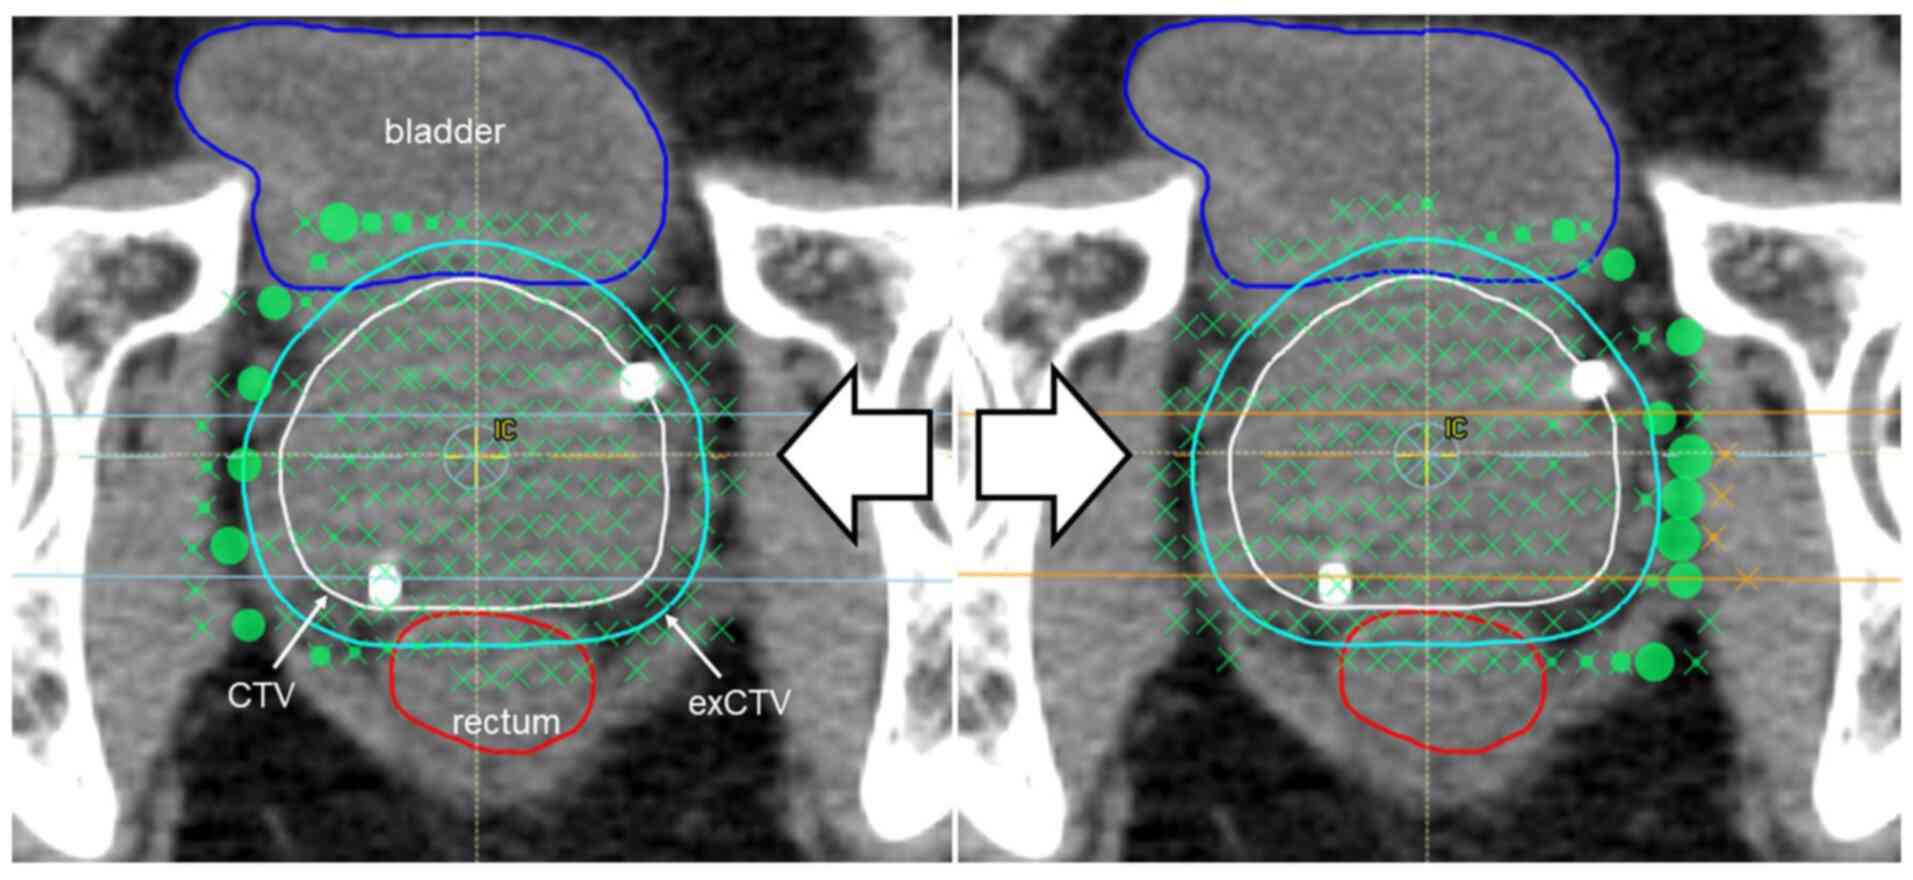
Then, the initial plan was modified by 2 processes:
process A, in which spots with lower weighting depositions were
deleted, and process B, in which spots that were distant from the
CTV were deleted. In process A, relative energy spots were deleted
in ascending order by 0.01%. In process B, spots located away from
the CTV were deleted at 1-mm intervals (Fig. 1). We had checked, in a preliminary
study conducted prior to this study, that the deletion of spots
more than 15 mm away from the CTV had little effect on the plan
quality. Thus, we started inward from a distance of 15 mm in
process B. The step sizes in each process was such that they were
clear-cut and the classification of the two processes would be
consistent. In both processes, the spot deletion procedure was
performed for each beam individually and the optimization was
repeated after that. After spot deletion procedure, we calculated
re-optimized plan and perturbed dose as same as the initial plan
and confirmed that the dose constraint was met. Although this is a
simulation study, we routinely setup using bone structure at first
and fine-tune using implanted a pair of metallic markers by
anterior and lateral X-ray fluoroscopic images in clinical
practice. The metallic markers (0.28 mm diameter, 20 mm length) are
implanted in bilateral lobes where one is ventral and the other is
dorsal side of the prostate gland.
Data analysis
Both processes were continued while every dose
constraint was maintained. We investigated the dose distribution to
the OAR, to the target, and the beam delivery time. In the analysis
of the dose distribution to the OAR, we calculated the V50 Gy
(RBE) and Dmax of the rectum, V50 Gy
(RBE) and Dmax of the bladder, and V60 Gy
(RBE) and Dmax of the urethral bulb. In the
analysis of the dose distribution to the target, the inhomogeneity
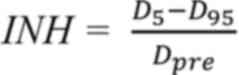
index (INH) were calculated, as follows (21):
The expanded CTV (exCTV) was defined by a uniform
expansion of the CTV by a radius of 5 mm for only plan comparison
referring the method of Kirk et al (22). D5 and D95 are
the doses to 5 and 95% of the exCTV, and Dpre is the
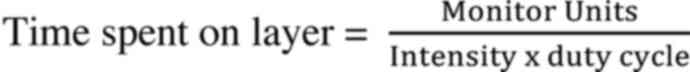
prescription dose. The beam delivery time was calculated as the sum
of the time spent on each layer and the time interval between
layers. The time spent in each layer was calculated as follows:
Intensity means Monitor Unit/time and duty cycle
means ratio of beam-on time/beam-on + off time.
We added examination to the patients with spacer
implantation because separation effect due to the spacer might make
it unnecessary to delete spots like process B. We examined whether
the process B could reduce the dose of the rectum in 8 patients
with SpaceOAR® System (Augmenix, Inc.) implantation as
adding trial.
Statistics
The values represent the means ± standard deviation.
Single-factor ANOVA with Bonferroni's correction was used for
comparing the data between the initial and modified plan, and
minimum value in all modified plans was used as the value of
modified plan in the OAR dose and beam delivery time comparison and
maximum value was used in INH comparison. P<0.05 was considered
to indicate a statistically significant difference.
Results
In the plan modification by process A, that is,
deletion of lower weighting spots, relative energy doses with
weights of 0.02-0.1% were deleted (0.02%: 5; 0.03%: 8; 0.04%: 10;
0.05%: 4; 0.06%: 2; 0.1%: 1 patients). In the plan modification by
process B, that is, deletion of distant spots, energy spots were
deleted from 13-9 mm away from the CTV (13 mm: 5; 11 mm: 19; 10 mm:
1; 9 mm: 5 patients). Table III
shows a summary of the data. Fig.
2, Fig. 3 and Fig. 4 show the changes in the data
obtained by modification of the initial treatment plan by processes
A and B.
| Table IIISummary of data. |
Table III
Summary of data.
| | Process A | Process B |
|---|
| Parameters | Initial plan | All (energy) | Final (energy) | All (distance) | Final
(distance) |
|---|
| Rectum
V50 Gy(RBE) | 3.5-16.0
(11.1±3.1) | 3.1-16.0
(11.5±3.0) | 3.1-15.8
(11.3±3.2) | 3.4-16.4
(10.4±2.9) | 3.4-14.9
(8.9±2.7) |
| Rectum
Dmax Gy(RBE) | 54.2-64.0
(63.0±1.8) | 53.7-65.2
(63.2±1.6) | 53.7-65.2
(63.2±2.0) | 54.2-64.3
(63.0±1.5) | 54.2-64.2
(62.7±1.9) |
| Bladder
V50 Gy(RBE) | 4.4-17.5
(9.7±3.6) | 4.4-18.0
(9.7±3.6) | 4.4-17.1
(10.1±3.7) | 3.5-17.4
(8.6±3.2) | 3.5-16.0
(7.4±3.0) |
| Bladder
Dmax Gy(RBE) | 62.6-64.4
(63.6±0.4) | 62.4-65.9
(63.6±0.5) | 62.4-65.9
(63.8±0.6) | 61.2-64.8
(63.6±0.6) | 61.2-64.8
(63.5±0.9) |
| Urethral bulb
V60 Gy(RBE) | 80.6-100.0
(99.2±3.5) | 77.7-100.0
(99.3±3.4) | 81.4-100.0
(99.2±3.4) | 33.6-100.0
(94.5±12.7) | 33.4-100.0
(83.4±19.7) |
| Urethral bulb
Dmax Gy(RBE) | 63.8-65.5
(64.4±0.4) | 63.6-66.0
(64.5±0.5) | 63.6-64.7
(64.2±0.3) | 62.7-68.7
(64.5±0.7) | 62.7-65.0
(63.9±0.5) |
| Inhomogeneity
index | 0.03-0.10
(0.04±0.01) | 0.03-0.10
(0.04±0.01) | 0.03-0.10
(0.05±0.01) | 0.03-0.14
(0.06±0.02) | 0.04-0.14
(0.08±0.03) |
| Beam delivery time,
sec | 238.4-424.4
(302.6±47.2) | 232.8-425.0
(290.2±38.7) | 232.8-415.7
(296.9±46.5) | 217.2-421.8
(290.4±45.0) | 217.2-412.5
(277.6±44.9) |
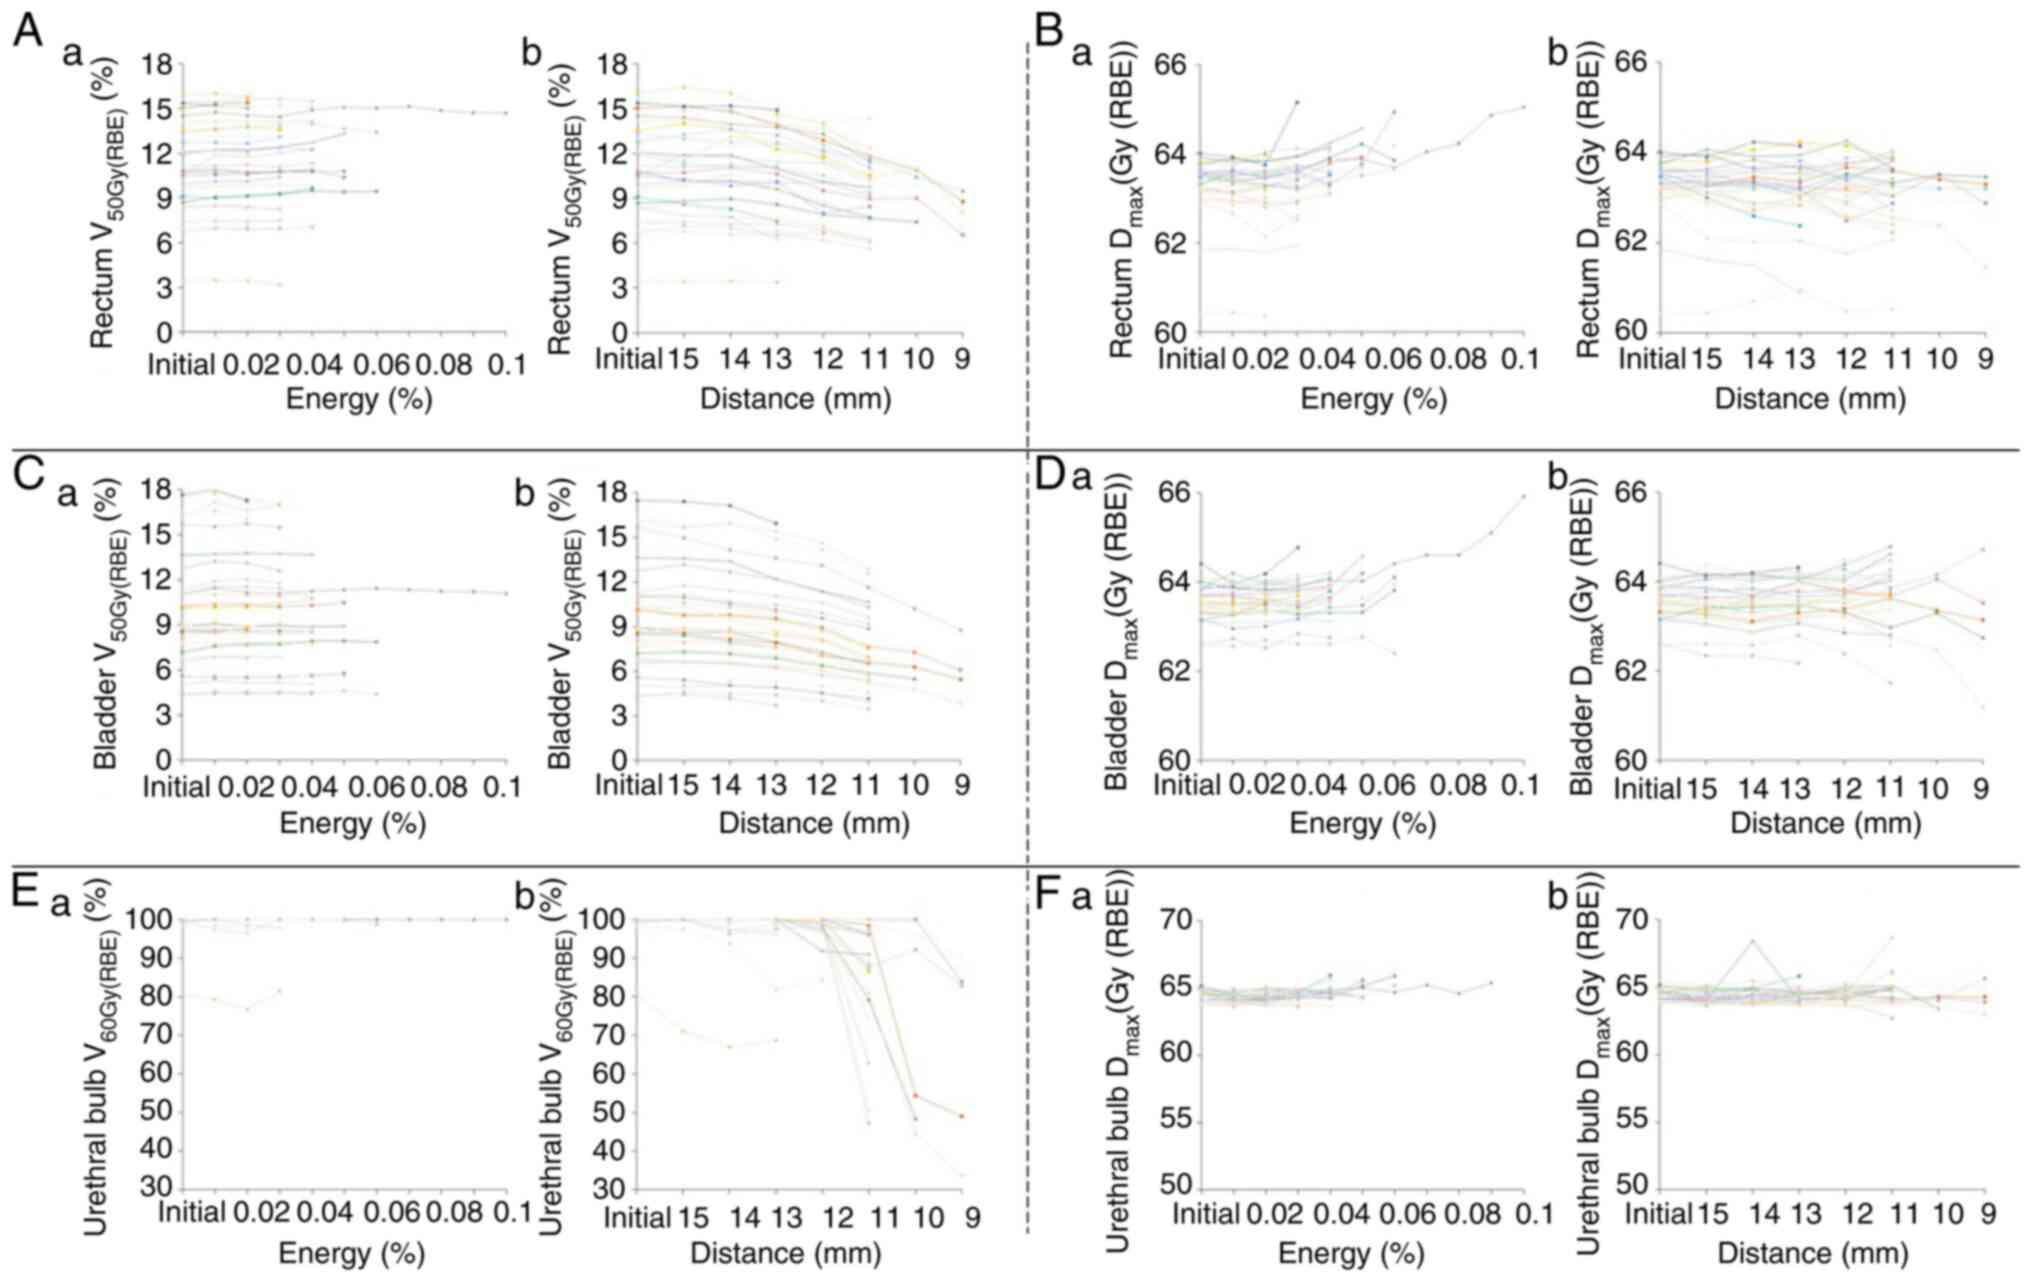
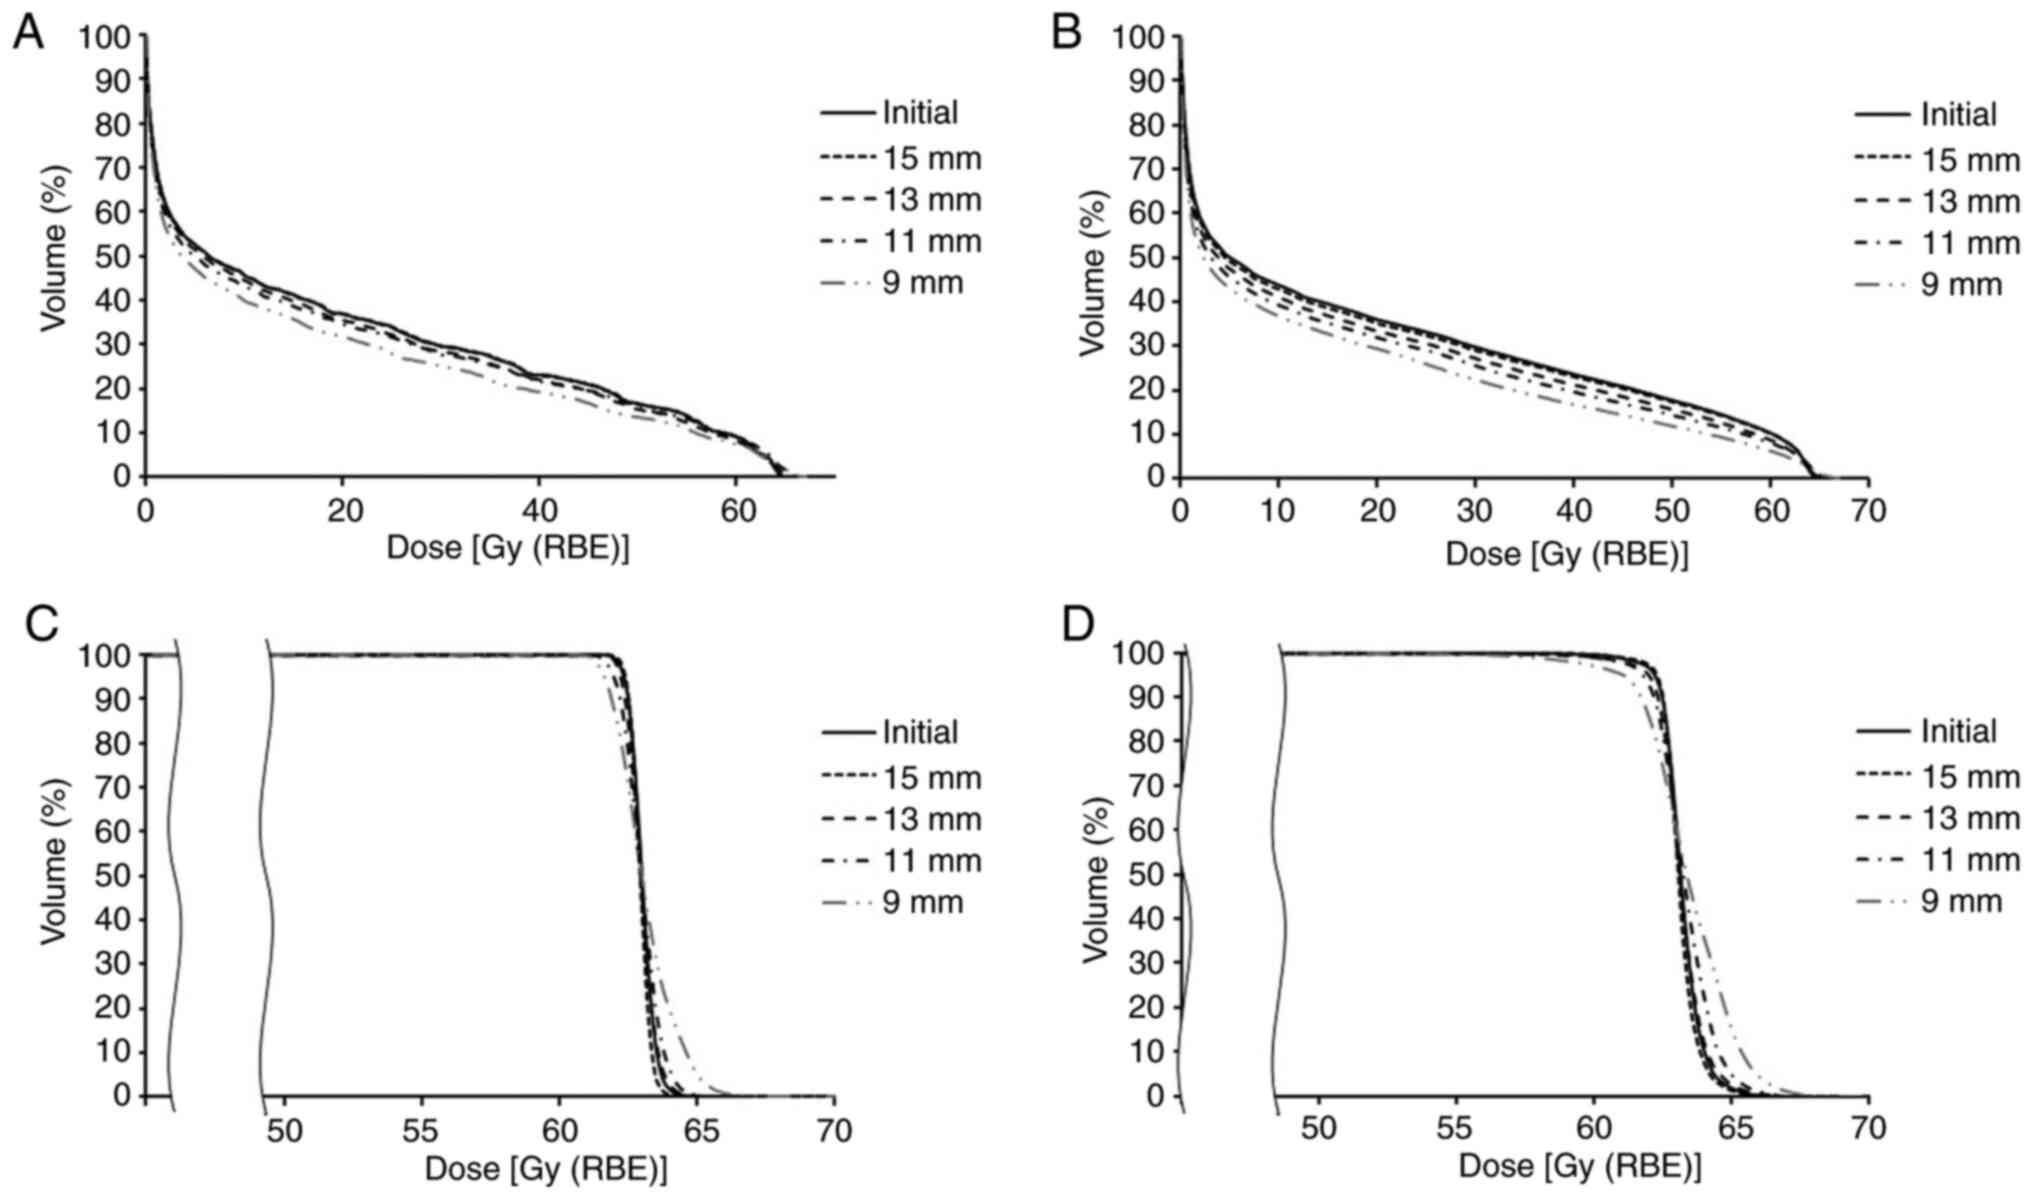
Dose distribution to the OAR
The V50 Gy (RBE) of the rectum was
between 3.5 and 16 (11.1±3.1)% as per the initial plan. It finally
changed to between 3.1 and 15.8 (11.3±3.2)% following the initial
plan was modified by process A; following modification of the
initial plan by process B, it finally changed to between 3.4 and
14.9 (8.9±2.7)%. The V50 Gy (RBE) of the bladder was
between 4.4 and 17.5 (9.7±3.6)% as per the initial plan. It finally
changed to between 4.4 and 17.1 (10.1±3.7)% following the initial
plan was modified by process A; following modification of the
initial plan by process B, it finally changed to between 3.5 and 16
(7.4±3)%. The V60 Gy (RBE) of the urethral bulb was
between 80.6 and 100 (99.2±3.5)% as per the initial plan. It
finally changed to between 81.4 and 100 (99.2±3.4)% following the
initial plan was modified by process A; following modification of
the initial plan by process B, it finally changed to between 33.6
and 100 (83.4±19.7)%. Thus, the V50 Gy (RBE) of the
rectum, V50 Gy (RBE) of the bladder, and V60 Gy
(RBE) of the urethral bulb showed a significant difference
among groups (P=1.1x10⁻¹⁴, 6.4x10⁻¹⁴, and
2.7x10⁻⁷, respectively) and following modification of
the initial treatment plan by process B showed significant
decrease, while no significant difference was noted with
modification by process A.
Dmax of the rectum was between 54.2 and
64 (63±1.8) Gy (RBE) as per the initial plan. It finally changed
between 53.7 and 65.2 (63.2±2) Gy (RBE) following the initial plan
was modified by process A. While, following modification of the
initial plan by process B, it finally changed between 54.2 and 64.2
(62.7±1.9) Gy (RBE). Dmax of the bladder was between
62.6 and 64.4 (63.6±0.4) Gy (RBE) as per the initial plan. It
finally changed to between 62.4 and 65.9 (63.8±0.6) Gy (RBE)
following the initial plan was modified by process A. While,
following modification of the initial plan by process B, it finally
changed to between 61.2 and 64.8 (63.5±0.9) Gy (RBE).
Dmax of the urethral bulb was between 63.8 and 65.5
(64.4±0.4) Gy (RBE) as per the initial plan. It finally changed to
between 63.6 and 64.7 (64.2±0.3) Gy (RBE) following the initial
plan was modified by process A. While, following modification of
the initial plan by process B, it finally changed to between 62.7
and 65.0 (63.9±0.5) Gy (RBE). Thus, the Dmax of the
rectum and bladder showed a significant difference among groups
(P=6.1x10⁻⁴ and 4.9x10⁻³, respectively), but
no significant difference was noted between initial plan and
modification by process A or B (Fig.
2).
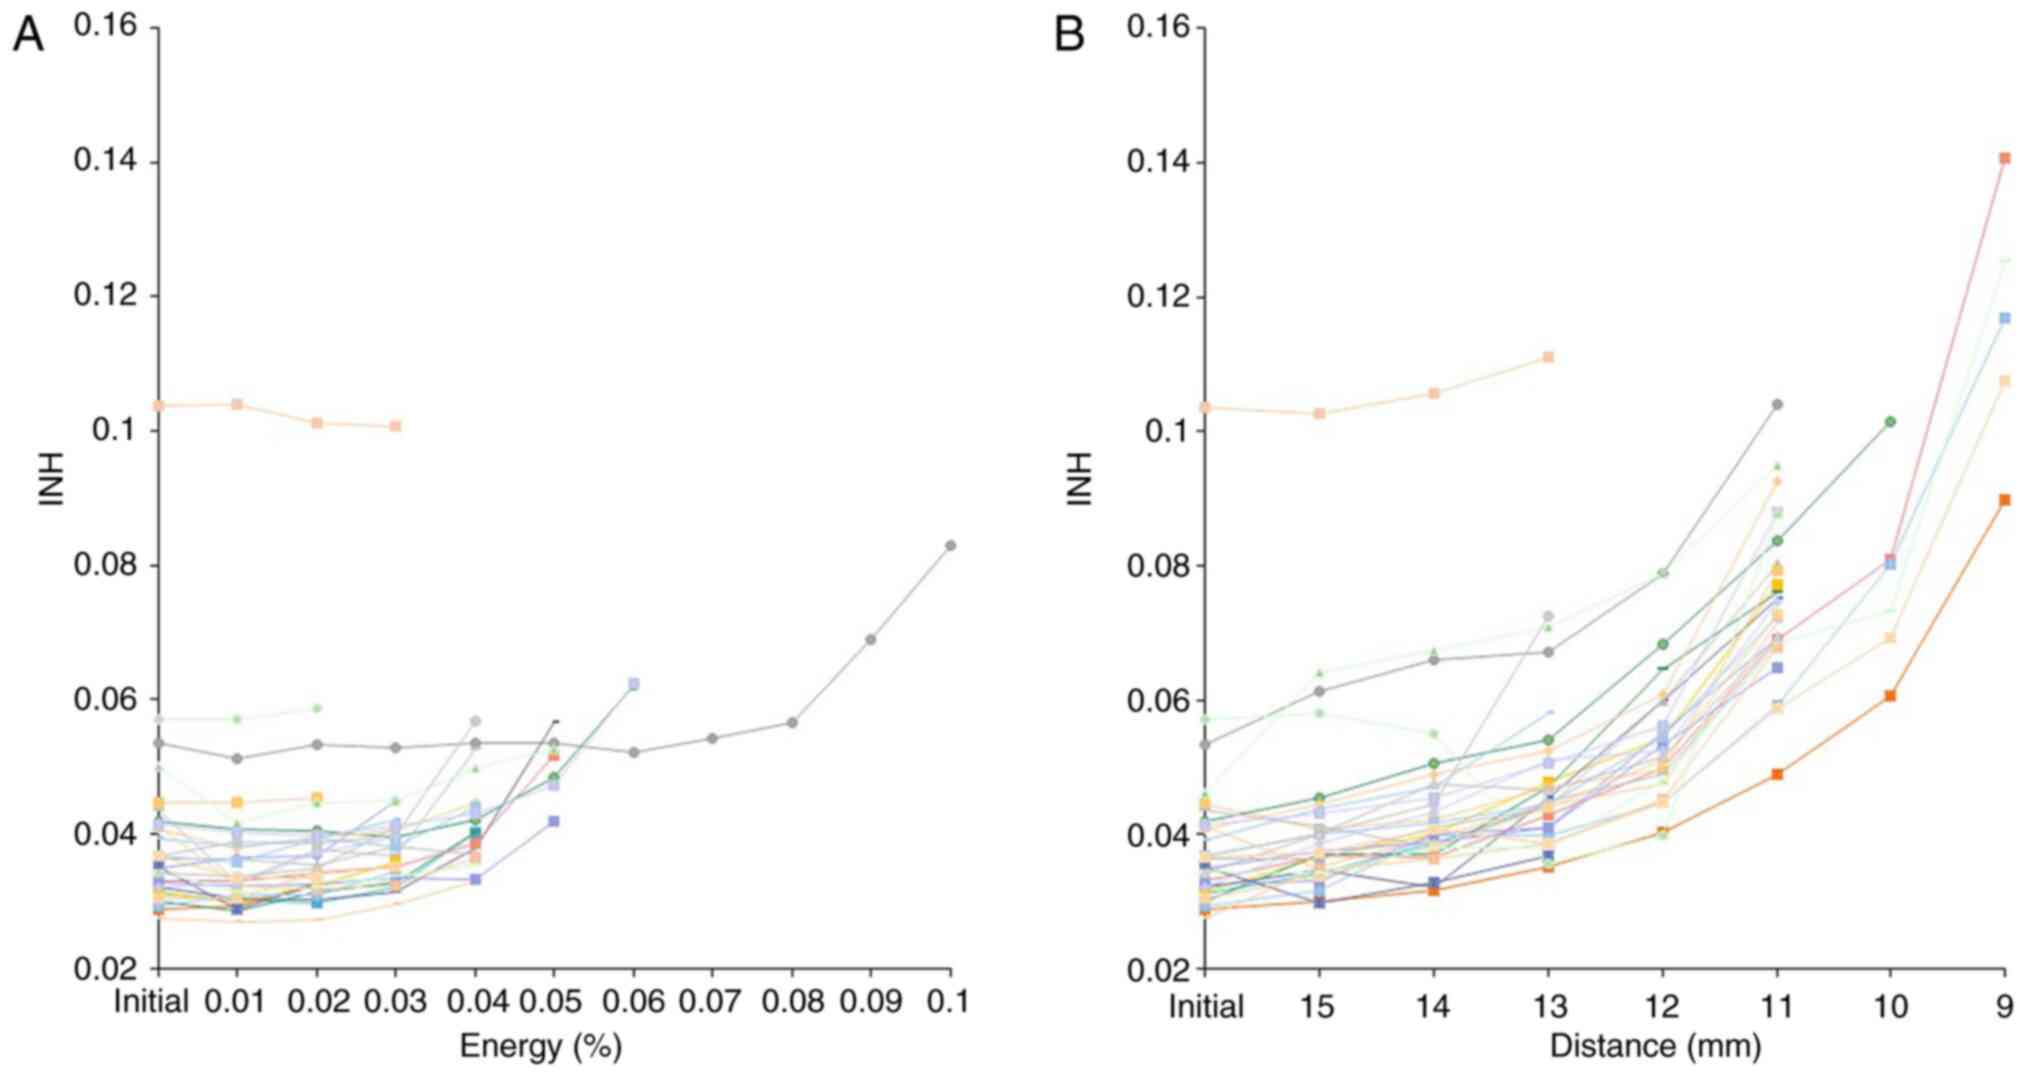
Dose distribution to the target
The INH was between 0.03 and 0.1 (0.04±0.01) as per
the initial plan. It finally changed to between 0.03 and 0.1
(0.05±0.01) following modification of the initial plan by process
A. While, following modification of the initial plan by process B,
it finally changed to between 0.04 and 0.14 (0.08±0.03). The INH
showed a significant difference among groups
(P=3.2x10⁻¹⁷) and following modification of the initial
treatment plan by process B showed significant increase (Fig. 3).
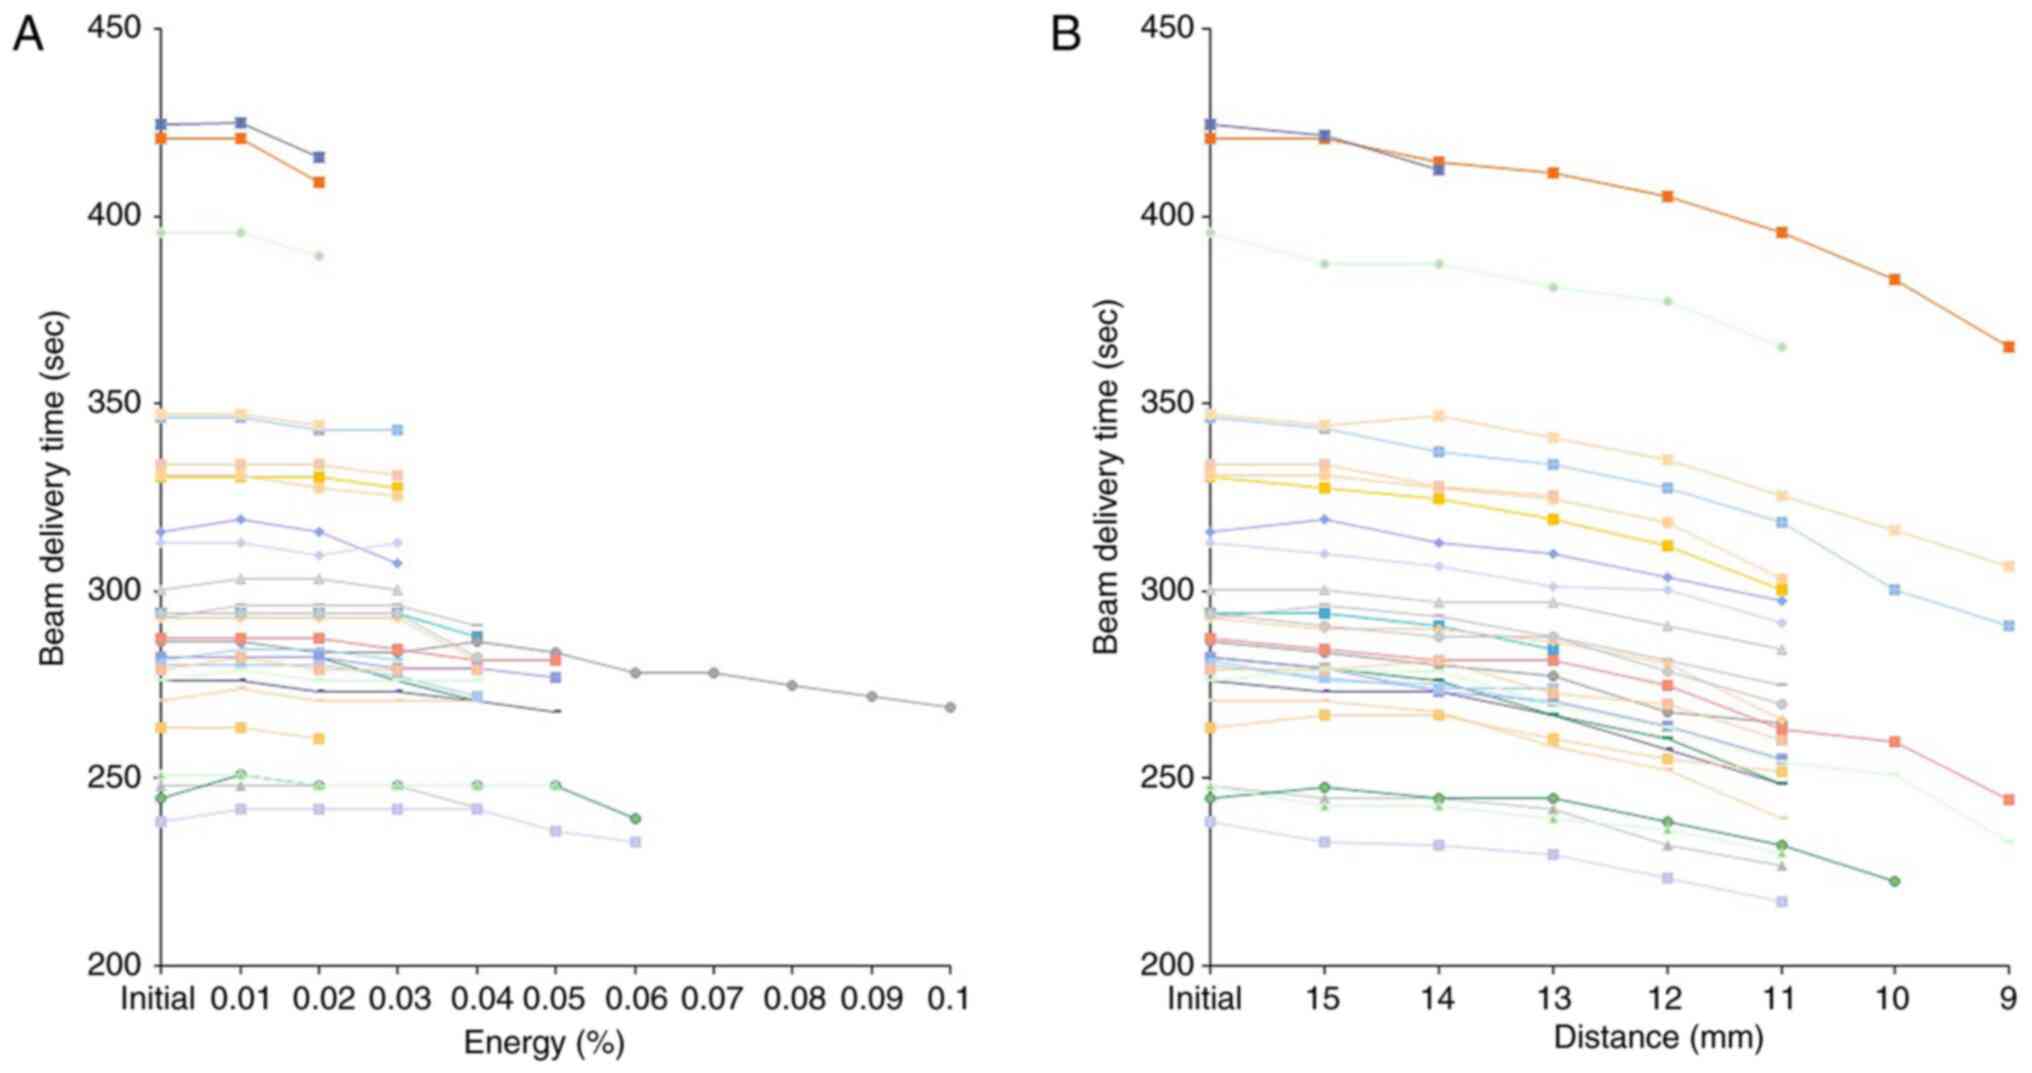
Beam delivery time
The beam delivery time was between 238.4 and 424.4
(302.6±47.2) sec as per the initial plan. It finally changed to
between 232.8 and 415.7 (296.9±46.5) sec following modification of
the treatment plan by process A. While, following modification of
the plan by process B, it finally changed to between 217.2 and
412.5 (277.6±44.9) sec. The beam delivery time showed a significant
difference among groups (P=2.5x10⁻¹⁸), but no
significant difference was noted with between initial plan and
modification by process A or B (Fig.
4).
Adding analysis to the patients with
spacer implantation
The V50 Gy (RBE) of the rectum was 1.7%
as per the initial plan. It changed to 1.1% in 15 mm, 1.1% in 13
mm, 0.8% in 11 mm, and 0.4% in 9 mm plans. Dmax of the
rectum was also reduced from 49.7 Gy(RBE) in initila plan to 48.8
Gy(RBE) in 15 mm, 46.6 Gy(RBE) in 13 mm, 41.0 Gy(RBE) in 11 mm and
37.2 Gy(RBE) in 9 mm plans. On the other hand, D95 of
the CTV was 100% in initial plan and 100% in 15-11 mm plans and
99.9% in 9 mm plan.
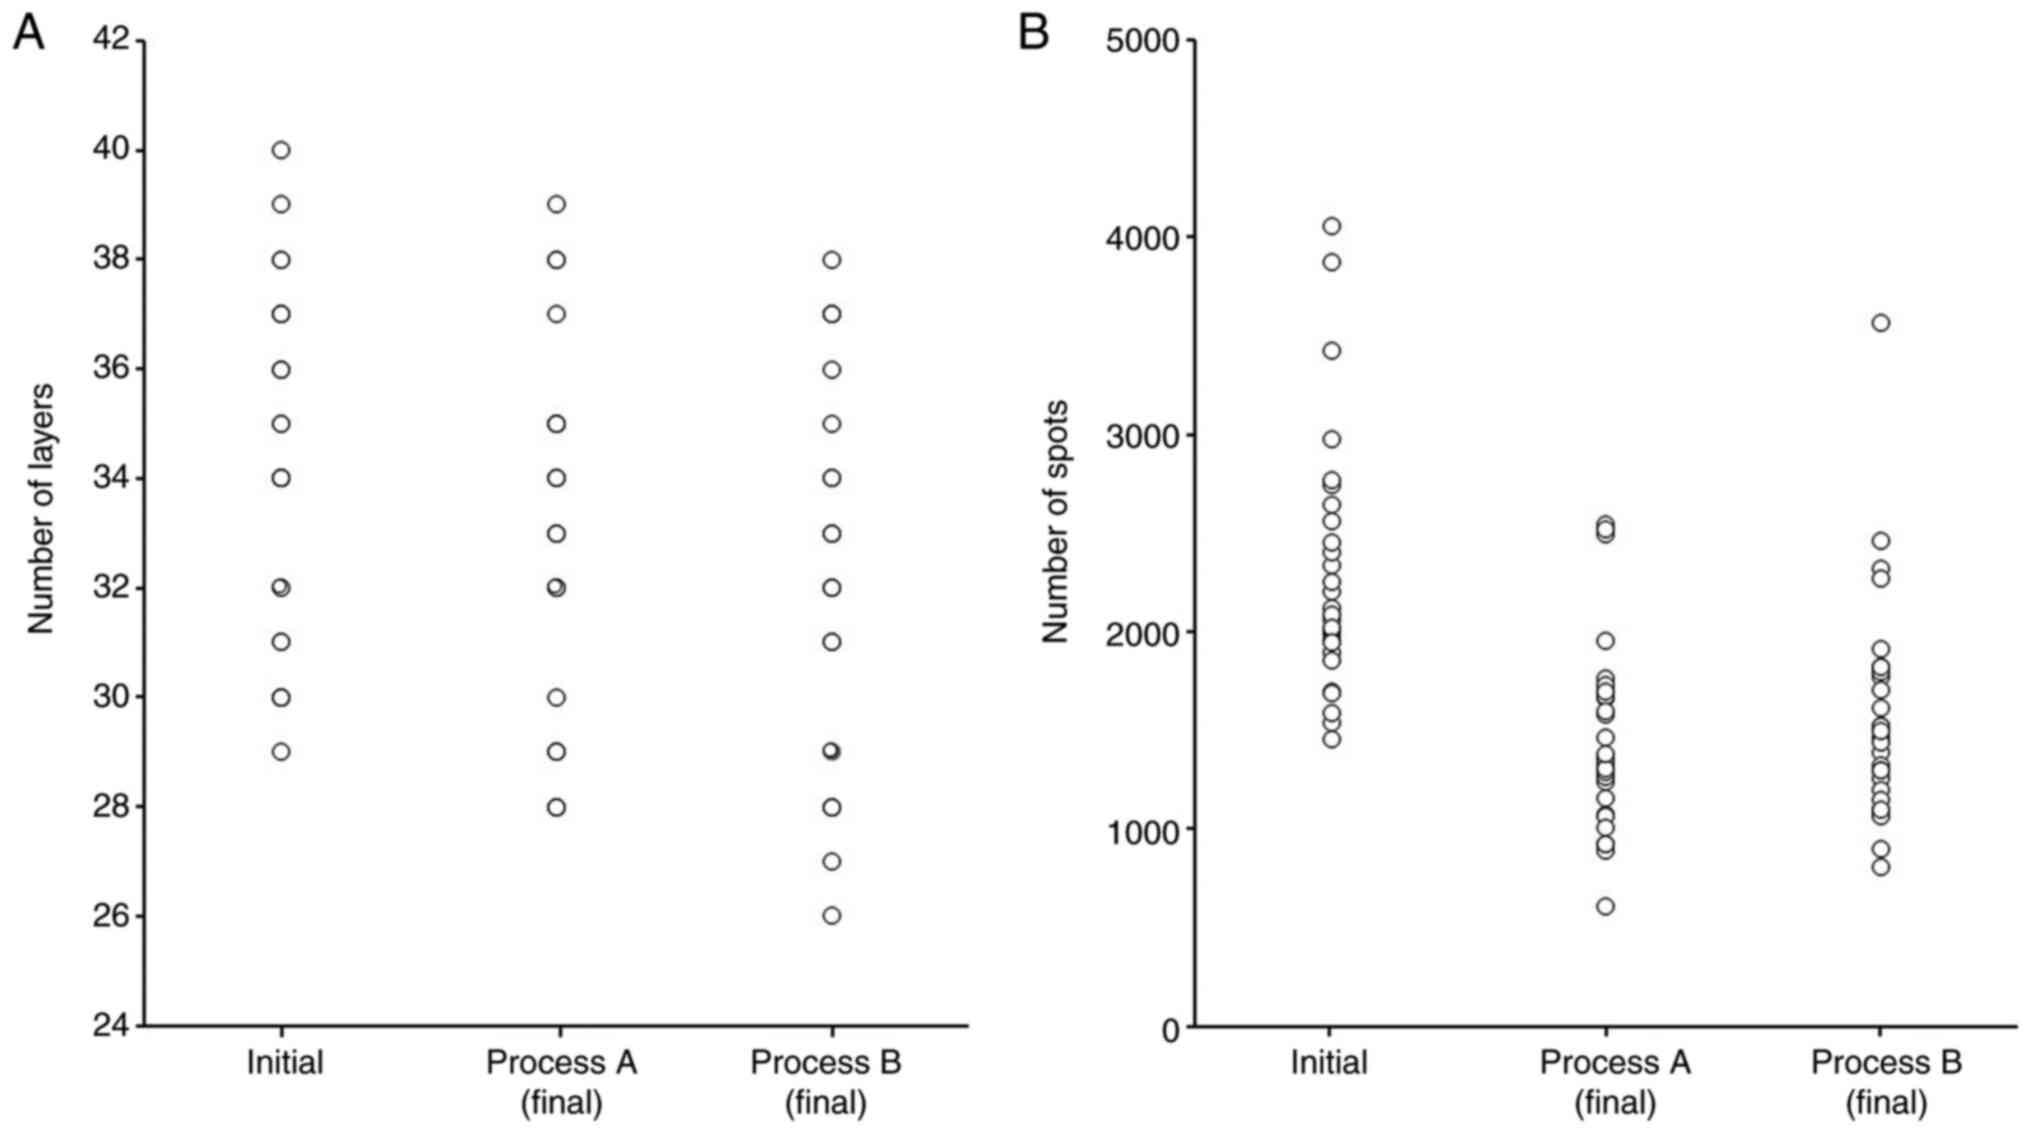
Number of layers, spots and spots
distribution
The number of layers was 34±3.1, 32.7±3.2, and
32±3.3 and the number of spots was 2288±632, 1461±472, and 1575±555
in initial plan, process A and process B (Fig. 5). Fig.
6 shows one example of spots distribution. Relatively
high-weighted deposition spots for each beam can be seen in the
area beyond the CTV and relatively low-weighted deposition spots
are found in and around the CTV.
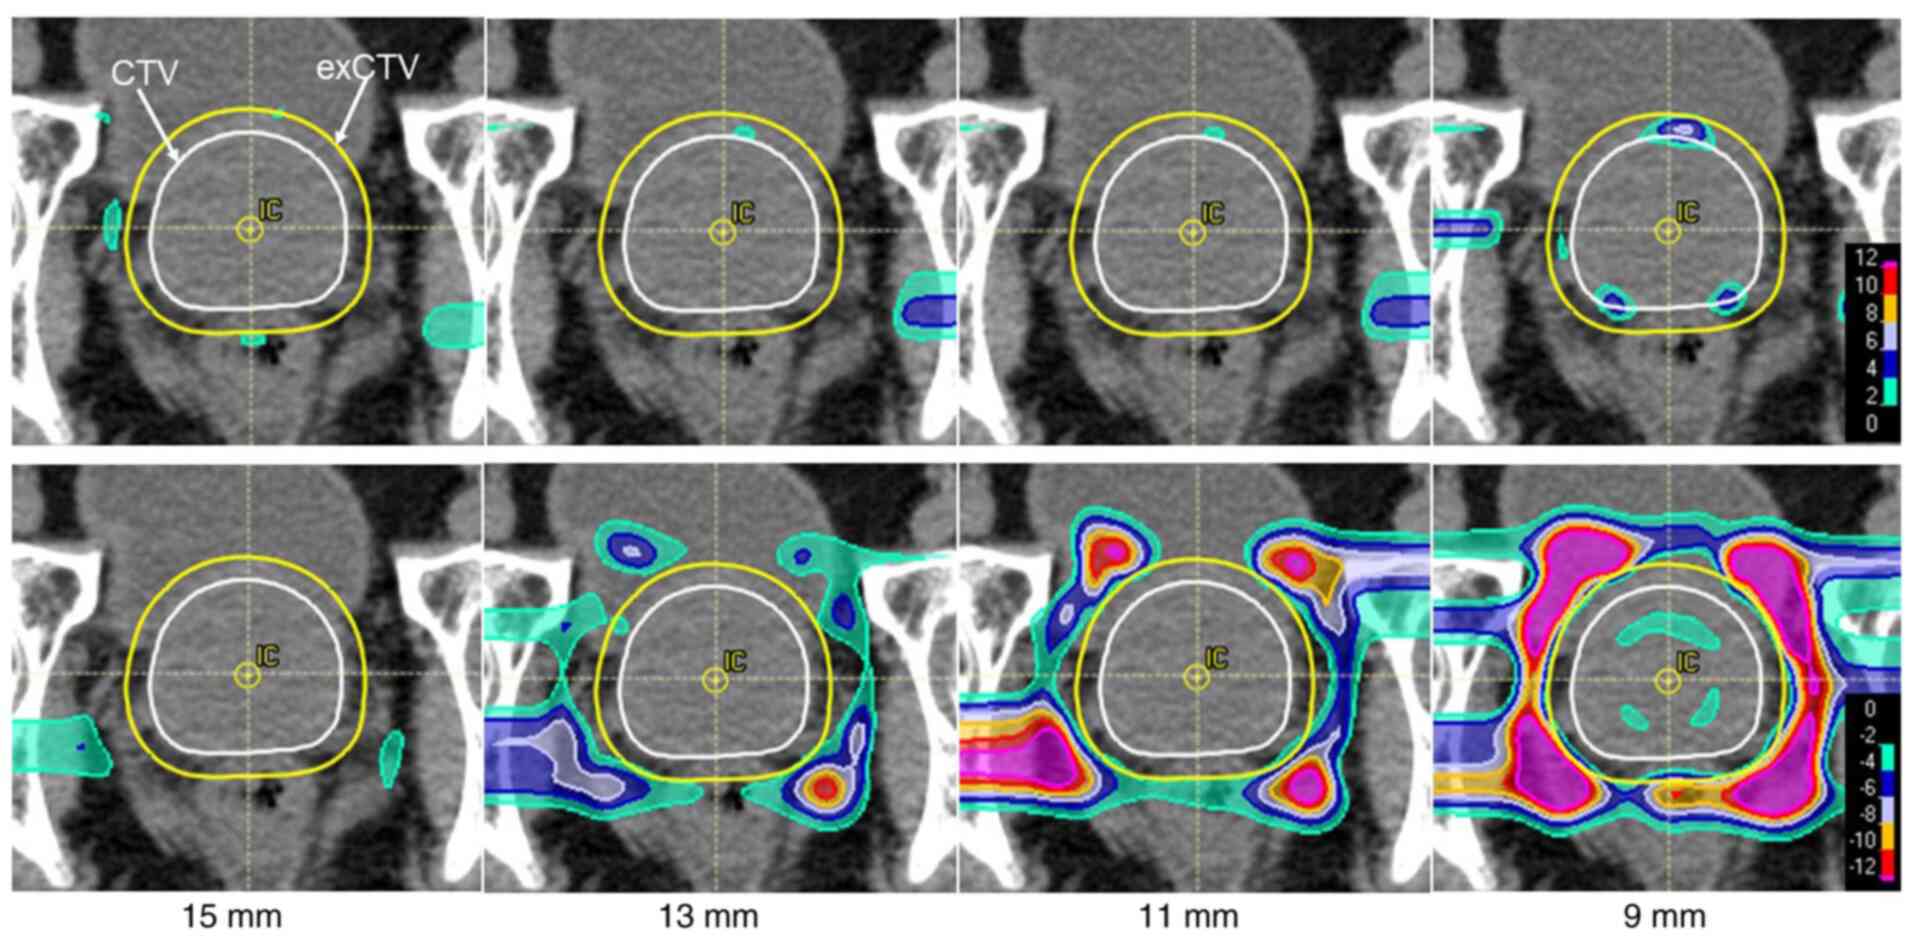
Case presentation
An 80-year-old man with prostate cancer. Deletion of
spots was continued to the level of 9 mm from the CTV via process
B. As the spot deletion range moved inward, the radiation doses to
the rectum and bladder decreased. Also, the elevated and reduced
dose distribution areas became mottled in the CTV and exCTV, which
caused dose inhomogeneities (Figs.
7 and 8).
Discussion
It is extremely important to reduce late adverse
events in the treatment of cancers with a long survival prognosis,
such as prostate cancer. Hou et al conducted a meta-analysis
of 6 large randomized trials that included a total of 2822
patients, and reported that Grade 2 or more severe late GI toxicity
occurred at a frequency of 18.6% in the cases receiving
conventional radiotherapy and at a frequency of 28% in the cases
receiving high-dose radiotherapy (23). They also reported that Grade 2 or
more severe late GU toxicity occurred at a frequency of 19.5% in
cases receiving conventional radiotherapy and at a frequency of
22.6% in cases receiving high-dose radiotherapy. In a more recent
trial, Jolnerovski et al reported that the frequencies of
Grade 2 or more severe late GI and GU toxicity at 5 years were 6.3
and 25.3% (24). They found from
subgroup analyses that the total radiation dose was associated with
the rate of GI toxicity and that the rate of GU toxicity was
associated with the Dmax and D2% (24). A close relationship exists between
the dose and late toxicities, and rectal toxicity is particularly
commonly associated with a higher dose volume (25-27).
We examined the V50 Gy (RBE) of the rectum and bladder
and V60 Gy (RBE) of the urethral bulb as an indicator of
high-dose volume besides Dmax in this study. Since the
CTV had robustness, it was difficult to reduce the Dmax
of the rectum, bladder, and urethral bulb in contact with the
prostate gland, but high dose volume could be reduced by process B.
Our results indicated that modification of the initial dose plan by
process B, which consisted of deletion of spots at a distance from
the CTV can efficiently diminish the high-dose volume of the rectum
and bladder, which would be expected to contribute to a reduced
likelihood of the occurrence of late toxicities.
To maintain dose homogeneity in the target, and
reduction of dose variations inside the target is necessary and hot
spots outside the target can be an obstacle (21,22).
The spots will inevitably occur outside the CTV for the reason the
irradiation dose around each spot is determined by the Gaussian
function and there is a distance between the spots and CTV has
robustness. As stated in Results, the INH showed substantial
increase with the use of process B. The change was particularly
prominent when spots that were 13-11 mm away from the CTV were
deleted. These results imply that extra spots at about 1 cm or more
for the CTV are necessary to maintain the dose homogeneity in the
target. On the other hand, use of process A, which deletes spots
with lower weighting depositions had not as remarkable change on
the INH as process B, thereby the risk of compromising the dose
homogeneity of the targe seems rather low.
Synchrotron-based pencil beam scanning delivery
systems are very complex and the beam delivery times are affected
by multiple variables. The beam delivery times include the layer
switch, spot switch, and spot spill times (28). As shown in Fig. 5 the number of layers was smaller in
process B than in process A. On the contrary, the number of spots
was smaller in process A than in process B. Considering that the
beam delivery time was much shorter in process B, it appears that
the beam delivery time is affected to a greater degree by the
number of deleted layers rather than by the number of deleted
spots. In fact, 2 patients in whom the beam delivery time was
shortened by more than 50 sec showed deletion of 2 and 4 layers,
respectively. The most important significance of beam delivery time
shortening is the possibility of stabilized daily practice of
treatment. Usually, patients are obliged to lay still during the
position set-up and beam delivery with patience while the urinary
bladder is filling up. As the treatment time progresses, it becomes
difficult to hold the desire for urination. Although not too often,
it becomes necessary in some cases to stop the radiation to allow
the patients to go to the bathroom to avoid leakage of urine in the
treatment room. Shortening trend of the beam delivery time, as by
the use of process B, can help in stabilizing the daily practice of
treatment. Another important benefit of beam delivery time
shortening is improvement of the throughput of facilities. In
Japan, according to a 2018 survey, approximately 1700 prostate
cancer patients are treated at 19 particle beam facilities (89.5
patients per facility on average; not disclosed in the data
collected by the particle beam medical facilities), which is
equivalent to 1879 treatment times by the 21-fraction protocol and
3400 times by the 38-fraction protocol per facility per year. The
possible extent of beam delivery time shortening by the use of
process A is 3 h in the 21-fraction protocol and 5.4 h in the
38-fraction protocol, and that by the use of process B is 13 h in
the 21-fraction protocol and 23.6 h in the 38-fraction
protocol.
Before we started this study, we thought that the
optimization operation would result in high-weighted deposition
spots becoming densely gathered inside the CTV and low-weighted
deposition spots becoming scattered sparsely outside the CTV.
However, actually, relatively high-weighted deposition spots for
each beam were located in the area beyond the CTV and relatively
low-weighted deposition spots were scattered in and around the CTV
as shown in Fig. 6. As stated in
Results, modification of the plan by process B was effective for
reducing the dose to the OAR, whereas that by process A had little
effect on the dose to the OAR, implying that relatively
low-weighted deposition spots are abundantly scattered not only
outside, but also inside the CTV after the optimization operation.
The merits of using process B are reduction of the dose volumes to
the OAR, while an important demerit is the loss of dose homogeneity
in the target. An optimal cutoff range should be determined based
on the priorities set by the attending physician. On the other
hand, use of process A seemed to have little clinical effect.
No study has attempted to improve the treatment
planning using the same methods as ours, but some studies have
focused on similar ideas. First, the challenge of the plan quality
using direct spot reduction. Researchers in Paul Scherrer
Institute, Switzerland reported spot reduction with their in-house
TPS which allowed randomly selected pencil beams with lower weights
to be excluded and revealed that the plan quality was maintained or
even improved using this technique (11,12).
They also compared it with the commercial TPS (Eclipse™)
and reported that the commercial TPS could cover the same target
volume by reducing the spots to 1/3 or less (29). Second, application of a collimator
and aperture system. The lateral size of a proton pencil beam, or
spot, is characterized by the Gaussian σ of the lateral
distribution. Past studies have shown that the quality of spot
scanning PBT strongly depends on the spot σ and spot placements
(13,14). The lateral penumbra of an
individual field of spot scanning beams is not usually sharper than
that of passively scattered beams (30,31).
The lateral penumbra can be reduced using a collimator and aperture
(13,15-17).
Moreover, Hyer et al developed a dynamic collimation system
which shaped the lateral extent of the beam separately for each
energy layer (6). This system
separates the target into individual layers and sets the collimator
individually, thus making it possible to reduce the penumbra of
each layer, even for complex-shaped targets. Third, combining beams
of various energies. Multiple energy extraction (MEE) is an
advanced technology which was originally developed at Heavy Ion
Medical Accelerator, Chiba, and has been incorporated in the
Hitachi's PBT system (32).
Younkin et al reported that MEE could shorten the beam
delivery time by an average of 35% as compared to conventional
method (18). The advantage of our
method is simple. The parameters for optimization can be set in a
large variety of combinations, but that also makes it difficult to
decide whether to continue with the plan optimization or accept the
current solution as the final treatment plan. The spot deletion
technique can be implemented in a few steps to easily and directly
approach the ideal dose distribution. Moreover, it can help in
achieving both OAR dose reduction and shortening of the beam
delivery time. In addition, it is extremely versatile in that a
commercial TPS can be used and that no special equipment or
expensive capital investment is needed.
Other than spot editing technique, spacer
implantation is known to reduce the dose of the rectum. The
SpaceOAR® System (Augmenix, Inc.) is the only Food and
Drug Administration-approved absorbable polyethylene glycol (PEG)
hydrogel available in the market that can be introduced between the
prostate gland and the rectum to decrease the toxicity and minimize
the changes in the quality of life (QOL) occurring after
radiotherapy for prostate cancer (33-35).
In Japan, it was approved for coverage by the National Health
Insurance in 2018. Space OAR implantation was already installed in
our hospital. We examined whether the process B could reduce the
dose of the rectum in 8 patients with space OAR implantation as
adding trial. As shown in the results, process B was able to reduce
V50 Gy (RBE) and Dmax of the rectum, and
D95 of the CTV was almost maintaind to the level of
100%. We consider this spots deleting technique can reduce the
irradiation dose of the rectum while maintaining the CTV dose even
patients with spce OAR is implanted.
Using this spots deletion technique, avoiding the
adverse events and maintaining of the patients' QOL is ideal. Late
adverse events which was radiation induced proctitis (grade 2 in
Common Terminology Criteria for Adverse Events, ver 4.0) were found
in 1 patient among the 12 patients who were treated before this
study using conventional method. While, 1 patients among the 30
patients of this study suffered from grade 2 radiation induced
procitis. Kobe Proton Center is a new facility and does not have
abundant data treated with conventional method. We plan to examine
the clinical usefulness of spots deletion technique with more
number of patients and longer follow-up periods, comparing with
some historical literature data.
Operation time is an issue that needs to be
considered and largely depends on the spot deletion procedure.
Process A can be implemented within a few seconds because
RayStation can delete spots with a weight greater than any
threshold value all at once with just one operation. On the other
hand, process B needs manual operation on the beams-eye-view image
that takes about 10-20 min and much labor. Automatic spot deletions
using parameter settings could make the process smooth and quick.
Spot editing still has room for improvement. We used only the spot
deleting technique in this study. Process B allowed dose reduction
to the OAR, but at the expense of the dose homogeneity at the
target. RayStation has the capability of editing each spot not only
by deleting, but also by adding, moving and multiplying the energy
levels. It is expected that with full use made of the many
available functions, more ideal planning can be accomplished.
We propose this spot deletion technique in that it
can directly reflect the physician's intentions in the treatment
plan, such as reducing the OAR dose while maintaining the CTV dose
with a simple operation even after optimization procedure.
In conclusion, modification of the treatment plan by
deleting the spots that are distant from the target can result in
dose reduction to the OAR in spot scanning PBT for prostate
cancer.
Acknowledgements
Not applicable.
Funding
Funding: This study was supported by the Grant-in-Aid for
Challenging Research of Exploratory (grant no. 21K19449).
Availability of data and materials
The datasets used and/or analyzed during the current
study are available from the corresponding author on reasonable
request.
Authors' contributions
NF, TH and TY conceived and designed the study. MM,
YD and TSu performed the simulation study for dose calculation. NF
and TSo analyzed the data and wrote the manuscript. NF and TSo
confirm the authenticity of all the raw data. All authors read and
approved the final manuscript.
Ethics approval and consent to
participate
All study procedures involving human participants
were conducted in accordance with the ethical standards of the Kobe
Proton Center research committee (Kobe, Japan) and in compliance
with the Declaration of Helsinki, and were approved by the Kobe
Proton Center institutional review board (approval no. 30-07).
Informed consent was waived as this was a retrospective simulation
study.
Patient consent for publication
Not applicable.
Competing interests
The authors declare that they have no competing
interests.
References
|
1
|
Lawrence JH, Tobias CA, Born JL, Linfoot
JA, Kling RP and Gottschalk A: Alpha and proton heavy particles and
the bragg peak in therapy. Trans Am Clin Climatol Assoc.
75:111–116. 1964.PubMed/NCBI
|
|
2
|
Bortfeld T and Schlegel W: An analytical
approximation of depth-dose distributions for therapeutic proton
beams. Phys Med Biol. 41:1331–1339. 1996.PubMed/NCBI View Article : Google Scholar
|
|
3
|
Schulte RW, Slater JD, Rossi CJ Jr and
Slater JM: Value and perspectives of proton radiation therapy for
limited stage prostate cancer. Strahlenther Onkol. 176:3–8.
2000.PubMed/NCBI View Article : Google Scholar
|
|
4
|
Nihei K, Ogino T, Onozawa M, Onozawa M,
Murayama S, Fuji H, Murakami M and Hishikawa Y: Multi-institutional
phase II study of proton beam therapy for organ-confined prostate
cancer focusing on the incidence of late rectal toxicities. Int J
Radiat Oncol Biol Phys. 81:390–396. 2011.PubMed/NCBI View Article : Google Scholar
|
|
5
|
Royce TJ and Efstathiou JA: Proton therapy
for prostate cancer: A review of the rationale, evidence, and
current state. Urol Oncol. 37:628–636. 2019.PubMed/NCBI View Article : Google Scholar
|
|
6
|
Hyer DE, Hill PM, Wang D, Smith BR and
Flynn RT: A dynamic collimation system for penumbra reduction in
spot-scanning proton therapy: Proof of concept. Med Phys.
41(091701)2014.PubMed/NCBI View Article : Google Scholar
|
|
7
|
DeLaney TF: Proton therapy in the clinic.
Front Radiat Ther Oncol. 43:465–485. 2011.PubMed/NCBI View Article : Google Scholar
|
|
8
|
Bert C and Durante M: Motion in
radiotherapy: Particle therapy. Phys Med Biol. 56:R113–R144.
2011.PubMed/NCBI View Article : Google Scholar
|
|
9
|
Pugh TJ, Munsell MF, Choi S, Nguyen QN,
Mathai B, Zhu XR, Sahoo N, Gillin M, Johnson JL, Amos RA, et al:
Quality of life and toxicity from passively scattered and
spot-scanning proton beam therapy for localized prostate cancer.
Int J Radiat Oncol Biol Phys. 87:946–953. 2013.PubMed/NCBI View Article : Google Scholar
|
|
10
|
Widesott L, Pierelli A, Fiorino C, Lomax
AJ, Amichetti M, Cozzarini C, Soukup M, Schneider R, Hug E, Di
Muzio N, et al: Helical tomotherapy vs. intensity-modulated proton
therapy for whole pelvis irradiation in high-risk prostate cancer
patients: Dosimetric, normal tissue complication probability, and
generalized equivalent uniform dose analysis. Int J Radiat Oncol
Biol Phys. 80:1589–1600. 2011.PubMed/NCBI View Article : Google Scholar
|
|
11
|
van de Water S, Kraan AC, Breedveld S,
Schillemans W, Teguh DN, Kooy HM, Madden TM, Heijmen BJ and
Hoogeman MS: Improved efficiency of multi-criteria IMPT treatment
planning using iterative resampling of randomly placed pencil
beams. Phys Med Biol. 58:6969–6983. 2013.PubMed/NCBI View Article : Google Scholar
|
|
12
|
van de Water S, Safai S, Schippers JM,
Weber DC and Lomax AJ: Towards FLASH proton therapy: The impact of
treatment planning and machine characteristics on achievable dose
rates. Acta Oncol. 58:1463–1469. 2019.PubMed/NCBI View Article : Google Scholar
|
|
13
|
Wang D, Smith BR, Gelover E, Flynn RT and
Hyer DE: A method to select aperture margin in collimated spot
scanning proton therapy. Phys Med Biol. 60:N109–N119.
2015.PubMed/NCBI View Article : Google Scholar
|
|
14
|
Meier G, Leiser D, Besson R, Mayor A,
Safai S, Weber DC and Lomax AJ: Contour scanning for penumbra
improvement in pencil beam scanned proton therapy. Phys Med Biol.
62:2398–2416. 2017.PubMed/NCBI View Article : Google Scholar
|
|
15
|
Winterhalter C, Meier G, Oxley D, Weber
DC, Lomax AJ and Safai S: Contour scanning, multi-leaf collimation
and the combination thereof for proton pencil beam scanning. Phys
Med Biol. 64(015002)2018.PubMed/NCBI View Article : Google Scholar
|
|
16
|
Bues M, Newhauser WD, Titt U and Smith AR:
Therapeutic step and shoot proton beam spot-scanning with a
multi-leaf collimator: A Monte Carlo study. Radiat Prot Dosimetry.
115:164–169. 2005.PubMed/NCBI View Article : Google Scholar
|
|
17
|
Dowdell SJ, Clasie B, Depauw N, Metcalfe
P, Rosenfeld AB, Kooy HM, Flanz JB and Paganetti H: Monte Carlo
study of the potential reduction in out-of-field dose using a
patient-specific aperture in pencil beam scanning proton therapy.
Phys Med Biol. 57:2829–2842. 2012.PubMed/NCBI View Article : Google Scholar
|
|
18
|
Younkin JE, Bues M, Sio TT, Liu W, Ding X,
Keole SR, Stoker JB and Shen J: Multiple energy extraction reduces
beam delivery time for a synchrotron-based proton spot-scanning
system. Adv Radiat Oncol. 3:412–420. 2018.PubMed/NCBI View Article : Google Scholar
|
|
19
|
Zhang X, Penagaricano J, Narayanasamy G,
Corry P, Liu T, Sanjay M, Paudel N and Morrill S: Helical
tomotherapy to LINAC plan conversion utilizing RayStation Fallback
planning. J Appl Clin Med Phys. 18:178–185. 2017.PubMed/NCBI View Article : Google Scholar
|
|
20
|
International Commission on Radiation
Units & Measurements (ICRU): Prescribing, recording, and
reporting proton-beam therapy. ICRU 7: Report 78. ICRU, Bethesda,
MD, 2007.
|
|
21
|
Zhu XR, Poenisch F, Li H, Zhang X, Sahoo
N, Wu RY, Li X, Lee AK, Chang EL, Choi S, et al: A single-field
integrated boost treatment planning technique for spot scanning
proton therapy. Radiat Oncol. 9(202)2014.PubMed/NCBI View Article : Google Scholar
|
|
22
|
Kirk ML, Tang S, Zhai H, Vapiwala N,
Deville C, James P, Bekelman JE, Christodouleas JP, Tochner Z and
Both S: Comparison of prostate proton treatment planning technique,
interfraction robustness, and analysis of single-field treatment
feasibility. Pract Radiat Oncol. 5:99–105. 2015.PubMed/NCBI View Article : Google Scholar
|
|
23
|
Hou Z, Li G and Bai S: High dose versus
conventional dose in external beam radiotherapy of prostate cancer:
A meta-analysis of long-term follow-up. J Cancer Res Clin Oncol.
141:1063–1071. 2015.PubMed/NCBI View Article : Google Scholar
|
|
24
|
Jolnerovski M, Salleron J, Beckendorf V,
Peiffert D, Baumann AS, Bernier V, Huger S, Marchesi V and Chira C:
Intensity-modulated radiation therapy from 70 to 80Gy in prostate
cancer: Six-year outcomes and predictors of late toxicity. Radiat
Oncol. 12(99)2017.PubMed/NCBI View Article : Google Scholar
|
|
25
|
Thor M, Deasy JO, Paulus R, Robert Lee W,
Amin MB, Bruner DW, Low DA, Shah AB, Malone SC, Michalski JM, et
al: Tolerance doses for late adverse events after hypofractionated
radiotherapy for prostate cancer on trial NRG oncology/RTOG 0415.
Radiother Oncol. 135:19–24. 2019.PubMed/NCBI View Article : Google Scholar
|
|
26
|
Colaco RJ, Hoppe BS, Flampouri S, McKibben
BT, Henderson RH, Bryant C, Nichols RC, Mendenhall WM, Li Z, Su Z,
et al: Rectal toxicity after proton therapy for prostate cancer: An
analysis of outcomes of prospective studies conducted at the
university of Florida proton therapy institute. Int J Radiat Oncol
Biol Phys. 91:172–181. 2015.PubMed/NCBI View Article : Google Scholar
|
|
27
|
Boladeras A, Ferrer F, Navarro V, De Blas
R, Cunillera O, Mateo D, Gutierrez C, Martinez E, Villà S, Pera J,
et al: Association between EBRT dose volume histograms and quality
of life in prostate cancer patients. Rep Pract Oncol Radiother.
23:360–368. 2018.PubMed/NCBI View Article : Google Scholar
|
|
28
|
Shen J, Tryggestad E, Younkin JE, Keole
SR, Furutani KM, Kang Y, Herman MG and Bues M: Technical note:
Using experimentally determined proton spot scanning timing
parameters to accurately model beam delivery time. Med Phys.
44:5081–5088. 2017.PubMed/NCBI View
Article : Google Scholar
|
|
29
|
Rosas S, Belosi FM, Bizzocchi N, Böhlen T,
Zepter S, Morach P, Lomax AJ, Weber DC and Hrbacek J: Benchmarking
a commercial proton therapy solution: The paul scherrer institut
experience. Br J Radiol. 93(20190920)2020.PubMed/NCBI View Article : Google Scholar
|
|
30
|
Schippers JM and Lomax AJ: Emerging
technologies in proton therapy. Acta Oncol. 50:838–850.
2011.PubMed/NCBI View Article : Google Scholar
|
|
31
|
Engelsman M, Schwarz M and Dong L: Physics
controversies in proton therapy. Semin Radiat Oncol. 23:88–96.
2013.PubMed/NCBI View Article : Google Scholar
|
|
32
|
Mizushima K, Katagiri K, Iwata Y, Furukawa
T, Fujimoto T, Sato S, Hara Y, Shirai T and Noda K: Experimental
studies of systematic multiple-energy operation at HIMAC
synchrotron. Nucl Instrum Methods Phys Res Sec B. 331:243–247.
2014.
|
|
33
|
Hamstra DA, Mariados N, Sylvester J, Shah
D, Karsh L, Hudes R, Beyer D, Kurtzman S, Bogart J, His RA, et al:
Continued benefit to rectal separation for prostate radiation
therapy: Final results of a phase III trial. Int J Radiat Oncol
Biol Phys. 97:976–985. 2017.PubMed/NCBI View Article : Google Scholar
|
|
34
|
Karsh LI, Gross ET, Pieczonka CM, Aliotta
PJ, Skomra CJ, Ponsky LE, Nieh PT, Han M, Hamstra DA and Shore ND:
Absorbable hydrogel spacer use in prostate radiotherapy: A
comprehensive review of phase 3 clinical trial published data.
Urology. 115:39–44. 2018.PubMed/NCBI View Article : Google Scholar
|
|
35
|
Wei JT, Dunn RL, Litwin MS, Sandler HM and
Sanda MG: Development and validation of the expanded prostate
cancer index composite (EPIC) for comprehensive assessment of
health-related quality of life in men with prostate cancer.
Urology. 56:899–905. 2000.PubMed/NCBI View Article : Google Scholar
|