Introduction
Thyroid nodule is usually benign tumor that is
commonly noticed in clinical practice and often in incidental
findings while doing ultrasound. The detection rate can be as high
as 68% (1,2), of which only 5% of thyroid nodules
are malignant (3,4). A recent study reported that in 2020
~580,000 patients were diagnosed with thyroid cancer globally,
accounting for 3.0% out of all new cancers in a year, with 43,000
patients succumbing due to thyroid cancer (5). Ultrasound, a non-invasive and
inexpensive medical examination, is commonly used to screen for
thyroid diseases (6-9).
The Thyroid Imaging Reporting and Data System (TI-RADS) is used in
clinical practice for reporting and differentiating benign and
malignant thyroid nodules based on ultrasound imaging features.
Tongue diagnosis has thousand-years of history in
China, which is an important part of the diagnostic method of
traditional Chinese medicine. Empirical clinical practice and
academic research had proved that the occurrence and development of
disease is often accompanied with the changes of tongue, which is
indicative of the severity of the disease (10-14).
For example, Chen et al (15) found that the tongue image parameter
S value is larger, the RGB color component value is smaller among
hypertensive patients with cracked tongue compared with normal
group. Qian et al (16)
found that the RGB value, H value and V value of tongue color and
moss color in gastric tumor patients were higher than those in the
normal group, while the S value and H value of tongue color were
lower than those in the normal group.
Tongue image observation may provide useful
information of the features of thyroid nodule malignancy. The
present study evaluated the relationship between the parameters of
patients' tongue images and TI-RADS classification of thyroid
nodule to determine the effectiveness of using tongue images in
differentiating the benign and malignant thyroid nodules.
Materials and methods
Source of cases
Patients who underwent physical examination and were
diagnosed with thyroid nodule in the Affiliated Hospital of Chengdu
University of Traditional Chinese Medicine (Guangzhou, China) from
December 2018 to December 2020 were included. The studies involving
human participants were reviewed and approved (approval no.
2018KL-050) by The Affiliated Hospital of Chengdu University of
Traditional Chinese Medicine (Guangzhou, China). Written informed
consent was provided by all the patients/participants to
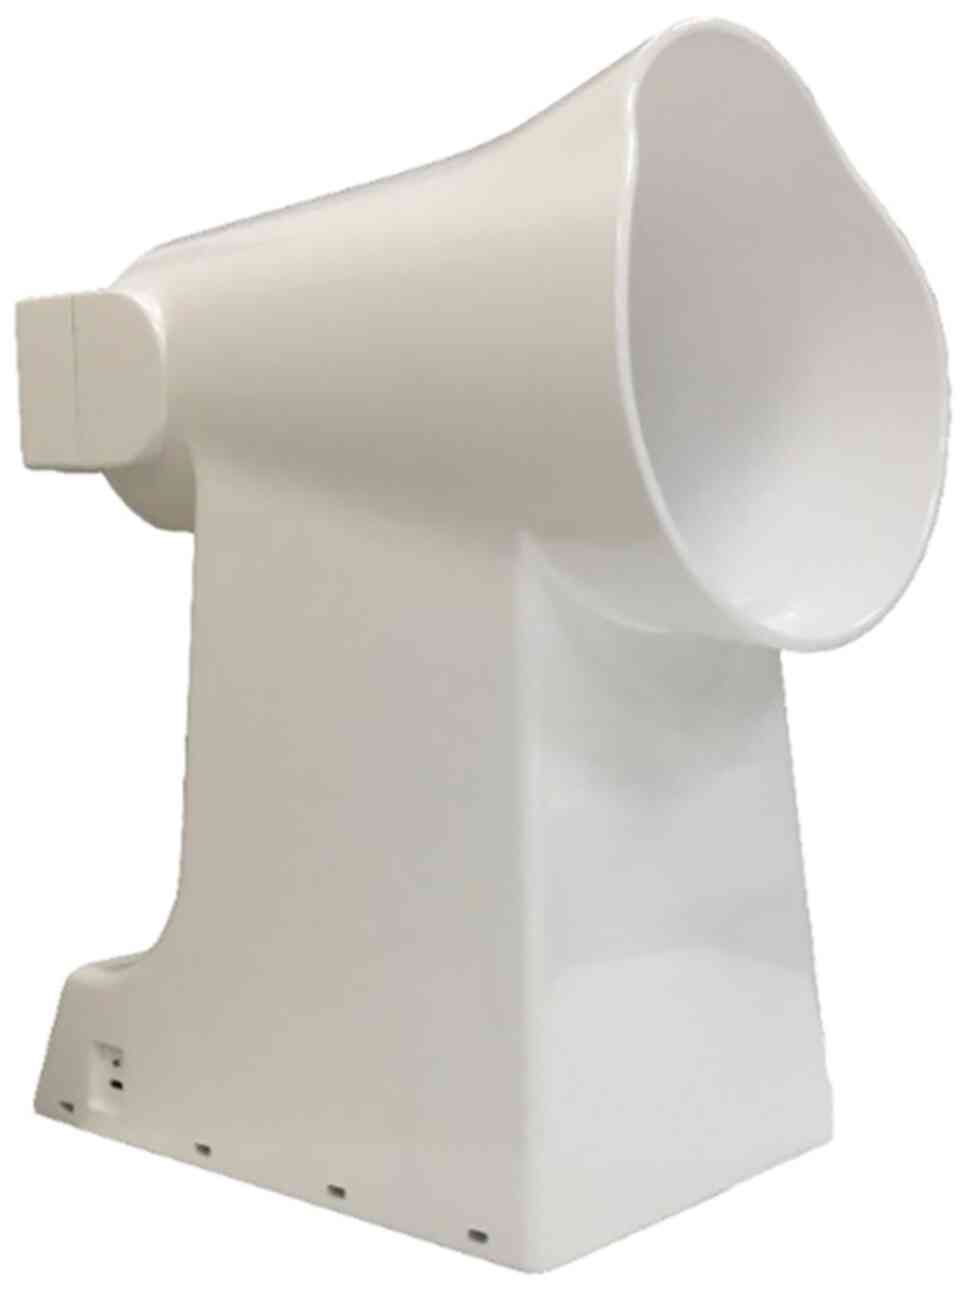
participate in the present study. The acquisition instrument that
was used to collect tongue images, was the TFDA-1 digital
tongue-face diagnostic instrument developed by Shanghai University
of Traditional Chinese Medicine (Fig.
1), which mainly includes Charge coupled Device equipment, LED
light source, light mask, and curved reflective mask. The color
temperature of LED lamp is 5,000 K, and the color rendering index
is 97. The camera settings were as follows: M mode, shutter 1/125,
aperture F6.3, ISO 200, central key metering. The collection time
was between 8:00 and 12:00 am, Monday to Friday, from December 2018
to December 2020. The risk of malignancy of thyroid nodules was
determined using TI-RADS criteria based on the American College of
Radiology (ACR) Thyroid Imaging Reporting and Data System published
in 2017(2). Diagnostic criteria
were as follows: Inclusion criteria for patients with thyroid
nodules included: i) Age (≥18 and ≤75 years); ii) healthy people
who did not suffer from any acute or chronic diseases in the prior
3 months before entering the study, and have confirmed thyroid
nodules with risk of malignancy determined by the TI-RADS
classification in the physical examination report; iii) patient can
complete tongue image acquisition independently; and iv)
voluntarily consent to tongue image acquisition and analysis and
sign the informed consent. Exclusion criteria included: i) Eating
colored food and drugs within 2 h before tongue image acquisition
due to potential impact on the tongue image judgment of reviewers;
ii) Tthe basic information (sex, age, height, weight) and
experimental data were incomplete; (ii) suffering from serious
heart, brain, kidney diseases or other serious diseases; iv)
patients suffering severe symptoms of depression and anxiety; v)
patients with hypertension, diabetes, anemia and other diseases
affecting the tongue image accuracy: and vi) pregnant and lactating
women.
Tongue image acquisition method: i) Researchers
disinfected the outer ring and inner ring of the tongue surface
examination instrument with 75% alcohol. At the same time, the
light source and parameters of the instrument were checked to
ensure it meeting the acquisition requirements. After the physical
examination patient arrived at the clinic, relevant communication
was conducted to eliminate the patient's concerns about collection,
and relevant matters needing attention were explained. Patients
were then invited to participate in the collection and informed
consent was provided to them.
ii) After a 5-10 min resting, patients were asked to
wear medical earphones, and slightly forwarded their body, and put
their mandible on the tongue diagnosis instrument (jaw does not
exceed the built-in damper), the researchers opened the built-in
light and ensured that no mist covered the camera and patients'
forehead was not covered by hair. Then the patient was instructed
to extend the tongue outside of the mouth, and the tongue body was
kept relaxed with the tip of the tongue pointing down. The surface
of the tongue was intact, flattened, and relaxed, and tongue images
were collected.
Tongue image segmentation and
analysis
The tongue diagnosis analysis system (Tongue
Diagnosis Analysis System, TDAS version 2.0) developed by the
Intelligent Diagnostic Technology Research Laboratory of Shanghai
University of Traditional Chinese Medicine completed the
segmentation and analysis of the tongue image. TDAS 2.0 system can
be used calculate the component values of tongue substance and
tongue coating in RGB, HIS, Lab and YCrCb color Spaces, as well as
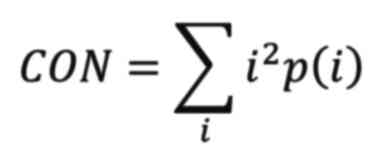
Contrast (CON) and Entropy (ENT), Angular Second Moment (ASM) and
MEAN (MEAN), and two coating thickness indexes, perAll and
perPart.
RGB
RGB color space, based on the three basic colors
R(Red), G(Green), B(Blue), superposition in different degrees to
produce rich and extensive colors, also known as the three primary
color mode. It is a unit length cube to represent color, eight
vertices are eight common colors (black, blue, green, red, cyan,
purple, yellow and white), generally put black at the origin of the
three-dimensional cartesian coordinate system, the three axes are
red, blue and green three colors. The value of each parameter
ranges from: R: 0-255. G: 0-255; B: 0-255.
Lab
It indicates the Lab color space. L (lightness)
indicates the color space from pure black to pure white, and the
value range is 0-100. The value of 0 represents pure black and 100
represents pure white. A and B represent the green-red axis and the
blue-yellow axis respectively, and their value ranges from 127 to
minus (-)128. Lab IS a device-independent, physiology-based color
system that uses digital methods to describe human visual
perception.
YCrCb
YUV orthogonal color space, Y represents brightness,
U and V represent chroma, which is used to describe the image color
and saturation for specified pixels of color. ‘Brightness’ is
established through the RGB input signal. ‘Chroma’ is defined by
two aspects of color-hue and saturation-, denoted by Cr and Cb,
respectively. Cr reflects the difference between the red part of
RGB input signal and the brightness value of RGB signal. Cb
reflects the difference between the blue part of RGB input signal
and the brightness value of RGB signal.
HIS
Cognitive color space. Starting from human visual
system, colors are described by H (hue), S (color saturation) and I
(brightness). Color model describes color characteristics by H, S
and I, where H defines the wavelength of color, also known as hue.
S represents the depth of the color, known as saturation; I
represents intensity or brightness.
Contrast (CON)
It reflects the sharpness and depth of texture
grooves of an image. The deeper the texture furrow, the greater the
contrast and the clearer the visual effect. On the contrary, the
smaller the contrast, the shallower the furrow, and the image is
blurred.
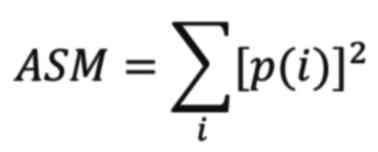
Angular Second Moment (ASM)
ASM reflects the uniformity of image gray
distribution and texture thickness. If all values are equal, then
ASM value is small. Conversely, if some of these values are large
and others are small, then ASM value is large. Large ASM values
indicate a more uniform and regularly varying texture pattern.
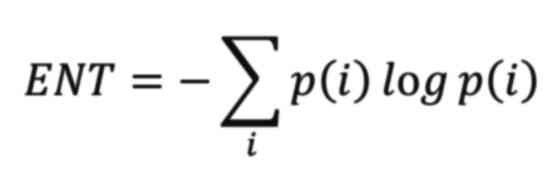
Entropy (ENT)
ENT is a measure of the amount of information in an
image. Texture information also belongs to the information of an
image and is a random measure. When all elements in the
co-occurrence matrix have the largest randomness and all values in
the spatial co-occurrence matrix are almost equal, and the
distributions of elements in the co-occurrence matrix are
dispersed, the entropy is large. It represents the non-uniformity
or complexity of the texture of the image.
Mean: indicates the average gray value of the
image.
PerAll is the ratio of tongue coating area to total
tongue area (perAll=tongue coating area/total tongue area). PerPart
is the ratio of coated tongue area to uncoated tongue area
(perPart=coated tongue area/uncoated tongue area).
Data cleaning
Demographic data of patients, medical and clinical
characteristics were extracted from the databases of Physical
examination Center of Chengdu university of traditional Chinese
medicine hospital and collated in Microsoft Excel spreadsheet,
which were further merged with the tongue image analysis results
using TDAS 2.0 System.
Statistical analysis
The statistical software used in the present study
was SPSS 24.0 (IBM Corp.) and P<0.05 was considered to indicate
a statistically significant difference. Data was summarized by the
mean ± standard deviation and median (interquartile range)
according to the normality of the data distribution. For group
comparisons, independent sample t-test (unpaired) or non-parametric
test (Mann-Whitney U test) was used according to the data
distribution. Chi-square (χ2) test was used to analyze
the difference of constituent ratio between different groups. For
the analysis of influencing factors, logistic regression was
selected for binary outcome variables and linear regression was
selected for continuous outcome variables. One-way variance linear
trend analysis was used for trend analysis among multiple
groups.
Results
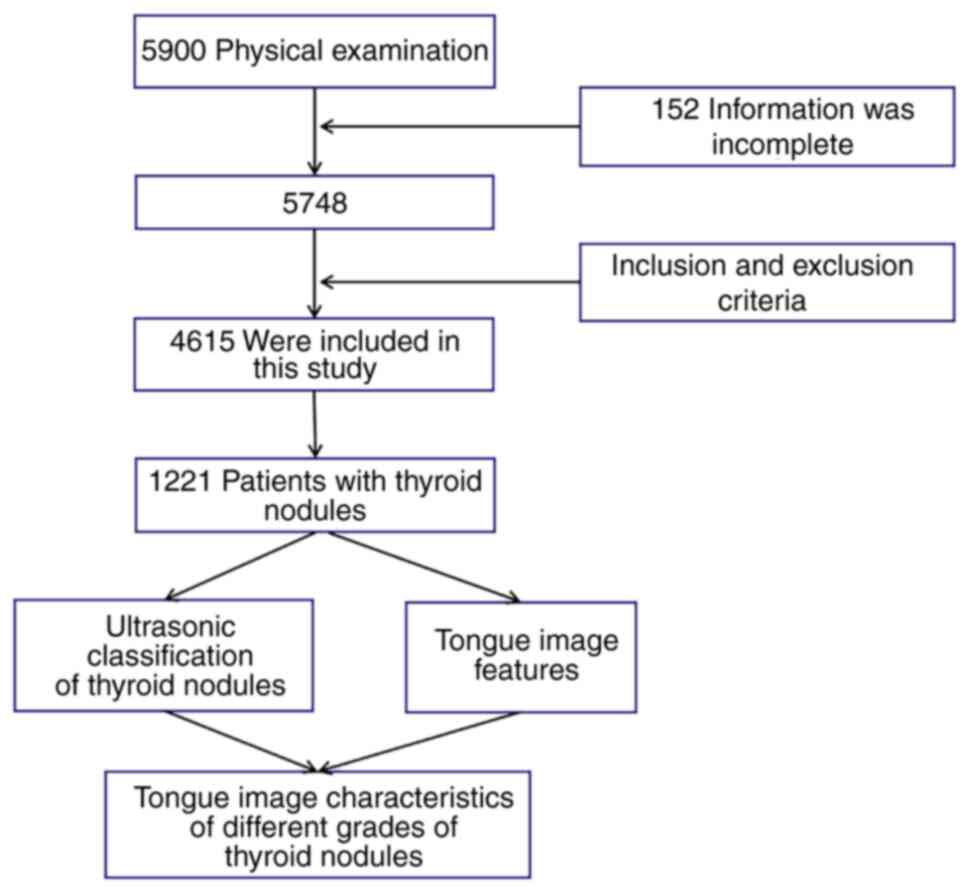
A total of 5,900 cases were collected in the present
study; 152 cases were excluded due to lack of information, leaving
5,748 cases included in the final analysis. According to the
inclusion and exclusion criteria, 1,221 patients with thyroid
nodules were screened (Fig. 2),
including 476 males and 745 females (Table I), with a median age of 45 (range,
32-56) years. Patients with thyroid nodules were divided into three
groups according to TI-RADS classification. There were 417 cases in
TI-RADS 2 group, 693 cases in TI-RADS 3 group, and 111 cases in the
TI-RADS 4 group (including TI-RADS 4A, TI-RADS 4B, TI-RADS 4C and
TI-RADS 5). For patients with two or more thyroid nodules,
classification was made according to the nodule with the highest
risk; for example, if a patient had both TI-RADS 2 and TI-RADS 3
nodules, he/she were classified into TI-RADS Category 3 group.
 | Table ITI-RADS classification by sex. |
Table I
TI-RADS classification by sex.
| | Sex | |
|---|
| Classification | Male
(percentage) | Female
(percentage) | c2 | P-value |
|---|
| Classification of
thyroid nodules | TI-RADS 2 | 176 (42.2%) | 241 (57.8%) | 4.053 | 0.132 |
| | TI-RADS 3 | 264 (38.1%) | 429 (61.9%) | | |
| | TI-RADS 4 | 36 (32.4%) | 75 (67.6%) | | |
| Total | | 476 (39.0%) | 745 (61.0%) | | |
The distribution of all of the tongue image indexes
in the present study were skewed, and the tongue image indexes of
different TI-RADS classification were compared by non-parametric
test (Table II). According to the
comparison results, the tongue image indexes zhiCon, zhiASM,
zhiENT, zhiMEAN, zhiClrB, zhiClrR, zhiClrG, zhiClrI, zhiClrL and
zhiClrY were significantly different among the three groups
(P<0.05).
| Table IITongue image feature table of
different TI-RADS categories of thyroid nodules (without
considering confounding factors). |
Table II
Tongue image feature table of
different TI-RADS categories of thyroid nodules (without
considering confounding factors).
| | Classification of
thyroid nodules | |
|---|
| Tongue image
index | TI-RADS 2 | TI-RADS 3 | TI-RADS 4 | c2 | P-value |
|---|
| zhiR | 0.448
(0.437~0.457) | 0.448
(0.44~0.458) | 0.447
(0.438~0.459) | 2.948 | 0.229 |
| zhiG | 0.275
(0.269~0.281) | 0.275
(0.269~0.28) | 0.275
(0.268~0.282) | 0.845 | 0.656 |
| taiR | 0.416
(0.406~0.427) | 0.417
(0.408~0.426) | 0.417
(0.409~0.425) | 0.513 | 0.774 |
| taiG | 0.293
(0.287~0.298) | 0.293
(0.289~0.298) | 0.293
(0.287~0.298) | 0.549 | 0.76 |
| perAll | 0.368
(0.29~0.429) | 0.37
(0.302~0.424) | 0.376
(0.307~0.437) | 0.285 | 0.867 |
| perPart | 0.682
(0.603~0.877) | 0.696
(0.595~0.87) | 0.676
(0.592~0.8) | 0.313 | 0.855 |
| zhiCon | 87.995
(72.517~111.77) | 92.707
(73.414~117.174) | 100.034
(79.859~116.422) | 7.178 | 0.028 |
| taiCon | 113.679
(88.826~145.044) | 117.929
(91.615~152.239) | 115.5
(87.571~140.689) | 5.056 | 0.08 |
| zhiASM | 0.066
(0.058~0.075) | 0.065
(0.057~0.074) | 0.063
(0.057~0.07) | 8.179 | 0.017 |
| zhiENT | 1.257
(1.21~1.311) | 1.267
(1.214~1.323) | 1.286
(1.229~1.323) | 7.347 | 0.025 |
| zhiMEAN | 0.029
(0.026~0.033) | 0.03
(0.027~0.034) | 0.031
(0.028~0.034) | 7.706 | 0.021 |
| taiASM | 0.057
(0.051~0.066) | 0.056
(0.05~0.064) | 0.058
(0.051~0.066) | 4.098 | 0.129 |
| taiENT | 1.314
(1.258~1.371) | 1.324
(1.266~1.378) | 1.316
(1.252~1.361) | 4.637 | 0.098 |
| taiMEAN | 0.034
(0.03~0.038) | 0.034
(0.03~0.039) | 0.034
(0.029~0.037) | 4.711 | 0.095 |
| zhiClrB | 99 (94~104) | 97 (92~102) | 98 (93~103) | 12.81 | 0.002 |
| zhiClrR | 159 (155~163) | 157.5
(153~161) | 159 (155~163) | 17.27 | <0.001 |
| zhiClrG | 97 (92~102) | 97 (91~101) | 97 (92~103) | 7.241 | 0.027 |
| taiClrR | 149 (141~155) | 148 (140~155) | 150 (141~154) | 0.414 | 0.813 |
| taiClrG | 105 (96~113) | 105 (95~112) | 105 (96~113) | 0.323 | 0.851 |
| taiClrB | 104
(95.25~112) | 104 (94~111) | 104 (96~111) | 1.138 | 0.566 |
| zhiClrH | 355.889
(1.689~358.045) | 355.142
(1.718~357.763) | 353.413
(0.91~357.581) | 2.59 | 0.274 |
| zhiClrI | 118 (114~122) | 117 (112~121) | 118 (114~122) | 13.036 | 0.001 |
| zhiClrS | 0.181
(0.164~0.195) | 0.183
(0.169~0.198) | 0.181
(0.165~0.195) | 5.069 | 0.079 |
| taiClrH | 5.436
(1.369~356.802) | 5.076
(1.504~356.329) | 4.044
(2.156~354.564) | 0.905 | 0.636 |
| taiClrI | 120 (111~126) | 119 (110~126) | 120 (110~125) | 0.597 | 0.742 |
| taiClrS | 0.133
(0.115~0.149) | 0.133
(0.118~0.152) | 0.135
(0.125~0.148) | 2.057 | 0.358 |
| zhiClrL | 48.151
(46.541~49.749) | 47.746
(45.812~49.253) | 48.161
(46.515~49.658) | 11.052 | 0.004 |
| zhiClrLa | 24.931
(23.005~26.711) | 24.666
(23.203~26.314) | 24.568
(22.939~26.793) | 1.06 | 0.589 |
| zhiClrLb | 9.803
(8.384~11.159) | 10.037
(8.55~11.36) | 10.233
(8.972~11.504) | 3.522 | 0.172 |
| taiClrL | 49.119
(45.334~51.661) | 48.676
(45.115~51.572) | 49.096
(45.314~51.497) | 0.388 | 0.824 |
| taiClrLa | 17.19
(15.498~19.087) | 17.232
(15.651~18.638) | 17.452
(16.059~18.9) | 0.918 | 0.632 |
| taiClrLb | 7.212
(6.146~8.542) | 7.378
(6.169~8.833) | 7.864
(6.416~8.99) | 3.776 | 0.151 |
| zhiClrY | 115.583
(111.976~119.224) | 114.66
(110.483~118.151) | 115.665
(111.997~119.063) | 10.96 | 0.004 |
| zhiClrCr | 154.715
(152.75~156.335) | 154.435
(153.038~156.049) | 154.424
(152.821~156.181) | 0.835 | 0.659 |
| zhiClrCb | 119.54
(118.521~120.573) | 119.535
(118.371~120.43) | 119.255
(118.223~120.276) | 2.935 | 0.231 |
| taiClrY | 117.825
(109.758~123.442) | 116.966
(109.283~123.221) | 117.9
(109.648~122.89) | 0.407 | 0.816 |
| taiClrCr | 146.958
(145.426~148.699) | 147.101
(145.64~148.418) | 147.243
(145.854~148.561) | 1.009 | 0.604 |
| taiClrCb | 121.335
(120.309~122.229) | 121.322
(120.166~122.214) | 120.891
(120.018~122.066) | 4.196 | 0.123 |
Additional analysis found that age, sex, body mass
index (BMI), smoking and drinking also affected the prevalence of
thyroid nodules and tongue images. Results from analysis using
multiple linear regression adjusting for age, sex, BMI, smoking and
drinking dealt as confounding factors, for index with statistical
differences are shown in Table
III.
| Table IIIMultiple linear regression of tongue
image indicators with statistical differences in Table II (with TI-RADS 2 as the
reference). |
Table III
Multiple linear regression of tongue
image indicators with statistical differences in Table II (with TI-RADS 2 as the
reference).
| | Sex | Smoking | Drinking | TI-RADS |
|---|
| Tongue image
index | Age B/P | Body mass Index
B/P | Male B | Female B/P | Yes B | No B/P | Yes B | No B/P | 2 B | 3 B/P | 4 B/P |
|---|
| zhiCon | 0.175/0.008 | -0.088/0.636 | 0 | -6.274/0.007 | 0 | -5.195/0.071 | 0 | -5.176/0.056 | 0 | 2.5/0.219 | 8.183/0.016 |
| zhiASM | <0.001/0.07 | <0.001/0.97 | 0 | 0.003/0.098 | 0 | 0.001/0.781 | 0 | 0.003/0.081 | 0 | -0.002/0.137 | -0.005/0.035 |
| zhiENT |
<0.001/0.034 |
<0.001/0.704 | 0 | -0.015/0.015 | 0 | -0.006/0.415 | 0 | -0.015/0.029 | 0 | 0.007/0.165 | 0.022/0.015 |
| zhiMEAN |
<0.001/0.015 |
<0.001/0.526 | 0 | -0.001/0.012 | 0 | -0.001/0.077 | 0 | -0.001/0.031 | 0 |
<0.001/0.214 | 0.001/0.007 |
| zhiClrB |
-0.081<0.001 | 0.095/0.085 | 0 | -0.173/0.801 | 0 | -1.726/0.042 | 0 | -1.771/0.027 | 0 | -1.367/0.023 | -0.429/0.669 |
| zhiClrR |
-0.088/<0.001 | 0.01/0.856 | 0 | 1.571/0.022 | 0 | 0.12/0.888 | 0 | -0.703/0.38 | 0 | -1.186/0.049 | -0.199/0.843 |
| zhiClrG | -0.032/0.09 | 0.041/0.454 | 0 |
2.375/<0.001 | 0 | -1.312/0.117 | 0 | -1.449/0.066 | 0 | -1.211/0.041 | -0.018/0.986 |
| zhiClrI |
-0.068/<0.001 | 0.051/0.327 | 0 | 1.249/0.053 | 0 | -0.966/0.227 | 0 | -1.316/0.08 | 0 | -1.24/0.028 | -0.181/0.849 |
| zhiClrL | -0.021/0.005 | 0.014/0.508 | 0 | 0.75/0.003 | 0 | -0.335/0.292 | 0 | -0.479/0.11 | 0 | -0.478/0.034 | -0.036/0.923 |
| zhiClrY | -0.045/0.005 | 0.033/0.472 | 0 | 1.567/0.006 | 0 | -0.798/0.258 | 0 | -1.096/0.099 | 0 | -1.081/0.03 | -0.102/0.903 |
In the multiple linear regression analysis adjusting
for age, sex, BMI, smoking history and Tongue image indexes zhiCon,
zhiASM, zhiENT and zhiMEAN were significantly different between
patients in TI-RADS 4 and TI-RADS 2 category (P<0.05). Compared
with TI-RADS 2 category, patients in TI-RADS 3 category had
different tongue image indexes of zhiClrB, zhiClrR, zhiClrG,
zhiClrI, zhiClrL, and zhiClrY (P<0.05). Specifically, compared
with TI-RADS 2, the values of zhiCon, zhiENT and zhiMEAN in TI-RADS
4 increased by 8.183, 0.022 and 0.001 respectively, while the
values of zhiASM decreased by 0.005. Compared with TI-RADS 2, the
values of TI-RADS 3 in tongue image index zhiClrB, zhiClrR,
zhiClrG, zhiClrI, zhiClrL and zhiClrY are 0.429, 0.199, 0.018,
0.181, 0.036 and 0.102, respectively.
In order to further explore the trend of tongue
image indexes with different TI-RADS classification, one-way
variance linear trend analysis was used to examine the linear trend
of the aforementioned indexes observed in Table III, with the results shown in
Table IV.
| Table IVOne-way linear trend analysis of
variance for different types of tongue image indicators in
TI-RADS. |
Table IV
One-way linear trend analysis of
variance for different types of tongue image indicators in
TI-RADS.
| | 95% confidence
interval | |
|---|
| Tongue image
index | TI-RADS | Mean ± standard
deviation | Lower | Upper | F | P-value |
|---|
| zhiCon | 2 | 93.38±31.56 | 90.34 | 96.42 | 4.516 | 0.034 |
| | 3 | 96.85±32.72 | 94.44 | 99.29 | | |
| | 4 | 100.7±31.85 | 94.71 | 106.69 | | |
| zhiENT | 2 | 1.255±0.09 | 1.247 | 1.264 | 4.806 | 0.029 |
| | 3 | 1.264±0.08 | 1.258 | 1.27 | | |
| | 4 | 1.275±0.077 | 1.26 | 1.289 | | |
| zhiASM | 2 | 0.069±0.031 | 0.066 | 0.072 | 3.848 | 0.05 |
| | 3 | 0.067±0.013 | 0.066 | 0.068 | | |
| | 4 | 0.065±0.012 | 0.062 | 0.067 | | |
| zhiMEAN | 2 | 0.03±0.005 | 0.029 | 0.03 | 5.874 | 0.016 |
| | 3 | 0.03±0.005 | 0.03 | 0.031 | | |
| | 4 | 0.031±0.005 | 0.03 | 0.032 | | |
| zhiClrB | 2 | 98.41±9.741 | 97.47 | 99.35 | 0.399 | 0.528 |
| | 3 | 96.45±9.585 | 95.74 | 97.17 | | |
| | 4 | 97.77±8.093 | 96.24 | 99.29 | | |
| zhiClrR | 2 | 157.93±9.13 | 157.05 | 158.81 | 0.033 | 0.855 |
| | 3 | 156.15±9.95 | 155.4 | 156.89 | | |
| | 4 | 157.75±7.74 | 156.29 | 159.2 | | |
| zhiClrG | 2 | 97.11±9.37 | 96.21 | 98.01 | 0.006 | 0.939 |
| | 3 | 95.76±9.41 | 95.05 | 96.46 | | |
| | 4 | 97.19±8.14 | 95.66 | 98.72 | | |
| zhiClrI | 2 | 117.48±8.84 | 116.63 | 118.33 | 0.052 | 0.82 |
| | 3 | 115.79±9.14 | 115.11 | 116.47 | | |
| | 4 | 117.26±7.39 | 115.87 | 118.65 | | |
| zhiClrL | 2 | 47.912±3.526 | 47.572 | 48.251 | 0.002 | 0.963 |
| | 3 | 47.309±3.629 | 47.039 | 47.58 | | |
| | 4 | 47.894±2.916 | 47.345 | 48.442 | | |
| zhiClrY | 2 | 115.147±7.588 | 114.417 | 115.878 | 0.007 | 0.932 |
| | 3 | 113.79±8.176 | 113.181 | 114.4 | | |
| | 4 | 115.076±7.856 | 113.867 | 116.284 | | |
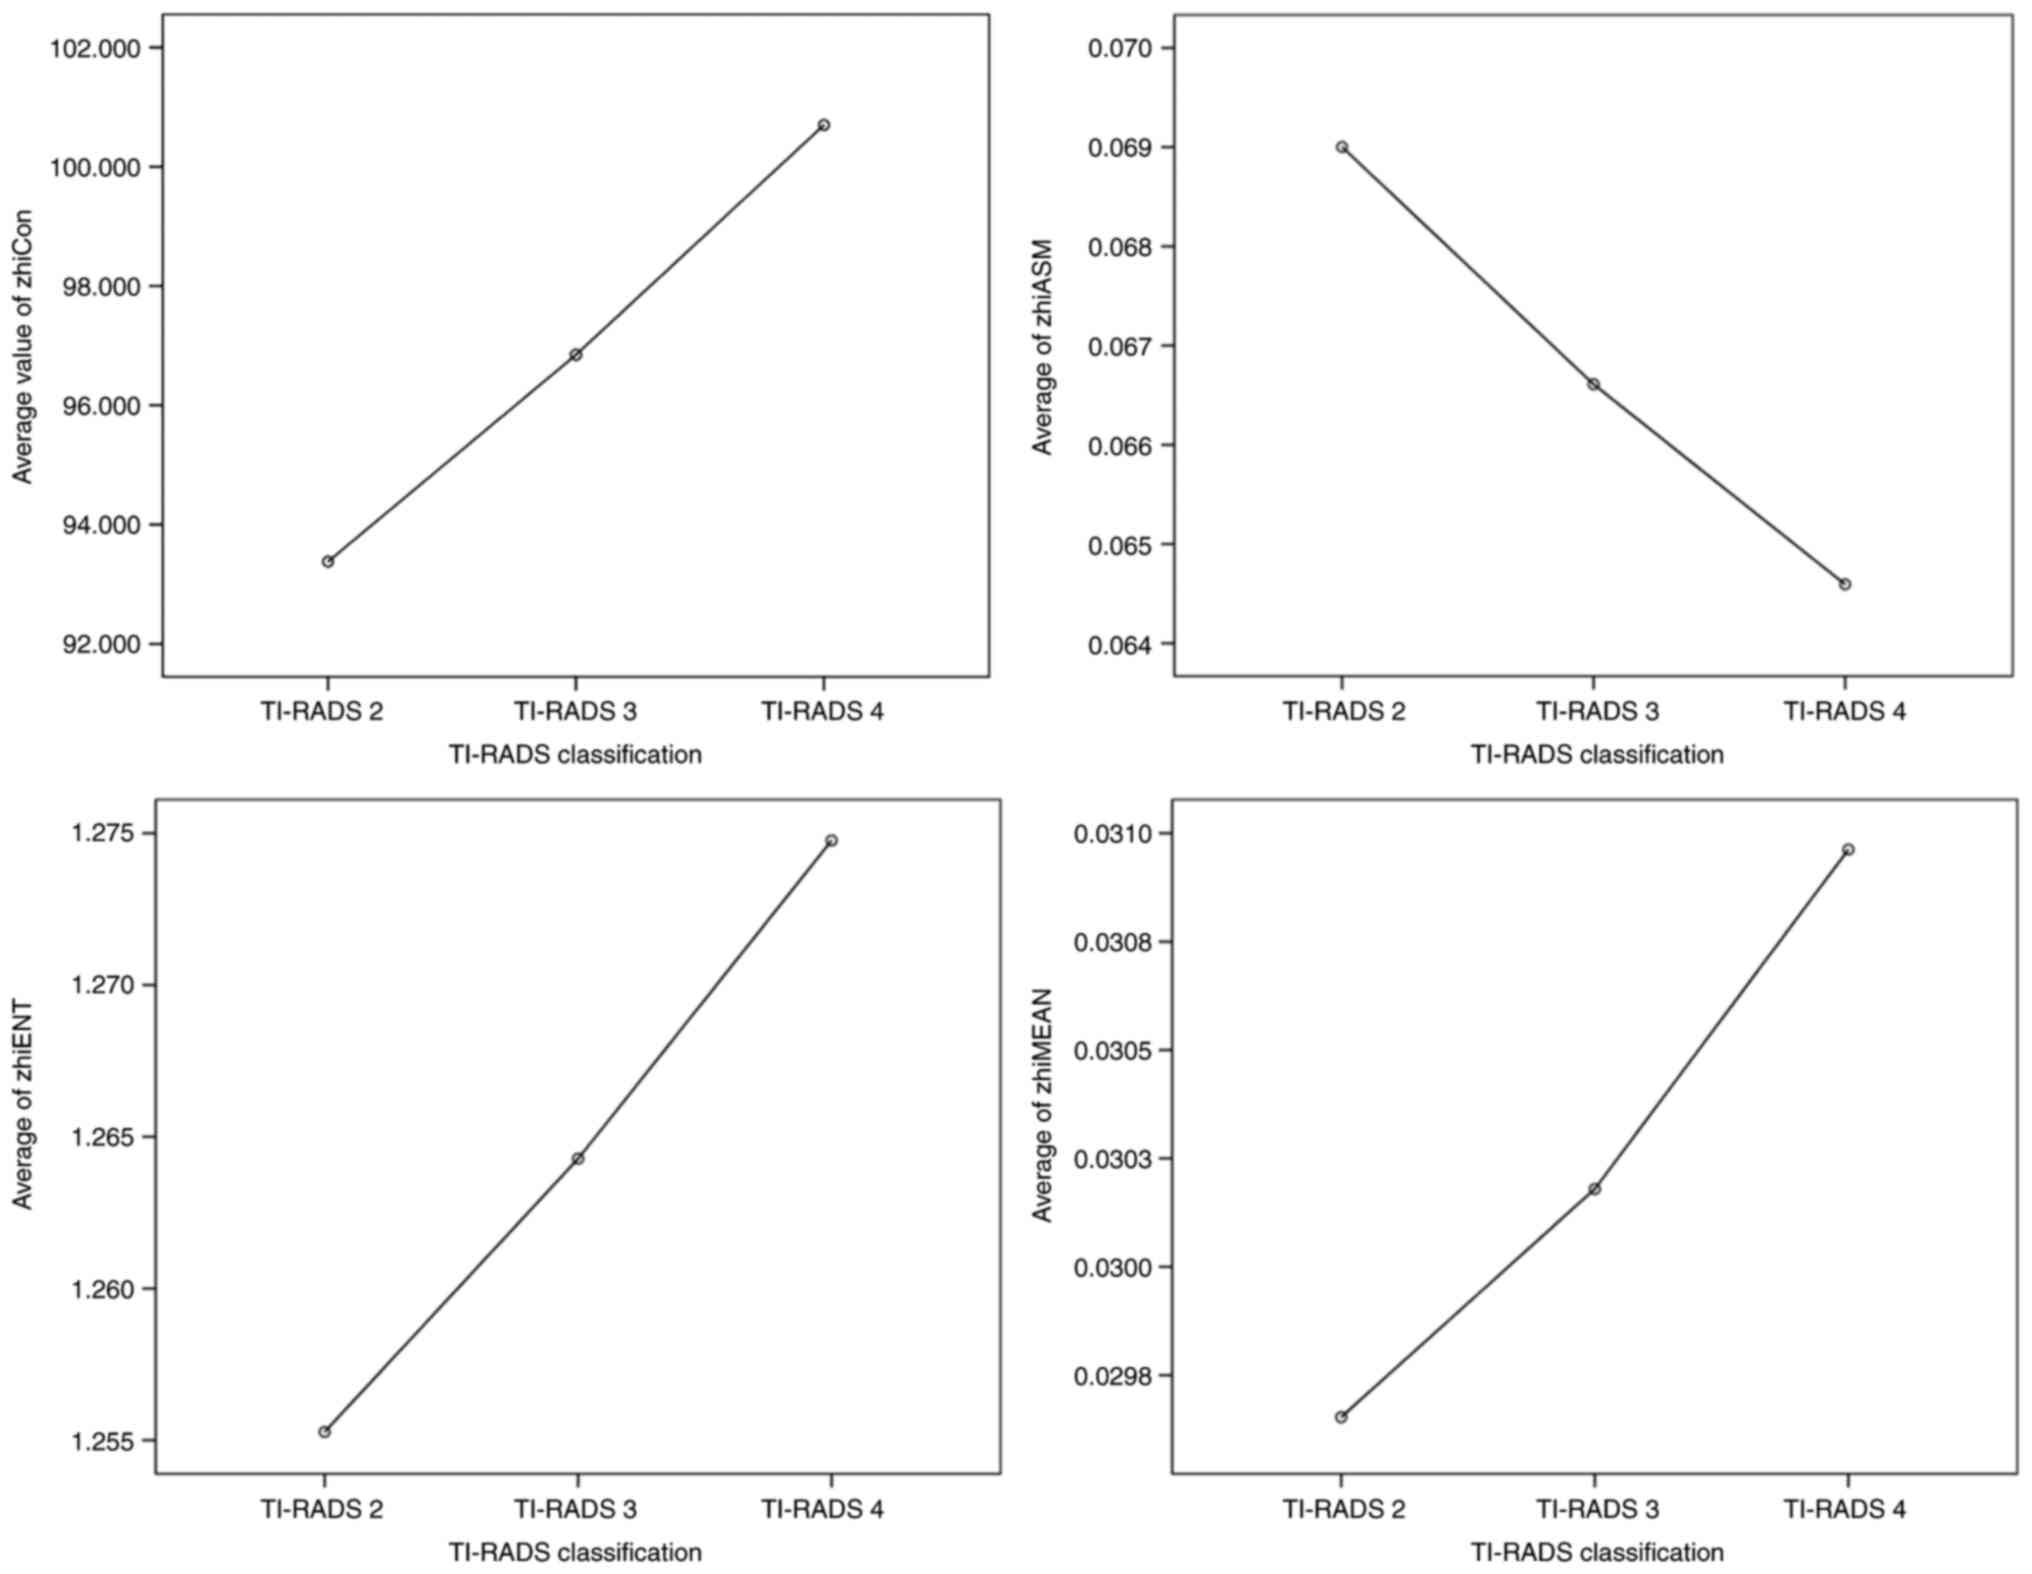
According to Table
IV, there was a linear trend in term of tongue image indexes
zhiCon, zhiENT, zhiASM and zhiMEAN across different TI-RADS
categories (P≤0.05), while no trend was observed for other tongue
image indexes (P>0.05). The trend in zhiCon, zhiENT, zhiASM and
zhiMEAN suggests that zhiCon, zhiENT and zhiMEAN values increase
and zhiASM decrease with the increase of TI-RADS classification
(Fig. 3).
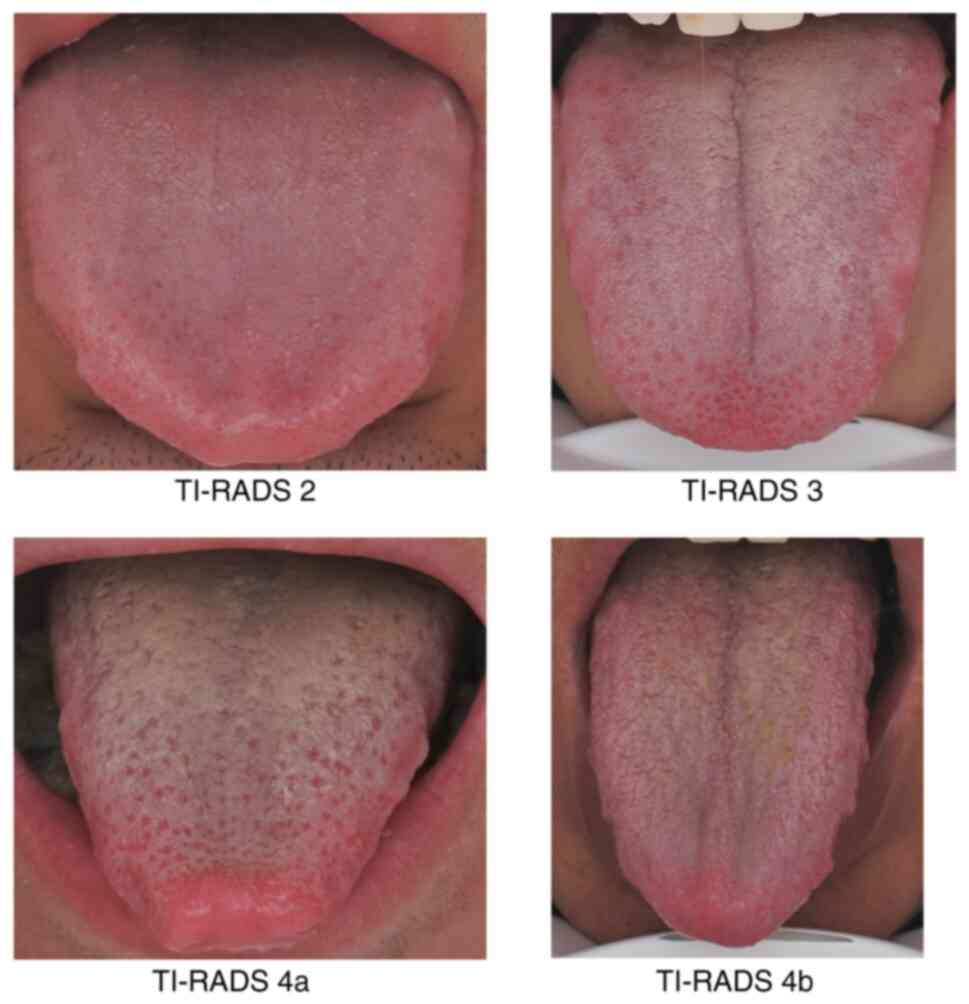
In Table V and
Fig. 3, the linear trend of tongue
image indexes zhiCon, zhiENT, zhiASM and zhiMEAN across the groups
is demonstrated. In Fig. 4, with
the increase of TI-RADS categories, the tongue surface becomes more
granular, and the tongue texture becomes rougher.
| Table VExamples of linear trend of tongue
image index zhiCon, zhiENT, zhiASM and zhiMEAN. |
Table V
Examples of linear trend of tongue
image index zhiCon, zhiENT, zhiASM and zhiMEAN.
| | Tongue image
index |
|---|
| TI-RADS
classification | zhiCon | zhiASM | zhiENT | zhiMEAN |
|---|
| 2 | 63.85 | 0.079 | 1.186 | 0.025 |
| 3 | 117.2 | 0.055 | 1.329 | 0.034 |
| 4a | 159.128 | 0.05 | 1.386 | 0.039 |
Discussion
The present study revealed that TI-RADS
classification was positively associated with tongue image indexes
zhiCon, zhiENT and zhiMEAN and negatively associated with tongue
image index zhiASM. Existing research results have revealed that
zhiCon, zhiENT and zhiMEAN increase as zhiASM decreases. The
rougher the tongue texture, the more delicate the opposite
(17). Although the TI-RADS
categories developed in different countries and regions differ in
the risk assessment of malignant transformation of thyroid nodules
(2,18-23),
there is a common trend: The risk of malignant transformation
increases with the increasing TI-RADS categories (Table VI). Therefore, it was hypothesized
that the factors that lead to the change of tongue texture may also
be the factors that lead to the malignant degeneration of thyroid
nodules.
| Table VIComparison of malignant change risk
in different TI-RADS classification. |
Table VI
Comparison of malignant change risk
in different TI-RADS classification.
| | Risk of malignancy
in different TI-RADS classification (%) |
|---|
| Author/(Refs.)
(year) | TI-RADS 1 | TI-RADS 2 | TI-RADS 3 | TI-RADS 4 | TI-RADS 5 | TI-RADS 6 |
|---|
| Tessler FN, et
al (2) (2017) | 0 | <2% | <5% | 5-20% | >20% | - |
| Park JY, et
al (18) (2009) | 0-7% | 8-23% | 24-50% | 51-90% | 91-100% | - |
| Kwak JY, et
al (19) (2011) | 0 | 0 | 2.0-2.8% | 3.6-91.9% | 88.7-97.9% | - |
| Russ G, et
al (21) (2017) | 0 | ≅0 | 2-4% | 6-17% | 26-87% | - |
| Superficial Organ
and Vascular Ultrasound | 0 | 0 | <2% | 2-90% | >90% | 100% |
| Group, Society of
Ultrasound in Medicine, Chinese Medical Association (22) (2021) | | | | | | |
| Horvath E, et
al (23) (2009) | 0 | 0 | <5% | 5-80% | >80% | 100% |
Tongue texture is a comprehensive expression of
tongue coating, filamentous papilla, fungoides papilla, tongue
crack and so forth. Inflammation is a common cause of tongue
disease (24). Existing previous
studies have discovered that the inflammation of filamentous
papilla can cause its atrophy, the thinning of epithelium, fiery
red on the back of the tongue, and shallow furrow fissure (A
special tongue texture) (25).
Inflammation of fungal papilla can lead to its congestion, redness
and swelling (24), and forming
the granular texture features on the back of tongue. The
aforementioned phenomena could lead into making the tongue texture
rougher. The factors leading to the filamentous and fungal
papillary inflammation of tongue may be attributable to anemia,
vitamin deficiency, antibiotic abuse, endocrine disorders,
malnutrition, and other health conditions (24). Some of these factors are clearly
associated with thyroid diseases, but some are controversial. A
previous study by Refaat (26)
revealed that the incidence of anemia in women with thyroid disease
was significantly higher than that in women without thyroid disease
(44 vs. 14.3%). At the same time, it was found that compared with
the normal group, the abnormal thyroid group had a significant
decrease in red blood cell count, hemoglobin, hematocrit, serum
iron and serum ferritin. Ren et al (27,28)
found that the prevalence of anemia in patients with thyroid cancer
is 36.7% (population average 24.8%). The vitamin deficiency in
patients with thyroid diseases is mainly characterized by the
deficiency of vitamins B6 and D. Jia et al (29) found that low vitamin B6 levels were
associated with presence of thyroid nodules. Hu and Rayman
(30) found that patients with
Hashimoto's thyroiditis had lower vitamin D levels compared with
those who did not have this disease. Nutritional factors including
iodine, iron and selenium have also been shown to be associated
with thyroid disease. For example, chronic exposure to excess
iodine intake can induce autoimmune thyroiditis and iron deficiency
can impair thyroid metabolism (30). Another study found that low
selenium and low vitamin D levels may increase the risk of
developing autoimmune thyroid disease, although these data are not
conclusive and more studies are needed to verify this result
(31).
Tongue crack (Fissured Tongue) may be caused by the
combination of innate factors and acquired factors, the acquired
factors mainly included geographical environment and dietary
nutrition. Existing studies have found increased rates of split
tongue in men [60.7% (female 39.3%)] as well as patients with
diabetes [42.1% (healthy individual, 22.5%)] functional dyspepsia
[78.9%, (healthy individual 3.2-27.2%)] and psoriasis [36%,
(healthy individual, 20%)] (32-35).
In addition, previous studies have demonstrated that male
individuals with diabetes exhibit a significantly higher risk of
developing thyroid nodules (36,37).
One possible reason for the higher incidence of cracked tongue in
men than in women is the higher smoking rate (35), as smoking is an important risk
factor for thyroid nodule (37).
The reasons for the higher incidence of cracked tongues in patients
with diabetes than in those without diabetes are more complex. It
could be due to inadequate blood glucose control, immunological
changes, microcirculatory alternation with reduced blood flow,
xerostomia and alteration in salivary flow and composition
(35). The association between
type 2 diabetes mellitus (T2DM) and thyroid nodules has been
purportedly attributed to abnormal glucose and lipid metabolism in
patients with diabetes (38,39).
Zhang et al (38) found
that compared with patients with benign nodules, T2DM patients with
malignant thyroid nodules had lower serum HDL-C levels and higher
levels of IGF-1, HbA1c and TgAb. Serum levels of HDL-C, IGF-1,
HbA1c and TgAb were also found to be correlated with the degree of
malignancy of thyroid nodules (TI-RADS score) in patients with
T2DM.
At present, the most effective method for
distinguishing benign and malignant thyroid nodules is fine-needle
aspiration (FNA); however, most nodules are benign, and the use of
FNA may not be a safe option for initial screening or testing
(2). Although TI-RADS gives the
classification of nodules, the accuracy of judgment (such as the
risk of malignant transformation of TI-RADS 3 being <5%, and the
risk of malignant transformation of TI-RADS 4 being between 5-~20%)
needs to be further improved. The present study revealed that the
tongue texture index has a linear correlation with TI-RADS. In the
future, the tongue texture index with TI-RADS classification could
be combined to improve its accuracy and reduce unnecessary biopsy
and treatment cost for patients.
The present single-center study has several
limitations that are worth mentioning. Firstly, the study
population's tongue image results, may be affected by the regional
environment (For example: the southeast of China is wet and hot,
while the northwest and northeast regions are cold and dry, which
can cause certain differences in tongue appearance), and some
measurement errors may occur. Secondly, in the present study only
tongue images were examined by the patients, and the combination of
the four diagnoses of diseases in traditional Chinese medicine is
the basis. In the future, the objective results should be combined
with the information of patients' inquiry, pulse and smell, so as
to optimize the diagnosis and treatment measures of patients.
Thirdly, the present study tongue image index for judging benign
and malignant thyroid nodule reference index, based on ultrasonic
TI-RADS classification, malignant change in different
classification for different probability as the default condition,
further study of tongue images of malignant thyroid nodules should
be performed in patients with pathological findings to obtain more
accurate results. Fourthly, currently, the present study's research
focuses on two aspects: Tongue image capture and image analysis
which has consumed a lot of time to be performed. In the near
future, image capture and image analysis will be combined by the
authors, in an effort, for tongue image diagnosis, to reach the
same levels of effectiveness, in terms of speed, as ultrasound
diagnosis.
In conclusion, there is a certain relationship
between TI-RADS classification of thyroid nodules and tongue
texture changes in tongue images. Tongue-based approach may be a
significant factor for differentiating the benign and malignant of
thyroid nodules.
Acknowledgements
The authors would like to thank the researchers of
the Intelligent Diagnostic Technology Research Laboratory of
Shanghai University of Traditional Chinese Medicine for their help
in tongue image segmentation and analysis. The authors would also
like to thank Jinbo Sun, Jing Jiang, and other medical staff of the
physical examination center of The affiliated hospital of Chengdu
University of traditional Chinese medicine, for assisting in data
collection.
Funding
Funding: The present study was supported by the National Key
Research and Development Program of China (grant no.
2017YFC1703304), the National Natural Science Foundation of China
(grant no. 81873204), the Sichuan Science and Technology Department
Project (grant no. 2021YFS0040) and the Chengdu University of
Traditional Chinese Medicine ‘Xinglin Scholar’ Discipline Talent
Research Promotion Program (grant no. 030041029).
Availability of data and materials
The datasets used and/or analyzed during the current
study are available from the corresponding author on reasonable
request.
Authors' contributions
J-LL, W-HL and Z-HZ contributed to the conception
and design of the present study. J-LL, KZ and Z-HZ completed the
collation of data. J-LL and Z-HZ confirm the authenticity of all
the raw data. SR and J-LL and X-BZ analyzed the data. J-LL wrote
the first draft of the manuscript. W-HL and X-BZ critically edited
the manuscript. J-LL and W-HL were responsible for the overall
project. All authors read and approved the final version of the
manuscript.
Ethics approval and consent to
participate
The studies involving human participants were
reviewed and approved (approval no. 2018KL-050) by The Affiliated
Hospital of Chengdu University of Traditional Chinese Medicine
(Chengdu, China). Written informed consent was provided by all the
patients/participants to participate in the present study.
Patient consent for publication
Patient consent for publication of patient data and
associated images was obtained.
Competing interests
The authors declare that they have no competing
interests.
References
|
1
|
Singh Ospina N, Iñiguez-Ariza NM and
Castro MR: Thyroid nodules: Diagnostic evaluation based on thyroid
cancer risk assessment. BMJ. 368(l6670)2020.PubMed/NCBI View Article : Google Scholar
|
|
2
|
Tessler FN, Middleton WD, Grant EG, Hoang
JK, Berland LL, Teefey SA, Cronan JJ, Beland MD, Desser TS, Frates
MC, et al: ACR thyroid imaging, reporting and data system
(TI-RADS): White paper of the ACR TI-RADS Committee. J Am Coll
Radiol. 14:587–595. 2017.PubMed/NCBI View Article : Google Scholar
|
|
3
|
Wong R, Farrell SG and Grossmann M:
Thyroid nodules: Diagnosis and management. Med J Aust. 209:92–98.
2018.PubMed/NCBI View Article : Google Scholar
|
|
4
|
Grani G, Sponziello M, Pecce V, Ramundo V
and Durante C: Contemporary thyroid nodule evaluation and
management. J Clin Endocrinol Metab. 105:2869–2883. 2020.PubMed/NCBI View Article : Google Scholar
|
|
5
|
Sung H, Ferlay J, Siegel RL, Laversanne M,
Soerjomataram I, Jemal A and Bray F: Global cancer statistics 2020:
GLOBOCAN estimates of incidence and mortality worldwide for 36
cancers in 185 countries. CA Cancer J Clin. 71:209–249.
2021.PubMed/NCBI View Article : Google Scholar
|
|
6
|
Zheng L, Lin X, Zhuo G, Lin Z, Li Y and
Shen Q: Clinical Application Value of Thyroid Imaging Reporting and
Data System (TI-RADS) Classification in the Differential Diagnosis
of Benign and Malignant Thyroid Nodules. Progress in Modern
Biomedicine. 21:4770–4773. 2021.
|
|
7
|
Wang H, Wei R, Liu W, Chen Y and Song B:
Diagnostic efficacy of multiple MRI parameters in differentiating
benign vs. malignant thyroid nodules. BMC Med Imaging.
18(50)2018.PubMed/NCBI View Article : Google Scholar
|
|
8
|
Kumar V, Webb J, Gregory A, Meixner DD,
Knudsen JM, Callstrom M, Fatemi M and Alizad A: Automated
segmentation of thyroid nodule, gland, and cystic components from
ultrasound images using deep learning. IEEE Access. 8:63482–63496.
2020.PubMed/NCBI View Article : Google Scholar
|
|
9
|
Hang Y: Thyroid nodule classification in
ultrasound images by fusion of conventional features and Res-GAN
deep features. J Healthc Eng. 2021(9917538)2021.PubMed/NCBI View Article : Google Scholar
|
|
10
|
Li C: Diagnostics of traditional Chinese
medicine. Bei Jing: Chin Press rad Chin Med 92-94, 2016 (In
Chinese).
|
|
11
|
Lin Y, Li J, Hu X, LP T and Xu J: Research
progress of relationship between tongue image and clinical
detection indexes of common diseases. Acta Univ Tradit Med Sin
Pharmacol Shanghai. 34:94–98. 2020.(In Chinese).
|
|
12
|
Zhao J, Xie J, Shi J and Hai R: Analysis
of tongue diagnosis papers in traditional chinese medicine. Nei
Mongol J Tradit Chin Med. 39:146–148. 2020.(In Chinese).
|
|
13
|
Cai Y, Hu S, Guan J and Zhang X: Progress
on Objectification Technology of Tongue Inspection in Traditional
Chinese Medicine and Discussion on its Application. Modernization
of Traditional Chinese Medicine and Materia Medica-World Science
and Technology. 23:2447–2453. 2021.(In Chinese).
|
|
14
|
Dou H, Wang Y, Hu L and Yu L: Discussion
on the role of tongue diagnosis in health examination. Journal of
Traditional Chinese Medical Literature. 39:81–4+9. 2021.(In
Chinese).
|
|
15
|
Chen C, Hong J, Wang Y, Xu Z, Guo R, Liu
L, et al: Analysis of characteristic parameters of tongue and face
image in patients with hypertensive fissured tongue. Chin J Tradit
Chin Med Pharm. 34:5363–5365. 2019.(In Chinese).
|
|
16
|
Qian P, Yan H, Xu G, Zhou X, Yang S and Li
F: Analysis and study on tongue picture parameters of patients with
gastric tumor. Modernization of Traditional Chinese Medicine and
Materia Medica-World Science and Technology. 23:2058–2063. 2021.(In
Chinese).
|
|
17
|
Xu J, Sun Y, Zhang Z, Zhou C, Bao Y and Li
S: Analysis and discrimination of tongue texture characteristics by
difference statistics. Acta Univ Tradit Med Sin Pharmacol Shanghai.
55-58:2003.
|
|
18
|
Park JY, Lee HJ, Jang HW, Kim HK, Yi JH,
Lee W and Kim SH: A proposal for a thyroid imaging reporting and
data system for ultrasound features of thyroid carcinoma. Thyroid.
19:1257–1264. 2009.PubMed/NCBI View Article : Google Scholar
|
|
19
|
Kwak JY, Han KH, Yoon JH, Moon HJ, Son EJ,
Park SH, Jung HK, Choi JS, Kim BM and Kim EK: Thyroid imaging
reporting and data system for US features of nodules: A step in
establishing better stratification of cancer risk. Radiology.
260:892–899. 2011.PubMed/NCBI View Article : Google Scholar
|
|
20
|
Zayadeen AR, Abu-Yousef M and Berbaum K:
JOURNAL CLUB: Retrospective evaluation of ultrasound features of
thyroid nodules to assess malignancy risk: A step toward TIRADS.
AJR Am J Roentgenol. 207:460–469. 2016.PubMed/NCBI View Article : Google Scholar
|
|
21
|
Russ G, Bonnema SJ, Erdogan MF, Durante C,
Ngu R and Leenhardt L: European Thyroid Association guidelines for
ultrasound malignancy risk stratification of thyroid nodules in
adults: The EU-TIRADS. Eur Thyroid J. 6:225–237. 2017.PubMed/NCBI View Article : Google Scholar
|
|
22
|
Association SOaVUGSoUMCM, Ultrasoun
CAIAfTB. 2020 Chinese guidelines forultrasound malignancy risk
stratification of thyroid nodules: The C-TIRADS. Chin J
Ultrasonography 30: 185-200, 2021. http://qikan.cqvip.com/Qikan/Article/Detail?id=7104517341.
|
|
23
|
Horvath E, Majlis S, Rossi R, Franco C,
Niedmann JP, Castro A and Dominguez M: An ultrasonogram reporting
system for thyroid nodules stratifying cancer risk for clinical
management. J Clin Endocrinol Metab. 94:1748–1751. 2009.PubMed/NCBI View Article : Google Scholar
|
|
24
|
Chen QH and H Zheng X: Oral Medicine. Bei
Jing: People's Medical Publishing House (PMPH), 2020.
|
|
25
|
Liu H: Common tongue diseases. Chinese
Journal of General Practitioners. 2011. (http://yiigle.zssgdsb-85176920tsgjnz.com/#/details?id=106755).
https://xueshu.baidu.com/usercenter/paper/show?paperid=291401238b62a689dc8c9b4cc9a5a8ab&site=xueshu_se.
|
|
26
|
Refaat B: Prevalence and characteristics
of anemia associated with thyroid disorders in non-pregnant Saudi
women during the childbearing age: A cross-sectional study. Biomed
J. 38:307–316. 2015.PubMed/NCBI View Article : Google Scholar
|
|
27
|
Ren S, Zhou G and Zhang J: Analysis and
clinical application of thyroid cancer-associated anemia. Chin
Remedies Clin. 21:595–596. 2021.(In Chinese).
|
|
28
|
Zheng X, Ye F and Liu C: Research progress
on the correlation between thyroid disease and anemia. Chin Med
Herald. 15:40–43. 2018.(In Chinese).
|
|
29
|
Jia L, Kang X, Li Y and Zhang X: The
Correlation between TCM syndrome differentiation and patterns and
the level of vitamin of the patients with benign thyroid nodule.
Western J Trad Chin Med. 31:93–96. 2018.(In Chinese).
|
|
30
|
Hu S and Rayman MP: Multiple nutritional
factors and the risk of hashimoto's thyroiditis. Thyroid.
27:597–610. 2017.PubMed/NCBI View Article : Google Scholar
|
|
31
|
Effraimidis G and Wiersinga WM: Mechanisms
in endocrinology: Autoimmune thyroid disease: Old and new players.
Eur J Endocrinol. 170:R241–R252. 2014.PubMed/NCBI View Article : Google Scholar
|
|
32
|
Picciani BL, Souza TT, Santos Vde C,
Domingos TA, Carneiro S, Avelleira JC, Azulay DR, Pinto JM and Dias
EP: Geographic tongue and fissured tongue in 348 patients with
psoriasis: Correlation with disease severity.
ScientificWorldJournal. 2015(564326)2015.PubMed/NCBI View Article : Google Scholar
|
|
33
|
Sudarshan R, Sree Vijayabala G, Samata Y
and Ravikiran A: Newer classification system for fissured tongue:
An epidemiological approach. J Trop Med.
2015(262079)2015.PubMed/NCBI View Article : Google Scholar
|
|
34
|
Song J, Wang Q, Xu X and Lv C: Predictive
value of fissured tongue in functional dyspepsia combined with
depression. Gastroenterol Res Pract. 2019(4596560)2019.PubMed/NCBI View Article : Google Scholar
|
|
35
|
Hamrah MH, Baghalian A, Ghadimi S,
Mokhtari S, Kargar M, Khosrozadeh M, Dahi T, Charkazi A, Hamrah MS
and Hamrah MH: The prevalence and correlates of fissured tongue
among outpatients in Andkhoy City, Afghanistan: A cross-sectional
study. Clin Cosmet Investig Dent. 13:335–342. 2021.PubMed/NCBI View Article : Google Scholar
|
|
36
|
Zhang HM, Feng QW, Niu YX, Su Q and Wang
X: Thyroid nodules in type 2 diabetes mellitus. Curr Med Sci.
39:576–581. 2019.PubMed/NCBI View Article : Google Scholar
|
|
37
|
Chen S, Zhang J, Yu S, Liu X, Sun L, Tao
L, et al: A cohort study on factors influencing occurrence of
thyroid nodule in adults in Beijing. Beijing Medical Journal.
44:816–822. 2022.https://kns.cnki.net/kcms2/article/abstract?v=3uoqIhG8C44YLTlOAiTRKibYlV5Vjs7iJTKGjg9uTdeTsOI_ra5_XROeM2huIqOkeKBvINauqNUzEAUEW4o5uZkrIb_rIgP-&uniplatform=NZKPT.
|
|
38
|
Zhang Q, Niu M, Huo Q, Zhang X, Shen J and
Pei X: Relationship between lipid metabolism, IGF-1 and HbA1c
levels and the nature of nodules in patients with type 2 diabetes
mellitus and thyroid nodules. J Clin Exp Med. 21:1971–1974.
2022.(In Chinese).
|
|
39
|
Zhao J, Fei Y and Shao Y: Analysis of
correlation between glycolipid metabolism and newly-diagnosed type
2 diabetes mellitus combined with thyroid nodule. Med Equipment.
35:101–104. 2022.(In Chinese).
|