Introduction
Gastric cancer is currently one of the three
deadliest types of cancer in China (1). The accurate identification of tumor
aggressiveness and cancer staging are of great significance to
achieve appropriate and timely treatment, especially in the
preoperative stage, and are also crucial for the development of
treatment strategies, diagnosis and prognosis. Microvascular
invasion (MI) is closely related to lymph node metastasis and
postoperative recurrence of cancer (2,3). The
presence of MI is a frequently observed pathological feature in
cancer specimens and is widely recognized as a significant
prognostic factor for various types of malignancies (4-6).
It has been previously shown that MI is associated with poor
prognosis of gastric cancer (7).
Therefore, understanding the preoperative MI status of patients has
clinical significance for individualized treatment selection and
prognosis prediction. Unlike conventional macrovascular invasion,
MI in gastric cancer is difficult to detect by conventional imaging
and can only be detected by postoperative histopathological
examination; therefore, preoperative prediction of MI is
challenging.
Although traditional imaging methods are
indispensable, they do have limitations. Machine learning models
can be trained on large datasets to identify subtle abnormalities
in images that may not be discernible to the naked eye, thereby
providing valuable second opinions and robust evidence for
individualized diagnosis and treatment planning (8). With the introduction of precision
medicine, especially the concept of radiomics, the combination of
quantitative image analysis and machine-learning methods can be
used to extract massive quantitative features from medical images.
This facilitates the quantitative analysis of tumors and, further,
reveals their heterogeneity, thereby enabling more precise
prognosis assessment. It has been identified that the combination
of radiomic features and clinical features can answer patients'
medical questions in an improved way. Yardımcı et al
(9) found that computed tomography
(CT)-based machine learning has the potential to predict
lympho-vascular and perineural invasion in tubular gastric
cancer.
A comprehensive model can accurately quantify
prognosis at the individual level by combining radiomic features
and clinical characteristics, along with other factors. Compared
with traditional TNM staging, nomograms established by more
clinical characteristics are more effective in predicting the
survival of patients with gastric cancer (10,11).
For instance, Wang et al (11) found that the nomogram established
by combining clinical characteristics has a higher value in the
preoperative evaluation of the overall survival (OS) of patients
with gastric cancer than conventional TNM staging.
Further investigation is warranted to explore the
potential of radiomics in predicting the MI status and associated
prognosis of gastric cancer. Therefore, in the present study it was
aimed to assess the feasibility of establishing a radio-clinical
model by integrating radiomic features and clinical risk factors
for accurate prediction of MI in patients diagnosed with gastric
cancer.
Materials and methods
Patients
The review committee of Zhejiang Cancer Hospital
(Hangzhou, China) approved (approval no. IRB-2022-69) the
retrospective design of the present study, thereby waiving the
requirement for informed consent. A total of 534 patients with a
histopathological diagnosis of gastric cancer (including
adenocarcinoma and signet ring cell carcinoma) who had undergone
radical gastrectomy between April 2008 and October 2012 were
identified from the institutional database.
Screening of patients according to the inclusion and
exclusion criteria yielded 264 patients who were positive for MI
and 270 who were negative for MI. All patients underwent enhanced
abdominal CT scan within one month before operation. Inclusion
criteria were as follows: i) patients with gastric cancer confirmed
by postoperative pathology; ii) abdominal enhanced CT examination
was performed within 1 month before the operation; and iii) all
surgical specimens were examined for MI status. Exclusion criteria
were as follows: i) incomplete clinical or pathological data; ii)
received other treatment before surgery; iii) and poor-quality CT
image and difficult-to-identify lesions. The cases were randomly
divided into a training set (n=374) and a test set (n=160) at a
ratio of 7:3. The clinical data of the patients were recorded,
including age, sex, tumor location, TNM stage and AJCC stage. The
patients were restaged based on the diagnostic criteria outlined in
the 8th edition of the American Joint Committee on Cancer Staging
Manual. The location of gastric cancer was divided into the cardia,
gastric body, gastric antrum and all according to pathology.
CT image acquisition
The patients had all undergone enhanced abdominal
scanning using multi-slice spiral CT, machine model: GE Optima 680
CT (GE HealthCare), Siemens Somatom definition AS 64, (Siemens
Healthineers). The thickness of the reconstructed layer was 5-7 mm.
The contrast medium was administered intravenously at a dose of 1.5
ml/kg through the antecubital vein. Contrast-enhanced CT scans were
conducted at 30-35 and 50-60 sec after contrast medium injection,
respectively.
Histopathology
All patients had received surgical treatment within
one month after undergoing contrast-enhanced abdominal CT
examination. All surgical specimens had been examined to detect the
presence of MI. MI was visible only under light microscopy.
Tumor segmentation
The CT images of patients with gastric cancer were
obtained from image storage and communication systems. Digital
imaging and communications in medicine format portal phase images
were used to delineate the lesions. Region of interest were
delineated using ITK-SNAP (version 3.8.0, http://www.itksnap.org). In total, two radiologists
with over 5 years of experience in diagnosing gastric diseases
meticulously examined each patient's horizontal CT image and
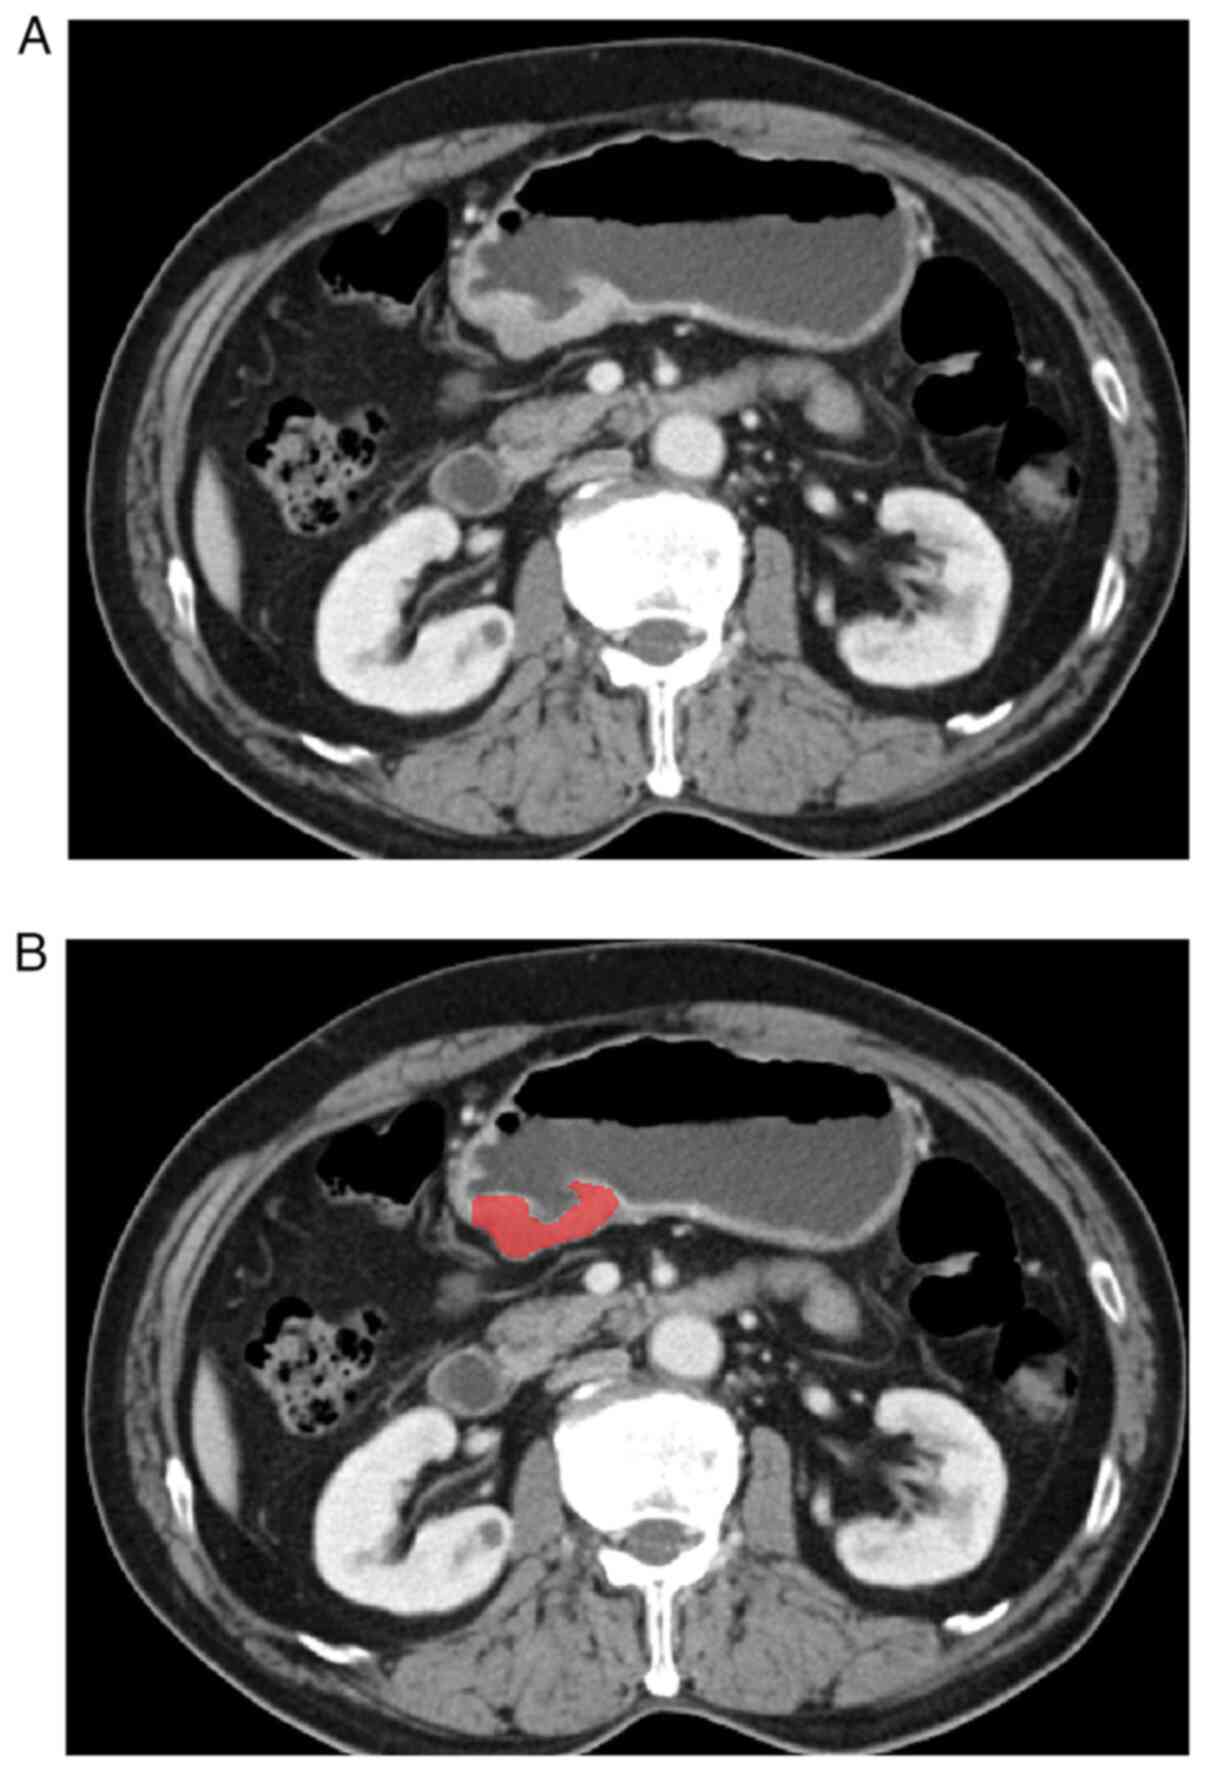
accurately delineated the tumor area layer by layer (Fig. 1). Observer 1 delineated the lesions
of all patients with gastric cancer, and Observer 2 checked the
accuracy of tumor delineation. If lesion segmentation was
inconsistent between the two radiologists, a consensus was reached
after consultation.
Radiomics feature extraction and
selection
In the present study, PyRadiomics (version 3.0.1)
was used, an open-source library, to extract features. After
extracting radiomic features based on the original image dataset,
feature data of samples in the original feature set were first
analyzed using the principal component analysis (PCA) method to
ensure that they were uncorrelated. Then, the maximum relevance
minimum redundancy (mRMR) and least absolute shrinkage and
selection operator (LASSO) methods were used to select the
radiomics features. The radiomic score (rad-score) for each patient
was subsequently computed through a linear combination of the
selected features, with their respective coefficients in the
prediction model being applied as weights.
Construction of a predictive
model
First, clinical features were selected by univariate
analysis. Multivariate logistic regression analysis, combined with
rad-score and clinical risk factors were used to construct a
comprehensive prediction model. For easy application, the model was
transformed as a visual nomogram based on multivariable logistic
regression analysis in the training set. Thereafter, the prediction
performance of the nomogram was evaluated in the validation
set.
Performance of the radiomics
nomogram
Receiver operating characteristic (ROC) curve and
calibration curve were used to evaluate the predictive efficacy and
clinical practical efficacy of the nomogram. Decision curve
analysis (DCA) was further employed to evaluate the clinical
application value of the model by calculating the net benefits at
different threshold probabilities (12). The performance of the model was
evaluated by calculating metrics such as the area under the ROC
curve (AUC), accuracy, sensitivity, specificity, positive
predictive value and negative predictive value.
Statistical analysis
The statistical analysis was conducted using the R
software (version 3.4.1; http://www.Rproject.org) and SPSS statistical software
(version 26.0; IBM Corp.). The LASSO logistic regression model was
employed, and the penalty parameter tuning was performed through
10-fold cross-validation based on minimum criteria. The Wilcoxon
rank-sum test was employed to compare the radscores of class 0 and
class 1 in both the training and test groups, respectively.
Subsequently, Box-plot were generated using the ‘ggplot’ package.
Continuous variables were represented using mean values and
standard deviations, while categorical variables were presented as
counts (n) and percentages (%). The independent sample t-test was
employed to compare normally distributed continuous data and
Mann-Whitney U tests were used for non-normally distributed data.
The Chi-square test and Fisher's exact test were utilized to
evaluate the distribution of categorical data across groups.
Univariate logistic regression analysis was used to evaluate the
differences in clinical factors between different groups. The
prediction model was constructed by employing multi-variable
logistic regression analysis, incorporating rad-score and clinical
characteristics. LASSO logistic regression analysis was conducted
using the ‘glmnet’ package. Multivariate logistic regression
analysis and calibration plots were performed utilizing the ‘rms’
package. ROC curves were generated with the ‘pROC’ package. The
‘rmda’ package was used to perform the DCA. A range of sensitivity
and specificity values were obtained by generating the ROC curve
and calculating Youden's index (Youden's index=sensitivity +
specificity-1), where the highest value of Youden's index was
identified as the optimal cut-off point. The survival probabilities
were assessed using Kaplan-Meier survival analysis and the log-rank
test. P-values were calculated by log-rank test. P<0.05 was
considered to indicate a statistically significant difference.
Results
Clinical characteristics
Among 534 patients with gastric cancer, 264 patients
had MI and 270 patients did not have MI. The patients were randomly
allocated into a training set (n=374) and a test set (n=160) at a
ratio of 7:3. In the training and test sets, significantly higher
rad-scores were found in the MI group than in the group that was
negative for MI (P<0.01). Further details are shown in Table I (including sex and age
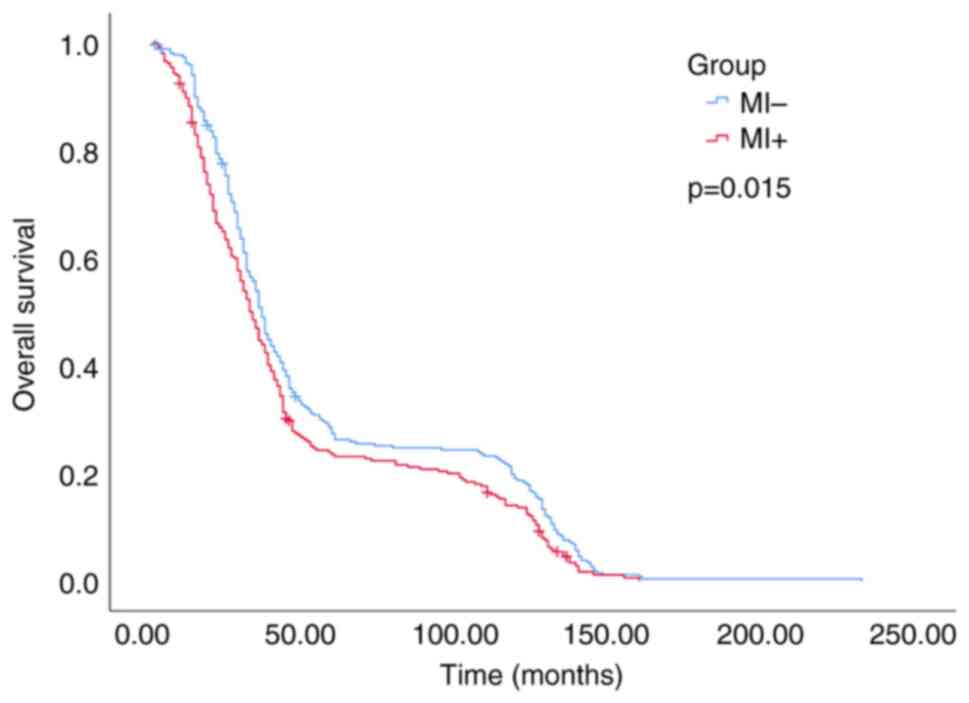
distribution). OS data were also collected from patients and
analyzed to compare the difference in survival time between the MI
positive group and the negative group. (Fig. 2).
 | Table IClinical and radiological
characteristics of patients in training and test sets. |
Table I
Clinical and radiological
characteristics of patients in training and test sets.
| | Training set | | Test set | |
|---|
| Characteristic | MI-
(198) | MI+
(176) | P-value | MI-
(72) | MI+
(88) | P-value |
|---|
| Age, years | | | 0.614 | | | 0.319 |
|
mean
(SD) | 59.4 (9.7) | 58.9 (11.1) | | 58 (10.9) | 59.7 (10.7) | |
| Sex | | | 0.514 | | | 0.067 |
|
Male | 145 (73.2) | 135 (76.7) | | 49 (68.1) | 72 (81.8) | |
|
Female | 53 (26.8) | 41 (23.3) | | 23 (31.9) | 16 (18.2) | |
| Location | | | 0.063 | | | 0.306 |
|
Cardia | 47 (23.7) | 57 (32.4) | | 18 (25.0) | 21 (23.9) | |
|
Body | 32 (16.2) | 24 (13.6) | | 10 (13.9) | 9 (10.2) | |
|
Antrum | 116 (58.6) | 87 (49.4) | | 44 (61.1) | 54 (61.4) | |
|
All | 3 (1.5) | 8 (4.5) | | 0 (0.0) | 4 (4.5) | |
| T stage | | | <0.001 | | | 0.001 |
|
T1 | 74 (37.4) | 8 (4.5) | | 23 (31.9) | 7 (8.0) | |
|
T2 | 24 (12.1) | 23 (13.1) | | 6 (8.3) | 9 (10.2) | |
|
T3 | 5 (2.5) | 3 (1.7) | | 2 (2.8) | 2 (2.3) | |
|
T4 | 95 (48.0) | 142 (80.7) | | 41 (56.9) | 70 (79.5) | |
|
N stage | | | <0.001 | | | <0.001 |
|
N0 | 112 (56.6) | 15 (8.5) | | 38 (52.8) | 15 (17.0) | |
|
N1 | 39 (19.7) | 20 (11.4) | | 11 (15.3) | 10 (11.4) | |
|
N2 | 31 (15.7) | 45 (25.6) | | 13 (18.1) | 22 (25.0) | |
|
N3 | 16 (8.1) | 96 (54.5) | | 10 (13.9) | 41 (46.6) | |
| AJCC stage | | | <0.001 | | | <0.001 |
|
I | 83 (41.9) | 6 (3.4) | | 26 (36.1) | 10 (11.4) | |
|
II | 47 (23.7) | 23 (13.1) | | 13 (18.1) | 10 (11.4) | |
|
III | 68 (34.3) | 147 (83.5) | | 33 (45.8) | 68 (77.3) | |
| Rad-sore | | | <0.001 | | | <0.001 |
| median (IQR) | -0.5 (-0.9,
0.0) | 0.3 (-0.2,
0.8) | | -0.6 (-1.0,
-0.2) | 0.1 (-0.4,
0.5) | |
Radiomics features screening and
radiomics signature construction
The radiomic features were received from the
original CT images of each individual with gastric cancer,
resulting in a total of 1,834 features (including shape features,
first-order statistics features, texture-based features,
higher-order features and features based on model transformation).
The feature data of focus were first analyzed by PCA for
dimensionality reduction; then, mRMR and LASSO algorithms were
employed to identify the optimal subset of features for
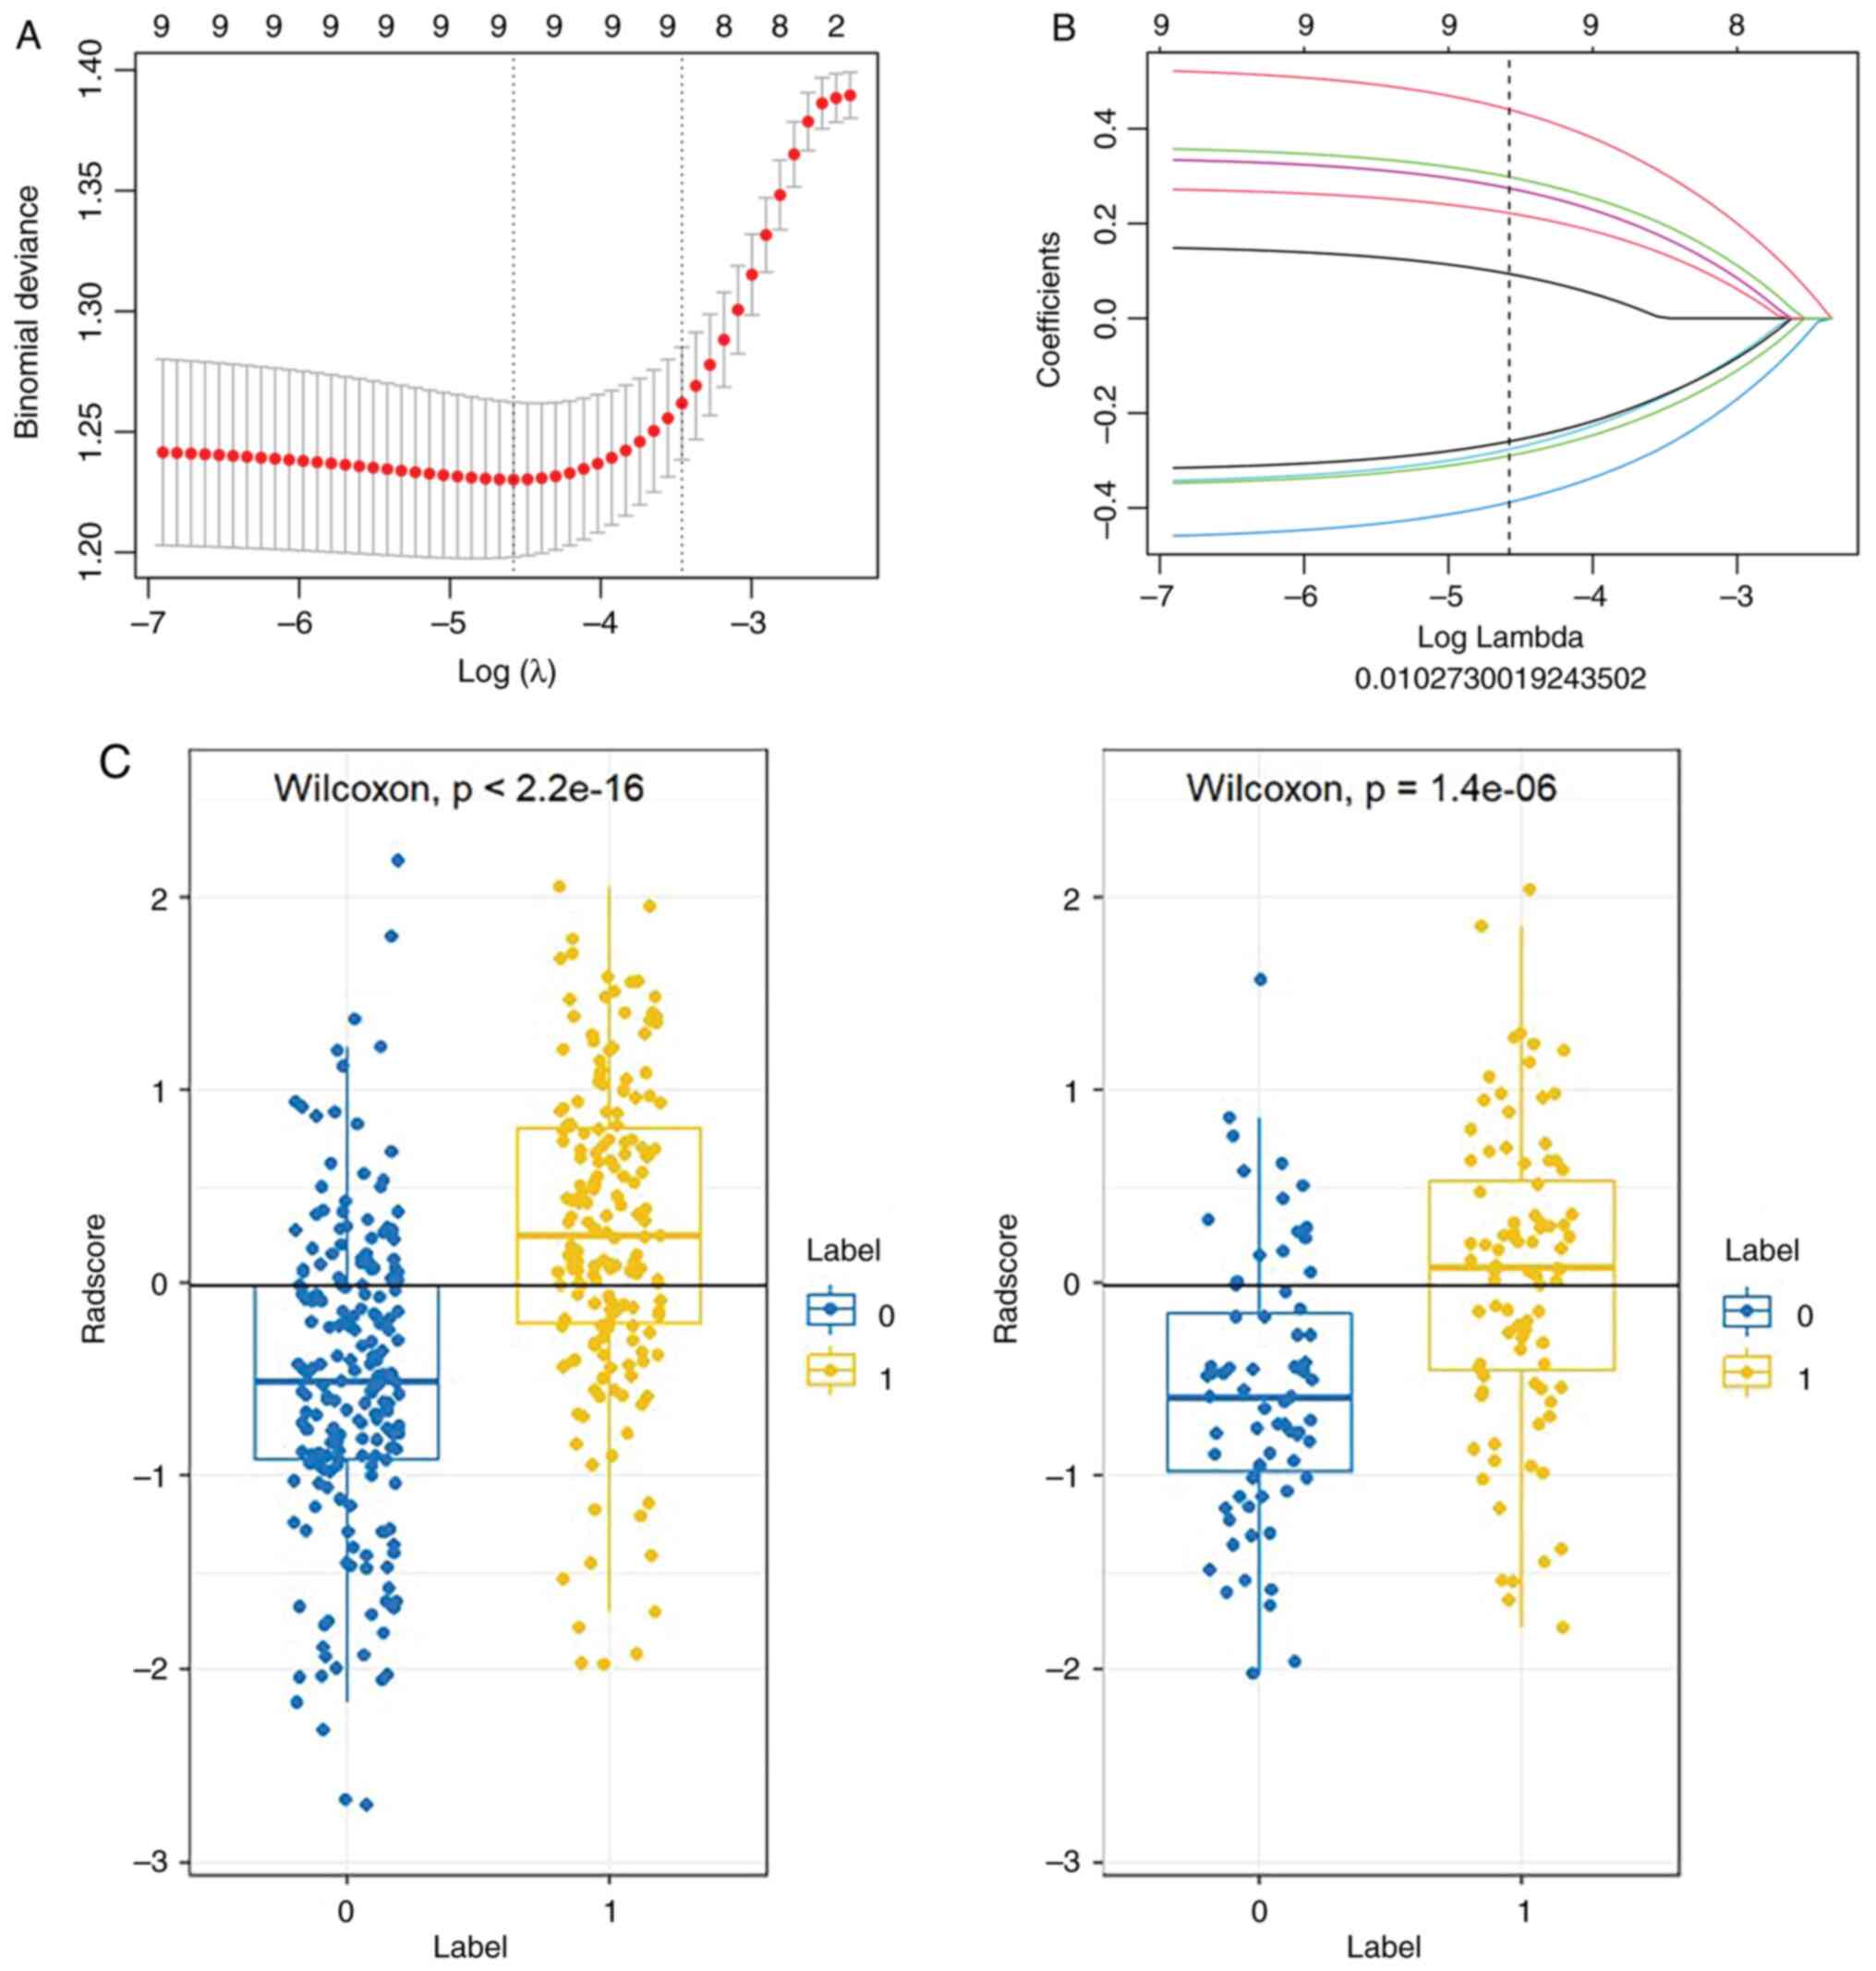
constructing the radiomics model. A 10-fold cross-validated LASSO
logistic regression analysis with a first-rank λ was utilized to
select the most relevant radiomic features exhibiting non-zero
coefficients (Fig. 3). Finally, 9
radiomic features were selected to establish the radiomics
signature; after weighing the selected features, their coefficients
were added to calculate the rad-score, and the rad-score of class 0
and class 1 were compared between the training group and the test
group, respectively (Fig. 3).
Development of an individualized
radiomics nomogram
The clinical variables included sex, age, T stage, N
stage, AJCC stage and tumor location. The multivariate logistic
regression analysis was conducted based on the results of the
univariate analysis, and the odds ratio and 95% confidence interval
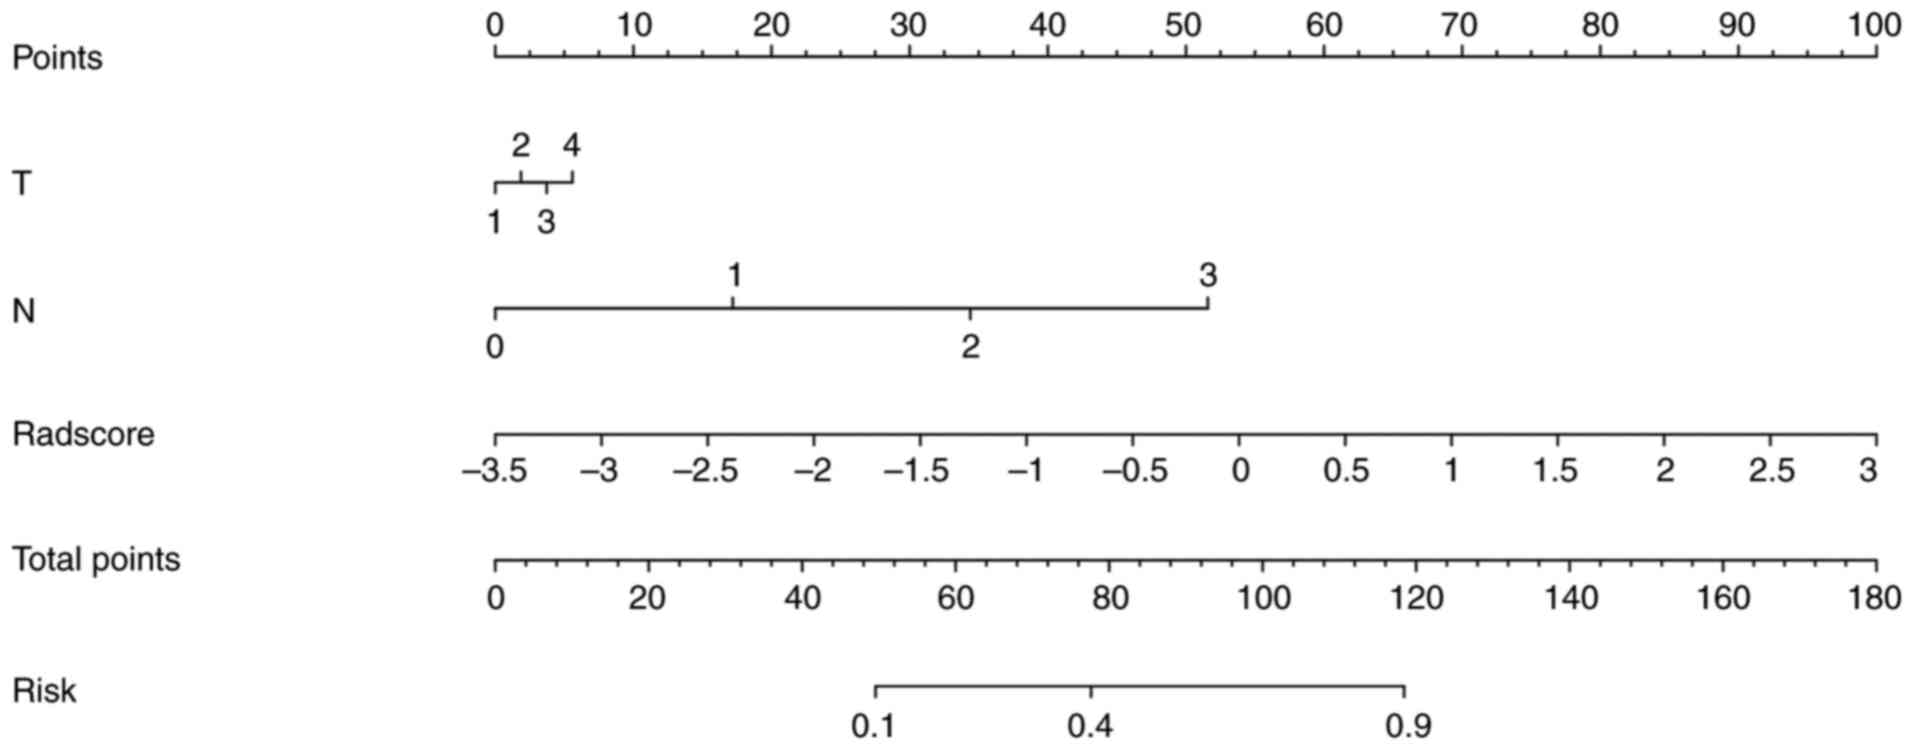
were subsequently calculated. The predictive model was constructed
by integrating multivariate analysis with rad-score and T and N
staging, which was further visualized as a radiomic nomogram
(Fig. 4). The nomo-score was
calculated as follows:
Nomoscore = (Intercept) * –2.043 + T*0.119 + N *
1.097 + Radscore * 0.982
Performance of the clinical-radiomics
model
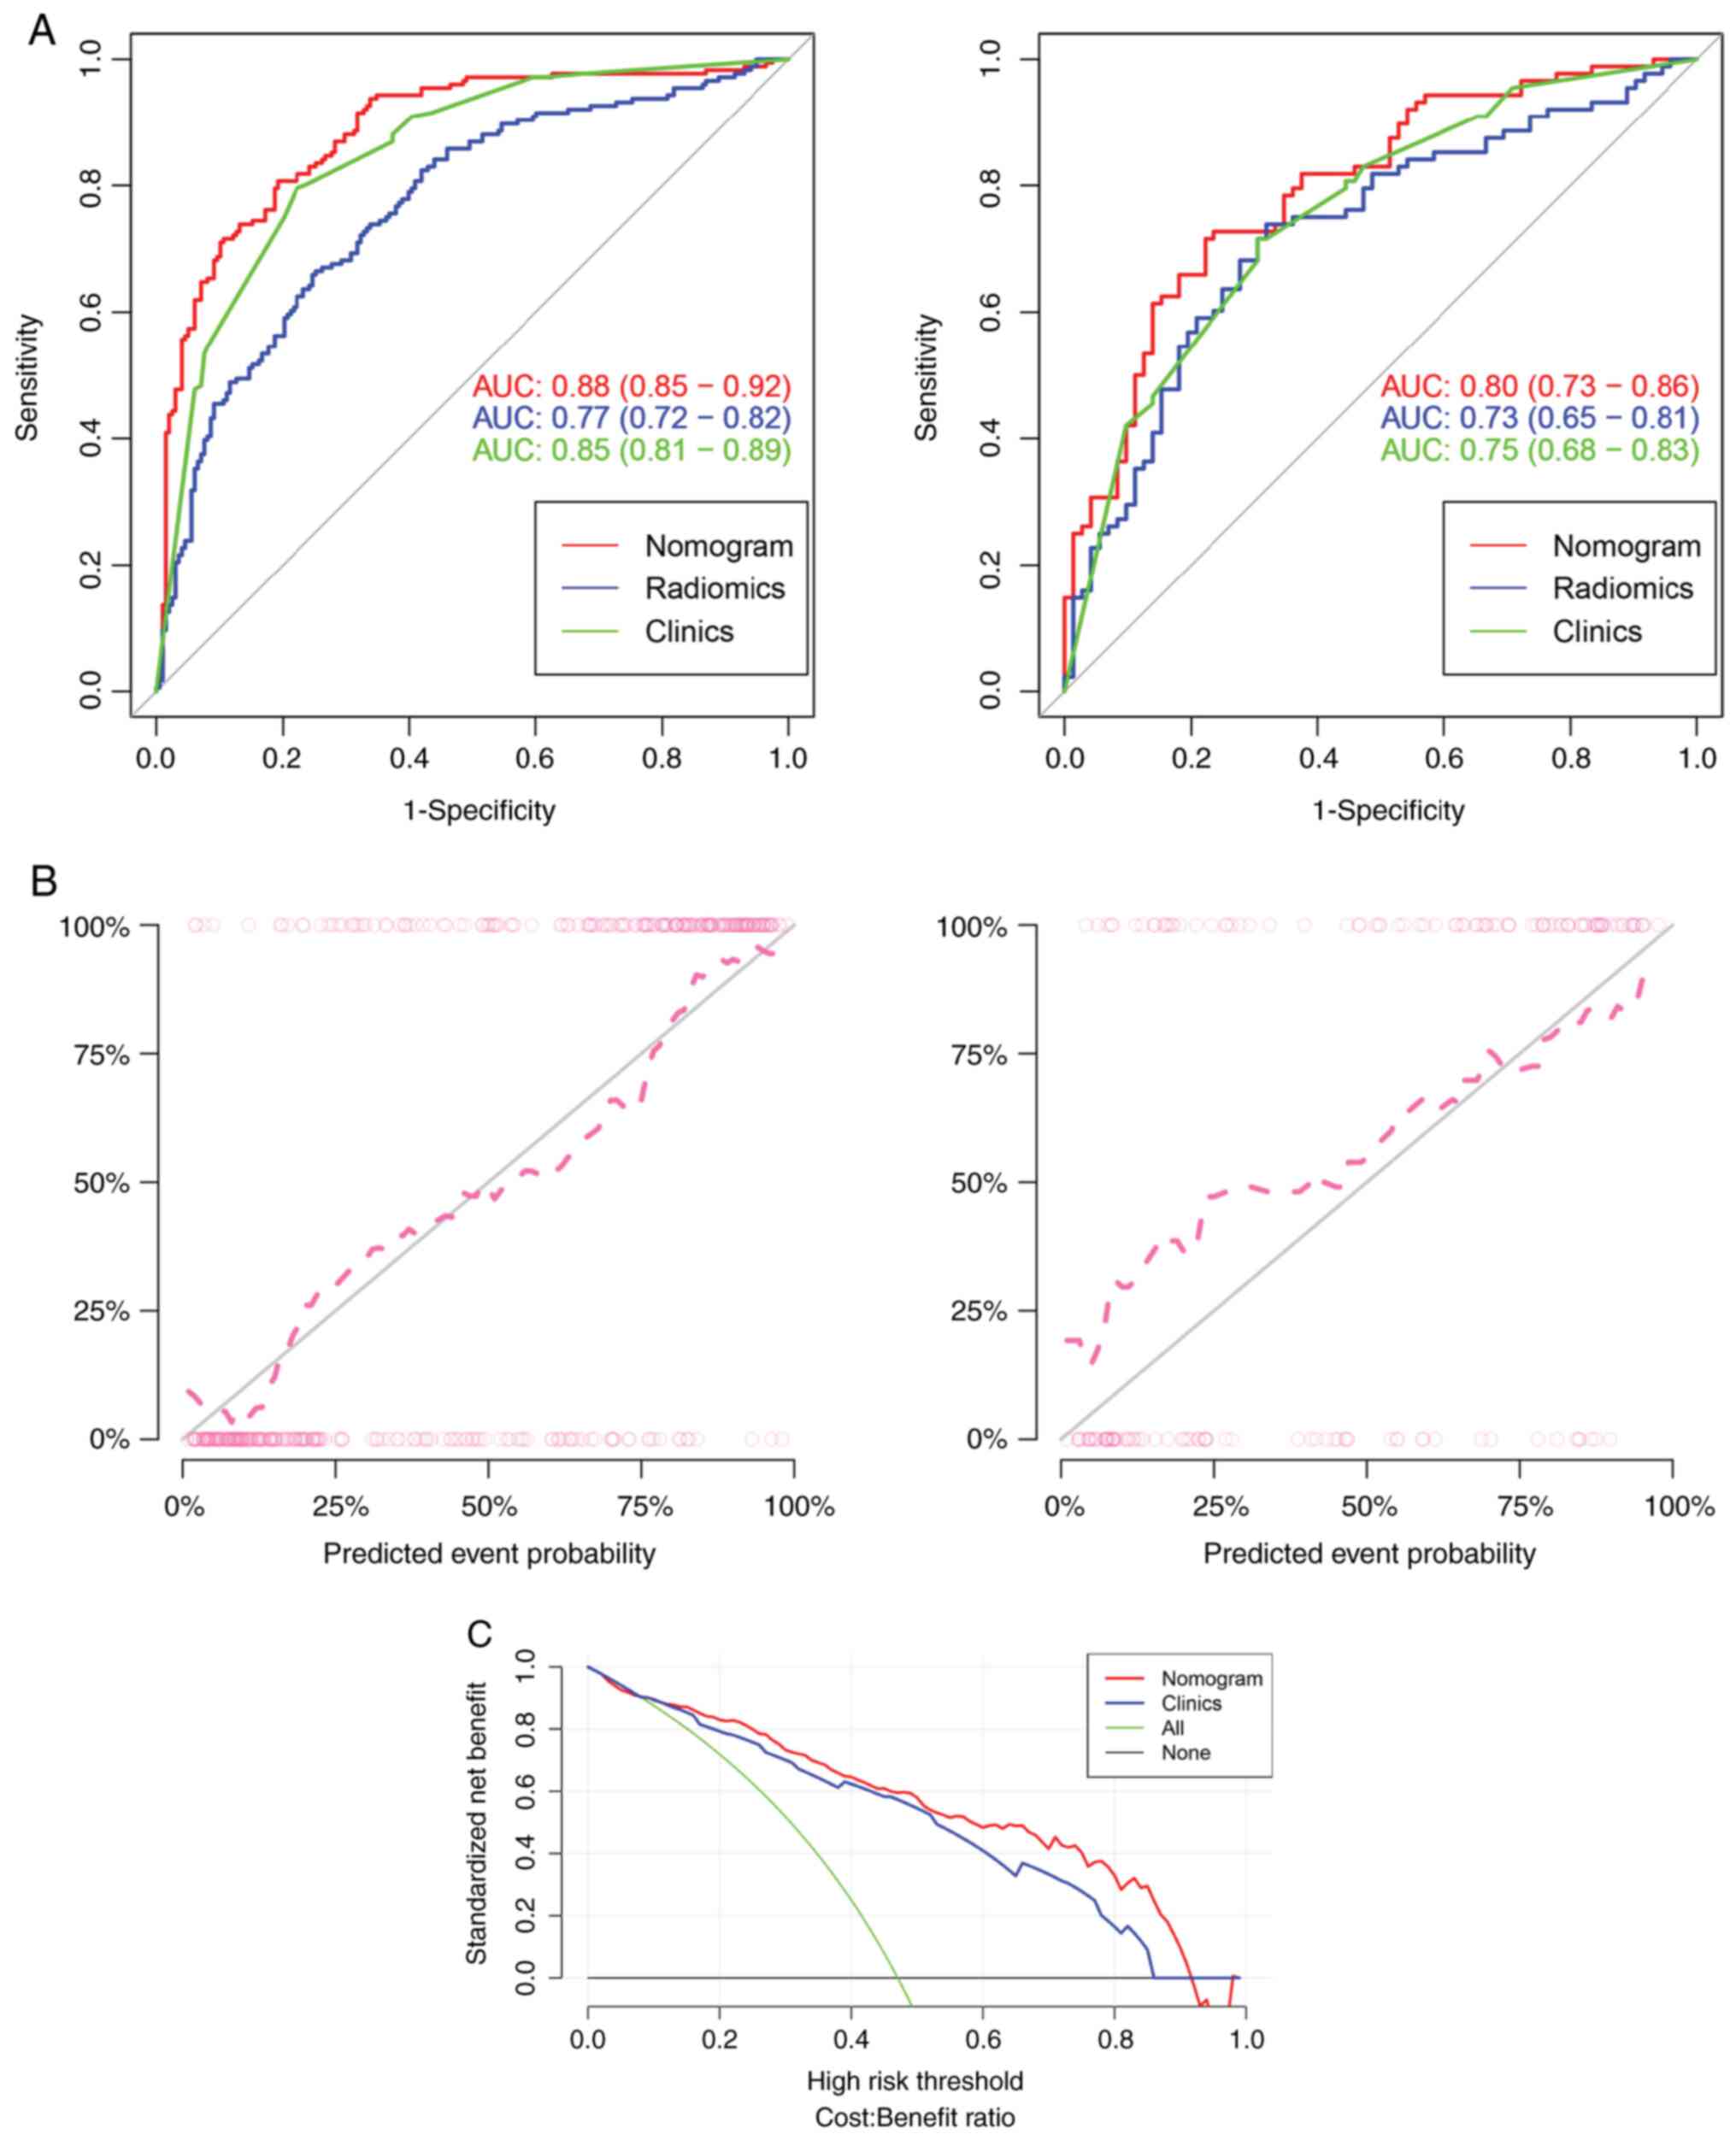
The performance results of the three prediction
models in the training and test sets are listed in Table II. Radiomics prediction model
shows only general prediction ability, as revealed in Fig. 5. The AUC values for the training
and test sets were 0.77 and 0.73, respectively. The
clinical-radiomics prediction model was constructed by combining
clinical factors and rad-score and had better predictive ability
for MI status than the two prediction models alone. The AUCs of the
training and test sets were 0.88 and 0.80, respectively (Fig. 5). Both calibration curve and DCA
indicated that radiomics nomogram has favorable calibration degree
and clinical application value (Fig.
5).
 | Table IIPredictive performance of the three
models. |
Table II
Predictive performance of the three
models.
| | AUC (95% CI) | Accuracy | Sensitivity | Specificity | PPV | NPV |
|---|
| Radiomics | | | | | | |
|
Training
set | 0.77
(0.72-0.82) | 0.709 | 0.665 | 0.747 | 0.701 | 0.715 |
|
Test
set | 0.73
(0.65-0.81) | 0.675 | 0.580 | 0.792 | 0.773 | 0.606 |
| Clinics | | | | | | |
|
Training
set | 0.85
(0.81-0.89) | 0.786 | 0.795 | 0.778 | 0.761 | 0.811 |
|
Test
set | 0.75
(0.68-0.83) | 0.706 | 0.716 | 0.694 | 0.741 | 0.667 |
| Nomogram | | | | | | |
|
Training
set | 0.88
(0.85-0.92) | 0.807 | 0.807 | 0.808 | 0.789 | 0.825 |
|
Test
set | 0.80
(0.73-0.86) | 0.731 | 0.792 | 0.675 | 0.693 | 0.778 |
Discussion
The treatment of gastric cancer has entered the era
of multidisciplinary collaborative comprehensive treatment centered
on surgery, and the prognostic differences for the same treatment
among patients at the same stage persist due to the inherent
heterogeneity of tumors (13,14).
Therefore, accurate determination of the risk factors for
postoperative recurrence and metastasis of gastric cancer can
provide more suitable treatment methods and preventive measures for
patients. MI is an important step in tumor diffusion and metastasis
(15,16), and MI status is an important
independent predictor of clinical factors affecting patients
(17,18).
Medical images are morphological representations of
tumor tissues and cells that can reflect tumor heterogeneity
(19). Images contain considerable
information about tumor biological behavior, and radiomics can
extract high-dimensional information. The combined analysis of
high-dimensional information obtained from images and clinical
markers as a stratification tool holds the most potential in
assessing a patient's risk; numerous previous studies have also
confirmed this view (20). In the
present study, the radiomics features of patients were combined
with valuable clinical factors to build a model to predict the MI
status of patients with gastric cancer to facilitate the
formulation of more suitable individualized treatment plans. The
utilization of a user-friendly nomogram incorporating radiomics
features and T and N stage demonstrate excellent performance in
both cohorts. In 2020, Chen et al (21) performed a similar study, but the
performance of our model was improved compared with that of Chen's.
In the aforementioned study, the AUC of the Clinical-Radscore model
integrating clinical features and Radscore is 0.856. There may be
two reasons to explain this. First, 1,834 features were extracted
from the segmentation of the image, while only 180 features were
extracted in Chen et al's (21) study. Higher-order features may
contain more valuable information. During feature screening, a more
advantageous method was applied. High-dimensional features often
contain a large amount of irrelevant and redundant information,
which can easily lead to overfitting of artificial intelligence
(AI) models, that is, poor performance of models on unseen data. In
the present study, PCA was performed on the original feature data
to ensure they were uncorrelated. Then, the improved supervised
locality preserving projections (SLPP) were used to map the data
after PCA while preserving the manifold structure of the feature
data, making it easier to distinguish. Finally, the dimensionality
of the feature space was reduced according to the cumulative
contribution of PCA and the eigenvalue of SLPP. The experimental
results showed that the PCA could effectively reduce the redundancy
of feature data and improve the classification accuracy. After the
dimensionality reduction, the mRMR and LASSO were used to select
the features. In medical image-based AI research, LASSO and mRMR
are the most commonly used feature filtering algorithms (22,23).
First, mRMR eliminates redundant and irrelevant features, retaining
a subset of 30 features. Subsequently, the optimized feature subset
is selected using LASSO to construct the final model. The LASSO
algorithm offers two key advantages: First, it avoids overfitting
by selecting features based on their univariate association with
the outcome; second, it enables the combination of a chosen set of
features into a label. In the present study, 9 radiomics features
associated with MI were specifically selected to construct
radiomics signature to unveil tumor biological attributes that may
not be apparent in conventional CT images. Subsequently, the
rad-score is calculated by integrating these 9 features weighted by
their coefficients. Following this approach, it was aimed to
develop a radiomics model for predicting MI in patients with
gastric cancer. Our radiomics model demonstrated mediocre
discrimination performance with an AUC of 0.77 for the training set
and 0.73 for the test set.
Furthermore, although radiomics can answer some of
the questions that traditional imaging interpretation cannot, it
cannot answer all questions related to clinical decision making.
The importance of clinical features should not be overlooked in
medical problems. Therefore, radiomics was not selected as the only
predictor in the present study: Radiomics features were combined
with clinically independent risk factors. A previous studies have
verified that T stage and lymph node metastasis are independent
risk factors for MI (21), and the
univariate analysis in the present study reached the same
conclusion. However, the two groups did not show any statistically
significant differences in terms of sex, age, or location in
univariate analysis. After multivariable analysis, T and N stage
were finally included in the nomogram. The combined model achieved
an AUC of 0.88 in the training set and 0.80 in the test set,
indicating that the clinical-radiomic model exhibited superior
predictive performance compared with either model alone. To
mitigate the bias resulting from radiologists' erroneous
assessments of T and N staging, pathological T stage and N stage
were employed for model establishment. In future applications, T
stage and N stage judged by CT images may be used instead of
postoperative pathological stage, which will be more conducive to
the widespread application of the model. The advantage of the
present study lies in the inclusion of easily obtainable T and N
stage and rad-score in the predictive model, rendering the
developed nomogram a reliable and non-invasive tool for
preoperative prediction of MI in gastric cancer.
The present study has certain limitations. First,
the patient data were retrospectively collected with certain
selection biases, highlighting the need for future planned
prospective studies. Second, the lack of external validation data
necessitates the collection of more multicenter data in future
studies to enhance the model's reliability. Finally, numerous
previous studies have constructed nomograms to predict clinical
events in gastric cancer, and these prediction models can be
integrated in the future to provide a more comprehensive and
reliable basis for clinicians to formulate individual treatment
plans.
In conclusion, the present study demonstrated that
the radio-clinical model based on the radiomics signature and T, N
stage may be used as a credible and non-invasive modality to
predict MI in gastric cancer. This model provided a reliable basis
for doctors to choose suitable treatment programs for patients and
improve the survival status and prognosis.
Acknowledgements
Not applicable.
Funding
Funding: The present study was supported by Medical Health
Science and Technology Project of Zhejiang (grant nos. 2021KY583
and 2022KY655) and the Key Laboratory of Prevention, Diagnosis and
Therapy of Upper Gastrointestinal Cancer of Zhejiang (grant no.
2022E10021).
Availability of data and materials
The data generated in the present study are not
publicly available due to patients' information privacy but may be
requested from the corresponding author.
Authors' contributions
YHT completed the initial manuscript and designed
the whole study. CH collected patient data and recorded the needed
information. ZH and HYC collected imaging data and participated in
revising the manuscript. ZYX participated in designing the study.
XPC and LS participated in the statistical analysis and provided
result interpretation. YHT and CH confirm the authenticity of all
the raw data. All authors contributed to the article, and read and
approved the final version of the manuscript.
Ethics approval and consent to
participate
The present retrospective study was approved
(approval no. IRB-2022-69) by the review board of the Medical
Ethics Committee of Zhejiang Cancer Hospital (Hangzhou, China). The
requirement for informed consent was waived.
Patient consent for publication
Consent for publication was waived for the present
study.
Competing interests
The authors declare that they have no competing
interests.
References
|
1
|
Zheng R, Zhang S, Zeng H, Wang S, Sun K,
Chen R, Li L, Wei W and He J: Cancer incidence and mortality in
China, 2016. J Natl Cancer Center. 2:1–9. 2022.PubMed/NCBI View Article : Google Scholar
|
|
2
|
Wang A, Tan Y, Geng X, Chen X and Wang S:
Lymphovascular invasion as a poor prognostic indicator in thoracic
esophageal carcinoma: A systematic review and meta-analysis. Dis
Esophagus. 32:2019.PubMed/NCBI View Article : Google Scholar
|
|
3
|
Hogan J, Chang KH, Duff G, Samaha G, Kelly
N, Burton M, Burton E and Coffey JC: Lymphovascular invasion: A
comprehensive appraisal in colon and rectal adenocarcinoma. Dis
Colon Rectum. 58:547–555. 2015.PubMed/NCBI View Article : Google Scholar
|
|
4
|
Sun Q, Liu T, Liu P, Luo J, Zhang N, Lu K,
Ju H, Zhu Y, Wu W, Zhang L, et al: Perineural and lymphovascular
invasion predicts for poor prognosis in locally advanced rectal
cancer after neoadjuvant chemoradiotherapy and surgery. J Cancer.
10:2243–2249. 2019.PubMed/NCBI View Article : Google Scholar
|
|
5
|
Yuk HD, Jeong CW, Kwak C, Kim HH and Ku
JH: Lymphovascular invasion have a similar prognostic value as
lymph node involvement in patients undergoing radical cystectomy
with urothelial carcinoma. Sci Rep. 8(15928)2018.PubMed/NCBI View Article : Google Scholar
|
|
6
|
Epstein JD, Kozak G, Fong ZV, He J, Javed
AA, Joneja U, Jiang W, Ferrone CR, Lillemoe KD, Cameron JL, et al:
Microscopic lymphovascular invasion is an independent predictor of
survival in resected pancreatic ductal adenocarcinoma. J Surg
Oncol. 116:658–664. 2017.PubMed/NCBI View Article : Google Scholar
|
|
7
|
Fujikawa H, Koumori K, Watanabe H, Kano K,
Shimoda Y, Aoyama T, Yamada T, Hiroshi T, Yamamoto N, Cho H, et al:
The clinical significance of lymphovascular invasion in gastric
cancer. In Vivo. 34:1533–1539. 2020.PubMed/NCBI View Article : Google Scholar
|
|
8
|
Maniaci A, Fakhry N, Chiesa-Estomba C,
Lechien JR and Lavalle S: Synergizing ChatGPT and general AI for
enhanced medical diagnostic processes in head and neck imaging. Eur
Arch Otorhinolaryngol. 281:3297–3298. 2024.PubMed/NCBI View Article : Google Scholar
|
|
9
|
Yardımcı AH, Koçak B, Turan Bektaş C, Sel
İ, Yarıkkaya E, Dursun N, Bektaş H, Usul Afşar Ç, Gürsu RU and
Kılıçkesmez Ö: Tubular gastric adenocarcinoma: Machine
learning-based CT texture analysis for predicting lymphovascular
and perineural invasion. Diagn Interv Radiol. 26:515–522.
2020.PubMed/NCBI View Article : Google Scholar
|
|
10
|
Hirabayashi S, Kosugi S, Isobe Y,
Nashimoto A, Oda I, Hayashi K, Miyashiro I, Tsujitani S, Kodera Y,
Seto Y, et al: Development and external validation of a nomogram
for overall survival after curative resection in serosa-negative,
locally advanced gastric cancer. Ann Oncol. 25:1179–1184.
2014.PubMed/NCBI View Article : Google Scholar
|
|
11
|
Wang PL, Xiao FT, Gong BC, Liu FN and Xu
HM: A nomogram for predicting overall survival of gastric cancer
patients with insufficient lymph nodes examined. J Gastrointest
Surg. 21:947–956. 2017.PubMed/NCBI View Article : Google Scholar
|
|
12
|
Vickers AJ, Cronin AM, Elkin EB and Gonen
M: Extensions to decision curve analysis, a novel method for
evaluating diagnostic tests, prediction models and molecular
markers. BMC Med Inform Decis Mak. 8(53)2008.PubMed/NCBI View Article : Google Scholar
|
|
13
|
Smyth EC, Nilsson M, Grabsch HI, van
Grieken NC and Lordick F: Gastric cancer. Lancet. 396:635–648.
2020.PubMed/NCBI View Article : Google Scholar
|
|
14
|
Jiang Y, Zhang Q, Hu Y, Li T, Yu J, Zhao
L, Ye G, Deng H, Mou T, Cai S, et al: ImmunoScore signature: A
prognostic and predictive tool in gastric cancer. Ann Surg.
267:504–513. 2018.PubMed/NCBI View Article : Google Scholar
|
|
15
|
Zhang CD, Ning FL, Zeng XT and Dai DQ:
Lymphovascular invasion as a predictor for lymph node metastasis
and a prognostic factor in gastric cancer patients under 70 years
of age: A retrospective analysis. Int J Surg. 53:214–220.
2018.PubMed/NCBI View Article : Google Scholar
|
|
16
|
Goto A, Nishikawa J, Hideura E, Ogawa R,
Nagao M, Sasaki S, Kawasato R, Hashimoto S, Okamoto T, Ogihara H,
et al: Lymph node metastasis can be determined by just tumor depth
and lymphovascular invasion in early gastric cancer patients after
endoscopic submucosal dissection. Eur J Gastroenterol Hepatol.
29:1346–1350. 2017.PubMed/NCBI View Article : Google Scholar
|
|
17
|
Wu L, Liang Y, Zhang C, Wang X, Ding X,
Huang C and Liang H: Prognostic significance of lymphovascular
infiltration in overall survival of gastric cancer patients after
surgery with curative intent. Chin J Cancer Res. 31:785–796.
2019.PubMed/NCBI View Article : Google Scholar
|
|
18
|
Xue L, Chen XL, Lin PP, Xu YW, Zhang WH,
Liu K, Chen XZ, Yang K, Zhang B, Chen ZX, et al: Impact of
capillary invasion on the prognosis of gastric adenocarcinoma
patients: A retrospective cohort study. Oncotarget. 7:31215–31225.
2016.PubMed/NCBI View Article : Google Scholar
|
|
19
|
Choi SW, Cho HH, Koo H, Cho KR, Nenning
KH, Langs G, Furtner J, Baumann B, Woehrer A, Cho HJ, et al:
Multi-habitat radiomics unravels distinct phenotypic subtypes of
glioblastoma with clinical and genomic significance. Cancers
(Basel). 12(1707)2020.PubMed/NCBI View Article : Google Scholar
|
|
20
|
Huang Y, Liu Z, He L, Chen X, Pan D, Ma Z
and Liang C, Tian J and Liang C: Radiomics signature: A potential
biomarker for the prediction of disease-free survival in early
stage (I or II) non-small cell lung cancer. Radiology. 281:947–957.
2016.PubMed/NCBI View Article : Google Scholar
|
|
21
|
Chen X, Yang Z, Yang J, Liao Y, Pang P,
Fan W and Chen X: Radiomics analysis of contrast-enhanced CT
predicts lymphovascular invasion and disease outcome in gastric
cancer: a preliminary study. Cancer Imaging. 20(24)2020.PubMed/NCBI View Article : Google Scholar
|
|
22
|
Peng H, Long F and Ding C: Feature
selection based on mutual information: criteria of max-dependency,
max-relevance, and min-redundancy. IEEE Trans Pattern Anal Mach
Intell. 27:1226–1238. 2005.PubMed/NCBI View Article : Google Scholar
|
|
23
|
Hepp T, Schmid M, Gefeller O, Waldmann E
and Mayr A: Approaches to regularized regression-A comparison
between gradient boosting and the Lasso. Methods Inf Med.
55:422–430. 2016.PubMed/NCBI View Article : Google Scholar
|


