Introduction
Sarcopenia is defined as the loss of skeletal muscle
mass and muscle dysfunction, and is caused not only by aging, but
also by chronic diseases, including liver disease (1–3). The
Japan Society of Hepatology set the sarcopenia assessment criteria
in liver disease (4). These criteria
include measuring grip strength and muscle mass by computed
tomography (CT) or bioelectrical impairment analysis (BIA).
Recently, an increasing number of studies have demonstrated that
sarcopenia may affect the clinical state of patients with liver
disease (1–3). Moreover, skeletal muscle wasting
assessed by CT has been reported to be a prognostic marker for
patients with hepatocellular carcinoma (HCC) treated with sorafenib
(5,6). In those reports, skeletal muscle mass
was usually measured by imaging modalities, such as CT and magnetic
resonance imaging. However, costly specialized software is required
to measure skeletal muscle mass. Durand et al recently
reported that psoas muscle thickness on CT was easily calculated as
muscle mass, and this may be a predictor of mortality in patients
with cirrhosis, independent of the Model for End-Stage Liver
Disease (MELD) score (7). This
simple method did not require specialized software.
The aim of the present study was to determine
whether psoas muscle thickness predicts the prognosis of patients
with HCC treated with sorafenib.
Patients and methods
Patients
This investigation was conducted in accordance with
the tenets of the Declaration of Helsinki and was approved by the
Ethics Committee of Nagasaki University Hospital (approval no.
16062720).
In total, 40 HCC patients (37 men and 3 women;
median age, 71.5 years) who were treated with sorafenib at Nagasaki
University Hospital between May 2009 and September 2013, were
enrolled in this study. The 40 patients were divided into two
groups on the basis of change in TPMT/height as follows: Mild
atrophy group (n=20) and severe atrophy group (n=20).
The diagnosis of hepatitis and liver cirrhosis was
made on the basis of CT imaging and blood analysis (platelet count,
hyaluronic acid and type IV collagen). Liver function was evaluated
using the Child-Pugh (CP) classification. HCC stage was classified
in accordance with the guidelines of the Liver Cancer Study Group
of Japan, 5th edition (8).
Sorafenib was administered at doses of 800 mg or 400
mg/day, according to age, performance status (PS), and CP
classification of the patients.
Measurement of skeletal muscle
mass
As an indicator of skeletal muscle mass, TPMT was
measured on CT at the level of the umbilicus prior to treatment
initiation and after 1–3 months of treatment. Psoas mass thickness
was normalized by division by height (7).
Statistical analysis
The Kaplan-Meier method was used for
progression-free survival (PFS) and overall survival (OS), and Cox
hazard analysis was used to determine the risk factors for PFS and
OS. In addition, differences in the curves were evaluated using the
long-rank test. P-values of <0.05 were considered to indicate
statistically significant differences. Statistical analyses were
conducted using StatFlex software, version 6 (Artech Co., Ltd.,
Osaka, Japan).
Results
Patient characteristics
The baseline characteristics and laboratory data of
the patients are summarized in Table
I. The liver function was normal in 2 patients, 11 patients had
chronic hepatitis, and 27 had cirrhosis.
 | Table I.Patient characteristics. |
Table I.
Patient characteristics.
| Characteristics | N (n=40) | IQR | % |
|---|
| Age (years) | 71.5 | 6.8 |
|
| Sex |
|
|
|
| Male | 37 |
| 92.5 |
|
Female | 3 |
| 7.5 |
| Background |
|
|
|
| Normal
liver | 2 |
| 5.0 |
| Chronic
hepatitis | 11 |
| 22.5 |
|
Cirrhosis | 27 |
| 72.5 |
| Etiology |
|
|
|
| HBV | 11 |
| 27.5 |
| HCV | 13 |
| 32.5 |
|
Other | 16 |
| 40.0 |
| Child-Pugh score |
|
|
|
| 5 | 24 |
| 60.0 |
| 6 | 8 |
| 20.0 |
| 7 | 6 |
| 15.0 |
| 8 | 1 |
| 2.5 |
| 9 | 1 |
| 2.5 |
| Vp |
|
|
|
|
Vp− | 36 |
| 90.0 |
|
Vp+ | 4 |
| 10.0 |
| HCC stage |
|
|
|
| II | 7 |
| 17.5 |
| III | 10 |
| 25.0 |
| IVa | 10 |
| 25.0 |
| IVb | 13 |
| 32.5 |
| ALT (IU/l) | 33.5 | 21.8 |
|
| T-Bil (mg/dl) | 0.8 | 0.26 |
|
| Alb (g/dl) | 3.6 | 0.28 |
|
| PLT
(x104/µl) | 13.2 | 3.45 |
|
| AFP (ng/ml) | 26 | 341.7 |
|
| AFP-L3 (%) | 12.8 | 15.7 |
|
| DCP (mAU/ml) | 241 | 3226.5 |
|
| Height (m) | 1.628 | 0.054 |
|
| Pre-TPMT/height
(mm/m) | 18.27 | 3.09 |
|
| Change in TPMT/height
(mm/m) | 0.59 | 0.51 |
|
The etiologies of HCC were hepatitis B virus
infection (n=11), hepatitis C virus infection (n=13) and others
(n=16).
HCC stage II was diagnosed in 7, stage III in 10,
stage IVa in 10 and stage IVb in 13 patients; 4 patients exhibited
portal vein invasion (Vp).
The response of HCC to treatment was evaluated by a
CT scan at 1–3 months after sorafenib treatment initiation. The
median TPMT/height was 18.27±3.09 mm/m prior to sorafenib
treatment. The change in TPMT/height prior to and after treatment
at 1–3 months was 0.59±0.51 mm/m.
Complete response was reported in 0%, partial
response in 7.5% (n=3), stable disease in 40% (n=16), and
progressive disease in 42.5% (n=17) of the patients. The disease
control rate according to the Response Evaluation Criteria In Solid
Tumors v.1.1 (https://ctep.cancer.gov/protocoldevelopment/docs/recist_guideline.pdf)
was 47.5%. The median PFS was 104 days, and the median OS was 365
days.
Univariate and multivariate analysis
of factors possibly associated with PFS and OS
Univariate analysis revealed that the factors
associated with PFS were Vp2, α-fetoprotein (AFP), Lens culinaris
agglutinin-reactive fraction of AFP (AFP-L3), and des-γ-carboxy
prothrombim (DCP). Multivariate analysis revealed that AFP-L3 was
an independent factor for PFS, whereas pre-TPMT/height was not
associated with PFS.
Univariate analysis revealed that factors associated
with OS were PS, CP class, serum aspartate transaminase (ALT)
level, serum albumin level, AFP and AFP-L3. Multivariate analysis
revealed that PS and AFP-L3 were independent factors for OS.
Pre-TPMT/height was not associated with OS.
Furthermore, the association between each factor and
the change in TPMT/height before and after treatment was examined.
Univariate analysis revealed that the factors associated with PFS
were Vp2, AFP, AFP-L3 and DCP. Multivariate analysis revealed that
PS and AFP-L3 were independent factors for PFS. The change in
TPMT/height was not associated with PFS (Table II). Univariate analysis revealed
that the factors associated with OS were PS, CP class, serum ALT
level, serum albumin level, AFP, AFP-L3 and the change in
TPMT/height. Multivariate analysis revealed that PS and the change
of TPMT/height were independent factor for OS (Table III).
| Table II.Univariate and multivariate analysis
of possible risk factors for progression-free survival. |
Table II.
Univariate and multivariate analysis
of possible risk factors for progression-free survival.
|
| Univariate | Multivariate |
|---|
|
|
|
|
|---|
| Variables (n=40) | P-value | HR | P-value | HR |
|---|
| Age (years) | 0.14267 |
|
|
|
| Gender (male vs.
female) | 0.33959 |
|
|
|
| PS≥ (0 vs. ≥1) | 0.40901 |
|
|
|
| CP score | 0.09731 |
|
|
|
| HCC stage (II, III
vs. IVa, IVb) | 0.13077 |
|
|
|
| Vp2 (+ vs. -) | 0.03243 | 5.62262 | 0.34786 | 2.75054 |
| ALT (IU/ml) | 0.11228 |
|
|
|
| PLT
(x104/µl) | 0.39513 |
|
|
|
| Alb (g/dl) | 0.27394 |
|
|
|
| AFP (ng/ml) | 0.03676 | 1.00001 | 0.7604 | 1.00000 |
| AFP-L3 (< vs.
≥10%) | 0.00940 | 3.04096 | 0.04295 | 2.49557 |
| DCP (mAU/ml) | 0.02016 | 1.00006 | 0.29361 | 1.00004 |
| Pre-TPMT/height
(mm/m) | 0.50048 |
|
|
|
| Change in
TPMT/height (mm/m) | 0.48890 |
|
|
|
| Table III.Univariate and multivariate analysis
of possible risk factors for overall survival. |
Table III.
Univariate and multivariate analysis
of possible risk factors for overall survival.
|
| Univariate | Multivariate |
|---|
|
|
|
|
|---|
| Variables
(n=40) | P-value | HR | P-value | HR |
|---|
| Age (years) | 0.42107 |
|
|
|
| Gender (male vs.
female) | 0.58509 |
|
|
|
| PS (0 vs. ≥1) | 0.01525 | 2.48488 | 0.03273 | 2.79015 |
| CP score | 0.03651 | 1.58368 | 0.29636 |
|
| HCC stage (II, III
vs. IVa, IVb) | 0.47593 |
|
|
|
| Vp2 (+ vs. -) | 0.50677 |
|
|
|
| Alt (IU/ml) | 0.00074 | 1.01986 | 0.30556 |
|
| PLT
(x104/µl) | 0.06438 |
|
|
|
| Alb (g/dl) | 0.03263 | 0.38263 | 0.90507 |
|
| AFP (ng/ml) | 0.00697 | 1.00002 | 0.28770 |
|
| AFP-L3 (< vs.
≥10%) | 0.02407 | 2.39921 | 0.12226 |
|
| DCP (mAU/ml) | 0.65623 |
|
|
|
| Pre-TPMT/height
(mm/m) | 0.54100 |
|
|
|
| Change in
TPMT/height (mm/m) | 0.00100 | 1.95459 | 0.02017 | 2.27120 |
Moreover, the association was examined when the
patients were limited to those with CP score A (n=32). The change
in TPMT/height was also an independent factor for OS (P=0.0439,
hazard ratio=1.99271, data not shown).
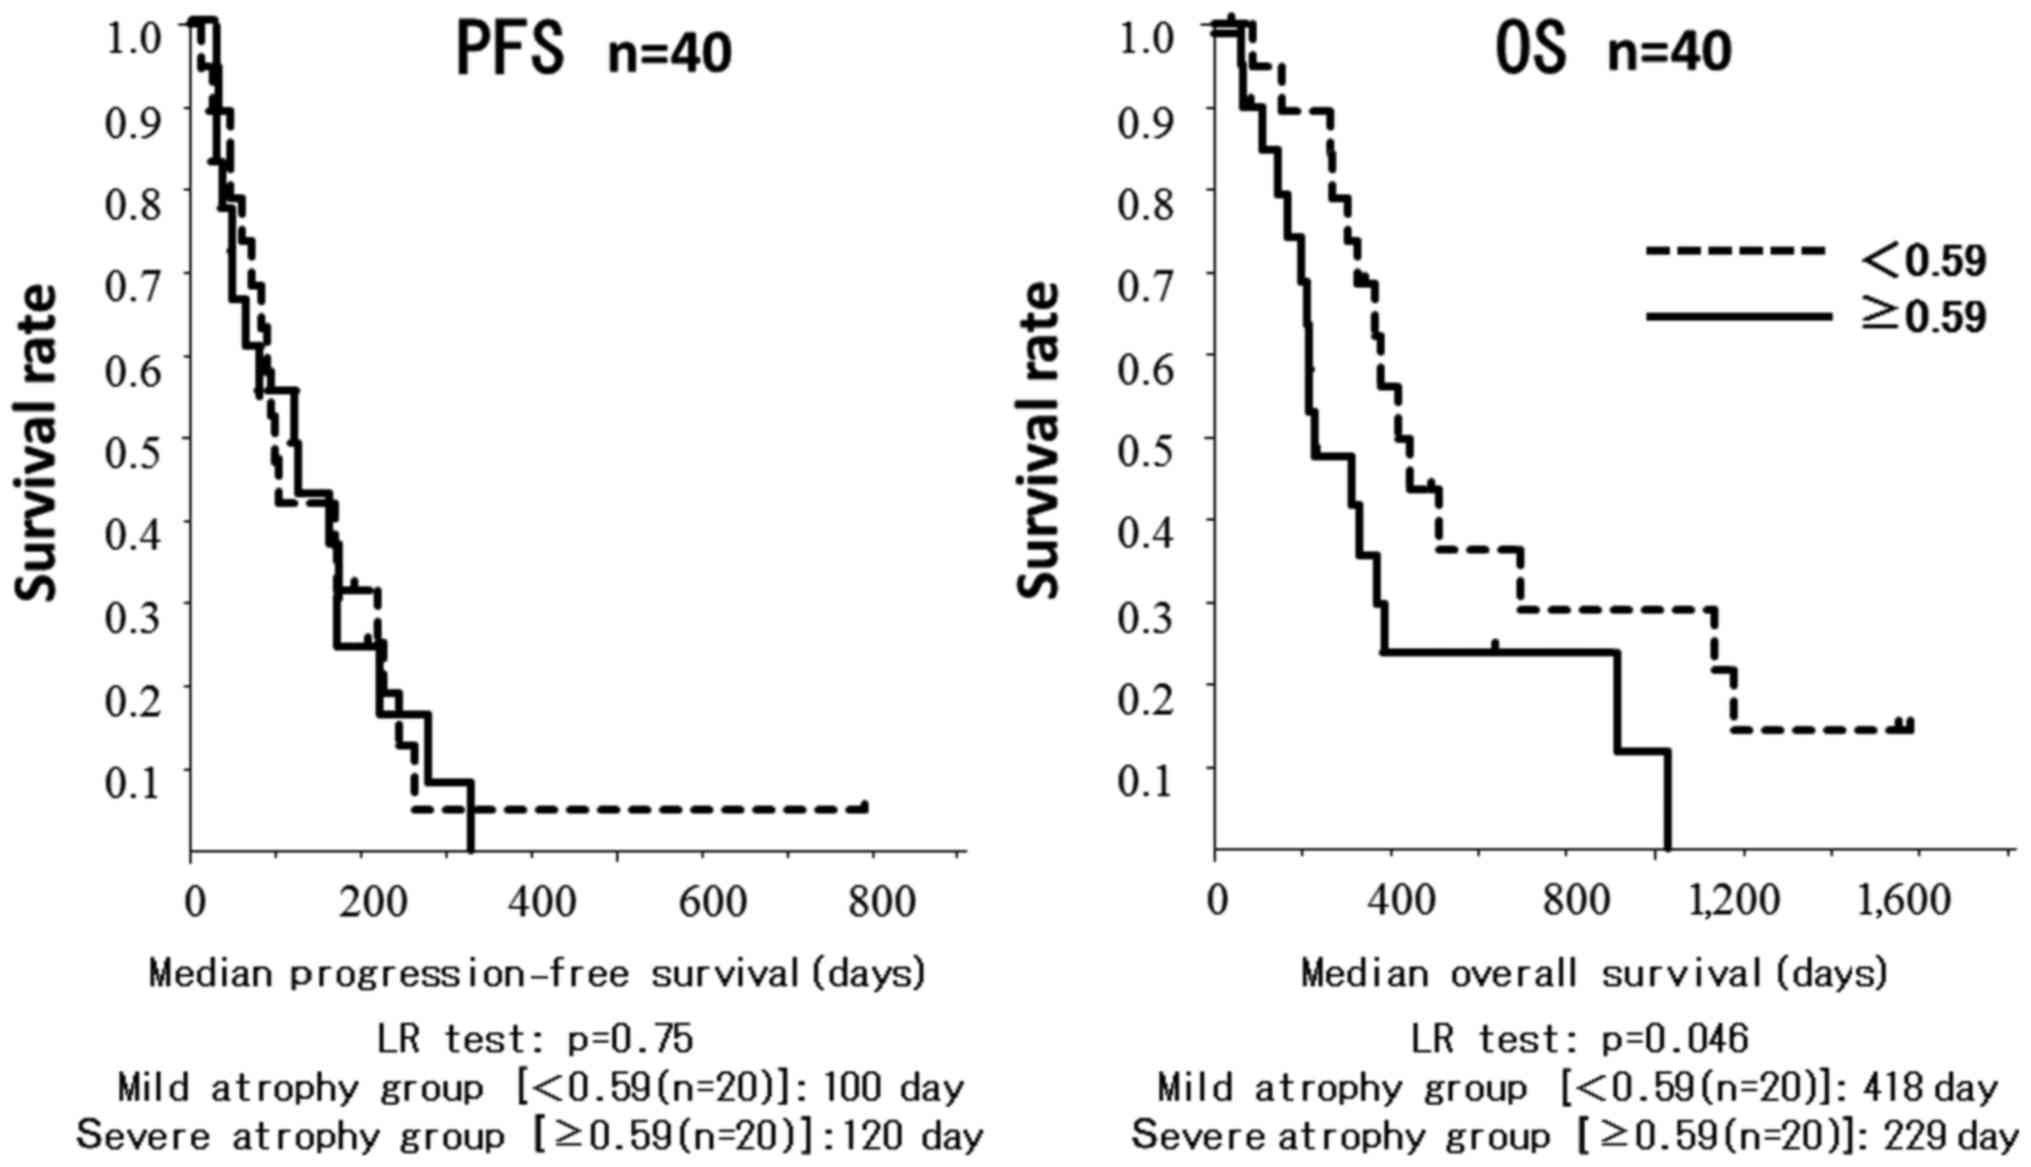
The cut-off value for the difference in TPMT/height
was 0.59 mm/m. Patients in the mild atrophy group had a
significantly longer OS compared with patients in the severe
atrophy group (418±0.12 vs. 229±0.11 days, respectively; P=0.045;
Fig. 1).
Discussion
A number of previous studies reported the efficacy
of sorafenib for the treatment of advanced HCC (9–11).
However, sorafenib is costly and has been associated with severe
adverse effects. Therefore, it is important to establish predictive
factors for sorafenib therapy. Previous studies demonstrated that
several factors, such as Eastern Cooperative Oncology Group PS and
CP class A status were predictive factors for patients with HCC
receiving sorafenib therapy (11,12). In
recent reports, skeletal muscle mass loss was found to be
significantly associated with malnutrition and poor liver function
(13,14). Our study indicated that skeletal
muscle thickness prior to treatment was not associated with PFS or
OS in patients treated with sorafenib. However, the decreased
skeletal muscle thickness prior to treatment was found to be
associated with OS. Multivariate analysis also demonstrated that
decreased skeletal muscle thickness and PS were independent
predictors for survival time. This result indicated that these
malnutritional factors were important for the survival of patients
with HCC treated with sorafenib.
Several recent reports indicated that decreased
skeletal muscle mass was an important prognostic factor in patients
with chronic liver disease and HCC (2,3,5,6). These
results suggested that preventing reductions in skeletal muscle
thickness may improve the OS of patients treated with sorafenib.
The usefulness of nutritional support, such as branched-chain amino
acids (BCAA), and exercise therapies to prevent the decrease in
skeletal muscle mass were reported (3,15,16).
Only in patients with cirrhosis, supplementation with BCAA
prevented skeletal muscle loss (BCAA vs. without BCAA, 0.64±1.04
vs. 1.56±1.77, respectively; P=0.10; data not shown).
Dual energy X-ray absorptiometry (DXA) (17), BIA (18) and CT (19,20) have
been widely used to measure skeletal muscle mass. However, since
DXA and BIA are sensitive to water composition, they are not
considered suitable for patients with cirrhosis. Moreover, most
institutions do not have the necessary equipment to perform these
examinations. CT scans are commonly used to assess the status of
HCC patients treated with sorafenib. Therefore, a number of used CT
to assess patients with chronic liver disease or HCC.
The psoas area at the L3 vertebral level was used in
studies on sarcopenia, as it is considered to be well-correlated
with and may substitute whole-body muscle mass. However, the
measurement of skeletal muscle mass in the psoas area requires
specialized software. Durand et al reported that axial and
transverse psoas thickness on CT scan at the level of the umbilicus
was predictive of mortality in patients with liver cirrhosis,
independent of the MELD score (7).
This method did not require specific software and could be
calculated over a short time on real time and on an outpatient
basis; therefore, it was selected as an indicator of skeletal
muscle mass.
The present study had several limitations, including
the single-centered design and its small sample size. To validate
the findings, large multicenter studies with a larger sample size
are required. In addition, as TPMT/height was measured manually,
the accuracy of this method may have been affected by different
examiners.
In conclusion, the results of the present study
suggest that the change in skeletal muscle thickness, which was
calculated as TPMT/height, may be a predictor of survival in HCC
patients treated with sorafenib, and preventing skeletal muscle
loss may improve the outcome of such patients.
Glossary
Abbreviations
Abbreviations:
|
Vp
|
portal vein invasion
|
|
ALT
|
alanine aminotransferase
|
|
AFP
|
α-fetoprotein
|
|
AFP-L3
|
Lens culinaris
agglutinin-reactive fraction of α-fetoprotein
|
|
DCP
|
des-γ-carboxy prothrombin
|
|
TPMT
|
transverse psoas muscle thickness
|
|
PS
|
performance status
|
|
CP class
|
Child-Pugh class
|
|
CT
|
computed tomography
|
|
PFS
|
progression-free survival
|
|
OS
|
overall survival
|
References
|
1
|
Tandon P, Ney M, Irwin I, Ma MM, Gramlich
L, Bain VG, Esfandiari N, Baracos V, Montano-Loza AJ and Myers RP:
Severe muscle depletion in patients on the liver transplant wait
list: Its prevalence and independent prognostic value. Liver
Transpl. 18:1209–1216. 2012. View
Article : Google Scholar : PubMed/NCBI
|
|
2
|
Montano-Loza AJ, Meza-Junco J, Prado CM,
Lieffers JR, Baracos VE, Bain VG and Sawyer MB: Muscle wasting is
associated with mortality in patients with cirrhosis. Clin
Gastroenterol Hepatol. 10:166–173.e1. 2012. View Article : Google Scholar : PubMed/NCBI
|
|
3
|
Hanai T, Shiraki M, Nishimura K, Ohnishi
S, Imai K, Suetsugu A, Takai K, Shimizu M and Moriwaki H:
Sarcopenia impairs prognosis of patients with liver cirrhosis.
Nutrition. 31:193–199. 2015. View Article : Google Scholar : PubMed/NCBI
|
|
4
|
Nishikawa H, Shiraki M, Hiramatsu A,
Moriya K, Hino K and Nishiguchi S: Japan Society of Hepatology
guidelines for sarcopenia in liver disease (1st edition):
Recommendation from the working group for creation of sarcopenia
assessment criteria. Hepatol Res. 46:951–963. 2016. View Article : Google Scholar : PubMed/NCBI
|
|
5
|
Imai K, Takai K, Hanai T, Ideta T,
Miyazaki T, Kochi T, Suetsugu A, Shiraki M and Shimizu M: Skeletal
muscle depletion predicts the prognosis of patients with
hepatocellular carcinoma treated with sorafenib. Int J Mol Sci.
16:9612–9624. 2015. View Article : Google Scholar : PubMed/NCBI
|
|
6
|
Hiraoka A, Hirooka M, Koizumi Y, Izumoto
H, Ueki H, Kaneto M, Kitahata S, Aibiki T, Tomida H, Miyamoto Y, et
al: Muscle volume loss as a prognostic marker in hepatocellular
carcinoma patients treated with sorafenib. Hepatol Res. 47:558–565.
2017. View Article : Google Scholar : PubMed/NCBI
|
|
7
|
Durand F, Buyse S, Francoz C, Laouénan C,
Bruno O, Belghiti J, Moreau R, Vilgrain V and Valla D: Prognostic
value of muscle atrophy in cirrhosis using psoas muscle thickness
on computed tomography. J Hepatol. 60:1151–1157. 2014. View Article : Google Scholar : PubMed/NCBI
|
|
8
|
Liver Cancer Study Group of Japan,
corp-author. General Rules for the Clinical and Pathological Study
of Primary Liver Cancer. 5th. Kanehara & Co., Ltd.; Tokyo: pp.
242009
|
|
9
|
Llovet JM, Ricci S, Mazzaferro V, Hilgard
P, Gane E, Blanc JF, de Oliveira AC, Santoro A, Raoul JL, Forner A,
et al: Sorafenib in advanced hepatocellular carcinoma. N Engl J
Med. 359:378–390. 2008. View Article : Google Scholar : PubMed/NCBI
|
|
10
|
Cheng AL, Kang YK, Chen Z, Tsao CJ, Qin S,
Kim JS, Luo R, Feng J, Ye S, Yang TS, et al: Efficacy and safety of
sorafenib in patients in the Asia-Pacific region with advanced
hepatocellular carcinoma: A phase III randomised, double-blind,
placebo-controlled trial. Lancet Oncol. 10:25–34. 2009. View Article : Google Scholar : PubMed/NCBI
|
|
11
|
Bruix J, Raoul JL, Sherman M, Mazzaferro
V, Bolondi L, Craxi A, Galle PR, Santoro A, Beaugrand M,
Sangiovanni A, et al: Efficacy and safety of sorafenib in patients
with advanced hepatocellular carcinoma: Subanalyses of a phase III
trial. J Hepatol. 57:821–829. 2012. View Article : Google Scholar : PubMed/NCBI
|
|
12
|
Hollebecque A, Cattan S, Romano O, Sergent
G, Mourad A, Louvet A, Dharancy S, Boleslawski E, Truant S, Pruvot
FR, et al: Safety and efficacy of sorafenib in hepatocellular
carcinoma: The impact of the Child-Pugh score. Aliment Pharmacol
Ther. 34:1193–1201. 2011. View Article : Google Scholar : PubMed/NCBI
|
|
13
|
Montano-Loza AJ: Clinical relevance of
sarcopenia in patients with cirrhosis. World J Gastroenterol.
20:8061–8071. 2014. View Article : Google Scholar : PubMed/NCBI
|
|
14
|
Periyalwar P and Dasarathy S: Malnutrition
in cirrhosis: Contribution and consequences of sarcopenia on
metabolic and clinical responses. Clin Liver Dis. 16:95–131. 2012.
View Article : Google Scholar : PubMed/NCBI
|
|
15
|
Toshikuni N, Arisawa T and Tsutsumi M:
Nutrition and exercise in the management of liver cirrhosis. World
J Gastroenterol. 20:7286–7297. 2014. View Article : Google Scholar : PubMed/NCBI
|
|
16
|
Kaibori M, Ishizaki M, Matsui K, Nakatake
R, Yoshiuchi S, Kimura Y and Kwon AH: Perioperative exercise for
chronic liver injury patients with hepatocellular carcinoma
undergoing hepatectomy. Am J Surg. 206:202–209. 2013. View Article : Google Scholar : PubMed/NCBI
|
|
17
|
Sanada K, Miyachi M, Tanimoto M, Yamamoto
K, Murakami H, Okumura S, Gando Y, Suzuki K, Tabata I and Higuchi
M: A cross-sectional study of sarcopenia in Japanese men and women:
Reference values and association with cardiovascular risk factors.
Eur J Appl Physiol. 110:57–65. 2010. View Article : Google Scholar : PubMed/NCBI
|
|
18
|
Tanimoto Y, Watanabe M, Sun W, Hirota C,
Sugiura Y, Kono R, Saito M and Kono K: Association between muscle
mass and disability in performing instrumental activities of daily
living (IADL) in community-dwelling elderly in Japan. Arch Gerontol
Geriatr. 54:e230–e233. 2012. View Article : Google Scholar : PubMed/NCBI
|
|
19
|
Hiraoka A, Aibiki T, Okudaira T, Toshimori
A, Kawamura T, Nakahara H, Suga Y, Azemoto N, Miyata H, Miyamoto Y,
et al: Muscle atrophy as pre-sarcopenia in Japanese patients with
chronic liver disease: Computed tomography is useful for
evaluation. J Gastroenterol. 50:1206–1213. 2015. View Article : Google Scholar : PubMed/NCBI
|
|
20
|
Yoshizumi T, Shirabe K, Nakagawara H,
Ikegami T, Harimoto N, Toshima T, Yamashita Y, Ikeda T, Soejima Y
and Maehara Y: Skeletal muscle area correlates with body surface
area in healthy adults. Hepatol Res. 44:313–318. 2014. View Article : Google Scholar : PubMed/NCBI
|