Introduction
Patients with end-stage renal disease (ESRD) on
maintenance hemodialysis (HD) are susceptible to changes in their
blood vessels. A number of studies have confirmed the high
prevalence of atherosclerotic lesions in the arteries of patients
on HD (1,2). It is well established that the function
of the endothelium is intricately involved in atherogenesis
(3). ESRD leads to altered
properties and responses of the endothelium. However, the
mechanisms through which uremia affects endothelial cells and
causes atherosclerotic changes remain elusive. Therefore, it is
worth exploring alternative metabolic pathways that may be involved
in atherosclerotic formation in patients on HD. Vascular
endothelial growth factor (VEGF) and its receptors (VEGFRs) are
crucial regulators of vasculogenesis and angiogenesis under
physiological and pathophysiological conditions (3). The VEGF-VEGFR axis regulates several
biological functions in the endothelium. Human endothelial cells
express three related membrane-bound VEGFRs, VEGFR1, VEGFR2 and
VEGFR3, which are encoded by different genes. All membrane-bound
receptors possess an extracellular, transmembrane and an
intracellular domain that mediates critical signalling pathways in
endothelial cells (4). In addition,
circulating isoforms are present in human plasma. Due to the
alternative splicing of VEGFR mRNA, and also due to proteolytic
shedding of the extracellular domain, membranous receptors may
exist as soluble truncated forms (sVEGFR1, 2 and 3). These soluble
forms are secreted by endothelial cells or are proteolytically
cleaved (5,6). The role of the splice variant sVEGFR-1
is well established (7), less is
known regarding sVEGFR2 and sVEGFR3. It has been reported that the
membrane-bound and spliced isoforms of VEGFR2 participate in
several important pathophysiological processes, such as the
production of vasoactive mediators involved in hypertension,
thrombosis and inflammation (8-12),
non-alcoholic fatty liver disease (NAFLD) (13,14),
production of nitric oxide (1) and
prostacyclin (2). VEGFR2 is
activated through ligand-stimulated receptor dimerization and
phosphorylation (15). In addition,
the dimerization and phosphorylation of VEGFR2 may be modulated by
modifying the lipid raft of endothelial cell membranes through
high-density and low-density lipoproteins (16-19),
advanced glycation end-products (AGEs) and their receptors
(20,21). Therefore, metabolic abnormalities may
lead to endothelial cell membrane VEGFR2 relocation and expression,
conferring changes to the formation of circulating VEGFR2 isoforms.
No clinical studies have assessed the association between plasma
VEGFR2 concentrations, lipid abnormalities and receptor for AGE
(RAGE) levels. Therefore, in the present pilot study, circulating
(soluble truncated) VEGFR2 concentrations were examined in relation
to lipid composition and plasma RAGE levels in patients on HD, and
biochemical and anthropometric parameters were evaluated.
Materials and methods
Ethics statement
The protocol used in the present study was performed
in accordance with the guidelines described in the Declaration of
Helsinki (22) and was approved by
the Institutional Review Board of Poznań University of Medical
Sciences, Poland. Written informed consent was obtained from all
subjects prior to participation.
Patients
A total of 50 Caucasian patients on HD (27 men and
23 women; median age, 66 years; age range, 28-88 years; HD mean
time, 29.0, 3.9-157.0 months) who had been treated with maintenance
HD for ≥6 months were recruited. All patients underwent HD 3 times
for 4-4.5 h per week on low-flux polysulphone-based membranes with
a surface area of 1.3-2.1 m2, low-molecular-weight
heparin was used as an anticoagulant. The dialysis efficiency was
evaluated based on single-pool Kt/V urea nitrogen, according to the
National Kidney Foundation-Kidney Disease Outcomes Quality
Initiative (K/DOQI) Guidelines (23). Patients on HD who fell into one or
more of the following categories were excluded: i) Suffered from a
hepatic disease, neoplastic disease, active collagen disease, acute
coronary syndrome and/or not well-controlled diabetes mellitus; ii)
cerebral stroke in the 6 months preceding the commencement of the
study; or iii) received statins or fibrates in the 12 weeks prior
to the commencement of the present study. None of the patients were
receiving antibiotics, corticosteroids or immunosuppressant drugs
at the time of the study. According to the abdominal ultrasound
examination, 10 of the patients on HD (20%) also suffered from
NAFLD. The patients were recruited between July and November 2018.
The fasting blood samples were taken on December 3rd and 4th, 2018
(prior to the HD session) from patients at the Dialysis Center,
B.Braun Avitum Poland, Nowy Tomyśl, Poland.
Controls
A total of 26 age-matched self-declared healthy
Caucasian volunteers were included in the control group. No
substantial health deviations were recorded during the medical
interview and physical examinations. The volunteers had not
received lipid-lowering drugs, at least in the 3 months prior to
the commencement of the study. Control individuals were recruited
between June and November 2018, and all controls were students from
the University of the Third Age in Nowy Tomyśl and Wolsztyn,
Poland. The blood samples were taken on December 10th and 11th,
2018 (according to the protocol).
Clinical and laboratory methods
According to Kouw et al (24), dry body weight (DBW) was defined as
the weight at the end of an HD session, when a patient was more
susceptible to developing symptoms of hypotension. DBW was
determined by an experienced nephrologist. Anthropometric
parameters measured included body mass index (BMI), waist
circumference (WC), waist-to-height ratio (WHeR) and waist-to-hip
ratio (WHR). Weight was measured to the nearest 10 g. Height was
measured to the nearest 5 mm, using a wall-mounted stadiometer. BMI
(kg/m2) was calculated as DBW (kg)/height
(m)2. WC was measured midway between the lowest lateral
border of the ribs and the uppermost lateral iliac crest. WHeR was
calculated as WC/height. WHR was measured as WC/hip circumference,
fasting blood samples were collected from each patient at the start
of a midweek HD session from the arterial site of the
arterio-venous fistula, catheter, or antecubital vein of the
participants. NAFLD was diagnosed by abdominal ultrasonography
using a method established by Hamaguchi et al (25), which included hepatorenal echo
contrast, liver brightness, deep attenuation and vascular
blurring.
Dyslipidaemia (D) in the control group was assessed
according to The European Society of Cardiology and the European
Atherosclerosis Society guidelines (26). D in patients on HD was diagnosed
according to the K/DOQI Clinical Practice Guidelines for Managing
Dyslipidemias in Chronic Kidney Disease (2003) (27). Patients diagnosed with D with a serum
low-density cholesterol (LDL-chol) concentration ≥100 mg/dl were
considered hyper-LDL cholesterolemic, whereas those with a
non-high-density cholesterol (non-HDL-chol) levels of ≥130 mg/dl
and triglycerides (TGs) levels of ≥200 mg/dl were considered
hyper-TG/hyper-non-HDL cholesterolemic. Patients who met one of
these criteria were included in the dyslipidemic group. The
remaining patients were referred to as non-dyslipidemic, according
to the K/DOQI criteria. To determine the atherogenic pattern of D,
the TG/HDL-chol ratio was used as the atherogenic index (AI). A
ratio value ≥3.8 was considered to indicate atherogenic D (27). HD subjects with a TG/HDL chol ratio
value <3.8 were described as patients without atherogenic D
(28). Total chol (Tchol; cat. no.
03039773190), HDL-chol (cat. no. 04399803190) and TG (cat. no.
20767107322) were assessed using enzymatic and colorimetric
methods, according to the manufacturer's protocol (Cobas Integra,
Roche Diagnostics GmbH). The LDL-chol concentration was calculated
using the Friedewald formula (29).
In patients with serum TG concentrations of ≥400 mg/dl, LDL-chol
was measured directly (BioSystems S.A.). Non-HDL-chol was estimated
as the Tchol minus HDL-chol. The LDL-chol was calculated using the
Friedewald formula.
Plasma VEGFR2, RAGE, insulin, glycated hemoglobin
(HbA1c), glucose levels, lipid profiles, albumin levels and
high-sensitivity C-reactive protein (hsCRP) concentration were
measured. After a minimum of 8 h of overnight fasting, venous blood
was drawn into an EDTA tube and promptly centrifuged at 2,000 x g
for 10 min at 4˚C. The obtained plasma was frozen at -80˚C in
aliquots until protein analysis was performed. The plasma VEGFR2
levels were measured using the Human VEGFR2 ELISA kit (cat. no.
ab213476; Abcam), according to the manufacturer's protocols. No
significant cross-reactivity or interference was observed. The
limits of VEGFR2 concentration detection were 34.3-25,000 pg/ml.
The sensitivity of the assay was <70 pg/ml. The intra-assay
coefficient of variation (CV) was 2.5%, and the CV for inter-assay
precision was 5.8%. The plasma RAGE levels were measured using the
Human RAGE ELISA kit (cat. no. ab190807; Abcam). All measurements
were performed in duplicate. Plasma insulin concentrations were
determined using the electrochemiluminescence immunoassay method,
according to the manufacturer's protocol (Cobas E411; cat. no.
12017547122; Roche Diagnostics GmbH). Homeostasis model assessment
of insulin resistance (HOMA-IR) was determined as fasting plasma
insulin (µU/ml) x fasting plasma glucose (mmol/l)/22.5(30). HbA1c was determined using the
turbidimetric inhibition immunoassay method (Cobas Integra; cat.
no. 04528123 190; Roche Diagnostics GmbH). The concentration of
hsCRP was determined using a high-sensitivity latex enhanced
immunoturbidimetry method, according to the manufacturer's protocol
(Cobas Integra; cat. no. 04628918190; Roche Diagnostics GmbH).
Other biochemical parameters were measured using standard
laboratory techniques with a certified automatic analyzer (Cobas
Integra 400; Roche Diagnostics Ltd.).
Categorization of patients
Participants were categorized as having D when they
met the criteria described in the K/DOQI for D (29). Metabolic syndrome (MeS) was diagnosed
according to the International Diabetes Federation Worldwide
Definition (31). Selected groups
were compared to each other and analysed separately. In order to
identify potential predictors of plasma VEGFR2 levels, the
statistical analysis was performed on the entire HD group.
Statistical analysis
The normality of distribution of variables was
assessed using the Shapiro-Wilk test for each group separately.
Numeric variables are expressed as the mean ± standard deviation,
or as a median and range, as appropriate; categorical variables are
presented as percentages. A Student's t-test was used to compare
normally distributed data, or otherwise a Mann-Whitney U test was
used. As plasma VEGFR2 levels were not normally distributed, a
Spearman's rank correlation was performed to determine the
correlation between this variable and the other parameters.
Univariate receiver operating characteristic (ROC) curves were
evaluated using Medical kit version 4.0.67 (statsoft.pl).
Statistical analysis was performed using STATISTICA version 13
(TIBCO Software Inc.). P<0.05 was considered to indicate a
statistically significant difference.
Results
Comparison between the entire HD group
and control subjects
The clinical and demographic characteristics of
patients in the HD and control groups, with and without D, are
summarized in Table I. Despite the
prior declaration of good health, 57% of the subjects in the
control group had D, with a similar percentage observed in the HD
group (54%). The HD subjects had a higher TG/HDL-chol ratio, as
compared with age-matched controls (4.7 vs. 1.28; P<0.0005;
Table II). The AI in the HD group
was 56%, whereas there were no subjects with atherogenic D in the
control group. A higher prevalence of MeS was recorded in patients
on HD compared with the control subjects (60 vs. 15%, respectively;
P=0.001). The HD group had a similar percentage of cigarette
smokers, BMI and WHeR to that of controls, but a higher WHR ratio
(P=0.006). Compared with the control, the entire HD group exhibited
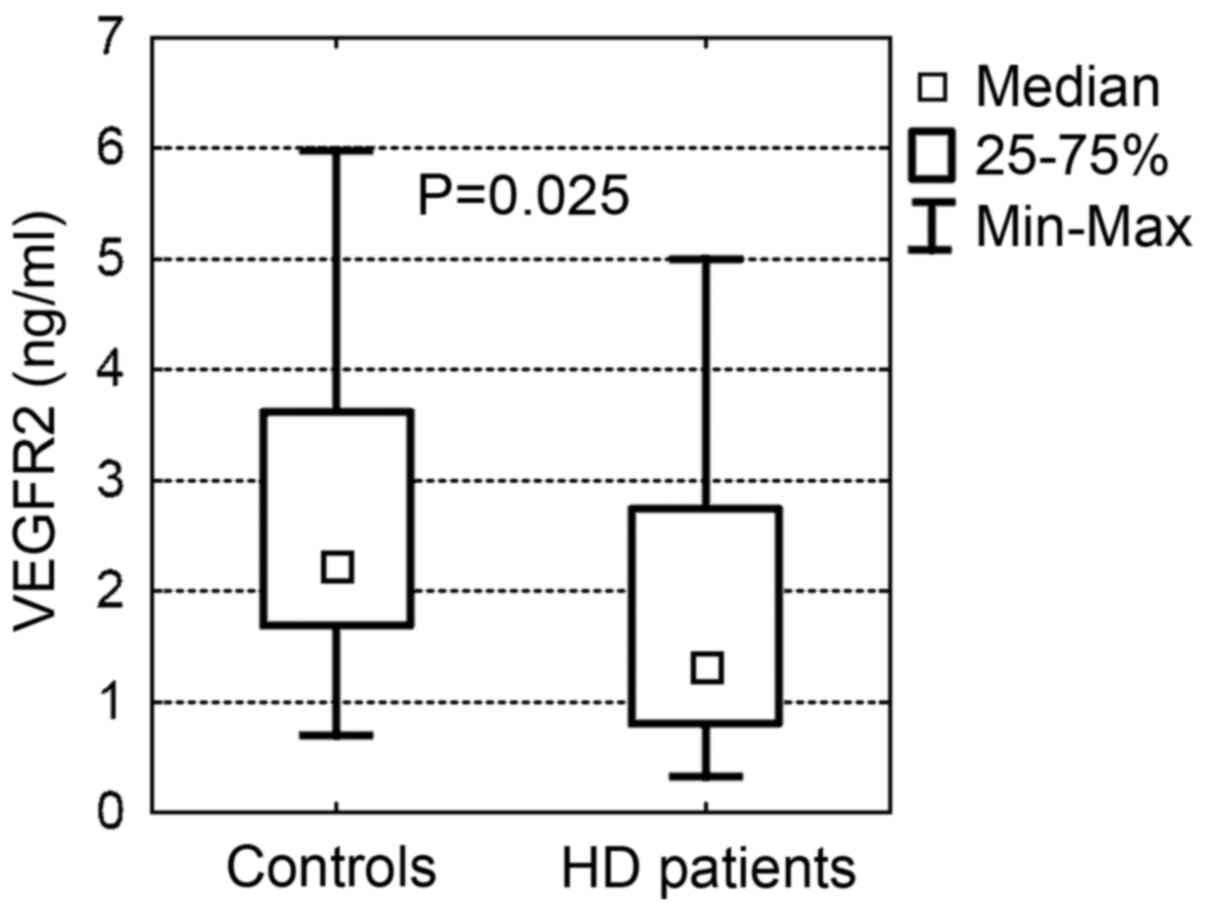
a lower plasma VEGFR2 concentration (P=0.025; Fig. 1), Tchol, LDL-chol, HDL-chol and
HDL/Tchol ratio. Additionally, patients on HD exhibited a
significantly elevated serum TG, LDL/HDL-chol ratio, TG/HDL-chol
ratio and plasma RAGE levels.
 | Table IClinicopathological characteristics
of the hemodialysis patients and controls with and without D. |
Table I
Clinicopathological characteristics
of the hemodialysis patients and controls with and without D.
| | HD patients,
n=50 | Controls, n=26 |
|---|
| Parameter | With D | Without D | P-value | With D | Without D | P-value |
|---|
| N | 26 | 24 | - | 15 | 11 | - |
| Age,
yearsb | 65, 47-89 | 66, 28-81 | 0.938 | 72, 60-90 | 68, 61-77 | 0.338 |
| Sex | | | | | | - |
|
Male | 14 | 13 | | 6 | 5 | |
|
Female | 11 | 12 | | 9 | 6 | |
| DM, n (%) | 11(42) | 15(62) | - | 0 | 0 | - |
| Waist to hip
ratioa | 0.965±0.095 | 0.968±0.096 | 0.933 | 0.918±0.042 | 0.894±0.098 | 0.067 |
| Waist to height
ratioa | 0.615±0.084 | 0.613±0.102 | 0.931 | 0.596±0.076 | 0.531±0.063 | 0.642 |
| SBP,
mmHga | 123±15 | 125±15 | 0.598 | 130±10 | 128±10 | 0.743 |
| DBP,
mmHgb | 70, 60-90 | 70, 60-80 | 0.825 | 80, 60-90 | 70, 60-100 | 0.442 |
| BMI,
kg/m2a | 26.6±4.8 | 27.1±5.9 | 0.742 | 27.7±5.42 | 27.3±3.44 | 0.723 |
| Period of HD,
monthsa | 32.2±20.8 | 41±36.1 | 0.641 | - | - | - |
| eKT/Va | 1.34±0.23 | 1.36±0.18 | 0.675 | - | - | - |
| Residual diuresis,
l/24 h, range | 0.5, 0-2.5 | 0.6, 0-2.1 | 0.754 | - | - | - |
| Table IIValues of laboratory parameters in HD
patients and controls. |
Table II
Values of laboratory parameters in HD
patients and controls.
| Parameter | HD patients,
n=50 | Controls, n=26 | P-value |
|---|
| VEGFR2,
ng/mle | 1.32,
0.330-5.0 | 2.24,
0.700-5.9 | 0.025a |
| Albumin,
g/dld | 3.65±0.33 | 4.32± 0.21.0 | 0.054 |
| Total cholesterol,
mg/dld | 175.0±49.0 | 203.0±43.0 | 0.001b |
| LDL-cholesterol,
mg/dld | 93.3±33.2 | 115.0±36.6 | 0.005b |
| HDL-cholesterol,
mg/dld | 41.8±12.0 | 68.3±19.2 | 0.005b |
| TG,
mg/dld | 173.0±83.0 | 94.0±33.0 |
<0.0001c |
| Non-HDL,
mg/dld | 133.0±47.0 | 137.0±38 | 0.676 |
| LDL/HDL-cholesterol
ratiod | 2.35±0.87 | 1.70±0.64 | 0.004b |
| HDL/total
cholesterol, %e | 22.2, 14-50 | 32.9, 55-21 | 0.0005c |
| TG/HDL-cholesterol
ratioe | 4.17, 0.8-8.2 | 1.28, 0.5-3.5 |
<0.0005c |
| hsCRP,
mg/ld | 14.1±2.6 | 5.0±1.68 | 0.05 |
| RAGE
ng/mld | 1.23±1.06 | 0.680±0.048 | 0.035a |
| HB,
g/dld | 11.4±1.4 | 13.5±0.9 | 0.07 |
Comparison of VEGFR2 levels between
patients on HD with and without D
The laboratory parameters of patients on HD with and
without D are presented in Table
III. In patients on HD with D, the plasma VEGFR2 and serum
Tchol, TG, HDL-chol, LDL-chol, non-HDL-chol levels, as well as the
LDL-/HDL-chol and TG/HDL-chol ratios, were higher compared with
those in patients on HD without D. The patients on HD with D had a
significantly higher AI, compared with patients on HD without D (73
vs. 47%, respectively). In addition, the receiver operating
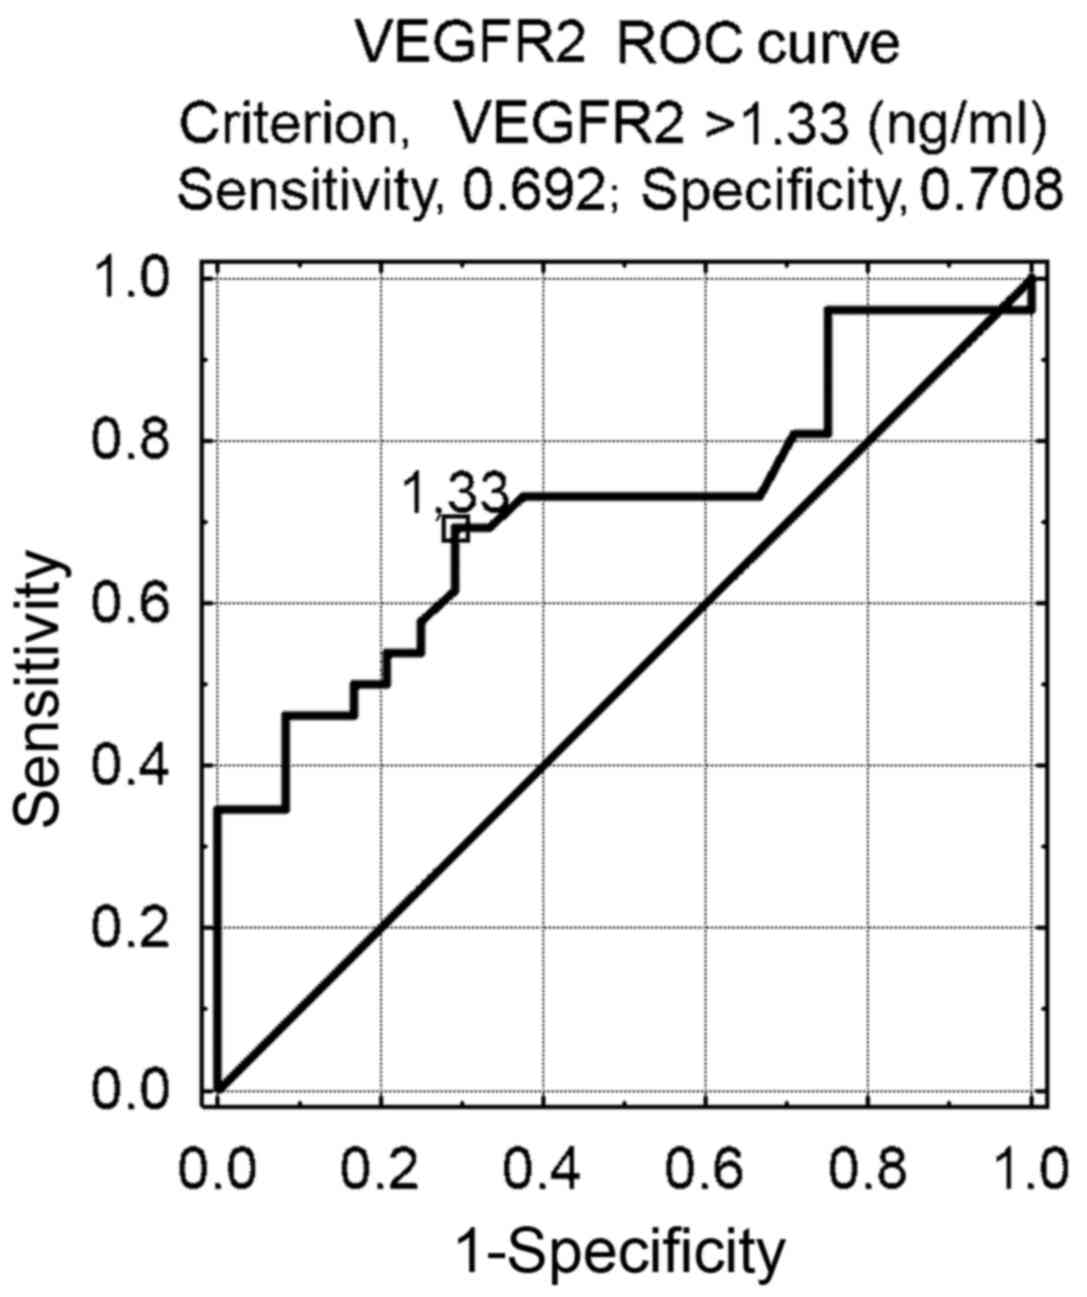
characteristic (ROC) curve analysis revealed that a plasma VEGFR2
level of 1.33 was the ideal cut-off value for the prognosis of
patients on HD with and without D [area under the ROC curve, 0.713;
95% confidence interval (CI): 0.569-0.858; Fig. 2].
| Table IIILaboratory parameters in HD patients
with and without dyslipidemia. |
Table III
Laboratory parameters in HD patients
with and without dyslipidemia.
| Parameter | HD with D | HD without D | P-value |
|---|
| VEGFR2,
ng/mld | 1.96,
0.330-5.0 | 0.930,
0.390-3.31 | 0.01a |
| Albumin,
g/dlc | 3.74±0.32 | 3.56±0.32 | 0.058 |
| Total cholesterol,
mg/dld | 194.0,
159.0-349.0 | 136.0,
98.0-178.0 |
<0.0001b |
| LDL-cholesterol,
mg/dlc | 118.0±22.3 | 66.3±18.3 |
<0.0001b |
| HDL-cholesterol,
mg/dld | 38.0,
27.0-67.0 | 38.5,
26.0-82.0 | 0.953 |
| TG,
mg/dlc | 220.0±82.9 | 122.0±44.5 |
<0.0001b |
| Non-HDL,
mg/dld | 156.0,
127.0-300.0 | 94.5, 58.0-139 |
<0.0001b |
| LDL/HDL-cholesterol
ratioc | 2.95±0.62 | 1.69±0.62 |
<0.0001b |
| HDL/Total
cholesterol, %d | 19.0,
14.0-33.5 | 30.2,
17.3-50.0 |
<0.0001b |
| TG/HDL-cholesterol
ratiod | 5.2, 1.82-10.1 | 2.76,
0.810-7.08 | 0.0005b |
| hsCRP,
mg/ld | 4.7, 4.0-126.0 | 9.45, 4.0-65.1 | 0.41 |
| HB,
g/dlc | 11.3±1.4 | 11.4±1.4 | 0.772 |
Comparison of VEGFR2 levels in the
control group with and without D
The laboratory parameters of controls with and
without D are presented in Table
IV. Control subjects with D did not differ significantly from
those without D with respect to plasma VEGFR2, serum HDL-chol and
TG concentrations. In the control subjects with D, the serum Tchol,
LDL-chol and non-HDL-chol levels, as well as LDL-/HDL-chol ratio,
were higher compared with those in control subjects without D.
| Table IVLaboratory parameters in the control
cohort with and without D. |
Table IV
Laboratory parameters in the control
cohort with and without D.
|
Parameterb | Controls with
D | Controls without
D | P-value |
|---|
| VEGFR2, ng/ml | 2.75±1.63 | 2.39±1.14 | 0.535 |
| Albumin, g/dl | 4.31±0.18 | 4.34±0.24 | 0.724 |
| Total cholesterol,
mg/dl | 225.0±38.0 | 174.0±30.0 |
<0.001a |
| LDL-cholesterol,
mg/dl | 138.0±31.0 | 72.0±15.0 |
<0.00001a |
| HDL-cholesterol,
mg/dl | 66.0±16.0 | 71.0±23.0 | 0.557 |
| TG, mg/dl | 121.0±41.0 | 89.0±22.0 | 0.237 |
| Non-HDL, mg/dl | 159.0±31.0 | 103.0±14.0 |
<0.0001a |
| LDL/HDL-cholesterol
ratio | 2.13±0.55 | 1.30±0.39 | 0.0002a |
| HDL/Total
cholesterol, % | 29.5±5.6 | 40.0±7.9 | 0.0005a |
| TG/HDL-cholesterol
ratio | 1.61±0.81 | 1.42±0.70 | 0.537 |
| hsCRP, mg/l | 4.21±1.68 | 3.66±1.22 | 0.432 |
| HB, g/dl | 12.6±1.3 | 12.3±1.30 | 0.621 |
Comparison of VEGFR2 levels between
patients on HD with and without MeS
There was no difference in plasma VEGFR2 levels
between patients with and those without MeS (1.38±0.915 vs.
1.10±0.785 ng/ml, respectively; P=0.338).
Correlation analysis of VEGFR2 levels
and other parameters in patients on HD and controls
In the control group, plasma VEGFR2 levels were
significantly positively correlated with TG/HDL-chol ratio and TG
levels (Table V). In the entire HD
group, there were positive correlations between plasma VEGFR2
levels and age, RAGE (Fig. 3),
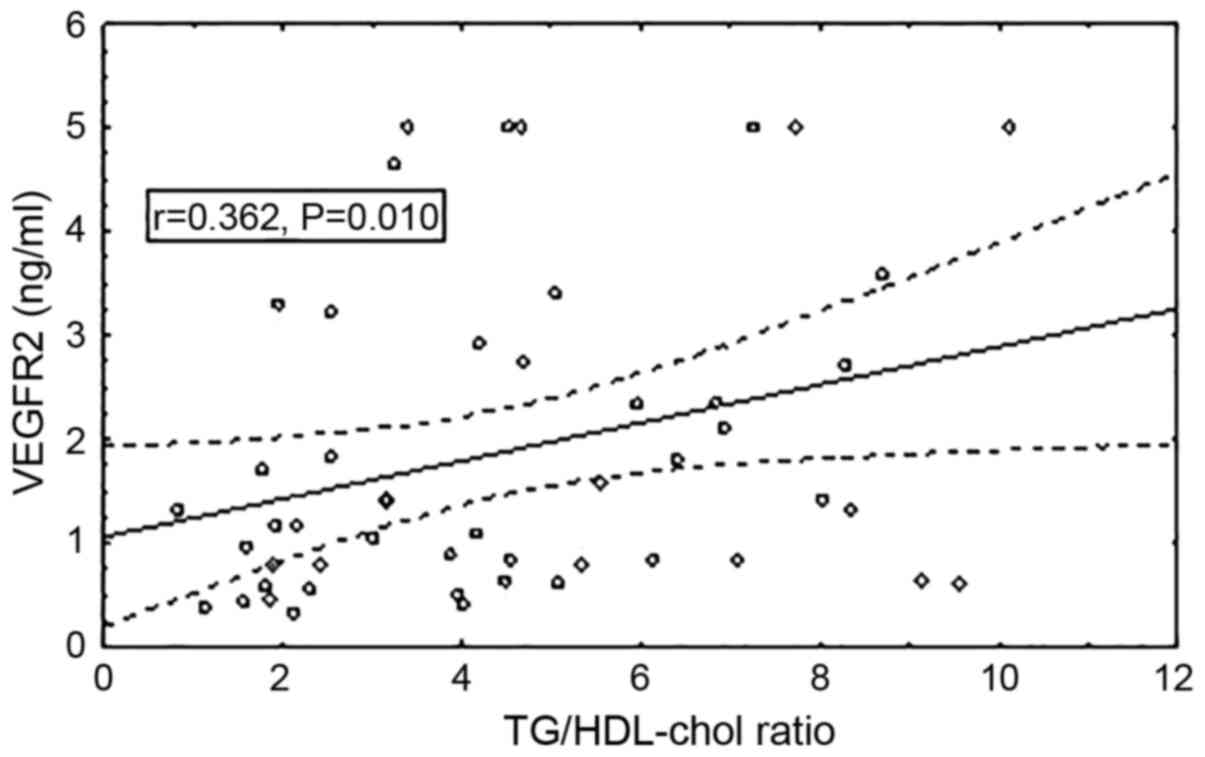
Tchol, LDL, TG, non-HDL, LDL/HDL-chol ratio and TG/HDL-chol ratio
(Fig. 4), and a negative correlation
between plasma VEGFR2 levels and HDL/Tchol ratio. Of note, there
was no correlation between plasma VEGFR2 levels and residual
diuresis, HOMA-IR, hsCRP or anthropometric parameters in any of the
examined groups. In the HD group with D, there were positive
correlations between the plasma levels of VEGFR2 with age and RAGE.
Similarly, in the group without D, significant positive
correlations were observed between plasma VEGFR2 and RAGE levels,
whereas a significant negative correlation was observed between
plasma VEGFR2 levels and platelet counts. There was no correlation
between plasma VEGFR2 levels and the presence of NAFLD (P=0.818)
based on the abdominal ultrasound examination of patients on HD.
The significant correlations of plasma VEGFR2 levels in the
examined groups are presented in Table
V.
| Table VSignificant correlations between
VEGFR2 and other clinicopathological characteristics in the
examined groups treated with HD, with and without dyslipidemia. |
Table V
Significant correlations between
VEGFR2 and other clinicopathological characteristics in the
examined groups treated with HD, with and without dyslipidemia.
| A, Whole HD group,
n=50 |
|---|
| Correlated
parameter | R | P-value |
|---|
| VEGFR2 and age | 0.334 | 0.017a |
| VEGFR2 and
RAGE | 0.686 |
<0.00001c |
| VEGFR2 and
Tchol | 0.297 | 0.036a |
| VEGFR2 and
LDL-chol | 0.291 | 0.039a |
| VEGFR2 and TG | 0.362 | 0.009b |
| VEGFR2 and
non-HDL | 0.361 | 0.009b |
| VEGFR2 and
LDL/HDL-chol ratio | 0.402 | 0.004b |
| VEGFR2 and
HDL/Tchol ratio | -0.403 | 0.004b |
| VEGFR2 and
TG/HDL-chol ratio | 0.362 | 0.009b |
| B, Dyslipidemic HD
group, n=26 |
| Correlated
parameter | R | P-value |
| VEGFR2 and age | 0.397 | 0.04a |
| VEGFR2 and
RAGE | 0.737 | 0.0002c |
| C, Non-dyslipidemic
HD group, n=24 |
| Correlated
parameter | R | P-value |
| VEGFR2 and
RAGE | 0.677 |
0.00027c |
| VEGFR2 and PLT | -0.457 | 0.024a |
Discussion
To the best of our knowledge, there are no previous
studies showing the association of plasma VEGFR2 levels with lipid
abnormalities, MeS, plasma RAGE levels and other biochemical
parameters in patients on HD. The following were the major findings
of the present study in patients on HD: i) The plasma VEGFR2 levels
were lower compared with those in the control subjects; ii) in
patients on HD with D, the plasma VEGFR2 levels were higher
compared with those in patients on HD without D; iii) there were
positive correlations between plasma VEGFR2 levels and lipid
abnormalities (Tchol, LDL, TG, Non-HDL, LDL/HDL-chol ratio,
TG/HDL-chol ratio and plasma RAGE levels); iv) there was no
difference in plasma VEGFR2 levels between patients with and
without MeS.
In the present study, lower levels of VEGFR2 were
observed in patients on HD compared with the control subjects,
which was in line with the results reported by Sepe et al
(32). In their study on 26 patients
receiving regular HD, the plasma VEGFR2 levels were also
significantly lower compared with those in the 9 age-matched
healthy volunteers, and were inversely correlated with serum
homocysteine levels. The results of the present study suggested
that the atherogenic components of blood lipids may be partly
involved in the regulation of VEGFR2 expression. A significant
correlation was identified between atherogenic components of the
lipid profile and plasma VEGFR2 levels in patients on HD and
controls. In the examined groups, no marked difference was
identified between HD and controls regarding the percentage of
subjects with D (52 vs. 57%). Therefore, AI was assessed in these
groups. Of note, ≤56% of patients on HD had atherogenic D, as
calculated by AI. Conversely, there were no subjects with
atherogenic D in the control group. In addition, a significant
correlation was observed between the TG/HDL-chol ratio, which is a
determinant of AI and plasma VEGFR2 levels in the HD group. This
fact may suggest that AI may be more likely than D to affect plasma
VEGFR2 levels in patients on HD.
There have been several reports of increased
carbonyl stress (33), AGE
production and RAGE expression (34)
in patients with uraemia. In addition, Liu et al (20) demonstrated that AGEs and RAGE, whose
activity in patients on HD was significantly elevated, may modulate
VEGFR2 levels. It has been shown that the incubation of endothelial
cells with methyloglyoxal, a major source of AGEs and peroxynitrate
(ONOO-) production, modulates VEGFR2 protein levels
through RAGE-mediated, ONOO-dependent and autophagy-induced VEGFR2
degradation on the cell membrane (20,33,35).
Furthermore, it has been shown that the formation of
atherosclerotic lesions is accelerated in parallel with VEGFR2 and
RAGE activity (21). The results of
the present study were in line with those of these previous
studies. In the present study, the plasma levels of VEGFR2 in
patients on HD were positively correlated with plasma RAGE levels.
Therefore, these mechanisms may be at least partly be involved in
the modulation of plasma VEGFR2 levels in patients on HD.
MeS commonly occurs in patients on HD, and is
closely associated with endothelial cell dysfunction and VEGFR2
expression (36-38).
The association between plasma VEGFR2 levels and MeS was evaluated
in patients on HD. No differences were observed in the plasma
VEGFR2 levels between patients on HD with and without MeS. To the
best of our knowledge, the present study is one of few studies to
report an association between plasma VEGFR2 and MeS. The
conflicting data reported to date may be due to differences in the
measurements of sVEGFR2 (37,38). In
previous studies, compared with subjects with normal renal
function, plasma or serum sVEGFR2 levels were significantly
decreased (37) or increased
(38) in subjects with MeS. In the
present study, circulating plasma VEGFR2 (secreted and proteolytic
shedded forms) were both measured, and no correlation was observed
between MeS and circulating plasma VEGFR2 levels. Further studies
are required to evaluate the association between the components of
MeS and plasma VEGFR2 levels.
NAFLD is known to be strongly associated with MeS,
and is considered as a novel risk factor of cardiovascular events
in patients undergoing HD (38-40).
Wu et al (41) reported that
~24% of the examined patients on HD had NAFLD. In the present
study, 20% of patients on HD were found to have NAFLD based on the
ultrasonography examination. The association between NAFLD and
circulating VEGFR2 levels was also examined, but no correlations
were found, consistent with previous studies (13,14).
D is the primary characteristic of MeS and a common
feature amongst patients on HD. In the present study, >50% of
the patients on HD were also diagnosed with D, based on the
diagnostic recommendations of the K/DOQI guidelines (27). Hyper-LDL-cholesterolemia was also
recorded in 91% of the subjects. In addition, in dyslipidemic
patients on HD, serum TG was significantly higher compared with the
non-dyslipidemic HD group. A growing body of evidence supports the
notion that ESRD is associated with hypertriglyceridemia (27,8,39,40).
Recently, Vaziri et al (42)
demonstrated that the novel endothelium-derived molecule
glycosylphosphatidylinositol-anchored binding protein 1 (GPIHBP1)
is involved in the development of hypertriglyceridemia in patients
with chronic kidney disease. Other studies have found that the
VEGF-VEGFR axis modulates GPIHBP1 mRNA and protein expression
levels in endothelial cells (43).
Consistent with these findings, the results of the present study
support the hypothesis that VEGFR2 may be partially involved in the
development of hypertriglyceridemia through the VEGF-VEGFR axis.
Additionally, it was found that circulating VEGFR2 levels were
positively correlated with TG in patients on HD and control
subjects.
The association between LDL-chol and plasma VEGFR2
levels was also examined. Data from previous studies indicated that
LDL-chol affects the structure and activity of VEGFR2, but the
mechanism underlying this phenomenon is not fully understood. Jin
et al (44) demonstrated that
LDL-chol attenuates endothelial VEGFR2 expression. It was revealed
that the loss of VEGFR2 resulted from its internalization and
degradation in endosome-trans-Golgi network trafficking.
Conversely, a study by Rodrígues et al (45) on an animal model revealed that native
LDL-chol significantly upregulated VEGF and VEGFR2 in endothelial
cells, and this upregulation was associated with an oxidative
stress-mediated mechanism. In addition, it has been established
that oxidized phospholipids may stimulate the expression of
VEGFR2(46). Since the oxidized
LDL-chol that accumulates during atherosclerosis (47) contains large amounts of oxidized
phospholipids, a connection between LDL-chol metabolism and VEGFR2
may be considered. In the present study, a positive correlation was
identified between plasma circulating VEGFR2 levels and LDL-chol,
non-HDL and the LDL/HDL-chol ratio, in agreement with previous
studies (45,46).
Recently, the HDL/Tchol ratio was reported to be a
more reliable risk factor for atherosclerotic changes compared with
Tchol or HDL-chol alone (48). Since
a low HDL/Tchol ratio (47) and high
endothelial expression of VEGFR2(46) are considered risk factors for
atherosclerosis, the association between HDL/Tchol ratio and plasma
VEGFR2 levels was evaluated in the present study. A negative
correlation was identified between plasma circulating VEGFR2 levels
and the HDL/Tchol ratio. These findings support the notion that not
only membranous VEGFR2, but also circulating VEGFR2 expression, may
be partially modulated by lipid components.
The present study has several limitations. First,
all patients in this study were Caucasian, and any differences with
other ethnicities were not examined. Second, single-center trials
are associated with a potential bias. Third, the number of patients
and healthy subjects was relatively small.
In conclusion, the findings of the present study
demonstrated that circulating VEGFR2 levels were lower in patients
on HD compared with those in the healthy population, D was
associated with higher plasma VEGFR2 levels, the TG/HDL-chol ratio
(an index of atherogenic D) was strongly associated with plasma
VEGFR2 levels, and plasma VEGFR2 concentration was associated with
circulating RAGE levels. It may be inferred that, in patients on
HD, circulating VEGFR2 levels may be partially associated with
lipid abnormalities and plasma RAGE levels. However, further
studies are required to define the pathophysiological role of
circulating VEGFR2 and its precise association with D.
Acknowledgements
Not applicable.
Funding
Funding: No funding was received.
Availability of data and materials
The datasets used and/or analyzed during the present
study are available from the corresponding author on reasonable
request.
Authors' contributions
LN conceived and designed the study, and was
involved in data collection and analysis. HD performed the analyses
of VEGFR2 and RAGE levels and data analysis. WW was involved in
data analysis and performed the statistical analysis. All the
authors have read and approved the final version of the manuscript.
HD and WW confirm the authenticity of all the raw data.
Ethics approval and consent to
participate
The protocol used in the present study was performed
in accordance with the guidelines described in the Declaration of
Helsinki and was approved by the Institutional Review Board of
Poznań University of Medical Sciences, Poland. Written informed
consent was obtained from all subjects before participation.
Patient consent for publication
Not applicable.
Competing interests
The authors declare that they have no competing
interests.
References
|
1
|
Machnik A, Neuhofer W, Jantsch J, Dahlmann
A, Tammela T, Machura K, Park JK, Beck FX, Müller DN, Derer W, et
al: Macrophages regulate salt-dependent volume and blood pressure
by a vascular endothelial growth factor-C-dependent buffering
mechanism. Nat Med. 15:545–552. 2009.PubMed/NCBI View
Article : Google Scholar
|
|
2
|
Wheeler-Jones C, Abu-Ghazaleh R, Cospedal
R, Houliston RA, Martin J and Zachary I: Vascular endothelial
growth factor stimulates prostacyclin production and activation of
cytosolic phospholipase A2 in endothelial cells via p42/p44
mitogen-activated protein kinase. FEBS Lett. 420:28–32.
1997.PubMed/NCBI View Article : Google Scholar
|
|
3
|
Ferrara N: Vascular endothelial growth
factor. Eur J Cancer. 32A:2413–2422. 1996.PubMed/NCBI View Article : Google Scholar
|
|
4
|
Roskoski R Jr: VEGF receptor
protein-tyrosine kinases: Structure and regulation. Biochem Biophys
Res Commun. 375:287–291. 2008.PubMed/NCBI View Article : Google Scholar
|
|
5
|
Rahimi N, Golde TE and Meyer RD:
Identification of ligand-induced proteolytic cleavage and
ectodomain shedding of VEGFR-1/FLT1 in leukemic cancer cells.
Cancer Res. 69:2607–2614. 2009.PubMed/NCBI View Article : Google Scholar
|
|
6
|
Ebos JM, Bocci G, Man S, Thorpe PE,
Hicklin DJ, Zhou D, Jia X and Kerbel RS: A naturally occurring
soluble form of vascular endothelial growth factor receptor 2
detected in mouse and human plasma. Mol Cancer Res. 2:315–326.
2004.PubMed/NCBI
|
|
7
|
Koga K, Osuga Y, Yoshino O, Hirota Y,
Ruimeng X, Hirata T, Takeda S, Yano T, Tsutsumi O and Taketani Y:
Elevated serum soluble vascular endothelial growth factor receptor
1 (sVEGFR-1) levels in women with preeclampsia. J Clin Endocrinol
Metab. 88:2348–2351. 2003.PubMed/NCBI View Article : Google Scholar
|
|
8
|
Rath G and Tripathi R: VEGF and its
soluble receptor VEGFR-2 in hypertensive disorders during
pregnancy: The Indian scenario. J Hum Hypertens. 26:196–204.
2012.PubMed/NCBI View Article : Google Scholar
|
|
9
|
Zachary I, Mathur A, Yla-Herttuala S and
Martin J: Vascular protection: A novel nonangiogenic cardiovascular
role for vascular endothelial growth factor. Arterioscler Thromb
Vasc Biol. 20:1512–1520. 2000.PubMed/NCBI View Article : Google Scholar
|
|
10
|
Servos S, Zachary I and Martin JF: VEGF
modulates NO production: The basis of a cytoprotective effect?
Cardiovasc Res. 41:509–510. 1999.PubMed/NCBI View Article : Google Scholar
|
|
11
|
Yap RW, Shidoji Y, Hon WM and Masaki M:
Association and interaction between dietary pattern and VEGF
receptor-2 (VEGFR2) gene polymorphisms on blood lipids in Chinese
Malaysian and Japanese adults. Asia Pac J Clin Nutr. 21:302–311.
2012.PubMed/NCBI
|
|
12
|
Kubisz P, Chudý P, Stasko J, Galajda P,
Hollý P, Vysehradský R and Mokán M: Circulating vascular
endothelial growth factor in the normo- and/or microalbuminuric
patients with type 2 diabetes mellitus. Acta Diabetol. 47:119–124.
2010.PubMed/NCBI View Article : Google Scholar
|
|
13
|
Coulon S, Francque S, Colle I, Verrijken
A, Blomme B, Heindryckx F, De Munter S, Prawitt J, Caron S, Staels
B, et al: Evaluation of inflammatory and angiogenic factors in
patients with non-alcoholic fatty liver disease. Cytokine.
59:442–449. 2012.PubMed/NCBI View Article : Google Scholar
|
|
14
|
Jaroszewicz J, Januszkiewicz M, Flisiak R,
Rogalska M, Kalinowska A and Wierzbicka I: Circulating vascular
endothelial growth factor and its soluble receptors in patients
with liver cirrhosis: Possible association with hepatic function
impairment. Cytokine. 44:14–17. 2008.PubMed/NCBI View Article : Google Scholar
|
|
15
|
Kim BM, Lee DH, Choi HJ, Lee KH, Kang SJ,
Joe YA, Hong YK and Hong SH: The recombinant kringle domain of
urokinase plasminogen activator inhibits VEGF165-induced
angiogenesis of HUVECs by suppressing VEGFR2 dimerization and
subsequent signal transduction. IUBMB Life. 64:259–265.
2012.PubMed/NCBI View
Article : Google Scholar
|
|
16
|
Noghero A, Perino A, Seano G, Saglio E, Lo
Sasso G, Veglio F, Primo L, Hirsch E, Bussolino F and Morello F:
Liver X receptor activation reduces angiogenesis by impairing lipid
raft localization and signaling of vascular endothelial growth
factor receptor-2. Arterioscler Thromb Vasc Biol. 32:2280–2288.
2012.PubMed/NCBI View Article : Google Scholar
|
|
17
|
Bodzioch M, Orsó E, Klucken J, Langmann T,
Böttcher A, Diederich W, Drobnik W, Barlage S, Büchler C,
Porsch-Ozcürümez M, et al: The gene encoding ATP-binding cassette
transporter 1 is mutated in Tangier disease. Nat Genet. 22:347–351.
1999.PubMed/NCBI View
Article : Google Scholar
|
|
18
|
Fang L, Choi SH, Baek JS, Liu C, Almazan
F, Ulrich F, Wiesner P, Taleb A, Deer E, Pattison J, et al: Control
of angiogenesis by AIBP-mediated cholesterol efflux. Nature.
498:118–122. 2013.PubMed/NCBI View Article : Google Scholar
|
|
19
|
Zhang M and Jiang L: Oxidized low-density
lipoprotein decreases VEGFR2 expression in HUVECs and impairs
angiogenesis. Exp Ther Med. 12:3742–3748. 2016.PubMed/NCBI View Article : Google Scholar
|
|
20
|
Liu H, Yu S, Zhang H and Xu J:
Angiogenesis impairment in diabetes: Role of methylglyoxal-induced
receptor for advanced glycation endproducts, autophagy and vascular
endothelial growth factor receptor 2. PLoS One.
7(e46720)2012.PubMed/NCBI View Article : Google Scholar
|
|
21
|
Roy H, Bhardwaj S, Babu M, Kokina I,
Uotila S, Ahtialansaari T, Laitinen T, Hakumaki J, Laakso M, Herzig
KH, et al: VEGF-A, VEGF-D, VEGF receptor-1, VEGF receptor-2,
NF-kappaB, and RAGE in atherosclerotic lesions of diabetic Watanabe
heritable hyperlipidemic rabbits. FASEB J. 20:2159–2161.
2006.PubMed/NCBI View Article : Google Scholar
|
|
22
|
World Medical Association Declaration of
Helsinki. Ethical principles for medical research involving human
subjects. JAMA. 310:2191–2194. 2013.PubMed/NCBI View Article : Google Scholar
|
|
23
|
Update of the National Kidney
Foundation-Kidney Disease Outcomes Quality Initiative Clinical
Practice Guideline for Hemodialysis Adequacy. 2015. https://www.ajkd.org/article/S0272-6386(15)01019-7/fulltext.
|
|
24
|
Kouw PM, Olthof CG, ter Wee PM, Oe LP,
Donker AJ, Schneider H and de Vries PM: Assessment of post-dialysis
dry weight: An application of the conductivity measurement method.
Kidney Int. 41:440–444. 1992.PubMed/NCBI View Article : Google Scholar
|
|
25
|
Hamaguchi M, Kojima T, Itoh Y, Harano Y,
Fujii K, Nakajima T, Kato T, Takeda N, Okuda J, Ida K, et al: The
severity of ultrasonographic findings in nonalcoholic fatty liver
disease reflects the metabolic syndrome and visceral fat
accumulation. Am J Gastroenterol. 102:2708–2715. 2007.PubMed/NCBI View Article : Google Scholar
|
|
26
|
Reiner Z, Catapano AL, De Backer G, Graham
I, Taskinen MR, Wiklund O, Agewall S, Alegria E, Chapman MJ,
Durrington P, et al: European Association for Cardiovascular
Prevention and Rehabilitation; ESC Committee for Practice
Guidelines (CPG) 2008-2010 and 2010-2012 Committees. ESC/EAS
Guidelines for the management of dyslipidaemias: The Task Force for
the management of dyslipidaemias of the European Society of
Cardiology (ESC) and the European Atherosclerosis Society (EAS).
Eur Heart J. 32:1769–1818. 2011.PubMed/NCBI View Article : Google Scholar
|
|
27
|
Kidney Disease Outcomes Quality Initiative
(K/DOQI) Group. K/DOQI clinical practice guidelines for management
of dyslipidemias in patients with kidney disease. Am J Kidney Dis.
41 (Suppl 3): I-IV:S1–S91. 2003.PubMed/NCBI
|
|
28
|
Hanak V, Munoz J, Teague J Jr, Stanley A
Jr and Bittner V: Accuracy of the triglyceride to high-density
lipoprotein cholesterol ratio for prediction of the low-density
lipoprotein phenotype B. Am J Cardiol. 94:219–222. 2004.PubMed/NCBI View Article : Google Scholar
|
|
29
|
Friedewald WT, Levy RI and Fredrickson DS:
Estimation of the concentration of low-density lipoprotein
cholesterol in plasma, without use of the preparative
ultracentrifuge. Clin Chem. 18:499–502. 1972.PubMed/NCBI
|
|
30
|
Matthews DR, Hosker JP, Rudenski AS,
Naylor BA, Treacher DF and Turner RC: Homeostasis model assessment:
Insulin resistance and beta-cell function from fasting plasma
glucose and insulin concentrations in man. Diabetologia.
28:412–419. 1985.PubMed/NCBI View Article : Google Scholar
|
|
31
|
Alberti G, Shaw J and Zimmet P: A new IDF
worldwide definition of the metabolic syndrome: The rationale and
the results. Diabetes Voice. 50:31–33. 2005.PubMed/NCBI
|
|
32
|
Sepe V, Libetta C, Rossi N, Guidetti C and
Dal Canton A: Inverse association between homocysteine and vascular
endothelial growth factor receptor 2 serum levels in hemodialyzed
and kidney transplanted patients. Kidney Int.
64(1922)2003.PubMed/NCBI View Article : Google Scholar
|
|
33
|
Karg E, Papp F, Tassi N, Janáky T,
Wittmann G and Túri S: Enhanced methylglyoxal formation in the
erythrocytes of hemodialyzed patients. Metabolism. 58:976–982.
2009.PubMed/NCBI View Article : Google Scholar
|
|
34
|
Stinghen AE, Massy ZA, Vlassara H, Striker
GE and Boullier A: Uremic toxicity of advanced glycation end
products in CKD. J Am Soc Nephrol. 27:354–370. 2016.PubMed/NCBI View Article : Google Scholar
|
|
35
|
Schmidt S, Westhoff TH, Krauser P, Zidek W
and van der Giet M: The uraemic toxin phenylacetic acid increases
the formation of reactive oxygen species in vascular smooth muscle
cells. Nephrol Dial Transplant. 23:65–71. 2008.PubMed/NCBI View Article : Google Scholar
|
|
36
|
Mahdy RA, Nada WM, Hadhoud KM and
El-Tarhony SA: The role of vascular endothelial growth factor in
the progression of diabetic vascular complications. Eye (Lond).
24:1576–1584. 2010.PubMed/NCBI View Article : Google Scholar
|
|
37
|
Jesmin S, Akter S, Rahman MM, Islam MM,
Islam AM, Sultana SN, Mowa CN, Yamaguchi N, Okazaki O, Satoru K, et
al: Disruption of components of vascular endothelial growth factor
angiogenic signalling system in metabolic syndrome. Findings from a
study conducted in rural Bangladeshi women. Thromb Haemost.
109:696–705. 2013.PubMed/NCBI View Article : Google Scholar
|
|
38
|
Wada H, Satoh N, Kitaoka S, Ono K,
Morimoto T, Kawamura T, Nakano T, Fujita M, Kita T, Shimatsu A, et
al: Soluble VEGF receptor-2 is increased in sera of subjects with
metabolic syndrome in association with insulin resistance.
Atherosclerosis. 208:512–517. 2010.PubMed/NCBI View Article : Google Scholar
|
|
39
|
Lai YC, Cheng BC, Hwang JC, Lee YT, Chiu
CH, Kuo LC and Chen JB: Association of fatty liver disease with
nonfatal cardiovascular events in patients undergoing maintenance
hemodialysis. Nephron Clin Pract. 124:218–223. 2013.PubMed/NCBI View Article : Google Scholar
|
|
40
|
Capone D, Vinciguerra M, Ragosta A, Citro
V and Tarantino G: Troponin levels relate to CRP concentrations in
patients with NAFLD on maintenance Haemodialysis: A retrospective
study. Adv Ther. 37:3337–3347. 2020.PubMed/NCBI View Article : Google Scholar
|
|
41
|
Wu PJ, Chen JB, Lee WC, Ng HY, Lien SC,
Tsai PY, Wu CH, Lee CT and Chiou TT: Oxidative stress and
nonalcoholic fatty liver disease in hemodialysis patients. BioMed
Res Int. 2018(3961748)2018.PubMed/NCBI View Article : Google Scholar
|
|
42
|
Vaziri ND, Yuan J, Ni Z, Nicholas SB and
Norris KC: Lipoprotein lipase deficiency in chronic kidney disease
is accompanied by down-regulation of endothelial GPIHBP1
expression. Clin Exp Nephrol. 16:238–243. 2012.PubMed/NCBI View Article : Google Scholar
|
|
43
|
Chiu AP, Wan A, Lal N, Zhang D, Wang F,
Vlodavsky I, Hussein B and Rodrigues B: Cardiomyocyte VEGF
regulates endothelial cell GPIHBP1 to relocate lipoprotein lipase
to the coronary lumen during diabetes mellitus. Arterioscler Thromb
Vasc Biol. 36:145–155. 2016.PubMed/NCBI View Article : Google Scholar
|
|
44
|
Jin F, Hagemann N, Brockmeier U, Schäfer
ST, Zechariah A and Hermann DM: LDL attenuates VEGF-induced
angiogenesis via mechanisms involving VEGFR2 internalization and
degradation following endosome-trans-Golgi network trafficking.
Angiogenesis. 16:625–637. 2013.PubMed/NCBI View Article : Google Scholar
|
|
45
|
Rodríguez JA, Nespereira B, Pérez-Ilzarbe
M, Eguinoa E and Páramo JA: Vitamins C and E prevent endothelial
VEGF and VEGFR-2 overexpression induced by porcine
hypercholesterolemic LDL. Cardiovasc Res. 65:665–673.
2005.PubMed/NCBI View Article : Google Scholar
|
|
46
|
Zimman A, Mouillesseaux KP, Le T, Gharavi
NM, Ryvkin A, Graeber TG, Chen TT, Watson AD and Berliner JA:
Vascular endothelial growth factor receptor 2 plays a role in the
activation of aortic endothelial cells by oxidized phospholipids.
Arterioscler Thromb Vasc Biol. 27:332–338. 2007.PubMed/NCBI View Article : Google Scholar
|
|
47
|
Ylä-Herttuala S, Palinski W, Rosenfeld ME,
Parthasarathy S, Carew TE, Butler S, Witztum JL and Steinberg D:
Evidence for the presence of oxidatively modified low density
lipoprotein in atherosclerotic lesions of rabbit and man. J Clin
Invest. 84:1086–1095. 1989.PubMed/NCBI View Article : Google Scholar
|
|
48
|
van Merode T, Hick P, Hoeks PG and Reneman
RS: Serum HDL/total cholesterol ratio and blood pressure in
asymptomatic atherosclerotic lesions of the cervical carotid
arteries in men. Stroke. 16:34–38. 1985.PubMed/NCBI View Article : Google Scholar
|