Introduction
Cell-free DNA (CFD) can originate from the release
of DNA from a cell undergoing apoptosis or necrosis, or from the
release of intact cells in the bloodstream and their subsequent
lysis (1-4).
Several previous studies have reported elevated CFD levels in
patients with cancer (2-7).
The potential for measuring CFD has been increasingly recognized as
a tool for a variety of activities, including diagnosis, monitoring
of treatment response and prognosis determination for several
different types of cancer (2,4,8-10).
Until recently, quantitative measurement of CFD has
been primarily assessed using PCR. However, there are two main
problems with PCR. First, it is complex and labor-intensive,
particularly with regard to DNA extraction and PCR amplification
with specific primers (11). Thus,
it is not only inconvenient in terms of cost and time, but also can
impede comparison of data between laboratories due to differences
in the specifics of the various protocols and differences in the
reagents used. Second, there is a lack of clear information on the
changes in CFD values according to pre-analytical storage
temperature and duration for whole blood before separating the
plasma (11). There are other
methods for measurement of CFD levels, including droplet digital
PCR and the MassARRAY® system (12-14),
these methods however, require advanced technology, so may be not
easily accessible. CFD values may increase with storage time due to
cell lysis (4); conversely, it may
be decreased by DNA degradation related to nuclease activity in the
blood (15). The stability of CFD
values based on storage temperature and time from whole blood
sampling to processing by centrifugation is an important issue for
application of CFD assays in the hospital. Although there is a
general consensus on the value of CFD measurements in a several
types of cancer (3,16), CFD assays have been confined to
research laboratories.
A fluorescence-based CFD assay was developed that
could directly measure DNA using a simple and inexpensive method
without prior DNA extraction and amplification (17). The results of fluorescence-based CFD
assays are significantly correlated to the CFD level measured using
the PCR method (18), and
significant changes in CFD levels according to the efficacy of
anticancer treatment has been confirmed (4,19). As
standardization of fluorescence-based CFD assays is relatively easy
(18), inter-researcher and
inter-laboratory differences are expected to be small. However,
information on basic performance, including accuracy and
reproducibility of fluorescence-based CFD assays is insufficient.
In addition, pre-analytical storage conditions prior to plasma
processing should be clarified for clinical utility. Finally, even
when conducting studies using fluorescence-based CFD assays in a
research setting, the assays are generally performed using
freeze-thawed plasma specimens. Thus, the effect of freeze-thawing
on CFD levels should be determined, to improve confidence in the
results. The aim of the present study was to examine the basic
performance of fluorescence-based CFD assays as measured by
accuracy and stability, and assess the potential effects of
pre-analytical storage conditions, and the influence of
freezing-thawing.
Materials and methods
Fluorescence-based CFD assay
Fluorescence-based CFD was directly assayed using
Quant-iT PicoGreen™ dsDNA Reagent (cat. no. P7584; Invitrogen;
Thermo Fisher Scientific, Inc.) without DNA extraction or
amplification. The CFD in plasma was measured after being diluted
with TE buffer (cat. no. V6231; Promega Corporation). All standards
and samples were deposited in a 100 µl volume in each well of a
96-well microplate. For staining, 100 µl PicoGreen reagent was
added volume to each sample in black 96-well plates for 3 min at
room temperature (~20˚C; cat. no. SPL30296; SPL Life Sciences Co.,
Ltd.), and the mixture was diluted 400-fold. Fluorescence intensity
was measured with a black 96-well microplate reader (Spark; Tecan
Group, Ltd.) at an emission wavelength of 535 nm and an excitation
wavelength of 485 nm. All assays were performed twice, and the
average value was used.
Verification of fluorescence-based
CFD
To assess linearity and accuracy, DNA standards were
prepared using salmon sperm DNA (10 mg/l; cat. no. 15632-011;
Thermo Fisher Scientific, Inc.) that was diluted to 1,000, 750,
500, 250, 100, 10, 1 and 0.2 ng/l. A total of 16 independent
experiments were performed to analyze the correlation between the
mean of the fluorescence intensity and DNA concentration value, and
the final measurement range was used after a quantitative standard
linearity test to confirm the accuracy at each concentration. To
identify an appropriate dilution ratio without interference
effects, plasma samples were diluted to 1/2, 1/10, 1/20, 1/50 and
1/100 using TE buffer. Salmon sperm DNA was spiked into the diluted
plasma at a concentration of 10 ng/ml to evaluate the recovery rate
for the known amount of DNA.
Stability of CFD according to storage
conditions and influence of freeze-thawing
To assess the impact of various storage conditions,
whole blood of 5 volunteers were collected for use in the present
study. These volunteers did not have acute or chronic disease and
were not taking any medication. The group was composed of 2 women
and 3 men with a median age of 34 (range, 29-45). A volume of 22 ml
peripheral blood drawn from each participant; 2 ml blood was placed
in each of the 11 EDTA tubes using a 20 gauge needle. Whole blood
samples in each tube were stored at 4˚C or room temperature for
various periods of time (0, 1, 2, 3, 4 or 6 h) prior to
centrifugation. Subsequently, plasma samples were obtained by
centrifuging the peripheral blood at 3,000 x g for 10 min at room
temperature, and the plasma samples were collected as the upper
supernatant layer. The CFD value was measured for each condition
(temperature and incubation time). The plasma samples obtained for
each storage condition were stored in frozen aliquots at -80˚C and
thawed after a month to assess the potential impact of
freeze-thawing and to assess reproducibility. The research protocol
was approved by the Institutional Review Board of Pusan National
University Yangsan Hospital (Yangsan, Republic of Korea; approval
no. 04-2019-024), and written informed consent was obtained from
all participants.
Statistics
Standard linearity of fluorescence-based CFD was
evaluated using simple linear regression analysis. Relative
standard deviation (RSD), which is the standard deviation divided
by mean, was used to identify the precision between the averages of
the sequentially analyzed results. With regard to analysis of
storage conditions and the freeze-thawing effect, the differences
in CFD amongst the groups and follow-up periods were compared using
repeated measures ANOVA and Bonferroni post hoc tests. Statistical
analyses were performed using SPSS version 19.0 (IBM Corp.).
Results
Basic performance of the
fluorescence-based CFD assay
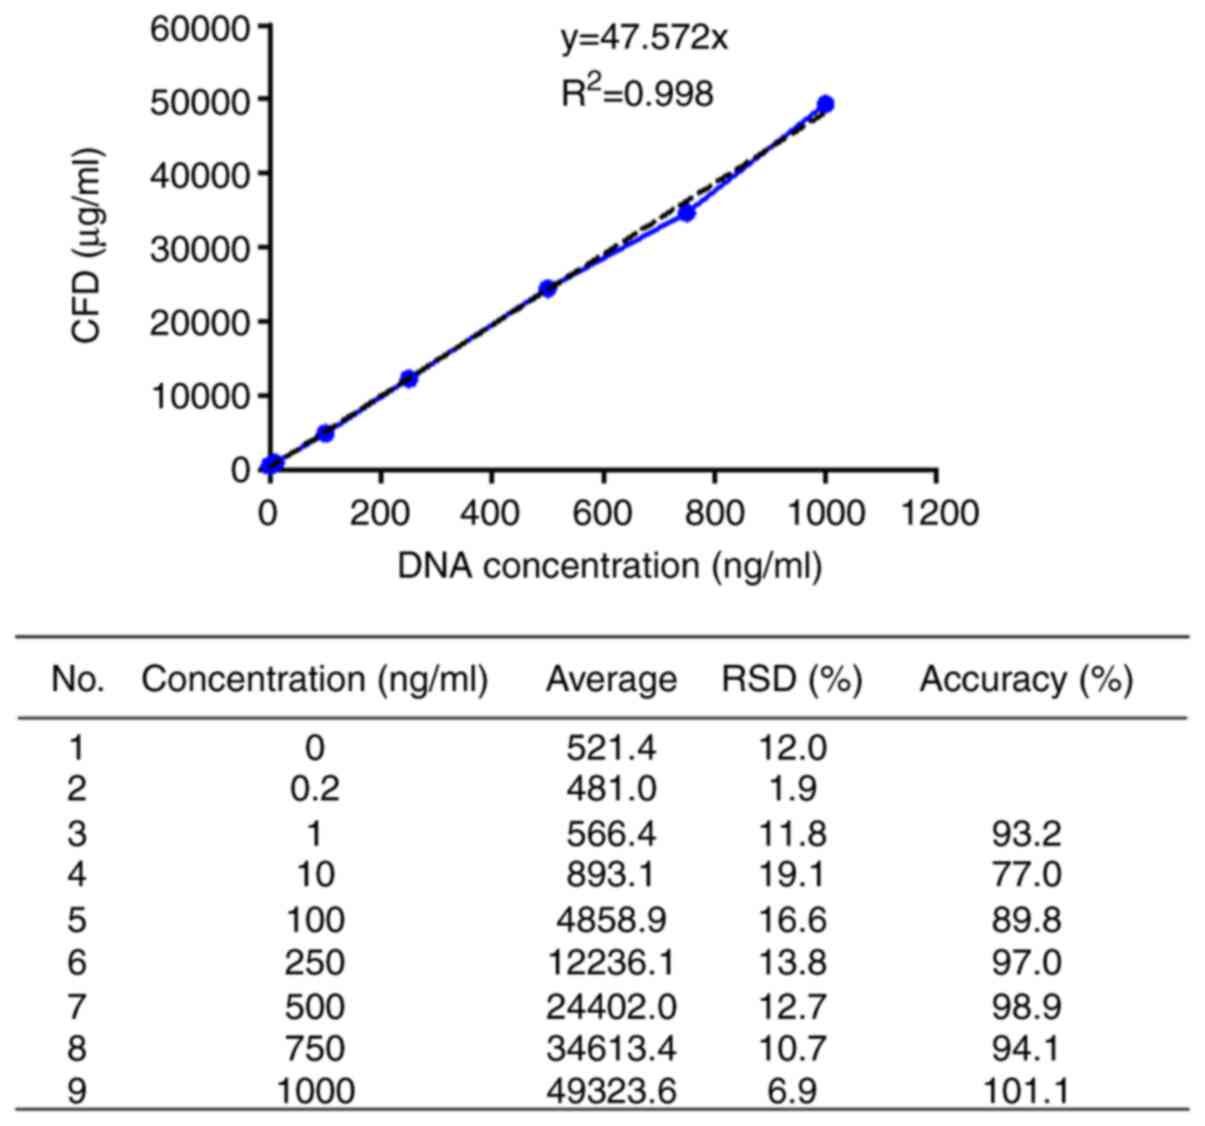
As a result of analyzing the average fluorescence
intensity correlation with the sperm DNA concentration,
quantification of plasma CFD demonstrated linearity over a wide
range of concentrations (1-1,000 ng/ml) with a strongly positively
correlated standard curve (R2=0.998) (Fig. 1). The 1/50 diluted plasma showed a
114% recovery rate at 11.4 ng/ml, whereas the other diluted ratios
showed a recovery rate of ≥200%, and a notable difference between
the spiked DNA concentration. Considering interference effects and
recovery, the appropriate dilution ratio was determined to be 1/50
(Table I).
 | Table IInterference effect and recovery of
fluorescence based cell free-DNA. |
Table I
Interference effect and recovery of
fluorescence based cell free-DNA.
| Sample dilution | Spiking, ng/ml | ng/ml | Internal
controla | Recovery, % |
|---|
| Sample 1/10 | 0 | 282.8 | - | - |
| Sample 1/20 | 0 | 199.8 | - | - |
| Sample 1/50 | 0 | 123.8 | - | - |
| Sample 1/100 | 0 | 87.2 | - | - |
| Internal control
1/10 | 10 | 264.2 | -18.6 | -185.6 |
| Internal control
1/20 | 10 | 226.4 | 26.6 | 265.7 |
| Internal control
1/50 | 10 | 135.2 | 11.4 | 114 |
| Internal control
1/100 | 10 | 108.9 | 21.7 | 216.8 |
Stability of fluorescence-based CFD
according to storage conditions
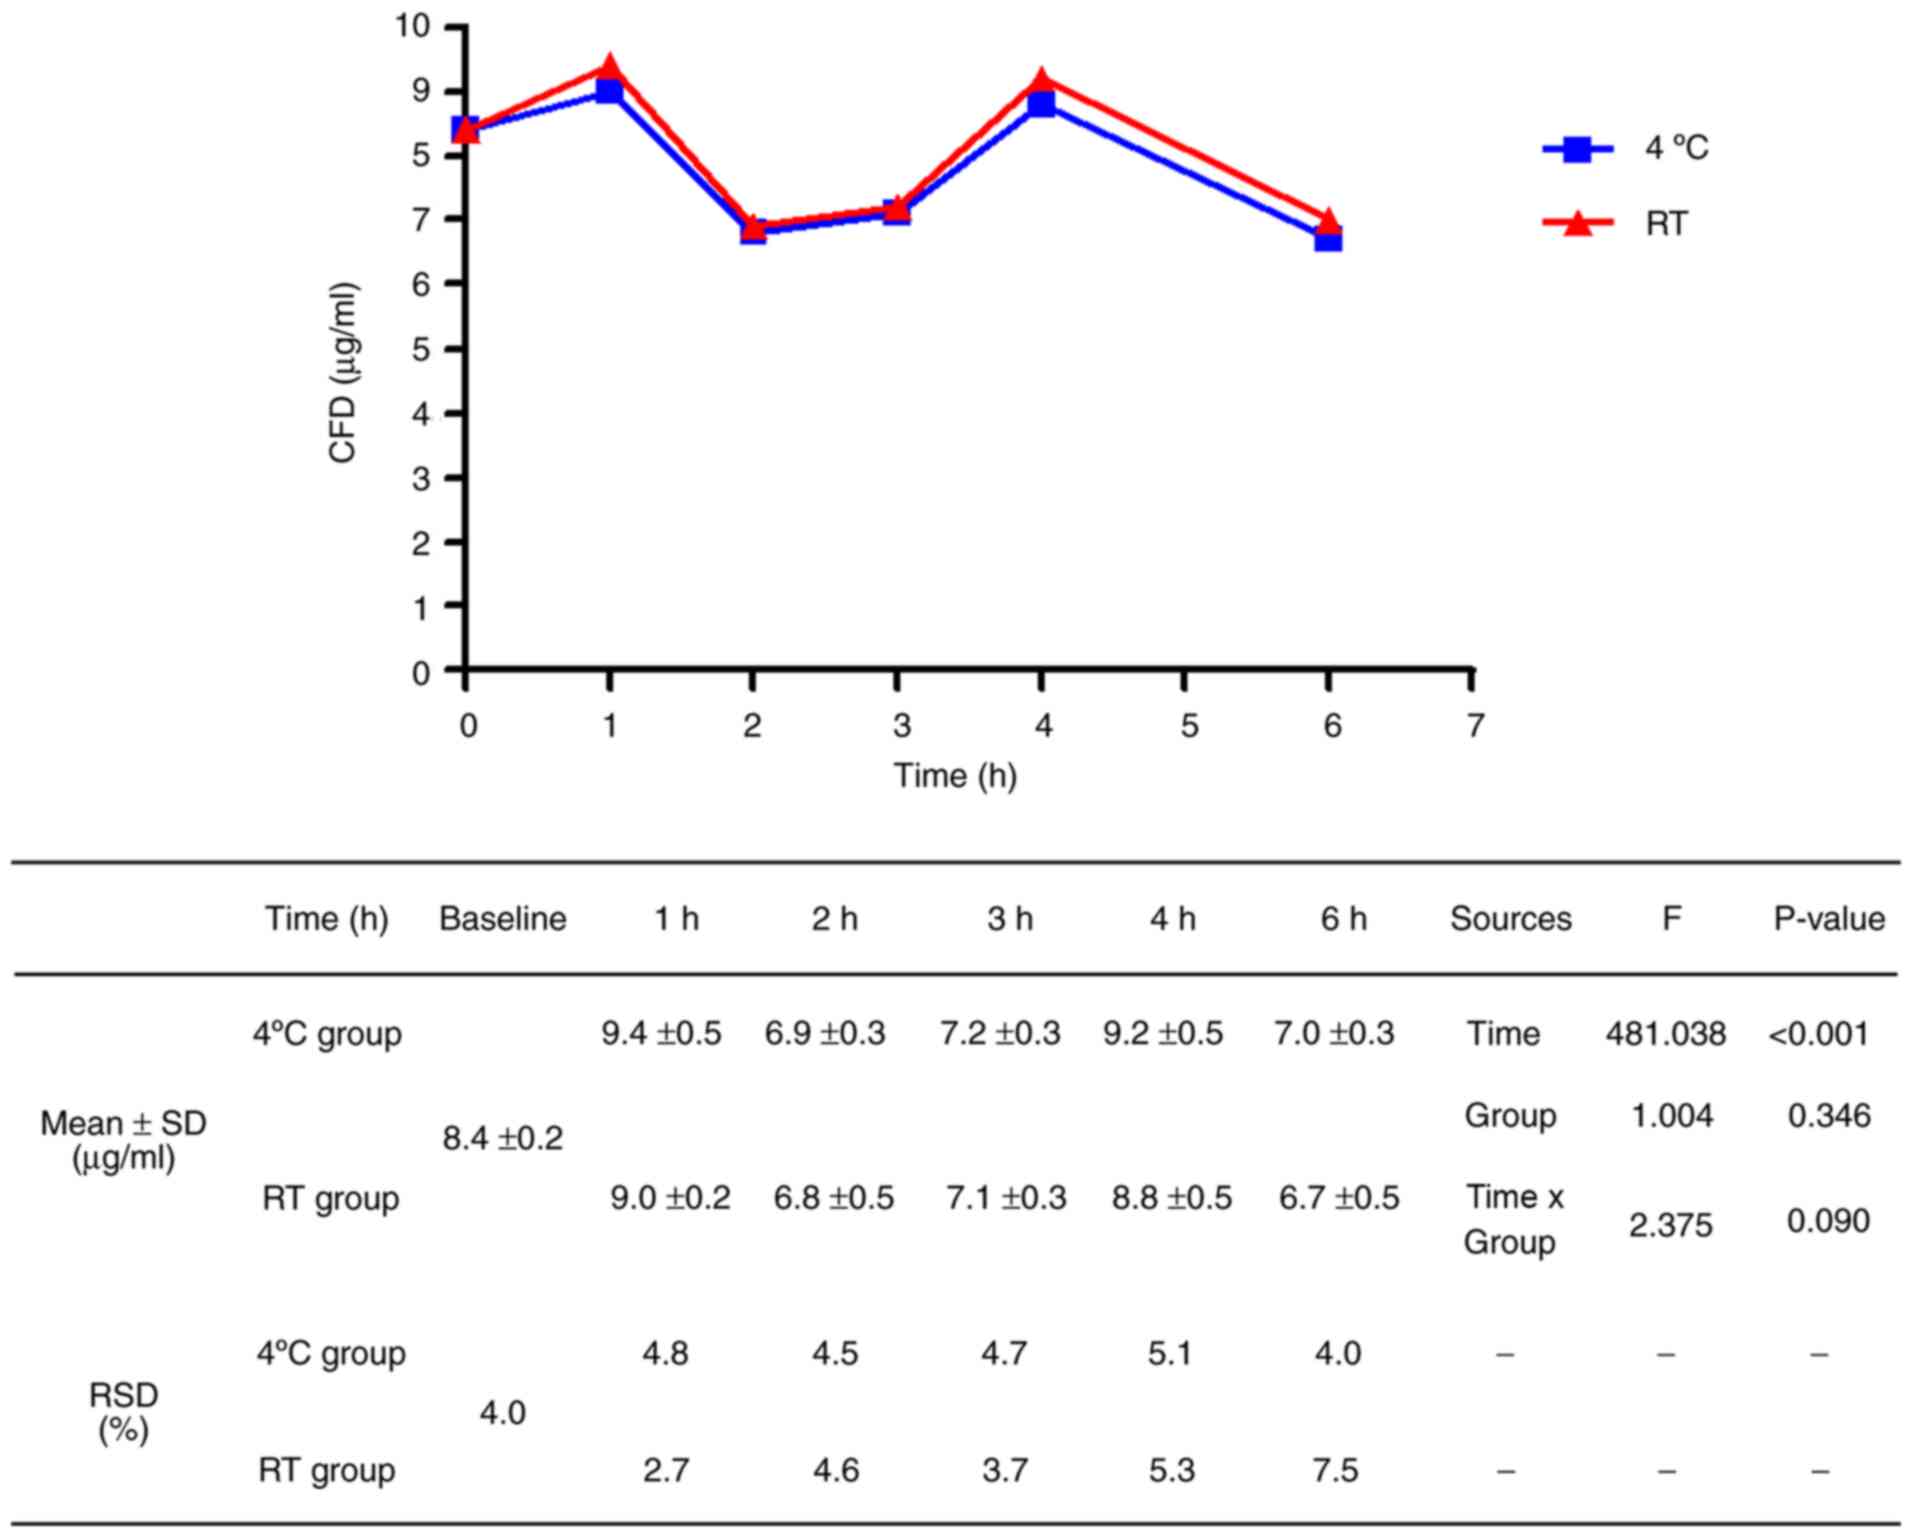
At both RT and 4˚C, the CFD values increased after 1
h, decreased at 2 h, increased after 3 h and then decreased after 6
h (Fig. 2). The changes in CFD
values were significant according to the time course (F=481.038,
P<0.001); however, the changes did not show consistency over
time. Nevertheless, considering that the CFD values at RT for 1 h
were similar to the baseline CFD values and the RSD values at 1 h
were the most stable. These results suggest that plasma processed
from whole blood within 1 h at RT is optimal. CFD values between
4˚C and RT were similar over all time periods (F=1.004, P=0.346),
showing that temperature was not a major factor of storage
conditions within 6 h. The mean baseline CFD level was 8.4 µg/ml
with a standard deviation of 0.2 µg/ml.
Influence of freeze-thawing on the
fluorescence-based CFD assay
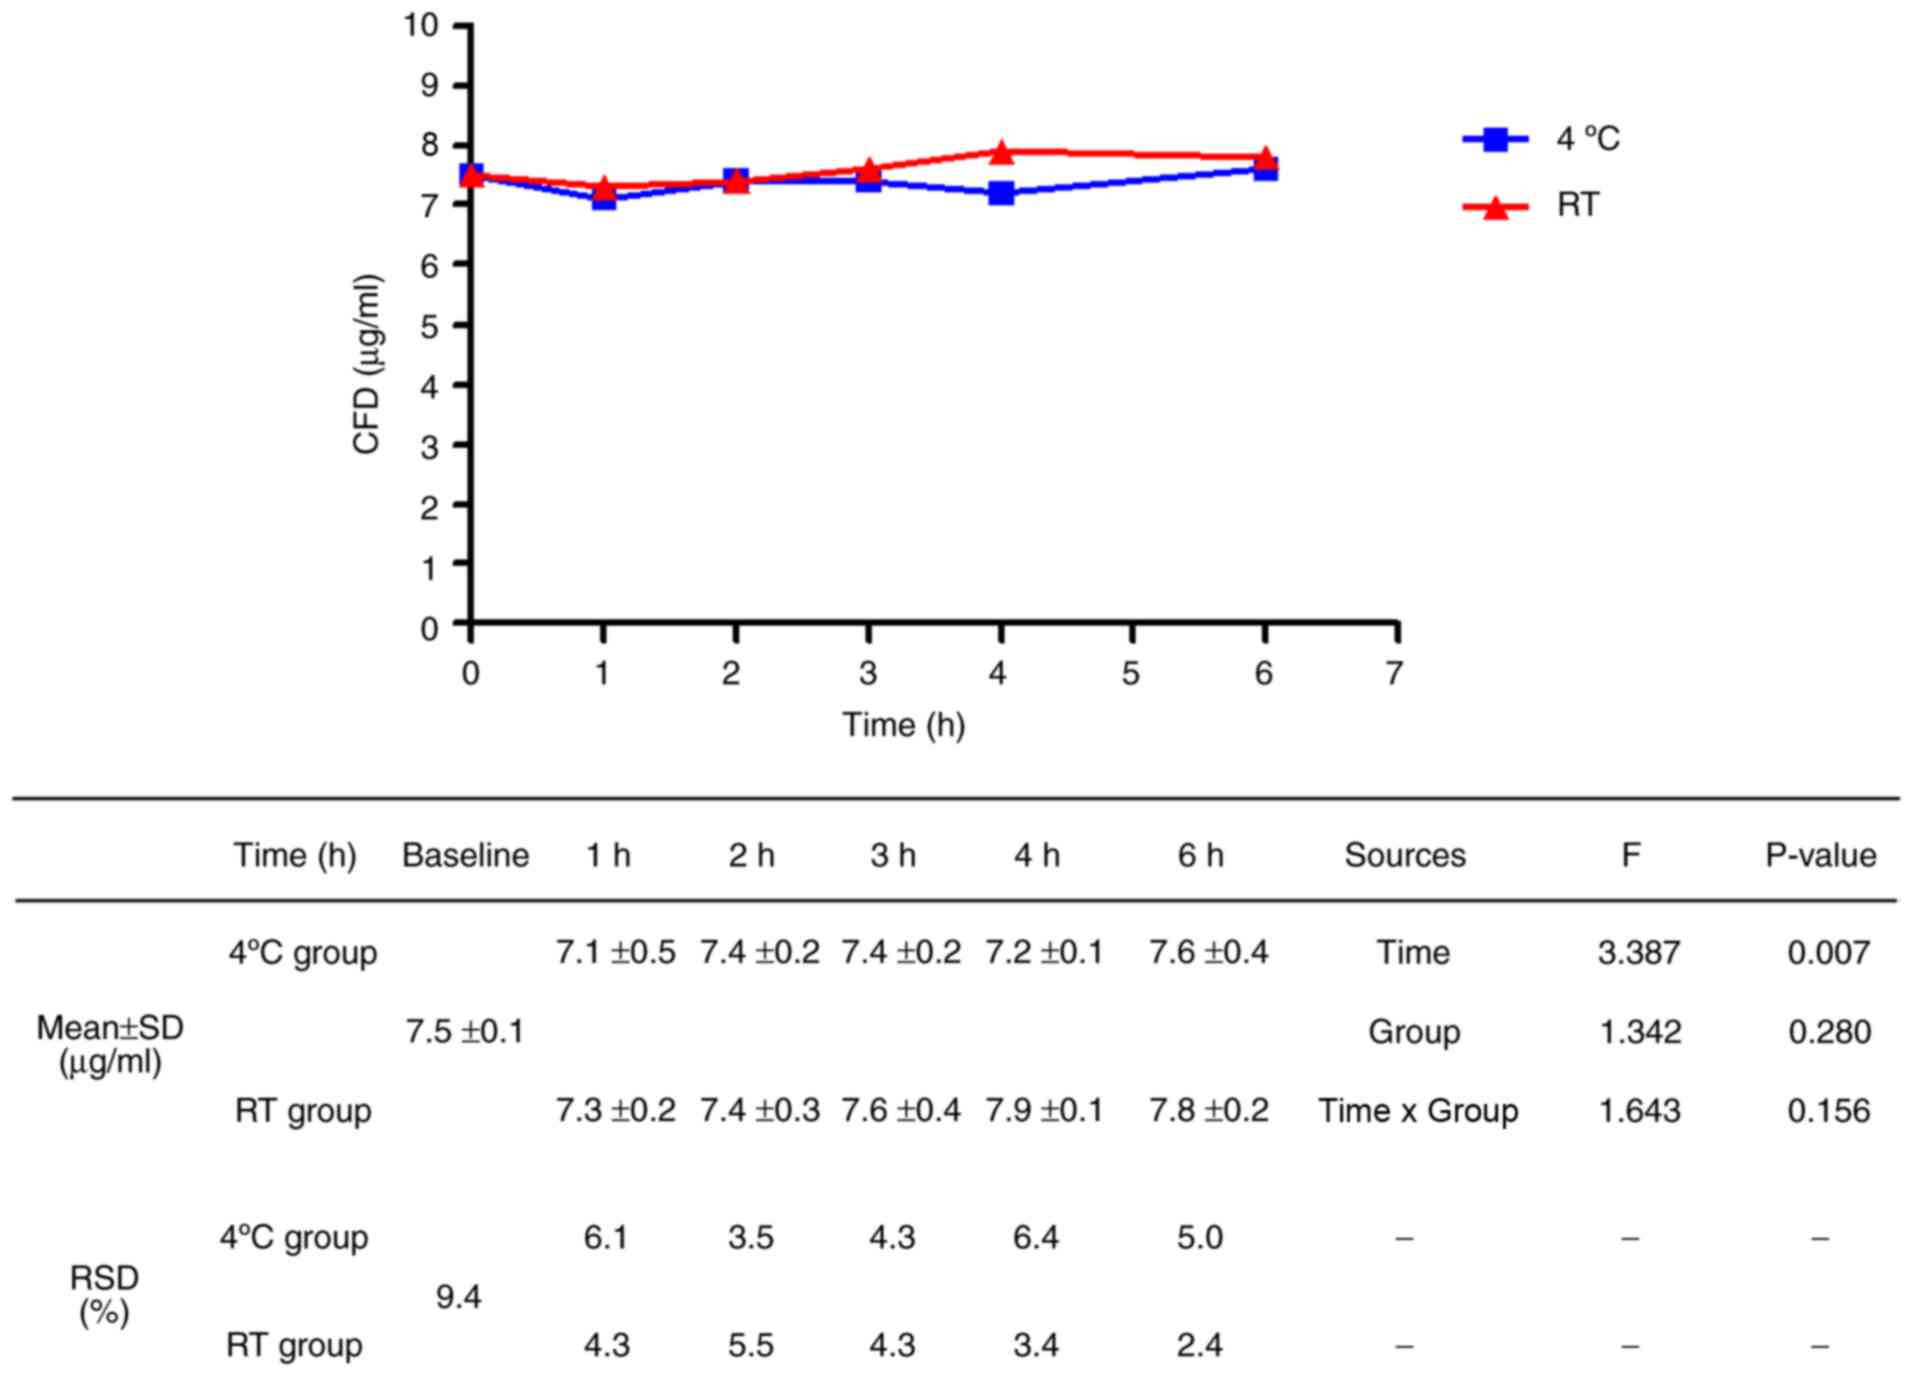
Plasma samples were stored as aliquots at -80˚C and
thawed after 1 month to assess the influence of freeze-thawing and
reproducibility. There was a significant difference in CFD values
after freeze-thawing with regard to storage time (F=3.387, P=0.007;
Fig. 3); however, the changes in CFD
values were reduced compared to those before freezing (fresh
sample, F=481.038; samples after freezing, F=3.387). There was no
significant difference in CFD values after freeze-thawing with
regard to the previously exposed temperature (F=1.342; P
=0.280).
Discussion
The present study showed the basic performance of a
simple fluorescence-based CFD assay as an accurate method for
measuring CFD. Whilst, CFD values exhibited large variability over
all time periods depending on storage time during the
pre-analytical phase. If processing of blood was not consistently
performed at the same time, the CFD values were not reliable. Thus,
strict management of pre-analytical storage conditions based on
predefined guidelines is necessary. The present study showed that
CFD values measured in plasma samples processed within 1 h at RT
were similar to the baseline values, and the RSD was lowest. Hence,
pre-analytical conditions of 1 h at RT were deemed to be optimal
for fluorescence-based CFD assays. On the other hand, CFD values
were consistent regardless of pre-analytical storage conditions
after freeze-thawing, indicating the reliability of results of the
fluorescence-based CFD assay using stored plasma, such as that from
biobanks.
The fluorescence-based CFD assay using PicoGreen™ is
a convenient and cost-effective method for direct assay of CFD.
This method is free from technical issues such as DNA extraction,
so there are fewer issues, such as inter-tester-laboratory
variations due to the test itself. The PCR assay is expensive and
difficult to standardize due to the relative complexity of the
methods, exhibiting low reliability due to large variability
depending on time of testing and tester (11).
Although the fluorescence-based CFD assay can reduce
technical issues, a clear standard for the pre-analytical phase has
to be defined. As mentioned above, the present study showed that it
is necessary to measure CFD with whole blood processing within 1 h.
Prior studies showed that plasma must be separated from whole blood
samples within a certain period of time to prevent factitious CFD
variations (20). In addition, the
present study showed an increase or decrease in CFD levels with an
irregular tendency over a storage period of 6 h. This result was
presumed to be due to the influence of cell lysis or changes in
DNase activity/levels over time. Deregulation of caspases occurs
during cancer development and progression, releasing DNA or
nucleosome into the circulated blood (21), which can increase CFD in patients
with cancer. Conversely, DNA is rapidly degraded and hydrolyzed
from the blood circulation by DNases, and the half-life of CFD in
blood seems to be short (22), which
can cause reductions in the levels of CFD. Stability of CFD derived
from cancer cells is more fragile than that of DNA from healthy
cells, and CFD from cancer cells is more fragile than that of
healthy donors, and is thus easily disrupted (23). Therefore, when fluorescence-based CFD
assays are applied to patients with cancer, the pre-analytical
period identified in the present study must be strictly
controlled.
The fluorescence-based CFD assay is only a
quantitative method for assaying CFD, and cannot be applied for
individual genomic profile analysis. In addition, the quantitative
method does not provide a measure of tumor-specific CFD, but
instead both germline and tumor CFD (17,18). Due
to these limitations, it cannot be applied to precision medicine
using tumor mutation profiling of tumor-specific CFD, such as the
Mass-array® system (14).
However, tumor-specific CFD assays are well known for their
correlation with tumor volume. Abbosh et al (24) reported that a tumor volume of 10
cm3 was required for detection sensitivity of
tumor-specific CFD tests, which is considerably larger than the
volume of an early stage/asymptomatic tumor (24). Whilst, considering that CFD primarily
emerges from tissue in the surrounding environment during cancer
development rather than from cancer cells themselves, simple
quantitative fluorescence-based CFD may be more useful for roles
such as response monitoring, prognostication and early detection.
In particular, considering that the cure rate is increasing in the
minimal disease status before definitive clinical disease in the
era of immunotherapy (25),
fluorescence-based CFD quantitative assays may be used to detect
early disease, such as minimal residual disease in post-operative
settings or for long-term surveillance.
The present study evaluated only the basic
performance of the fluorescence-based CFD assay and did not specify
any usage scenarios (for example, detection of cancer or response
to treatments). Although there are several limitations, the present
study laid the foundation for ongoing research into
fluorescence-based CFD assays. Additional studies are required to
allow the CFD assay to provide a more robust, consistent and
informative method for use in clinical settings. It is necessary to
reconfirm the results of the present study using a larger cohort of
patients with cancer, and conduct future studies to demonstrate
clinical relevance, such as a cohort study for cancer detection,
evaluating cancer treatment response and detecting recurrence for
surveillance.
In conclusion, the fluorescence-based CFD assay
proved to be simple and accurate, but was limited due to variations
in the pre-analytical storage period. The present study showed that
CFD measurements using processed plasma within 1 h is optimal. The
effects of substantial changes according to storage conditions were
reduced after freeze-thawing, thus, studies using stored samples,
such as those from a biobank are viable.
Acknowledgements
Not applicable.
Funding
The present study was supported by the Research Institute for
Convergence of Biomedical Science and Technology from the Pusan
National University Yangsan Hospital (grant no. 30-2019-015).
Availability of data and materials
The datasets used and/or analyzed during the present
study are available from the corresponding author on reasonable
request.
Authors' contributions
JJK analyzed and interpreted the data, and drafted
and revised the manuscript. KP designed the current study,
performed the experiments, analyzed and interpreted the data, and
drafted and revised the manuscript. YRH, and SHK performed the
experiments. SBO, SYO, YJH analyzed and interpreted the data, and
drafted the manuscript. MSY assisted with the statistical analysis.
JJK and KP confirm the authenticity of all the raw data. All
authors have read and approved the final manuscript.
Ethics approval and consent to
participate
The research protocol used in the present study was
approved by the Institutional Review Board of Pusan National
University Yangsan Hospital (Yangsan, Republic of Korea; approval
no. 04-2019-024), and written informed consent was obtained from
all participants.
Patient consent for publication
Not applicable.
Competing interests
The authors declare that they have no competing
interests.
References
|
1
|
Stroun M, Maurice P, Vasioukhin V, Lyautey
J, Lederrey C, Lefort F, Rossier A, Chen XQ and Anker P: The origin
and mechanism of circulating DNA. Ann NY Acad Sci. 906:161–168.
2000.PubMed/NCBI View Article : Google Scholar
|
|
2
|
Schwarzenbach H, Hoon DS and Pantel K:
Cell-free nucleic acids as biomarkers in cancer patients. Nat Rev
Cancer. 11:426–437. 2011.PubMed/NCBI View
Article : Google Scholar
|
|
3
|
Gormally E, Caboux E, Vineis P and Hainaut
P: Circulating free DNA in plasma or serum as biomarker of
carcinogenesis: Practical aspects and biological significance.
Mutat Res. 635:105–117. 2007.PubMed/NCBI View Article : Google Scholar
|
|
4
|
Agassi R, Czeiger D, Shaked G, Avriel A,
Sheynin J, Lavrenkov K, Ariad S and Douvdevani A: Measurement of
circulating cell-free DNA levels by a simple fluorescent test in
patients with breast cancer. Am J Clin Pathol. 143:18–24.
2015.PubMed/NCBI View Article : Google Scholar
|
|
5
|
Boddy JL, Gal S, Malone PR, Harris AL and
Wainscoat JS: Prospective study of quantitation of plasma DNA
levels in the diagnosis of malignant versus benign prostate
disease. Clin Cancer Res. 11:1394–1399. 2005.PubMed/NCBI View Article : Google Scholar
|
|
6
|
Kamat AA, Baldwin M, Urbauer D, Dang D,
Han LY, Godwin A, Karlan BY, Simpson JL, Gershenson DM, Coleman RL,
et al: Plasma cell-free DNA in ovarian cancer: An independent
prognostic biomarker. Cancer. 116:1918–1925. 2010.PubMed/NCBI View Article : Google Scholar
|
|
7
|
Jahr S, Hentze H, Englisch S, Hardt D,
Fackelmayer FO, Hesch RD and Knippers R: DNA fragments in the blood
plasma of cancer patients: Quantitations and evidence for their
origin from apoptotic and necrotic cells. Cancer Res. 61:1659–1665.
2001.PubMed/NCBI
|
|
8
|
Ziegler A, Zangemeister-Wittke U and
Stahel RA: Circulating DNA: A new diagnostic gold mine? Cancer
Treat Rev. 28:255–271. 2002.PubMed/NCBI View Article : Google Scholar
|
|
9
|
Ryan BM, Lefort F, McManus R, Daly J,
Keeling PW, Weir DG and Kelleher D: A prospective study of
circulating mutant KRAS2 in the serum of patients with colorectal
neoplasia: Strong prognostic indicator in postoperative follow up.
Gut. 52:101–108. 2003.PubMed/NCBI View Article : Google Scholar
|
|
10
|
Anker P, Mulcahy H, Chen XQ and Stroun M:
Detection of circulating tumour DNA in the blood (plasma/serum) of
cancer patients. Cancer Metastasis Rev. 18:65–73. 1999.PubMed/NCBI View Article : Google Scholar
|
|
11
|
Devonshire AS, Whale AS, Gutteridge A,
Jones G, Cowen S, Foy CA and Huggett JF: Towards standardisation of
cell-free DNA measurement in plasma: Controls for extraction
efficiency, fragment size bias and quantification. Anal Bioanal
Chem. 406:6499–6512. 2014.PubMed/NCBI View Article : Google Scholar
|
|
12
|
Alcaide M, Cheung M, Hillman J, Rassekh
SR, Deyell RJ, Batist G, Karsan A, Wyatt AW, Johnson N, Scott DW,
et al: Evaluating the quantity, quality and size distribution of
cell-free DNA by multiplex droplet digital PCR. Sci Rep.
10(12564)2020.PubMed/NCBI View Article : Google Scholar
|
|
13
|
Janku F, Huang HJ, Fujii T, Shelton DN,
Madwani K, Fu S, Tsimberidou AM, Piha-Paul SA, Wheler JJ, Zinner
RG, et al: Multiplex KRASG12/G13 mutation testing of unamplified
cell-free DNA from the plasma of patients with advanced cancers
using droplet digital polymerase chain reaction. Ann Oncol.
28:642–650. 2017.PubMed/NCBI View Article : Google Scholar
|
|
14
|
Kulasinghe A, Monkman J, Nalder M, Leary
CO, Ladwa R and Bayre KO: Transformation or progression from
adenocarcinoma to small cell lung cancer detected by serially
tracking mutations in the blood. Reports. 3(33)2020.
|
|
15
|
Roth C, Pantel K, Müller V, Rack B,
Kasimir-Bauer S, Janni W and Schwarzenbach H: Apoptosis-related
deregulation of proteolytic activities and high serum levels of
circulating nucleosomes and DNA in blood correlate with breast
cancer progression. BMC Cancer. 11(4)2011.PubMed/NCBI View Article : Google Scholar
|
|
16
|
Fiala C and Diamandis EP: Utility of
circulating tumor DNA in cancer diagnostics with emphasis on early
detection. BMC Med. 16(166)2018.PubMed/NCBI View Article : Google Scholar
|
|
17
|
Goldshtein H, Hausmann MJ and Douvdevani
A: A rapid direct fluorescent assay for cell-free DNA
quantification in biological fluids. Ann Clin Biochem. 46:488–494.
2009.PubMed/NCBI View Article : Google Scholar
|
|
18
|
Chiminqgi M, Moutereau S, Pernet P, Conti
M, Barbu V, Lemant J, Sacko M, Vaubourdolle M and Loric S: Specific
real-time PCR vs. fluorescent dyes for serum free DNA
quantification. Clin Chem Lab Med. 45:993–995. 2007.PubMed/NCBI View Article : Google Scholar
|
|
19
|
Park K, Woo M, Kim JE, Ahn JH, Jung KH,
Roh J, Gong G and Kim SB: Efficacy of assessing circulating
cell-free DNA using a simple fluorescence assay in patients with
triple-negative breast cancer receiving neoadjuvant chemotherapy: A
prospective observational study. Oncotarget. 9:3875–3886.
2017.PubMed/NCBI View Article : Google Scholar
|
|
20
|
Yu SC, Lee SW, Jiang P, Leung TY, Chan KC,
Chiu RW and Lo YM: High-resolution profiling of fetal DNA clearance
from maternal plasma by massively parallel sequencing. Clin Chem.
59:1228–1237. 2013.PubMed/NCBI View Article : Google Scholar
|
|
21
|
López-Otín C and Matrisian LM: Emerging
roles of proteases in tumour suppression. Nat Rev Cancer.
7:800–808. 2007.PubMed/NCBI View
Article : Google Scholar
|
|
22
|
Rumore P, Muralidhar B, Lin M, Lai C and
Steinman CR: Haemodialysis as a model for studying endogenous
plasma DNA: Oligonucleosome-like structure and clearance. Clin Exp
Immunol. 90:56–62. 1992.PubMed/NCBI View Article : Google Scholar
|
|
23
|
Stroun M, Anker P, Maurice P, Lyautey J,
Lederrey C and Beljanski M: Neoplastic characteristics of the DNA
found in the plasma of cancer patients. Oncology. 46:318–322.
1989.PubMed/NCBI View Article : Google Scholar
|
|
24
|
Abbosh C, Birkbak NJ, Wilson GA,
Jamal-Hanjani M, Constantin T, Salari R, Le Quesne J, Moore DA,
Veeriah S, Rosenthal R, et al: TRACERx consortium; PEACE
consortium: Phylogenetic ctDNA analysis depicts early-stage lung
cancer evolution. Nature. 545:446–451. 2017.PubMed/NCBI View Article : Google Scholar
|
|
25
|
Vansteenkiste J, Wauters E, Reymen B,
Ackermann CJ, Peters S and De Ruysscher D: Current status of immune
checkpoint inhibition in early-stage NSCLC. Ann Oncol.
30:1244–1253. 2019.PubMed/NCBI View Article : Google Scholar
|