Introduction
Acute myeloid leukemia (AML) cells arise from
hematopoietic stem cells (HSCs) or myeloid progenitors in which key
driver mutations have occurred (1).
A subpopulation of leukemic cells within the malignant population,
known as leukemia stem cells (LSCs), is considered to have
self-renewing stem cell properties and are capable of initiating
disease when engrafted into an immunocompromised host (2). The standard therapeutic approach for
AML is cytarabine-based therapy that starts with induction
chemotherapy [continuous infusion of cytarabine for 7 days
concurrent with short infusions of anthracycline on each of the
first 3 days (7+3 regimen)], followed by several cycles of
consolidation chemotherapy or allogeneic HSC transplantation
(3,4). However, only ~70% of patients
receiving standard induction therapy achieve complete remission,
and only 40% become long-term survivors (3,5). Older
patients with AML exhibit stronger intrinsic resistance and less
tolerance to chemotherapy than younger patients, resulting in a
poor response to standard induction therapy (6). Intensive therapy with high-dose
cytarabine improves the overall survival rate and reduces AML
recurrence; however, the risk of drug-related side effects is also
increased. AML treatment in older patients has not improved
significantly in recent decades compared with that in younger
patients (7). A more thorough
understanding of the drug resistance mechanisms is required to
provide effective cancer treatments and improve outcomes.
Cytarabine is a pyrimidine analog and converts into
the triphosphate form within the cell. Cytarabine then incorporates
into DNA strands during the S phase of the cell cycle to inhibit
DNA synthesis (8). Insufficient
cellular uptake and retention of cytarabine, overexpression of
enzymes that inactivate cytarabine, increased cellular
deoxycytidine triphosphate (dCTP) pool, and increased DNA repair
are the main mechanisms of cytarabine resistance (7). Overall, the reduced expression of
human equilibrating nucleoside transporter 1 (hENT1) and
deoxycytidine kinase (dCK) play pivotal roles during the
development of cytarabine resistance in leukemia cells (7). However, other new mechanisms
associated with cytarabine resistance have been discovered
consecutively. In 2017, Farge et al reported that AML cells
have increased oxidative phosphorylation after cytarabine
treatment, and inhibition of oxidative phosphorylation could
restore sensitivity to cytarabine (9). High-dose cytarabine-based therapy
causes a decrease of the cytidine diphosphate pool that may
accelerate the reduction of dCTP, thereby obstructing DNA
synthesis. In addition, high-dose cytarabine treatment increases
the AMP/ATP ratio that can trigger AMP-activated protein kinase and
subsequently forkhead box class O, thereby promoting cell cycle
arrest (10). However, therapeutic
strategies to overcome cytarabine resistance have not been
developed. A comprehensive understanding of the mechanisms
underlying cytarabine resistance is necessary to optimize
cytarabine therapy.
MicroRNAs (miRNAs or miRs) are highly-conserved
single-stranded noncoding RNAs of ~22 nucleotides (11). In most cases, miRNAs induce mRNA
degradation and translational repression by complementary binding
to the 3'-untranslated region of the target mRNA (12). Although miRNAs do not participate in
transcription and translation, they modify and control processes
including cell division, self-renewal, invasion and DNA damage
(13). MiRNA expression is known to
be dysregulated in human cancers (14,15).
Dysregulated miRNA expression by several mechanisms, such as copy
number alterations, epigenetic changes, location of miRNA near
oncogenomic regions and aberrant targeting of miRNA promoter
regions, contribute AML pathogenesis (16). However, chemotherapy for AML often
involves a combination of drugs that complicates research; thus,
the role of miRNAs in drug resistance has not been thoroughly
investigated. The role of miRNAs in leukemogenesis is
unquestionable and miRNAs may prove to be an important addition to
treatment of drug-resistant cancers in the future (17). Before specific miRNAs can be
integrated into modern cancer therapies, clearly elucidating their
mechanisms is necessary.
The present study provided comprehensive findings on
differentially expressed miRNAs (DEMs) and differentially expressed
genes (DEGs) during the development of cytarabine resistance in
HL60 cells, revealing new opportunities for refractory or
cytarabine-resistant AML.
Materials and methods
Cell culture
The R-HL60 cell line was established through the
continuous treatment of parental HL60 cells (ATCC) with increasing
concentrations of cytarabine as previously described (4). Both HL60 and R-HL60 cells were
maintained in RPMI-1640 medium (Cytiva) containing 10% fetal bovine
serum and 1% antibiotic-antimycotic solution (both from Gibco;
Thermo Fisher Scientific, Inc.) under a humidified atmosphere of 5%
CO2 at 37˚C.
RNA isolation
Total RNA from HL60 and R-HL60 cells was extracted
using TRIzol Reagent (Thermo Fisher Scientific, Inc.) according to
the manufacturer's instructions. The RNA samples were submitted to
Welgene Biotech. Co., Ltd. for small RNA sequencing and gene
expression array analysis. RNA quantity was determined using an
ND-1000 spectrophotometer (NanoDrop Technologies; Thermo Fisher
Scientific, Inc.) and RNA quality was verified using an Agilent
2100 Bioanalyzer (Agilent Technologies, Inc.).
Small RNA sequencing
MiRNA sequencing libraries were prepared using the
QIAseq miRNA Library Kit (cat. no. 331502; Qiagen GmbH) according
to the manufacturer's protocol, and were sequenced using the
NextSeq 500/550 High Output Kit (75 cycles; cat. no. FC-404-2005;
Illumina, Inc.). The loading concentration of the final library was
1.6 pM, measured by High Sensitivity D1000 ScreenTape assay (High
Sensitivity D1000 ScreenTape, cat. no. 5067-5584; and High
Sensitivity D1000 Reagents, cat. no. 5067-5585; Agilent
Technologies, Inc.). The type of sequencing setup was 75-bp single
end. Sequencing data was processed using the Illumina software
program BCL2FASTQ v2.20.0.422 (https://support.illumina.com/sequencing/sequencing_software/bcl2fastq-conversion-software/downloads.html).
Subsequently, the Trimmomatic v0.36 program (http://www.usadellab.org/cms/?page=trimmomatic)
was implemented to filter poor quality reads and trim poor quality
bases on the basis of the quality score. Qualified reads after
filtering low-quality data were analyzed using miRDeep2 v0.05
software (https://github.com/rajewsky-lab/mirdeep2) and were
aligned to the reference genome downloaded from the University of
California Santa Cruz (UCSC) Genome Browser (https://hgdownload.soe.ucsc.edu/downloads.html).
miRNAs were mapped to few genomic locations; therefore, only reads
that mapped perfectly to the genome with a ≤5-fold difference were
used for miRNA identification.
Gene expression array
A Low Input Quick Amp Labeling Kit (cat. no.
5190-2305; Agilent Technologies, Inc.) was used to amplify 200 ng
of total RNA and fluorescent Cy3 dye (included in the labeling kit;
Agilent Technologies, Inc.) was used to label RNA oligonucleotides.
A total of 600 ng Cy3-labeled cRNA was fragmented to an average
size of 50-100 nucleotides by incubation with fragmentation buffer
at 60˚C for 30 min. Correspondingly fragmented labeled cRNAs were
pooled and hybridized to the SurePrint Microarray (Agilent
Technologies, Inc.) at 65˚C for 17 h. The Cy3 microarray was
scanned at 535 nm with an Agilent microarray scanner, and the scans
were analyzed using Feature Extraction 10.7.3.1 software (Agilent
Technologies, Inc.).
MiRNA-mRNA network analysis
The DEGs and DEMs with a fold change of ≥2 during
the development of cytarabine resistance in HL60 cells were
selected. The miRNA target genes were predicted using three online
databases: miRDB, TargetScan, and miRTarBase (18-20).
The miRNA-mRNA pairs with negative correlation were screened out on
the basis of the hypothesis that miRNA negatively regulates the
target mRNA. The miRNA-mRNA network was constructed by using
Cytoscape 3.8.2 software (21).
Functional enrichment analysis
Gene ontology (GO) analysis was performed using
ShinyGO 0.76 to determine the biological functions of the DEGs
included in the candidate miRNA-mRNA network (22,23).
Protein-protein interaction analysis in the cluster associated with
the regulation of cell migration, locomotion, cellular component
movement, cell motility, and localization was performed using
STRING 11.5(24).
Transwell migration assay
A Transwell chamber consisting of an upper and a
lower chamber separated by a porous membrane was used for the cell
migration assay. Cells were suspended in serum-free RPMI-1640
medium and plated in the upper chamber with 8-µm pores (Guangzhou
Jet Biofiltration Co., Ltd.), adjusting the cell concentration to
2.5x10⁵ cells/ml. RPMI-1640 medium with 10% fetal bovine
serum was added to the lower chamber. The Transwell chamber was
incubated in an incubator with 5% CO2 at 37˚C, and then
the cells in the lower chamber were collected and counted by Cell
Counting Kit-8 (CCK-8) assay (Energenesis Biomedical Co., Ltd.)
after incubating for 24 and 48 h. In detail, a 200-µl volume
obtained from the lower chamber was transferred to a 96-well plate,
then 20 µl CCK-8 solution was added per well and incubation
followed for 2 h. Subsequently, the specific absorbance and
reference absorbance of each well were measured at 450 and 650 nm,
respectively, by an enzyme-linked immunosorbent assay reader
(Epoch2; Agilent Technologies, Inc.).
Statistical analysis
Data were analyzed using GraphPad Prism 5.0
(GraphPad Software Inc.; Dotmatics). A Student's paired t-test was
used to determine the differences between the experimental and
control groups. Data are representative of three independent
experiments, with values presented as the mean ± standard deviation
and P<0.05 was considered to indicate a statistically
significant difference.
Results
DEGs and DEMs between HL60 and R-HL60
cells
To investigate the alterations of miRNA and mRNA
profiles during the development of cytarabine resistance in HL60
cells, miRNA and mRNA profiles of HL60 and R-HL60 cells were
determined using small RNA sequencing and gene expression array
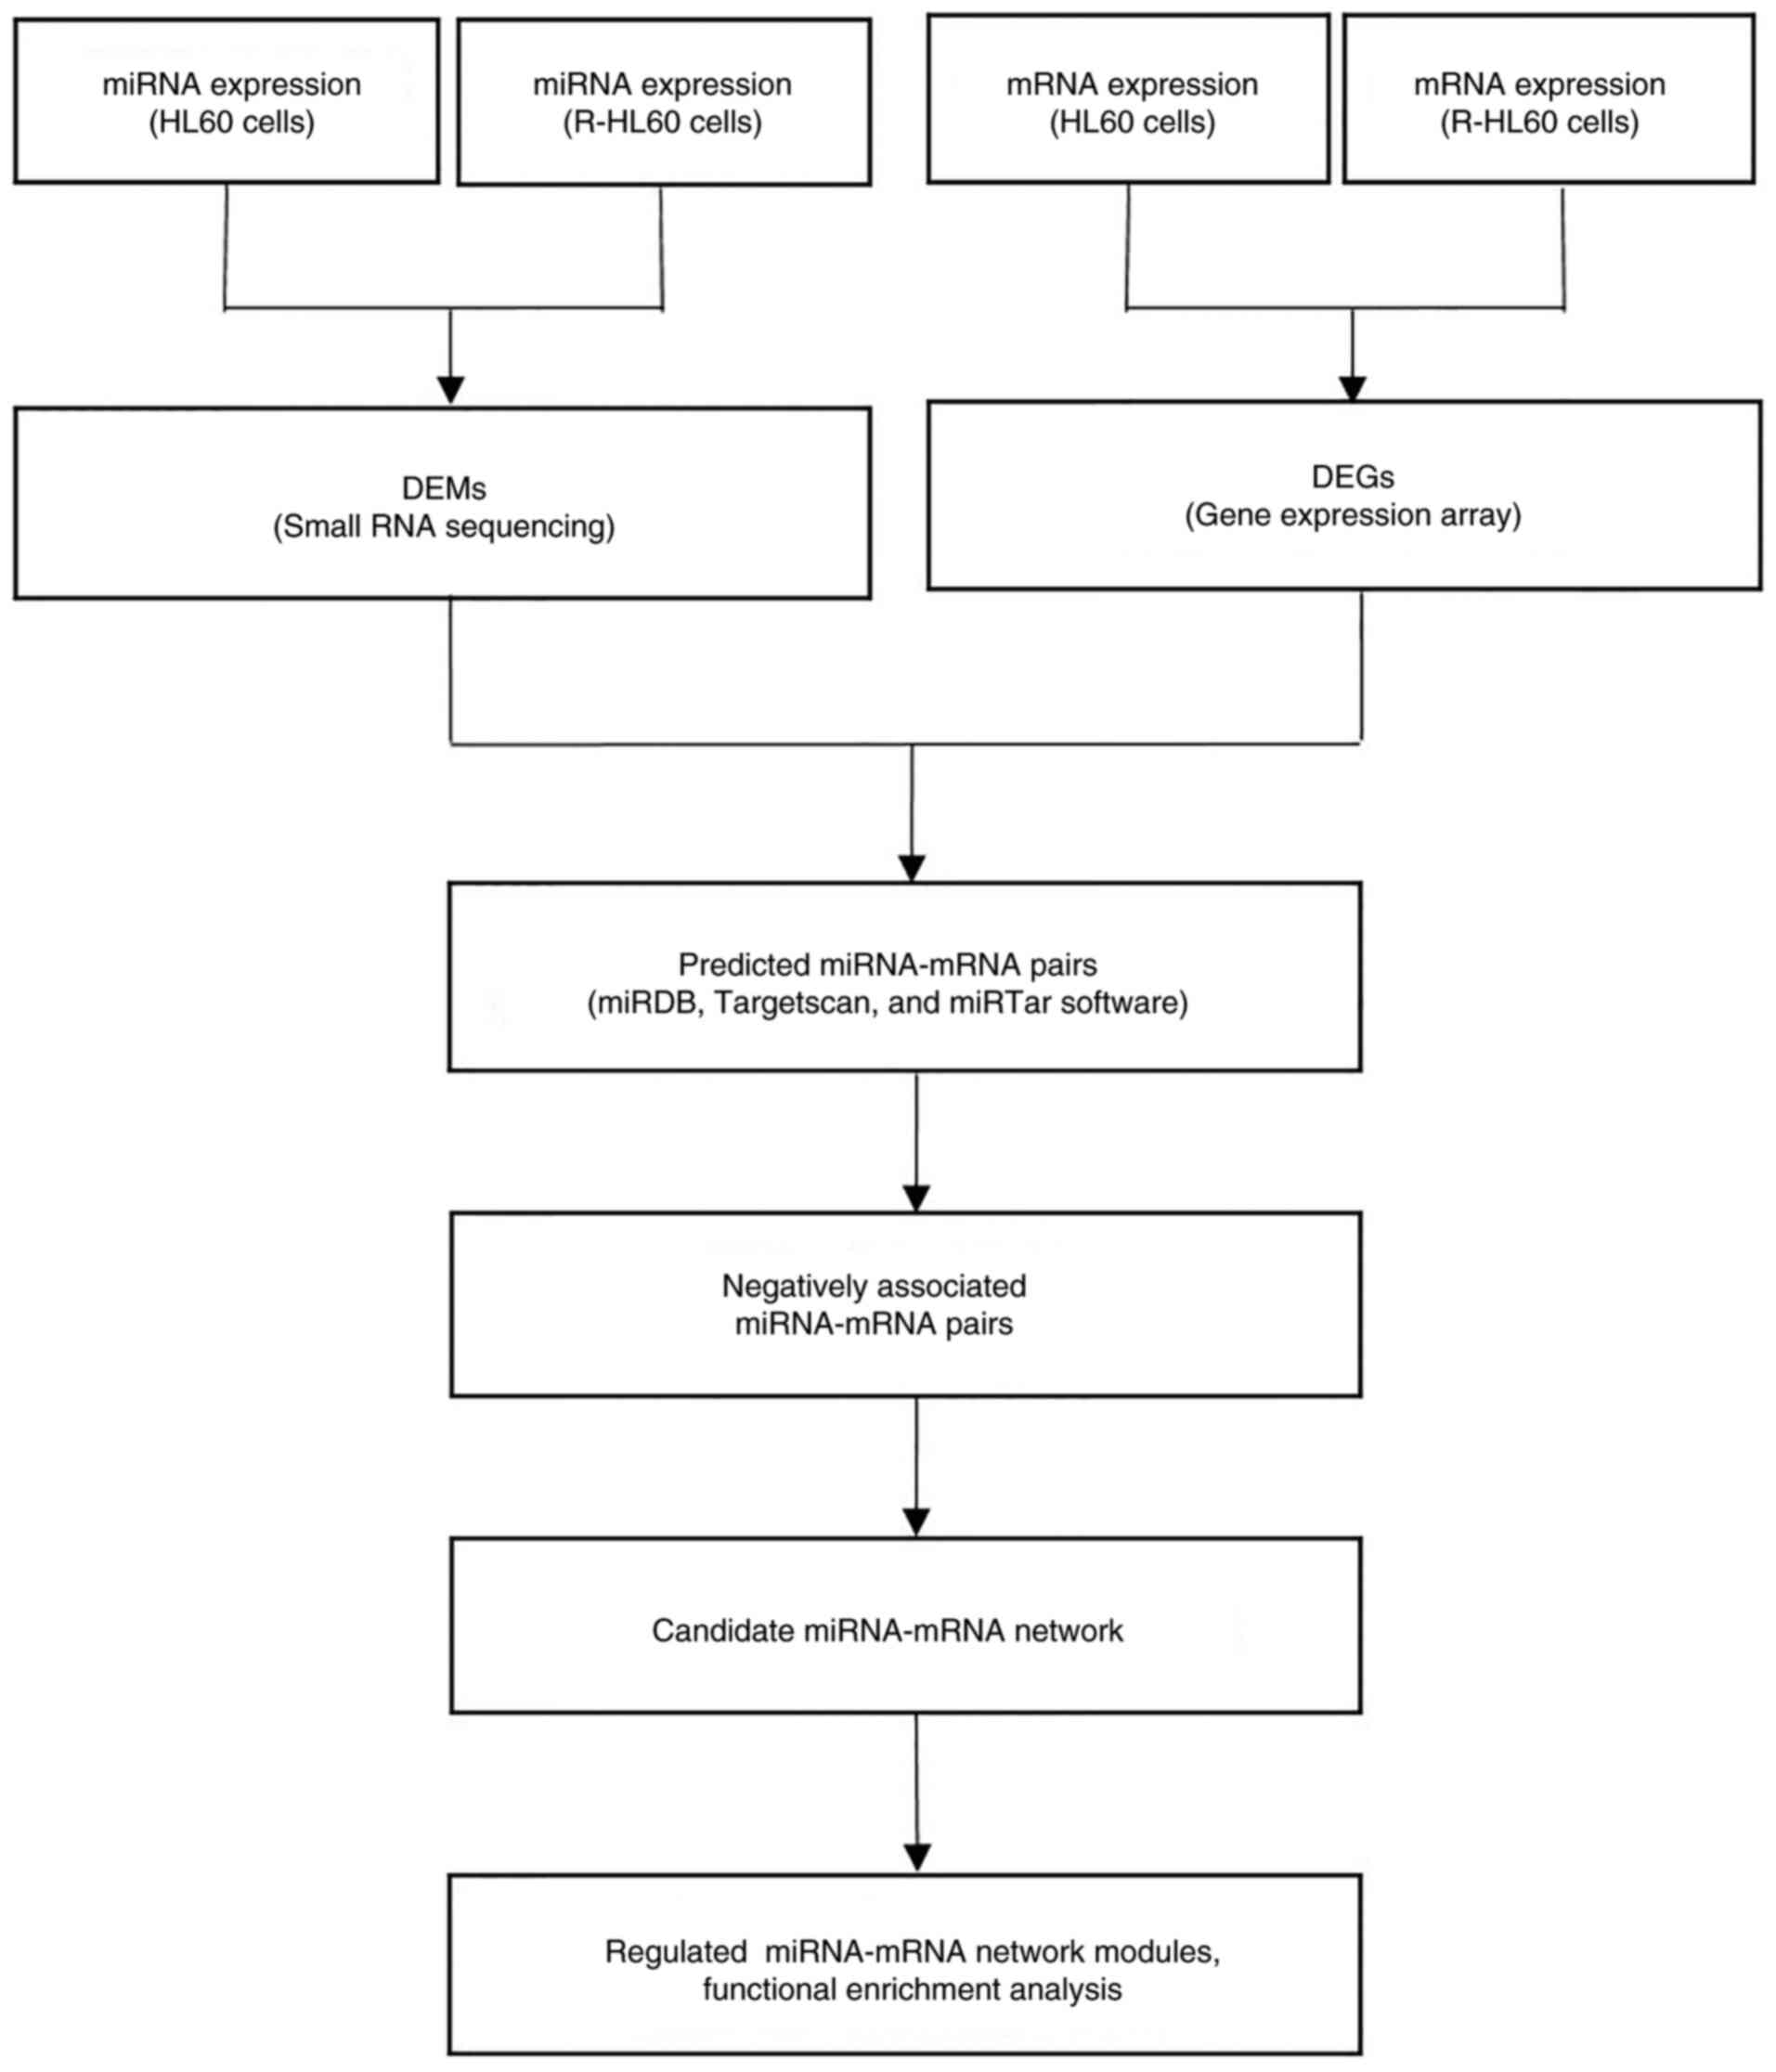
analysis, respectively. The flowchart of candidate miRNA-mRNA
target pair selections and subsequent functional enrichment
analysis is displayed in Fig. 1.
The standard setting for identifying DEMs was >1 read per
million (RPM). DEMs and DEGs, with an adjusted P-value <0.05
were considered statistically significant and selected for further
investigation. In the present study, the experimental design of
previous studies was referred to and DEMs and DEGs whose expression
changes between HL60 and R-HL60 cells were ≥2-fold were selected
for analysis (25,26). Small RNA sequencing data revealed
that there were 75 DEMs with a ≥2-fold difference between HL60 and
R-HL60 cells, of which 34 DEMs had higher expression levels in
R-HL60 than those in parental HL60 cells, and 41 DEMs had lower
expression levels in R-HL60 than those in parental HL60 cells. Gene
expression array data showed that there were 274 DEGs with a
≥2-fold difference between R-HL60 and HL60 cells, of which 185 DEGs
had higher expression levels in R-HL60 than those in parental HL60
cells, and 89 DEGs had lower expression levels in R-HL60 than those
in parental HL60 cells. Negatively associated miRNA-mRNA pairs
predicted using the miRDB, Targetscan, or miRTar database were
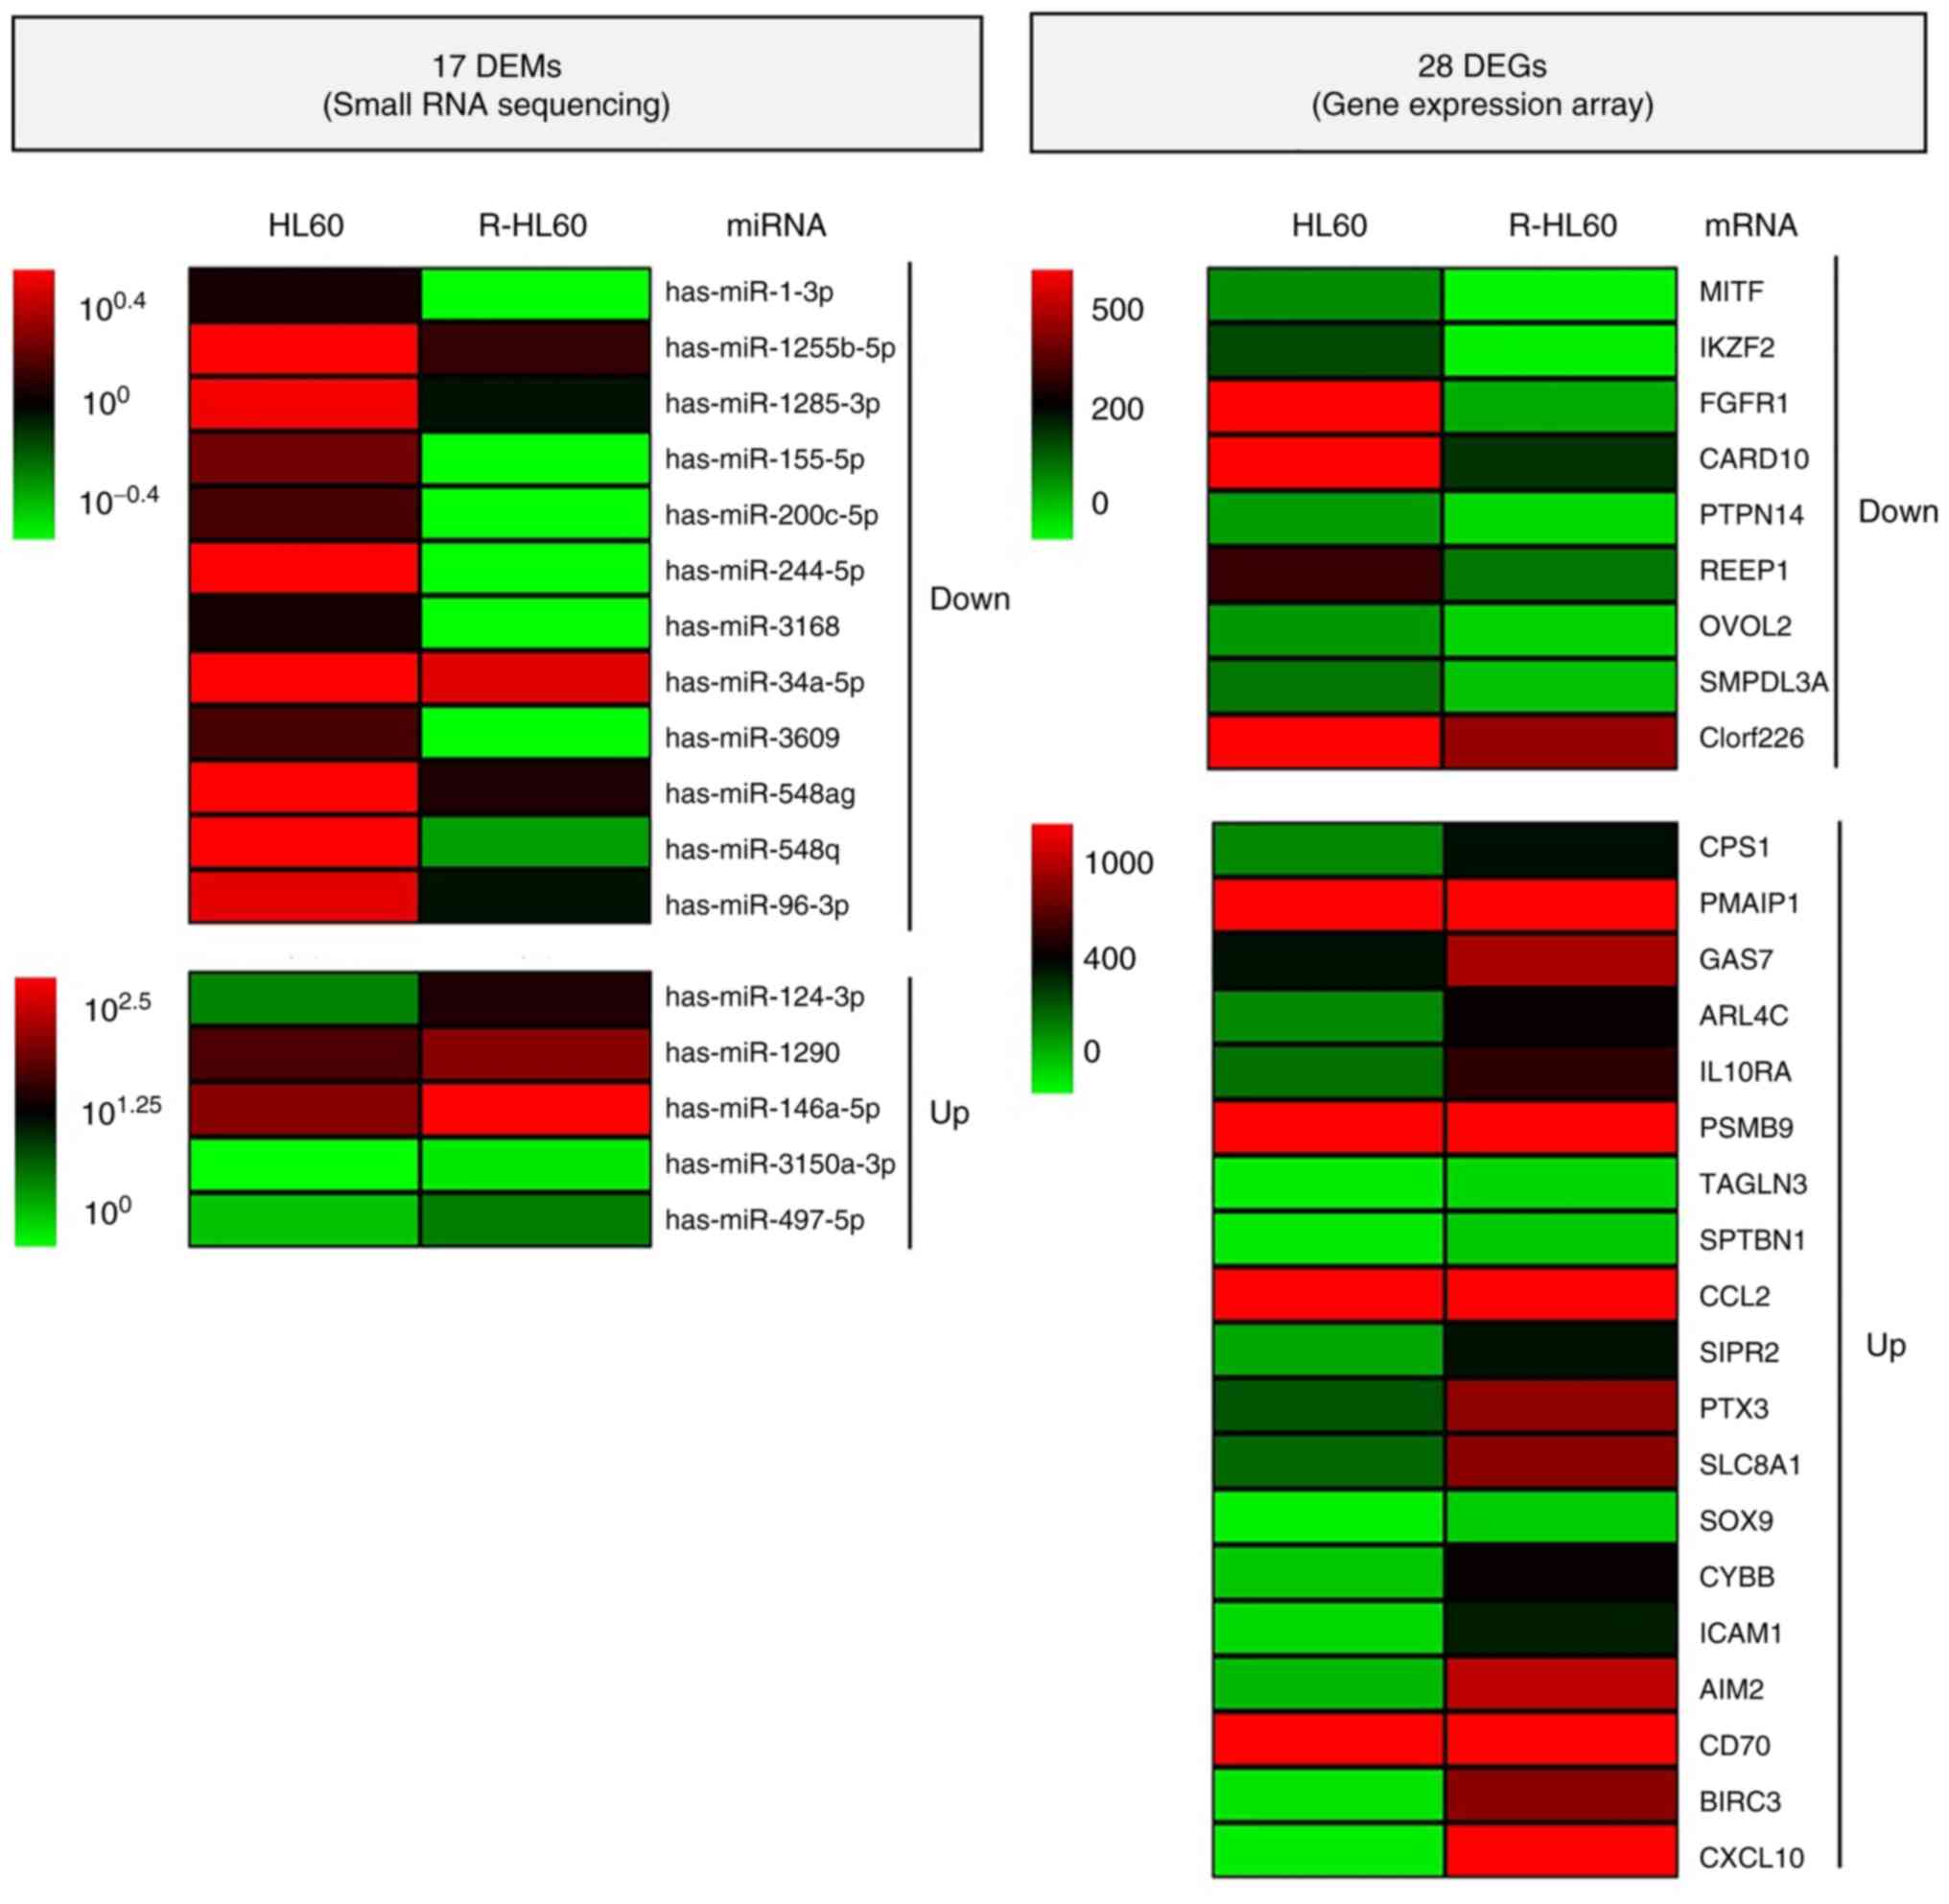
selected as candidate miRNA-mRNA target pairs. Candidate miRNA-mRNA
target pairs including 17 DEMs (5 upregulated miRNAs and 12
downregulated miRNAs) and 28 DEGs (19 upregulated genes and 9
downregulated genes) are presented in Table I. Heat maps revealing the
hierarchical clustering of 17 DEMs and 28 DEGs are shown in
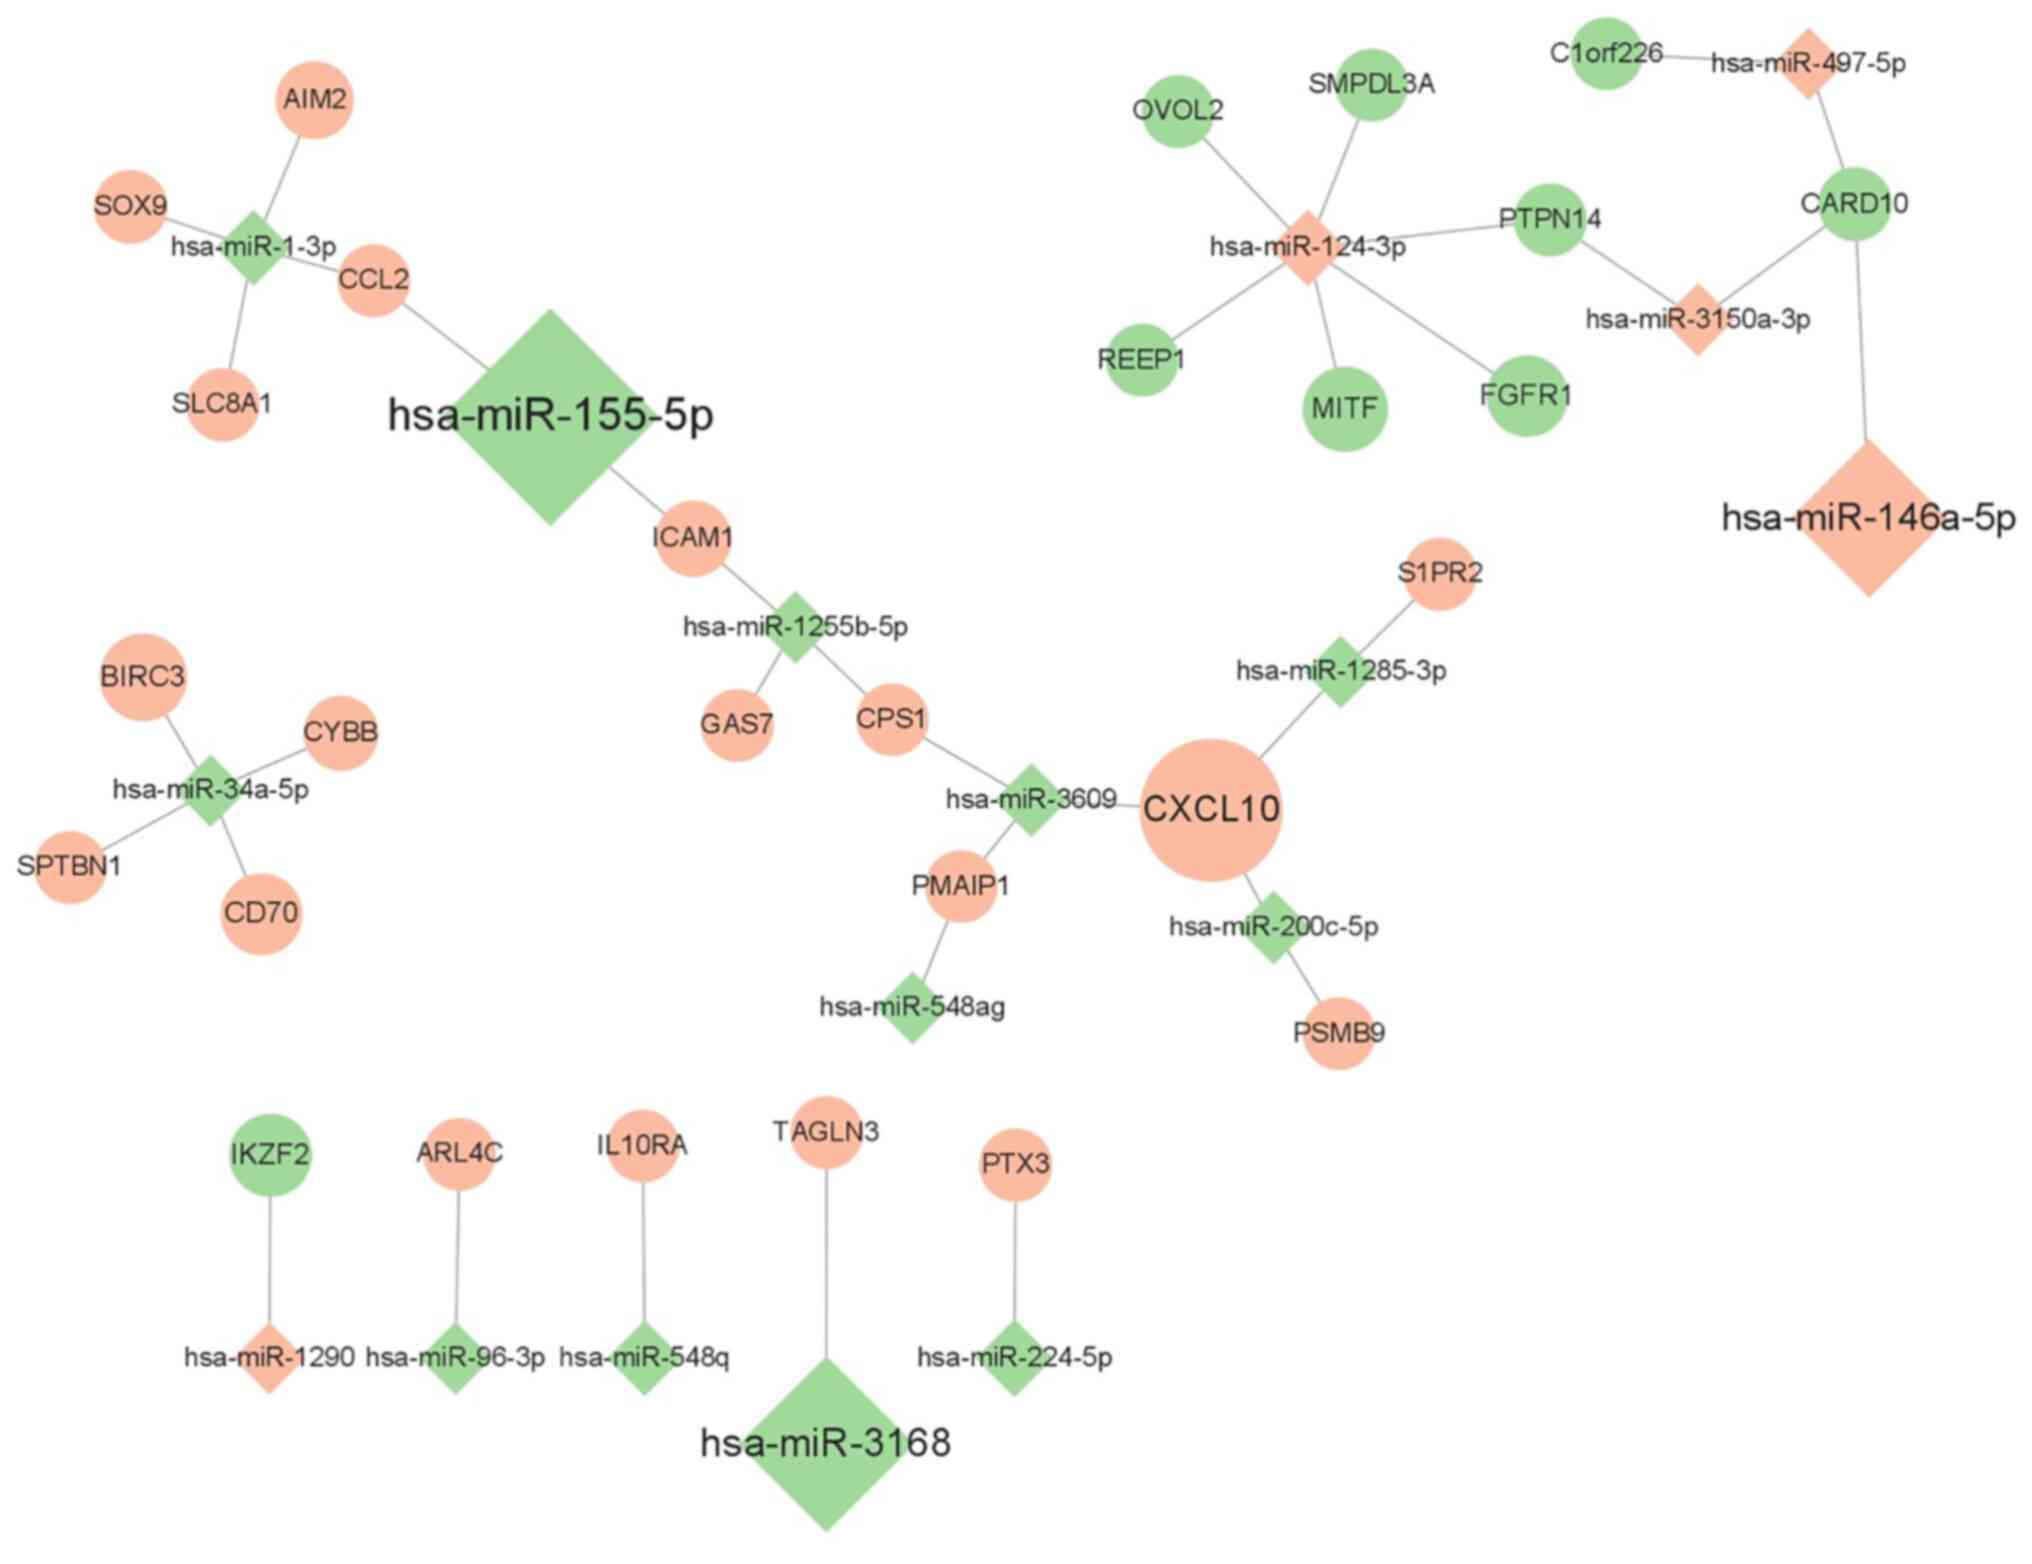
Fig. 2, and the candidate
miRNA-mRNA network was visualized using Cytoscape 3.8.2 software
(Fig. 3).
 | Table ICandidate miRNA-mRNA target
pairs. |
Table I
Candidate miRNA-mRNA target
pairs.
| Small RNA
sequencing | Gene expression
array |
|---|
| miRNA | Fold change | Up/Down | mRNA (fold
change) |
|---|
| hsa-miR-1-3p | -5.74 | Down | SLC8A1
(3.06), CCL2 (2.52), SOX9 (3.30), AIM2
(7.67) |
|
hsa-miR-1255b-5p | -2.34 | | GAS7 (2.15),
ICAM1 (5.83), CPS1 (2.03) |
|
hsa-miR-1285-3p | -2.57 | | S1PR2
(2.68), CXCL10 (74.65) |
| hsa-miR-155-5p | -152.00 | | CCL2 (2.52),
ICAM1 (5.83) |
|
hsa-miR-200c-5p | -3.51 | | PSMB9
(2.28), CXCL10 (74.65) |
| hsa-miR-224-5p | -7.62 | | PTX3
(2.75) |
| hsa-miR-3168 | -109.00 | | TAGLN3
(2.30) |
| hsa-miR-34a-5p | -2.05 | | CYBB (4.76),
SPTBN1 (2.45), CD70 (11.63), BIRC3
(17.74) |
| hsa-miR-3609 | -3.51 | | CXCL10
(74.65), CPS1 (2.03), PMAIP1 (2.06) |
| hsa-miR-548ag | -2.35 | | PMAIP1
(2.06) |
| hsa-miR-548q | -5.23 | | IL10RA
(2.26) |
| hsa-miR-96-3p | -2.45 | | ARL4C
(2.26) |
| hsa-miR-124-3p | 6.32 | Up | MITF
(-14.97), REEP1 (-2.49), OVOL2 (-2.39),
SMPDL3A (-2.18), FGFR1 (-11.23), PTPN14
(-2.58) |
| hsa-miR-1290 | 2.03 | | IKZF2
(-12.80) |
|
hsa-miR-146a-5p | 90.38 | | CARD10
(-3.37) |
|
hsa-miR-3150a-3p | 3.02 | | PTPN14
(-2.58), CARD10 (-3.37) |
| hsa-miR-497-5p | 2.18 | | C1orf226
(-2.08), CARD10 (-3.37) |
Functional enrichment analysis of
DEGs
Functional enrichment analysis was performed for 28
DEGs included in the candidate miRNA-mRNA target pairs. The
histogram of the top 20 most-enriched GO pathways is displayed in
Fig. 4A, and genes involved in the
GO pathways are listed in Table
II. The hierarchical clustering tree revealed the relationships
between similar sets of data (Fig.
4B). In addition, 10 genes (CCL2, SOX9, SLC8A1, ICAM1,
CXCL10, SIPR2, FGFR1, OVOL2, MITF and CARD10) were
simultaneously involved in seven GO terms related to the regulation
of migration ability, namely ‘regulation of cell migration’,
‘regulation of locomotion’, ‘regulation of cellular component
movement’, ‘cell migration’, ‘locomotion’, ‘cell motility’, and
‘localization of cell’. The modulation of migration ability is
considered as a possible therapeutic target in refractory AML
(27), therefore, the present study
focused on analyzing the candidate miRNA-mRNA pairs associated with
the modulation of migration ability. The candidate miRNA-mRNA pairs
involved in these GO terms associated with the regulation of
migration ability are listed in Table
III. Among them, SIPR2 was not present in the STRING database;
therefore, protein-protein interaction analysis was performed for
the remaining nine genes in the cluster (Fig. 4C). In addition, the interactive
graph displays the percentage of shared gene members for the
enriched GO terms (Fig. 4D).
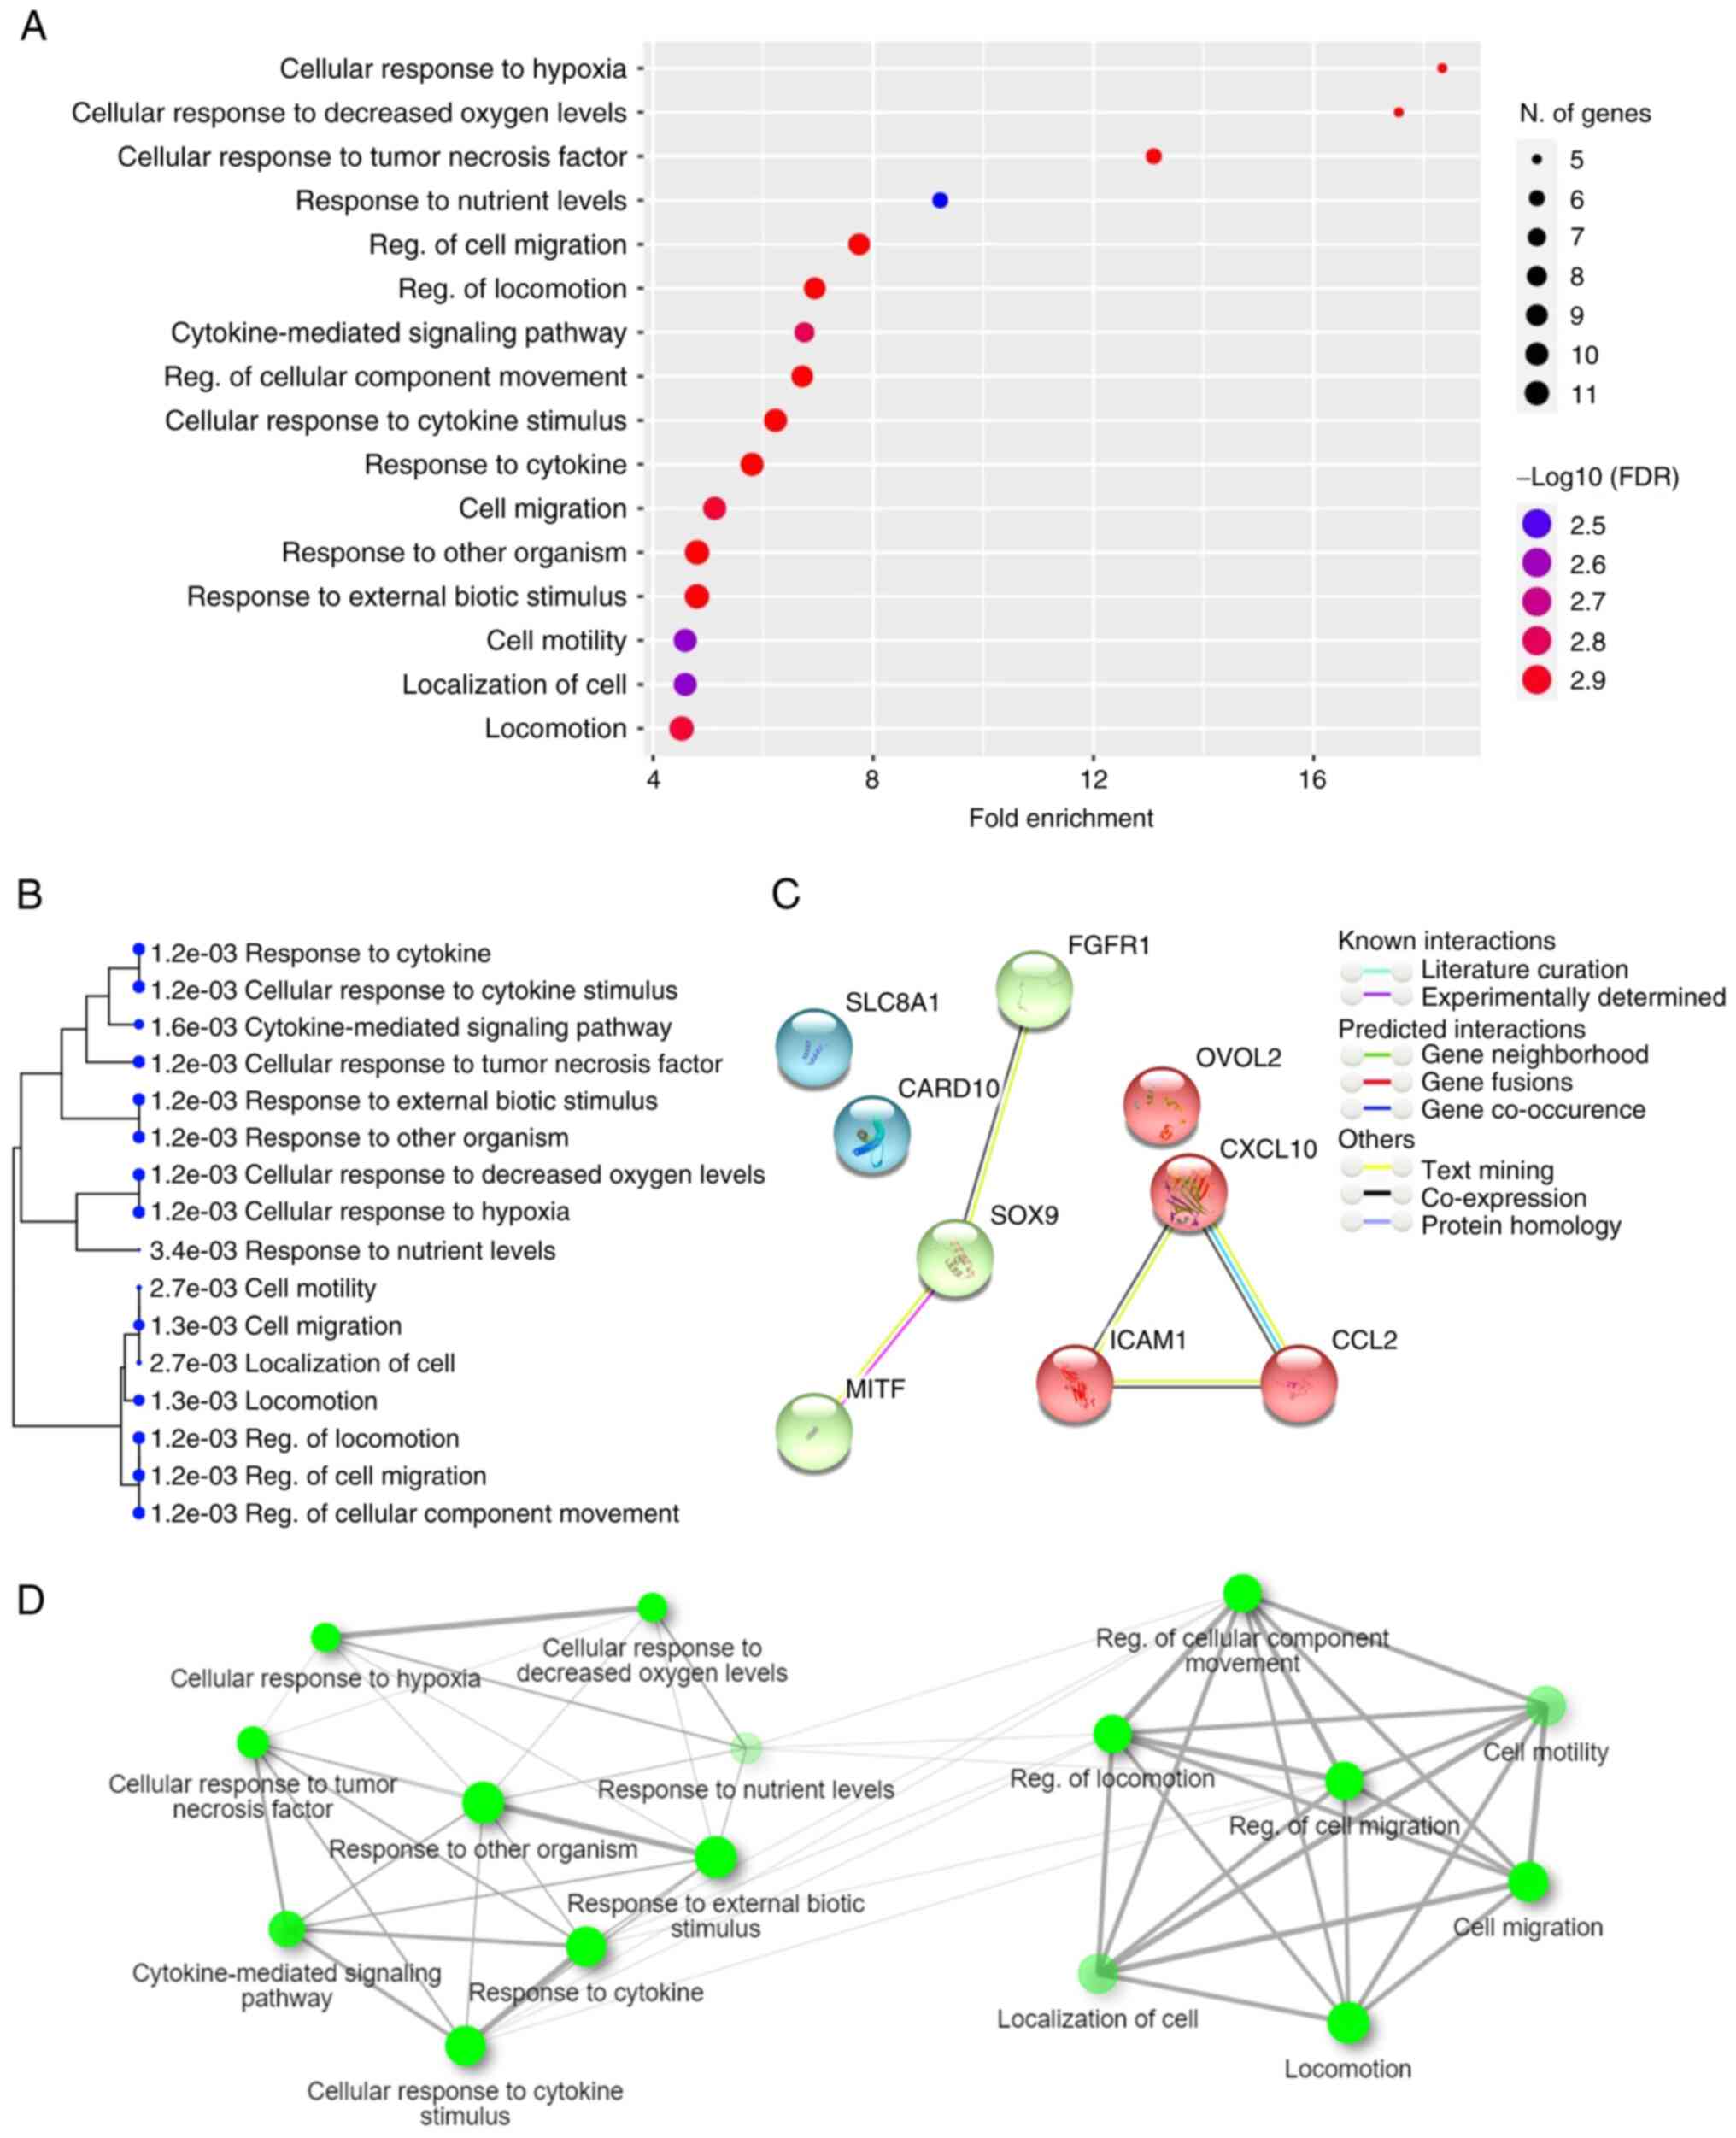 | Figure 4Functional enrichment of candidate
DEGs. Genes involved in the candidate miRNA-mRNA network were
considered as candidate targets and their functional enrichment was
analyzed. (A) Histogram of the top 20 most-enriched GO terms of
candidate DEGs. (B) A hierarchical clustering tree summarizes the
association between significant GO terms. GO terms shared by a high
percentage of gene members are clustered together. The size of the
dots indicates the significance of the P-value. (C) Ten genes
(CCL2, SOX9, SLC8A1, ICAM1,
CXCL10, SIPR2, FGFR1, OVOL2,
MITF and CARD10) were simultaneously involved in
seven GO pathways, including regulation of ‘cell migration’,
‘regulation of locomotion’, ‘regulation of cellular component
movement’, ‘cell migration’, ‘locomotion’, ‘cell motility’, and
‘localization of cell’. A network cluster analysis of
protein-protein interaction was performed using the STRING
software. (D) An interactive graph revealed the association between
enriched GO terms. Two terms (nodes) are connected if they share
≥20% of gene members. Darker nodes represent more significantly
enriched gene terms. Larger nodes represent larger gene sets.
Thicker edges represent more overlapped genes. |
| Table IITop 20 most-enriched GO pathways
involved in the development of cytarabine resistance in HL60
cells. |
Table II
Top 20 most-enriched GO pathways
involved in the development of cytarabine resistance in HL60
cells.
| GO ID | Enrichment FDR | Fold
enrichment | GO pathway | mRNA |
|---|
| GO:0071456 | 0.001178771 | 18.33655084 | Cellular response
to hypoxia | ICAM1 PMAIP1
CYBB SLC8A1 PSMB9 |
| GO:0036294 | 0.001178771 | 17.54618227 | Cellular response
to decreased oxygen levels | ICAM1 PMAIP1
CYBB SLC8A1 PSMB9 |
| GO:0071356 | 0.001178771 | 13.09613175 | Cellular response
to tumor necrosis factor | BIRC3 ICAM1 CCL2
CD70 AIM2 |
| GO:0031667 | 0.003377186 | 9.21671159 | Response to
nutrient levels | CPS1 ICAM1
PMAIP1 CYBB CXCL10 SLC8A1 |
| GO:0030334 | 0.001169267 | 7.745545153 | Regulation of cell
migration | FGFR1 ICAM1
CARD10 CCL2 SOX9 CXCL10 SLC8A1 MITF S1PR2 |
| GO:0040012 | 0.001169267 | 6.938717532 | Regulation of
locomotion | FGFR1 ICAM1
CARD10 CCL2 SOX9 CXCL10 SLC8A1 MITF S1PR2 |
| GO:0019221 | 0.001551712 | 6.749370836 | Cytokine-mediated
signaling pathway | BIRC3 ICAM1 CCL2
IL10RA CD70 AIM2 CXCL10 PSMB9 |
| GO:0051270 | 0.001169267 | 6.709968603 | Regulation of
cellular component movement | FGFR1 ICAM1
CARD10 CCL2 SOX9 CXCL10 SLC8A1 MITF S1PR2 |
| GO:0071345 | 0.001169267 | 6.22433377 | Cellular response
to cytokine stimulus | BIRC3 ICAM1 CCL2
IL10RA SOX9 CD70 PTPN14 AIM2 CXCL10 PSMB9 |
| GO:0034097 | 0.001169267 | 5.798738299 | Response to
cytokine | BIRC3 ICAM1 CCL2
IL10RA SOX9 CD70 PTPN14 AIM2 CXCL10 PSMB9 |
| GO:0016477 | 0.00133677 | 5.120395328 | Cell migration | FGFR1 ICAM1
CARD10 CCL2 SOX9 OVOL2 CXCL10 SLC8A1 MITF S1PR2 |
| GO:0051707 | 0.001178771 | 4.799341602 | Response to other
organism | CPS1 BIRC3 ICAM1
CCL2 IL10RA PMAIP1 AIM2 PTX3 CYBB CXCL10 PSMB9 |
| GO:0043207 | 0.001178771 | 4.796770985 | Response to
external biotic stimulus | CPS1 BIRC3 ICAM1
CCL2 IL10RA PMAIP1 AIM2 PTX3 CYBB CXCL10 PSMB9 |
| GO:0048870 | 0.002712992 | 4.584137709 | Cell motility | FGFR1 ICAM1
CARD10 CCL2 SOX9 OVOL2 CXCL10 SLC8A1 MITF S1PR2 |
| GO:0051674 | 0.002712992 | 4.584137709 | Localization of
cell | FGFR1 ICAM1
CARD10 CCL2 SOX9 OVOL2 CXCL10 SLC8A1 MITF S1PR2 |
| GO:0040011 | 0.00133677 | 4.51845178 | Locomotion | FGFR1 ICAM1
CARD10 CCL2 SPTBN1 SOX9 OVOL2 CXCL10 SLC8A1 MITF
S1PR2 |
| Table IIIIntegration of miRNA-mRNA pairs
involved in the regulation of cell migration behavior or ability
during the development of cytarabine resistance in HL60 cells. |
Table III
Integration of miRNA-mRNA pairs
involved in the regulation of cell migration behavior or ability
during the development of cytarabine resistance in HL60 cells.
| miRNA | Up/Down | mRNA | Up/Down | GO pathway |
|---|
| hsa-miR-1-3p | Down | CCL2,
SOX9, SLC8A1 | Up | • Regulation of
cell migration |
| hsa-miR-155-5p | | CCL2,
ICAM1 | | • Regulation of
locomotion |
|
hsa-miR-1255b-5p | | ICAM1 | | • Regulation of
cellular component movement |
|
hsa-miR-200c-5p | | CXCL10 | | • Cell
migration |
| hsa-miR-3609 | | | | • Locomotion |
|
hsa-miR-1285-3p | | S1PR2,
CXCL10 | | • Cell
motility |
| hsa-miR-124-3p | Up | FGFR1,
OVOL2, MITF | Down | • Localization of
cell |
|
hsa-miR-146a-5p | | CARD10 | | |
|
hsa-miR-497a-5p | | | | |
|
hsa-miR-3150a-3p | | | | |
Comparison of migration ability
between HL60 and R-HL60
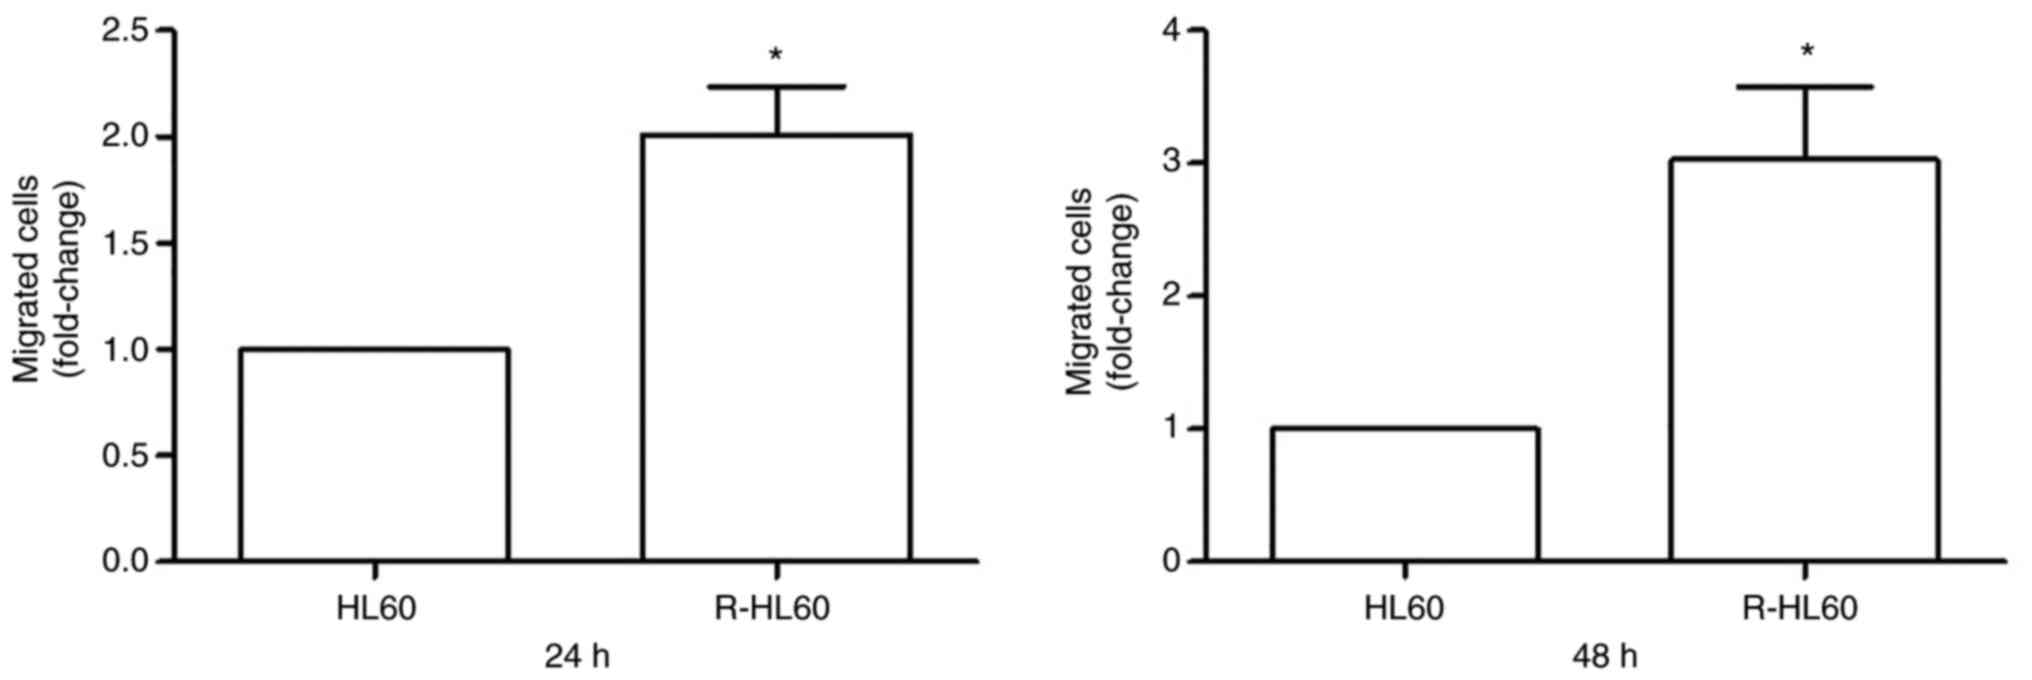
Transwell migration assays were used to compare the
migration ability of HL60 and R-HL60 cells. The results showed that
the migration ability of R-HL60 cells was ~2-folds higher than that
of parental HL60 cells following incubation for 24 h, and was
~3-folds higher than that of parental HL60 cells following
incubation for 48 h (Fig. 5).
Discussion
Cytarabine is the main drug used for AML treatment,
however, drug resistance hinders the achievement of complete
remission. Although miRNAs are known to be often dysregulated in
AML, the role of miRNAs in the development of drug resistance has
not been thoroughly investigated. The present study, to the best of
the authors' knowledge, is the first to comprehensively compare the
integrated miRNA-mRNA network between HL60 and R-HL60 cells, and
reveal that 16 miRNA-mRNA pairs, including miR-1-3p/CCL2,
miR-1-3p/SOX9, miR-1-3p/SLC8A1,
miR-155-5p/CCL2, miR-155-5p/ICAM1,
miR-1255b-5p/ICAM1, miR-200c-5p/CXCL10,
miR-3609/CXCL10, miR-1285-3p/SIPR2,
miR-1285-3p/CXCL10, miR-124-3p/FGFR1,
miR-124-3p/OVOL2, miR-124-3p/MITF,
miR-146a-5p/CARD10, miR-497a-5p/CARD10, and
miR-3150a-3p/CARD10, participate in the regulation of
migration ability during the development of cytarabine resistance
in HL60 cells (Table III). Among
them, miR-1-3p targeting CCL2 (28); miR-1-3p targeting SOX9
(29); miR-1-3p targeting
SLC8A1 (30); and miR-146-5p
targeting CARD10 (31) have
been confirmed by luciferase assay in previous studies. In
addition, miR-1-3p (32),
miR-1255-5p (33), miR-200c-5p
(34), miR-155-5p (35), miR-1285-3p (36), miR-124-3p (37) and miR-146a-5p (38,39)
have been also reported to regulate cell migratory behavior in
several cell models.
Several studies have reported associations between
miRNAs and AML outcomes. For example, patients with high expression
levels of miR-126-5p/3p had poor survival. Transfection of the
mimic miR-126-5p into an AML cell line (KG-1) resulted in decreased
sensitivity to cytarabine (40). A
specific anti-miR-21 oligonucleotide (AMO-miR-21) inhibited cell
viability and induced apoptosis in HL60 cells. AMO-miR-21 in
combination with cytarabine enhanced the sensitivity to cytarabine
and promoted cytarabine-induced apoptosis. These effects of
AMO-miR-21 may be partially due to upregulated PDCD4, a
direct target of miR-21(41). In
addition, miRNA-181a overexpressed in AML cells downregulated the
expression of ataxia telangiectasia mutated (ATM), a DNA damage
response protein. Thus, DNA damage could not be repaired by ATM,
leading to uncontrolled growth and drug resistance in AML cells
(42). However, it is considered
that comparing drug-resistant cells with parental cells would
reveal the actual mechanisms of drug resistance more effectively
than studying chemotherapy sensitivity on parental cells alone.
Unlike solid cancers, which gradually acquire
motility, leukemia has inherent cell motility ability as leukocytes
that move throughout the vascular system. The precise location of
leukemia origin is often unknown, which has led to controversy
about whether leukemia should be considered a metastatic disease
(1). Even so, widespread
organotropic dissemination is a common feature of liquid and solid
cancers. It was revealed that high-dose cytarabine treatment
inhibited the migratory ability of the C1498 AML cell line and that
of the MLL-AF9 oncogene-induced AML mouse model (27,43).
However, proliferative C1498 cells could restore migratory ability
after relapse (27). Although the
association between migration ability and chemotherapy resistance
is complex and not yet clarified, modulation of migration ability
is considered as a possible therapeutic target in refractory AML
(27).
The lack of validation in other drug-resistant cell
lines and clinical specimens is a limitation of the present study.
However, the study revealed the possible mechanisms underlying the
regulation of cell migration ability during the development of
cytarabine resistance in HL60 cells. This may assist in the
development of targeted therapies for modulating cell migration in
refractory AML.
Acknowledgements
Not applicable.
Funding
Funding: The present study was supported by the National Science
and Technology Council of Taiwan (grant no. MOST
109-2314-B-037-103-MY3 and NSTC 112-2314-B-037-063) and the
Kaohsiung Medical University Hospital (Kaohsiung, Taiwan) (grant
nos. KMUH109-9R49, KMUH110-0R45 and KMUH111-1R42).
Availability of data and materials
The datasets used and/or analyzed during the current
study are available from the corresponding author on reasonable
request. The sequencing datasets generated and/or analyzed during
the current study are available in the Gene Expression Omnibus
repository (https://www.ncbi.nlm.nih.gov/geo/query/acc.cgi?acc=GSE221719).
Authors' contributions
WYH, SSC and YHT conceived and designed the
experiments. PCL, YML and CYY performed the experiments and data
analysis. CYY and YHT confirm the authenticity of all the raw data.
WYH wrote the manuscript. YHT edited the manuscript. All authors
read and approved the final manuscript.
Ethics approval and consent to
participate
Not applicable.
Patient consent for publication
Not applicable.
Competing interests
The authors declare that they have no competing
interests.
References
|
1
|
Whiteley AE, Price TT, Cantelli G and
Sipkins DA: Leukaemia: A model metastatic disease. Nat Rev Cancer.
21:461–475. 2021.PubMed/NCBI View Article : Google Scholar
|
|
2
|
Vetrie D, Helgason GV and Copland M: The
leukaemia stem cell: Similarities, differences and clinical
prospects in CML and AML. Nat Rev Cancer. 20:158–173.
2020.PubMed/NCBI View Article : Google Scholar
|
|
3
|
Dombret H and Gardin C: An update of
current treatments for adult acute myeloid leukemia. Blood.
127:53–61. 2016.PubMed/NCBI View Article : Google Scholar
|
|
4
|
Tseng YH, Chiou SS, Weng JP and Lin PC:
Curcumin and tetrahydrocurcumin induce cell death in
Ara-C-resistant acute myeloid leukemia. Phytother Res.
33:1199–1207. 2019.PubMed/NCBI View
Article : Google Scholar
|
|
5
|
Tseng YH, Yang RC, Chiou SS, Shieh TM,
Shih YH and Lin PC: Curcumin induces apoptosis by inhibiting BCAT1
expression and mTOR signaling in cytarabine-resistant myeloid
leukemia cells. Mol Med Rep. 24(565)2021.PubMed/NCBI View Article : Google Scholar
|
|
6
|
Yanada M and Naoe T: Acute myeloid
leukemia in older adults. Int J Hematol. 96:186–193.
2012.PubMed/NCBI View Article : Google Scholar
|
|
7
|
Wang SY, Shih YH, Shieh TM and Tseng YH:
Proteasome inhibitors interrupt the activation of Non-Canonical
NF-κB signaling pathway and induce cell apoptosis in
Cytarabine-Resistant HL60 cells. Int J Mol Sci.
23(361)2021.PubMed/NCBI View Article : Google Scholar
|
|
8
|
Bhise NS, Chauhan L, Shin M, Cao X, Pounds
S, Lamba V and Lamba JK: MicroRNA-mRNA pairs associated with
outcome in AML: From in vitro Cell-Based studies to AML patients.
Front Pharmacol. 6(324)2015.PubMed/NCBI View Article : Google Scholar
|
|
9
|
Farge T, Saland E, de Toni F, Aroua N,
Hosseini M, Perry R, Bosc C, Sugita M, Stuani L, Fraisse M, et al:
Chemotherapy-Resistant human acute myeloid leukemia cells are not
enriched for leukemic stem cells but require oxidative metabolism.
Cancer Discov. 7:716–735. 2017.PubMed/NCBI View Article : Google Scholar
|
|
10
|
Li Z, Guo JR, Chen QQ, Wang CY, Zhang WJ,
Yao MC and Zhang W: Exploring the antitumor mechanism of high-dose
cytarabine through the metabolic perturbations of ribonucleotide
and deoxyribonucleotide in human promyelocytic Leukemia HL-60
Cells. Molecules. 22(499)2017.PubMed/NCBI View Article : Google Scholar
|
|
11
|
Yen MC, Yeh IJ, Liu KT, Jian SF, Lin CJ,
Tsai MJ and Kuo PL: Next-generation sequencing predicts interaction
network between miRNA and target genes in lipoteichoic
acid-stimulated human neutrophils. Int J Mol Med. 44:1436–1446.
2019.PubMed/NCBI View Article : Google Scholar
|
|
12
|
Liu Y, Cheng Z, Pang Y, Cui L, Qian T,
Quan L, Zhao H, Shi J, Ke X and Fu L: Role of microRNAs, circRNAs
and long noncoding RNAs in acute myeloid leukemia. J Hematol Oncol.
12(51)2019.PubMed/NCBI View Article : Google Scholar
|
|
13
|
Zhang J, Gu Y and Chen B: Mechanisms of
drug resistance in acute myeloid leukemia. Onco Targets Ther.
12:1937–1945. 2019.PubMed/NCBI View Article : Google Scholar
|
|
14
|
Yu DS, Song XL and Yan C: Oncogenic
miRNA-1908 targets HDAC10 and promotes the aggressive phenotype of
cervical cancer cell. Kaohsiung J Med Sci. 37:402–410.
2021.PubMed/NCBI View Article : Google Scholar
|
|
15
|
Ali Syeda Z, Langden SSS, Munkhzul C, Lee
M and Song SJ: Regulatory mechanism of MicroRNA expression in
cancer. Int J Mol Sci. 21(1723)2020.PubMed/NCBI View Article : Google Scholar
|
|
16
|
Trino S, Lamorte D, Caivano A, Laurenzana
I, Tagliaferri D, Falco G, Del Vecchio L, Musto P and De Luca L:
MicroRNAs as new biomarkers for diagnosis and prognosis, and as
potential therapeutic targets in acute myeloid leukemia. Int J Mol
Sci. 19(460)2018.PubMed/NCBI View Article : Google Scholar
|
|
17
|
Gabra MM and Salmena L: microRNAs and
acute myeloid leukemia chemoresistance: A mechanistic overview.
Front Oncol. 7(255)2017.PubMed/NCBI View Article : Google Scholar
|
|
18
|
Chou CH, Shrestha S, Yang CD, Chang NW,
Lin YL, Liao KW, Huang WC, Sun TH, Tu SJ, Lee WH, et al: miRTarBase
update 2018: A resource for experimentally validated
microRNA-target interactions. Nucleic Acids Res. 46:D296–D302.
2018.PubMed/NCBI View Article : Google Scholar
|
|
19
|
Liu W and Wang X: Prediction of functional
microRNA targets by integrative modeling of microRNA binding and
target expression data. Genome Biol. 20(18)2019.PubMed/NCBI View Article : Google Scholar
|
|
20
|
Garcia DM, Baek D, Shin C, Bell GW,
Grimson A and Bartel DP: Weak seed-pairing stability and high
target-site abundance decrease the proficiency of lsy-6 and other
microRNAs. Natu Struct Mol Biol. 18:1139–1146. 2011.PubMed/NCBI View Article : Google Scholar
|
|
21
|
Shannon P, Markiel A, Ozier O, Baliga NS,
Wang JT, Ramage D, Amin N, Schwikowski B and Ideker T: Cytoscape: A
software environment for integrated models of biomolecular
interaction networks. Genome Res. 13:2498–2504. 2003.PubMed/NCBI View Article : Google Scholar
|
|
22
|
Escandón M, Lamelas L, Roces V,
Guerrero-Sanchez VM, Meijón M and Valledor L: Protein interaction
Networks: Functional and statistical approaches. Methods Mol Biol.
2139:21–56. 2020.PubMed/NCBI View Article : Google Scholar
|
|
23
|
Ge SX, Jung D and Yao R: ShinyGO: A
graphical gene-set enrichment tool for animals and plants.
Bioinformatics. 36:2628–2629. 2020.PubMed/NCBI View Article : Google Scholar
|
|
24
|
Szklarczyk D, Gable AL, Lyon D, Junge A,
Wyder S, Huerta-Cepas J, Simonovic M, Doncheva NT, Morris JH, Bork
P, et al: STRING v11: Protein-protein association networks with
increased coverage, supporting functional discovery in genome-wide
experimental datasets. Nucleic Acids Res. 47:D607–D613.
2019.PubMed/NCBI View Article : Google Scholar
|
|
25
|
Guo J, Zhou X, Cheng L and Gao X:
Construction of a miRNA-mRNA network related to exosomes in
metastatic hepatocellular carcinoma. Heliyon.
9(e15428)2023.PubMed/NCBI View Article : Google Scholar
|
|
26
|
Wei SY, Guo S, Feng B, Ning SW and Du XY:
Identification of miRNA-mRNA network and immune-related gene
signatures in IgA nephropathy by integrated bioinformatics
analysis. BMC Nephrol. 22(392)2021.PubMed/NCBI View Article : Google Scholar
|
|
27
|
Morimatsu M, Yamashita E, Seno S, Sudo T,
Kikuta J, Mizuno H, Okuzaki D, Motooka D and Ishii M: Migration
arrest of chemoresistant leukemia cells mediated by MRTF-SRF
pathway. Inflamm Regen. 40(15)2020.PubMed/NCBI View Article : Google Scholar
|
|
28
|
Li P, Li Y, Dai Y, Wang B, Li L, Jiang B,
Wu P and Xu J: The LncRNA H19/miR-1-3p/CCL2 axis modulates
lipopolysaccharide (LPS) stimulation-induced normal human astrocyte
proliferation and activation. Cytokine. 131(155106)2020.PubMed/NCBI View Article : Google Scholar
|
|
29
|
Zhang H, Zhang Z, Gao L, Qiao Z, Yu M, Yu
B and Yang T: miR-1-3p suppresses proliferation of hepatocellular
carcinoma through targeting SOX9. Onco Targets Ther. 12:2149–2157.
2019.PubMed/NCBI View Article : Google Scholar
|
|
30
|
Yang Y, Yang H, Lian X, Yang S, Shen H, Wu
S, Wang X and Lyu G: Circulating microRNA: Myocardium-derived
prenatal biomarker of ventricular septal defects. Front Genet.
13(899034)2022.PubMed/NCBI View Article : Google Scholar
|
|
31
|
Cowan C, Muraleedharan CK, O'Donnell JJ
III, Singh PK, Lum H, Kumar A and Xu S: MicroRNA-146 inhibits
thrombin-induced NF-κB activation and subsequent inflammatory
responses in human retinal endothelial cells. Invest Ophthalmol Vis
Sci. 55:4944–4951. 2014.PubMed/NCBI View Article : Google Scholar
|
|
32
|
Xu M, Sun J, Yu Y, Pang Q, Lin X, Barakat
M, Lei R and Xu J: TM4SF1 involves in miR-1-3p/miR-214-5p-mediated
inhibition of the migration and proliferation in keloid by
regulating AKT/ERK signaling. Life Sci. 254(117746)2020.PubMed/NCBI View Article : Google Scholar
|
|
33
|
Zhao Y, Tang X, Zhao Y, Yu Y and Liu S:
Diagnostic significance of microRNA-1255b-5p in prostate cancer
patients and its effect on cancer cell function. Bioengineered.
12:11451–11460. 2021.PubMed/NCBI View Article : Google Scholar
|
|
34
|
Li Y, Bai W and Zhang J: MiR-200c-5p
suppresses proliferation and metastasis of human hepatocellular
carcinoma (HCC) via suppressing MAD2L1. Biomed Pharmacother.
92:1038–1044. 2017.PubMed/NCBI View Article : Google Scholar
|
|
35
|
Al-Haidari A, Algaber A, Madhi R, Syk I
and Thorlacius H: MiR-155-5p controls colon cancer cell migration
via post-transcriptional regulation of Human Antigen R (HuR).
Cancer Lett. 421:145–151. 2018.PubMed/NCBI View Article : Google Scholar
|
|
36
|
Zhang Y and Ruan F: LncRNA LEF1-AS1
promotes ovarian cancer development through interacting with
miR-1285-3p. Cancer Manag Res. 12:687–694. 2020.PubMed/NCBI View Article : Google Scholar
|
|
37
|
Wu Q, Zhong H, Jiao L, Wen Y, Zhou Y, Zhou
J, Lu X, Song X and Ying B: MiR-124-3p inhibits the migration and
invasion of Gastric cancer by targeting ITGB3. Pathol Res Pract.
216(152762)2020.PubMed/NCBI View Article : Google Scholar
|
|
38
|
Sathyanarayanan A, Chandrasekaran KS and
Karunagaran D: microRNA-146a inhibits proliferation, migration and
invasion of human cervical and colorectal cancer cells. Biochem
Biophys Res Commun. 480:528–533. 2016.PubMed/NCBI View Article : Google Scholar
|
|
39
|
Liu Q, Wang W, Yang X, Zhao D, Li F and
Wang H: MicroRNA-146a inhibits cell migration and invasion by
targeting RhoA in breast cancer. Oncol Rep. 36:189–196.
2016.PubMed/NCBI View Article : Google Scholar
|
|
40
|
Shibayama Y, Kondo T, Ohya H, Fujisawa S,
Teshima T and Iseki K: Upregulation of microRNA-126-5p is
associated with drug resistance to cytarabine and poor prognosis in
AML patients. Oncol Rep. 33:2176–2182. 2015.PubMed/NCBI View Article : Google Scholar
|
|
41
|
Li Y, Zhu X, Gu J, Hu H, Dong D, Yao J,
Lin C and Fei J: Anti-miR-21 oligonucleotide enhances
chemosensitivity of leukemic HL60 cells to arabinosylcytosine by
inducing apoptosis. Hematology. 15:215–221. 2010.PubMed/NCBI View Article : Google Scholar
|
|
42
|
Liu X, Liao W, Peng H, Luo X, Luo Z, Jiang
H and Xu L: miR-181a promotes G1/S transition and cell
proliferation in pediatric acute myeloid leukemia by targeting ATM.
J Cancer Res Clin Oncol. 142:77–87. 2016.PubMed/NCBI View Article : Google Scholar
|
|
43
|
Duarte D, Amarteifio S, Ang H, Kong IY,
Ruivo N, Pruessner G, Hawkins ED and Lo Celso C: Defining the in
vivo characteristics of acute myeloid leukemia cells behavior by
intravital imaging. Immunol Cell Biol. 97:229–235. 2019.PubMed/NCBI View Article : Google Scholar
|