Introduction
Prostate cancer is one of the most commonly
diagnosed types of cancer in males as well as the second leading
cause of cancer death in males in the United States. Prostate
cancer is a clinically heterogeneous disease that varies in its
biological aggressiveness. Metastatic prostate cancer is incurable,
and the primary treatment consists of androgen deprivation, which
leads to apoptosis of cancer cells and regression of tumors
(1,2). However, response to treatment is
temporary due to the surviving tumor cells that emerge as
androgen-independent. Prostate cancer has long been linked to
obesity and nutrition in incidence and mortality (3,4),
although the role of dietary fatty acids in the etiology or
prevention of this disease has not been fully elucidated yet.
Fatty acids are the primary energy source for
prostate cancer cells and androgens upregulate fatty acid synthase
(FASN), the enzyme responsible for the de novo synthesis of
fatty acids (5). FASN is increased
in prostate adenocarcinoma as compared to normal prostatic tissue
and is a marker of prostate cancer recurrence, poor prognosis and
higher Gleason grade (6). Sterol
response element binding protein-1c (SREBP-1c) is a positive
regulator of FASN expression through binding elements in the FASN
promoter. Diets rich in ω-3 polyunsaturated fatty acids suppress
SREBP-1 mRNA and the active nuclear form of the SREBP-1 protein
(7–10). Consequent downregulation of FASN
has been associated with cell cycle arrest and induction of
apoptosis due to nutrient deprivation in several types of cancer,
including breast and prostate cancer, which rely on the activity of
this enzyme as an energy source (5,11–13).
Androgen ablation and androgen receptor (AR)
antagonism therapy in patients with prostate cancer initially
induces cell cycle arrest and apoptosis (14,15).
However, cancer cells eventually lose dependence on androgens,
leading to progression of the androgen-independent tumors (16). Numerous mechanisms have been
postulated to account for the conversion from the
androgen-dependent to androgen-independent state, including the
aberrant activation of androgen receptor by a variety of growth
factors. Cytokines and chemokines, produced by activated resident
immune cells, are the most important components regulating the
tumor growth micro-environment (17–19).
Many of these signaling molecules are also able to function in an
autocrine manner. Both androgen-dependent and -independent prostate
cancer cells produce high levels of the macrophage chemotactic
protein-1 (MCP-1) compared to normal prostate epithelial cells
(20). MCP-1 acts as an autocrine
growth and pro-metastatic factor in prostate cancer (21,22).
Notably, pro-inflammatory cytokines such as inter-leukin (IL)-1,
IL-6 and tumor necrosis factor (TNF) are able to affect cancer risk
(23–26).
Androgen-independent prostate cancer cells do not
enter apoptosis upon androgen depletion, however, they maintain the
ability to enter the apoptotic pathway (27). An alternative way to modulate
apoptosis is by regulating the expression levels of essential
apoptotic genes. The anti-apoptotic factor B-cell leukemia/lymphoma
2 (Bcl-2) and the tumor suppressor p53 are two such candidate genes
(28). Additionally, activating
transcription factor-3 (ATF-3) is a stress-response gene that is
involved in numerous cell processes, particularly growth regulation
and apoptosis. Wild-type ATF-3 is a transcription factor that
regulates the activation of genes involved in cell growth
regulation (29). Two isoforms of
ATF-3 induce apoptosis through different mechanisms. While the
transcription factor ATF-3 derived from splice variant 1 of the
gene directly elicits transcriptional changes, variant 4 lacks the
leucine zipper region needed to associate with DNA (30). Instead, it induces apoptosis by
suppressing the transcription factor nuclear factor-κB (NF-κB),
which leads to subsequent inhibition of the downstream
anti-apoptotic factors such as Bcl-2 (28,31).
An increase in dietary ω-3 fatty acids has been
linked to good prostate health (3,32)
and prevention of prostate cancer progression to androgen
independence (33). In general,
there is good concurrence that fish oil is beneficial in reducing
the risk of prostate cancer. However, there are several studies
indicating that men with a high dietary intake of ALA have a
>3-fold increase in prostate cancer development (34,35).
The data on the efficacy of individual fatty acids and their
effects on cellular mechanisms are less defined. Therefore, it is
important to understand how individual members of the ω-3 fatty
acids are able to have discordant effects on cancer risk and
prognosis. To better understand the effects of individual fatty
acids and to gain insight into potential mechanisms that may
benefit prostate cancer patients, the prostate cancer cell lines
PC-3 and LNCaP, which represent androgen-independent and -dependent
disease, respectively, were used in this study to determine whether
PUFAs have a suppressive effect on cell proliferation. We found
that, although all the fatty acids decreased the cell viability of
androgen-dependent and -independent cell lines, they were
demonstrated to have different rates of activity. These findings
are significant for dietary recommendations as well as the
potential design and use of supplements in the prevention of
prostate cancer.
Materials and methods
Cell culture
The prostate cell lines PC-3 and LNCaP were obtained
from The University of Texas MD Anderson Cancer Center (Houston,
TX, USA). PC-3 cells were grown in Dulbecco’s modified Eagle’s
medium/Ham’s F-12 medium (DMEM/F-12; Sigma, St. Louis, MO, USA)
supplemented with 10% fetal bovine serum (FBS) (Hyclone
Laboratories, Logan, UT), 100 units of penicillin and 100
μg/ml of streptomycin (Invitrogen, Carlsbad, CA, USA). LNCaP
cells were grown in RPMI medium supplemented with 10% FBS, 100
units of penicillin and 100 μg/ml of streptomycin.
Fatty acid-albumin conjugates
The fatty acids were conjugated to fatty acid-free
bovine serum albumin (BSA). This was accomplished following
established protocols maintaining a molar ratio of 4:1 (fatty
acid:BSA). Fatty acid conjugates were stored under argon at
−20°C.
Prostate tissue
Prostatectomy samples were obtained from untreated
patients. Samples were flash-frozen and stored at −80°C. Nine
sections were obtained, each 10-μm thick, and placed on
slides. One section was hematoxylin and eosin (H&E)-stained to
confirm pathology (either normal prostate or Gleason grade 4 and
5). The remaining eight sections were examined under light
microscopy and compared to H&E staining. Tumor, which was
present in >80% of the tissue, was macrodissected away from the
remaining fibrous tissue and pooled for RNA isolation.
Paraffin-embedded samples from the same prostatectomy samples were
sectioned in 5-μm sections placed on charged slides for
immunohistochemistry for FASN and SREBP-1.
In vitro proliferation assay
PC-3 (1,000 cells/well) and LNCaP (2,500 cells/well)
cells were seeded in white, 96-well culture plates (Greiner Bio
One, Frickenhausen, Germany) in the appropriate medium. The
following day, the cell media were changed to the appropriate
medium supplemented with 0.1% FBS. The following day, the media
were removed and fresh media containing 1% FBS and 100
μM-conjugated fatty acid/BSA conjugate was added (n≥4). Cell
viability or growth was measured using the
CellTiter-Glo® Luminescent Cell Viability assay
(Promega, Madison, WI, USA).
RNA analysis
Cells were lysed in Tri-reagent (Sigma, St. Louis,
MO, USA) and total RNA was extracted following the manufacturer’s
protocol. For normal prostate tissue (NPT) and prostate cancer
tissue (PCT), samples were snap-frozen in liquid nitrogen and
frozen tissue was stored at −80°C. NPT samples were homogenized in
Tri-reagent and total RNA was extracted. Frozen PCT samples were
cut into 20-μm sections and mounted on glass slides. A
random slide from the dissected tissue was stained with hematoxylin
for histological examination. Slides containing ≥80% tumor were
analyzed. Tissue from the adjacent 10 slides was scraped into
Tri-reagent and total RNA was isolated. One microgram of total RNA
from each slide was reverse transcribed using the High Capacity
cDNA Archive kit (Applied Biosystems, Foster City, CA, USA). cDNA
was diluted and real-time PCR was conducted with an ABI 7300
thermal cycler using SYBR-Green PCR Master mix (Applied
Biosystems). All the mRNA expression data were corrected using
RPL13α expression for normalization prior to graphing and
analysis.
The primer sequences used in this study were: ATF3:
F, TCACTGTCAGCGACAGACCC and R, CTACCTCGGCTTTTGTGATGG; Bcl-2: F,
GCATGCGGCCTCTGTTTGATTTCT and R, AGGCATGTTGACTTCACTTGTGGC; Bcl-6: F,
AAGACCGTCCATACCGGTGAGAAA and R, GCAGGTTTCGCATTTGTAGGGCTT; Cox-2: F,
AAGTGCGATTGTACCCGGAC and R, CGGTGTTGAGCAGTTTTCTCC; cyclin A2: F,
GCATGTCACCG TTCCTCCTT and R, GTGAACGCAGGCTGTTTACTGT; cyclin D1: F,
AACCTGAGGAGCCCCAACA and R, GAA GCGTGTGAGGCGGTAGTA; cyclin D2: F,
TGTCTCAAAGCTTGCCAGGA and R, CAGGCTATTGAGGAGCACCG; FASN: F,
AGGAGCAAGGCGTGACCTT, and R, ACAACGAGCGGATGAGCTG; IL-1β: F,
CACGGCCACATTTGGTTCTAA and R, CAGAATGTGGGAGCGAATGAC; IL-6: F,
GCCACTCACCTCTTCAGAACG and R, CCGTCGAGGATGTACCGAATT; IL-10: F,
GGGAGCCCCTTTGATGATTAA and R, GGGAATCCCTCCGAGACACT; MCP-1: F,
ATAGCAGCCACCTTCATTCC and R, TGCACTGAGATCTTCCTATTGG; NF-κB: F,
AGGCTATGCAGCTTGCAAAGAG and R, TGTCACCGCGTAGTCGAAAAG; p21: F,
GCAGAGGAAGACCATGTGGAC and R, GCGAGGCACAAGGGTACAAG; p57: F,
CGGCGATCAAGAAGCTGTC and R, GCTTGGCGAAGAAATCGGA; RPL13α: F,
CATCGTGGCTAAACAGGTACTG and R, GCACGACCTTGAGGGCAGCC; SREBP-1c: F,
CCATCTGTGAGAAGGCCAGTG and R, GGTGTGGTAGCCAGGCTGTC; TNFα: F,
ATCAATCGGCCCGACTATCTC and R, TGGATGTTCGTCCTCCTCACA; TGF-β1: F,
CTATTGCTTCAGCTCCACGGA and R, AGGTCCTTGCGGAAGTCAATG.
Immunohistochemistry of prostatectomy
samples
Paraffin-embedded tumor tissues were sectioned
5-μm thick and mounted on positively charged gold plus
microscope slides. Tissue slides were pre-heated at 60°C for 16 h
and dewaxed by immersion in xylene and then in successively diluted
solutions of ethanol. Antigen retrieval was achieved by heating the
slides at 70°C for 4 h, immersed in Borg Decloaker solution
(BioCare Medical, Concord, CA, USA). Endogenous peroxidase activity
was blocked by incubating in 3% H2O2 in
phosphate-buffered saline (PBS) for 12 min. After rinsing with PBS
three times for 3 min each, non-specific tissue binding was blocked
for 1 h in protein block solution (Cyto Q Immuno Diluent buffer;
Innovex Biosciences, Richmond, CA, USA). The primary antibody was
diluted in protein block solution and incubated overnight at 4°C.
Dilutions of primary antibodies were as follows: Fatty Acid
Synthase antibody (dilution, 1:800; cat. no. NB400-114) (Novus
Biologicals, Littleton, CO, USA), and SREBP-1 antibody (dilution,
1:800; cat. no. NB100-2215) (Novus Biologicals). Slides were washed
with PBS three times for 3 min each followed by Mach 4™ Universal
HRP polymer (BioCare Medical) application for 20 min as a secondary
antibody. Staining was visualized by incubation in
3,3′-diaminobenzidine (DAB) and counterstained with Gill’s no. 3
hematoxylin. Internal negative control samples were exposed to
protein block solution instead of the primary antibodies and
demonstrated no specific signaling. Slides were dried and mounted
with Universal Mount solution (Research Genetics, Invitrogen,
Carlsbad, CA, USA). Slides were viewed using a Leica DM100
microscope with Leica objectives HCX PL Fluotar 10×/0.30 and HCX PL
Fluotar 20×/0.50 with an Applied Scientific Imaging MS-2000
motorized, XY encoded stage. Images were captured with a Qimaging
camera and QCapture 2.90.1 imaging software.
Annexin staining
PC3 cells were plated at 300,000 cells/ plate in
60-mm dishes and were serum-starved overnight prior to treatment
with fatty acids. Following 24, 48, and 72 h of fatty acid
treatment, growth medium was removed from each culture dish and
transferred to conical tubes. The cells were removed from plates by
scraping, pooled with media from the corresponding plate, and
pelleted using centrifugation. The resulting pellet was stained
with Annexin CF 488 using the components from a MitoDamage kit
obtained from EDM Millipore (Billerica, MA, USA). The
manufacturer’s instructions were followed, with the exception of
omitting steps for staining with MitoSense Red Dye. 7-AAD DNA
intercalating dye was added to identify dead cells, which stained
positive for 7-AAD only, and cells in late apoptosis, which stained
positive for both 7-AAD and Annexin V. Stained samples were
analyzed using the Beckman Coulter Cytomics FC, with only the blue
laser turned on. Results are the mean of three independent
experiments.
Statistical analysis
Data were presented as the mean of replicates with
error bars representing population standard error of the mean
(SEM). Statistical significance was determined with all the groups
using one-way ANOVA and the paired Student’s t-test. P<0.05 was
considered to indicate a statistically significant difference.
Results
ω-3 FAs inhibits androgen-dependent and
-independent prostate cancer cell growth
To determine whether all ω-3 fatty acids suppressed
proliferation to a similar extent, we investigated the effect of
individual fatty acids, (ALA, DHA and EPA) on the growth of
prostate cancer cell lines PC-3 and LNCaP. Proliferation was
measured using the CellTiter-Glo® Luminescent Cell
Viability assay, and results were validated with BrdU staining
(data not shown) to ensure that CellTiter-Glo® results
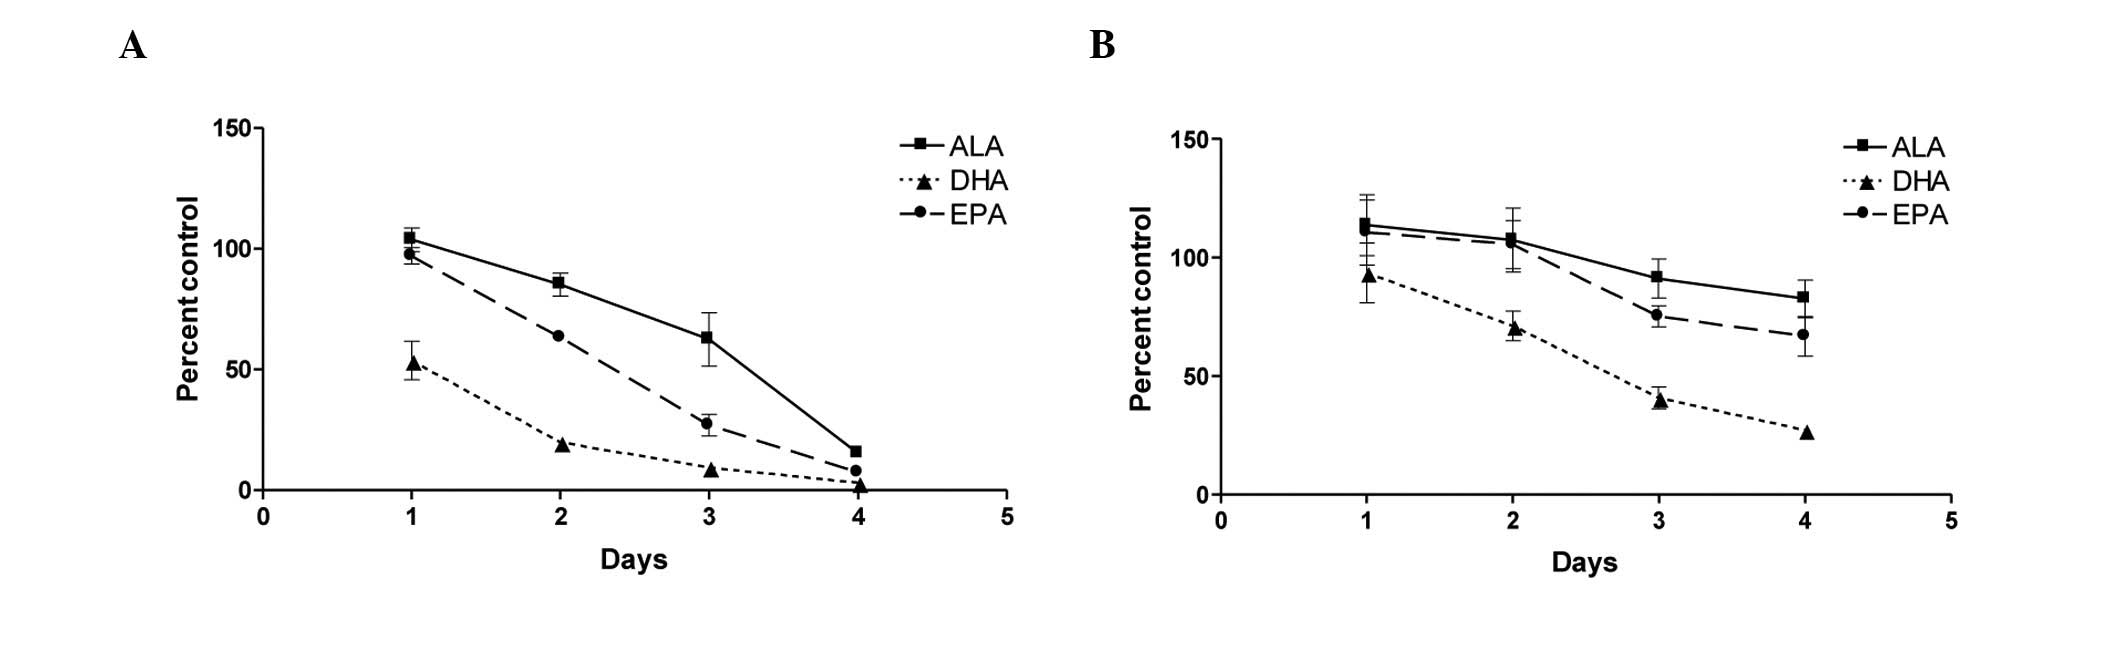
were representative of cell proliferation. Androgen-independent
PC-3 cells treated with 100 μM ω-3 fatty acids showed a
marked decrease in proliferation and survival over a 4-day time
course experiment (Fig. 1A). While
all the fatty acids caused a decrease in the cell number, the fatty
acids worked at different rates, resulting in different overall
inhibition patterns. DHA was the most rapid and most effective
fatty acid in inhibiting cell viability, followed closely by EPA.
ALA was the least active of the ω-3 fatty acids examined at
inhibiting cell growth.
The androgen-dependent LNCaP cells exhibited a
similar, albeit less pronounced, trend of inhibition of
proliferation over the same time period (Fig. 1B). The differences in inhibition
are attributed to the slower rate of cell cycle/division of LNCaP
cells. Since the inhibitory trends were more pronounced in the more
rapidly dividing PC-3 cells, cell cycle arrest, gene analysis and
apoptosis experiments were conducted on this cell line.
Transcriptional modulation of cell cycle
regulation and apoptotic genes
To elucidate the possible mechanism(s) for the
differences between DHA and EPA compared to ALA, the transcript
levels of several genes involved in cell cycle regulation and
apoptosis were investigated to determine the effects of treatment
with ω-3 fatty acids (Table I).
Cell cycle gene mRNAs including cyclins A2, D1 and D2, CDK4, p21
(CDKN1A) and p57 (CDKN1C) were examined after a 24-h treatment with
ω-3 fatty acids. None of the fatty acids had a significant effect
on cyclin D1 or CDK4 transcript levels. A slight, albeit
statistically significant increase was identified in cyclin D2 and
p57 transcript following treatment with DHA, although not with ALA
or EPA. All the fatty acids had an effect on cyclin A2 mRNA; ALA
slightly increased cyclin A2 expression while both DHA and EPA
decreased its transcript levels. Expression of p21, a
cyclin-dependent kinase inhibitor, was significantly increased by
treatment with DHA and EPA, but not with ALA.
 | Table IGene regulation by ω-3 fatty
acids. |
Table I
Gene regulation by ω-3 fatty
acids.
| Cellular
process | Gene | ALA | DHA | EPA |
|---|
| Apoptosis | | | | |
| ATF-3 | 1.23±0.11 |
11.14±1.95a | 2.82±0.29 |
| Bcl-2 | 0.73±0.10 | 0.58±0.13 |
0.33±0.06b |
| Bcl-6 | 0.86±0.09 |
1.82±0.14a | 1.04±0.05 |
| NF-κB | 0.79±0.10 | 0.70±0.17 | 0.63±0.08 |
| Cell cycle | | | | |
| Cyclin A2 |
1.35±0.04a |
0.20±0.02a |
0.18±0.02a |
| Cyclin D1 | 0.86±0.08 | 0.87±0.18 | 0.98±0.10 |
| Cyclin D2 | 1.07±0.36 |
2.55±0.42b | 1.33±0.49 |
| CDK4 | 1.04±0.06 | 0.72±0.09 | 0.76±0.04 |
| p21 | 1.26±0.12 |
5.02±0.83a |
2.79±0.35b |
| p57 | 0.92±0.12 |
1.84±0.27b | 1.02±0.13 |
| Inflammation | | | | |
| Cox-2 | 0.95±0.10 |
5.94±1.54b | 3.02±0.38 |
| IL-1β | 1.63±0.25 | 2.58±0.87 |
2.91±0.29b |
| IL-6 | 1.44±0.24 |
13.66±1.33a |
14.16±1.44a |
| IL-8 | 0.99±0.16 | 1.43±0.08 | 1.47±0.25 |
| IL-10 | 0.75±0.09 |
5.29±0.98b | 1.94±0.32 |
| MCP-1 |
0.43±0.04a |
0.04±0.01a |
0.21±0.02a |
| TGF-β1 | 0.83±0.05 | 0.65±0.06 | 0.93±0.24 |
| TNF-α | 0.44±0.09 | 0.88±0.28 | 0.60±0.11 |
| Metabolism | | | | |
| FASN |
0.44±0.06a |
0.29±0.017a |
0.49±0.06a |
| LDLR | 0.67±0.12 | 1.27±0.56 | 0.86±0.18 |
| SREBP-1 |
0.45±0.09b |
0.46±0.22b |
0.53±0.30b |
| SREBP-2 | 0.88±0.28 | 1.40±0.46 | 1.30±0.37 |
Growth inhibition of prostate cancer cell lines by
ω-3 fatty acids may also be the result of apoptotic induction.
ATF-3, Bcl-2, Bcl-6 and NF-κB mRNA expression levels were examined
24 h after treatment with ω-3 fatty acids (Table I). The greatest change in gene
expression was observed in DHA-treated cells, which caused a
statistically significant increase in ATF-3 mRNA. EPA had a
significant 5-fold induction of ATF-3 expression, which peaked at
12 h (data not shown). DHA-treated cells were also demonstrated to
have a modest, albeit significant increase in Bcl-6 gene expression
with no significant effect on Bcl-2 gene expression. All the fatty
acids decreased Bcl-2 transcript levels, although only EPA
treatment resulted in a statistically significant decrease. None of
the fatty acids significantly altered NF-κB mRNA expression
(Table I). Additionally, NF-κB
activity was not altered by treatment with the three fatty acids,
which was proven using a NF-κB reporter assay (data not shown).
Fish oil ω-3 fatty acids induce
apoptosis
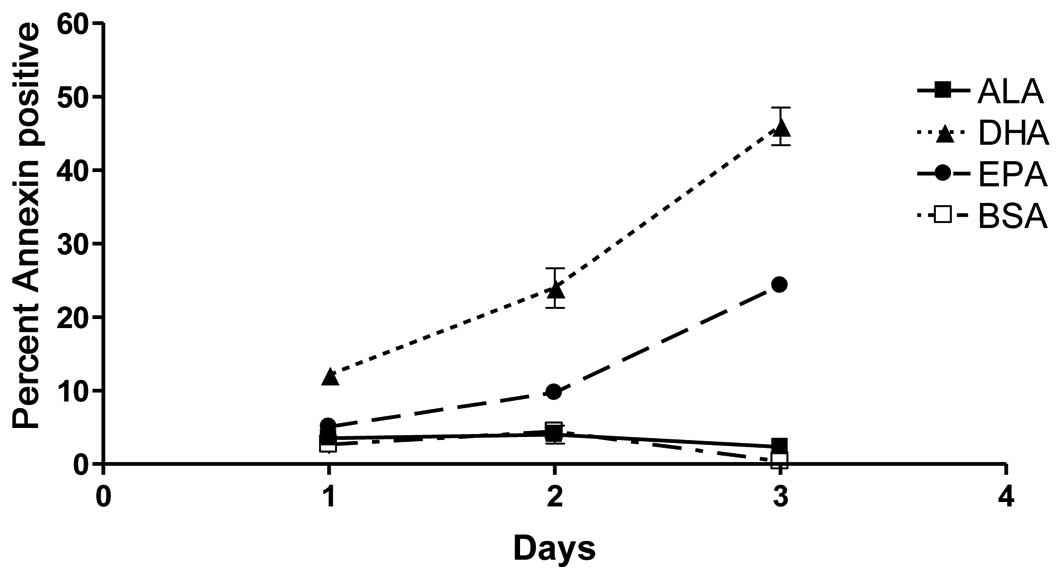
Adherent PC-3 cells were pooled with dead cells from
the supernatant in each dish for staining and flow cytometric
analysis was performed. Throughout the 3 days, DHA-treated cells
exhibited the highest rates of apoptosis, as demonstrated by
positive staining with Annexin V. Prostate cancer cells treated
with EPA showed intermediate rates of apoptosis throughout the time
course, while ALA-treated cells exhibited no apoptosis above
baseline levels (Fig. 2).
Subsequent comparison of results from flow cytometric and
proliferation analyses demonstrated that the rates of apoptosis and
death for each fatty acid complemented the live cell counts
(Table II). Based on these
comparisons, apoptosis was determined to be the primary mechanism
of proliferation inhibition in DHA-treated samples. Although ALA
did not induce cells to undergo apoptosis, cell death was induced.
Data collected on day 3 of ALA treatment showed that, while
apoptosis in ALA-treated cells never exceeded baseline rates, the
percentage of dead cells was significantly elevated compared to
vehicle control-treated samples. Similarly, while apoptosis was
observed in EPA-treated cells, the percentages of dead cells
exceeded the percentage of apoptotic cells throughout the
experiment, indicating that all deaths following EPA treatment
cannot be attributed to apoptosis (Table II). Subsequently, we examined
additional mechanisms that are potentially be responsible for PC-3
growth inhibition by ω-3 fatty acids.
| Table IICell apoptosis induced by ω-3 fatty
acids. |
Table II
Cell apoptosis induced by ω-3 fatty
acids.
| Day | Treatment |
CellTiter-Glo® (% control
cells) | Flow cytometry
|
|---|
| % live cells | % apoptotic
cells |
|---|
| 1 | BSA | 100.00±11.43 | 91.8±1.2 | 2.63±1.01 |
| ALA | 103.75±14.25 | 85.24±1.93 | 3.50±0.82 |
| DHA |
53.67±24.08a |
74.22±0.67b |
12.10±0.89b |
| EPA | 97.02±10.32 |
76.12±1.87b | 5.06±1.34 |
| 2 | BSA | 100.00±24.71 | 87.16±1.95 | 4.42±1.97 |
| ALA | 85.06±14.25 | 85.15±3.50 | 4.01±2.13 |
| DHA |
19.86±5.40a |
60.34±4.68b |
23.94±4.63b |
| EPA |
63.17±4.08a |
70.4±1.85b | 9.68±1.60 |
| 3 | BSA | 100.00±26.77 | 92.44±0.38 | 0.36±0.13 |
| ALA |
62.48±33.17b | 78.62±2.59 | 2.31±0.37 |
| DHA |
9.35±7.80a |
28.43±3.34b |
45.94±4.46b |
| EPA |
26.85±13.46a |
35.75±3.39b |
24.29±1.65b |
Transcriptional modulation of
inflammatory genes
Elevated expression levels of pro-inflammatory
cytokines are associated with poor prognosis in many tumor types
including prostate cancer. Transcript levels of Cox-2, IL-1β, IL-6,
IL-8, IL-10, MCP-1, TGF-β1 and TNF-α were examined following a 24-h
treatment with 100 μM fatty acids (Table I). None of the fatty acids had a
significant effect on IL-8, TGF-β1 or TNF-α. IL-1β transcript
levels increased slightly following EPA treatment. All of the fatty
acids significantly lowered the expression of MCP-1 in a pattern
similar to growth inhibition. In gene expression and proliferation
assays, DHA was the most effective, followed by EPA and then ALA.
Only DHA significantly increased the mRNA levels of the
pro-inflammatory gene Cox-2 and the anti-inflammatory gene IL-10.
Notably, DHA and EPA treatment increased IL-6 trascript levels.
ω-3 fatty acids regulate metabolizing
genes
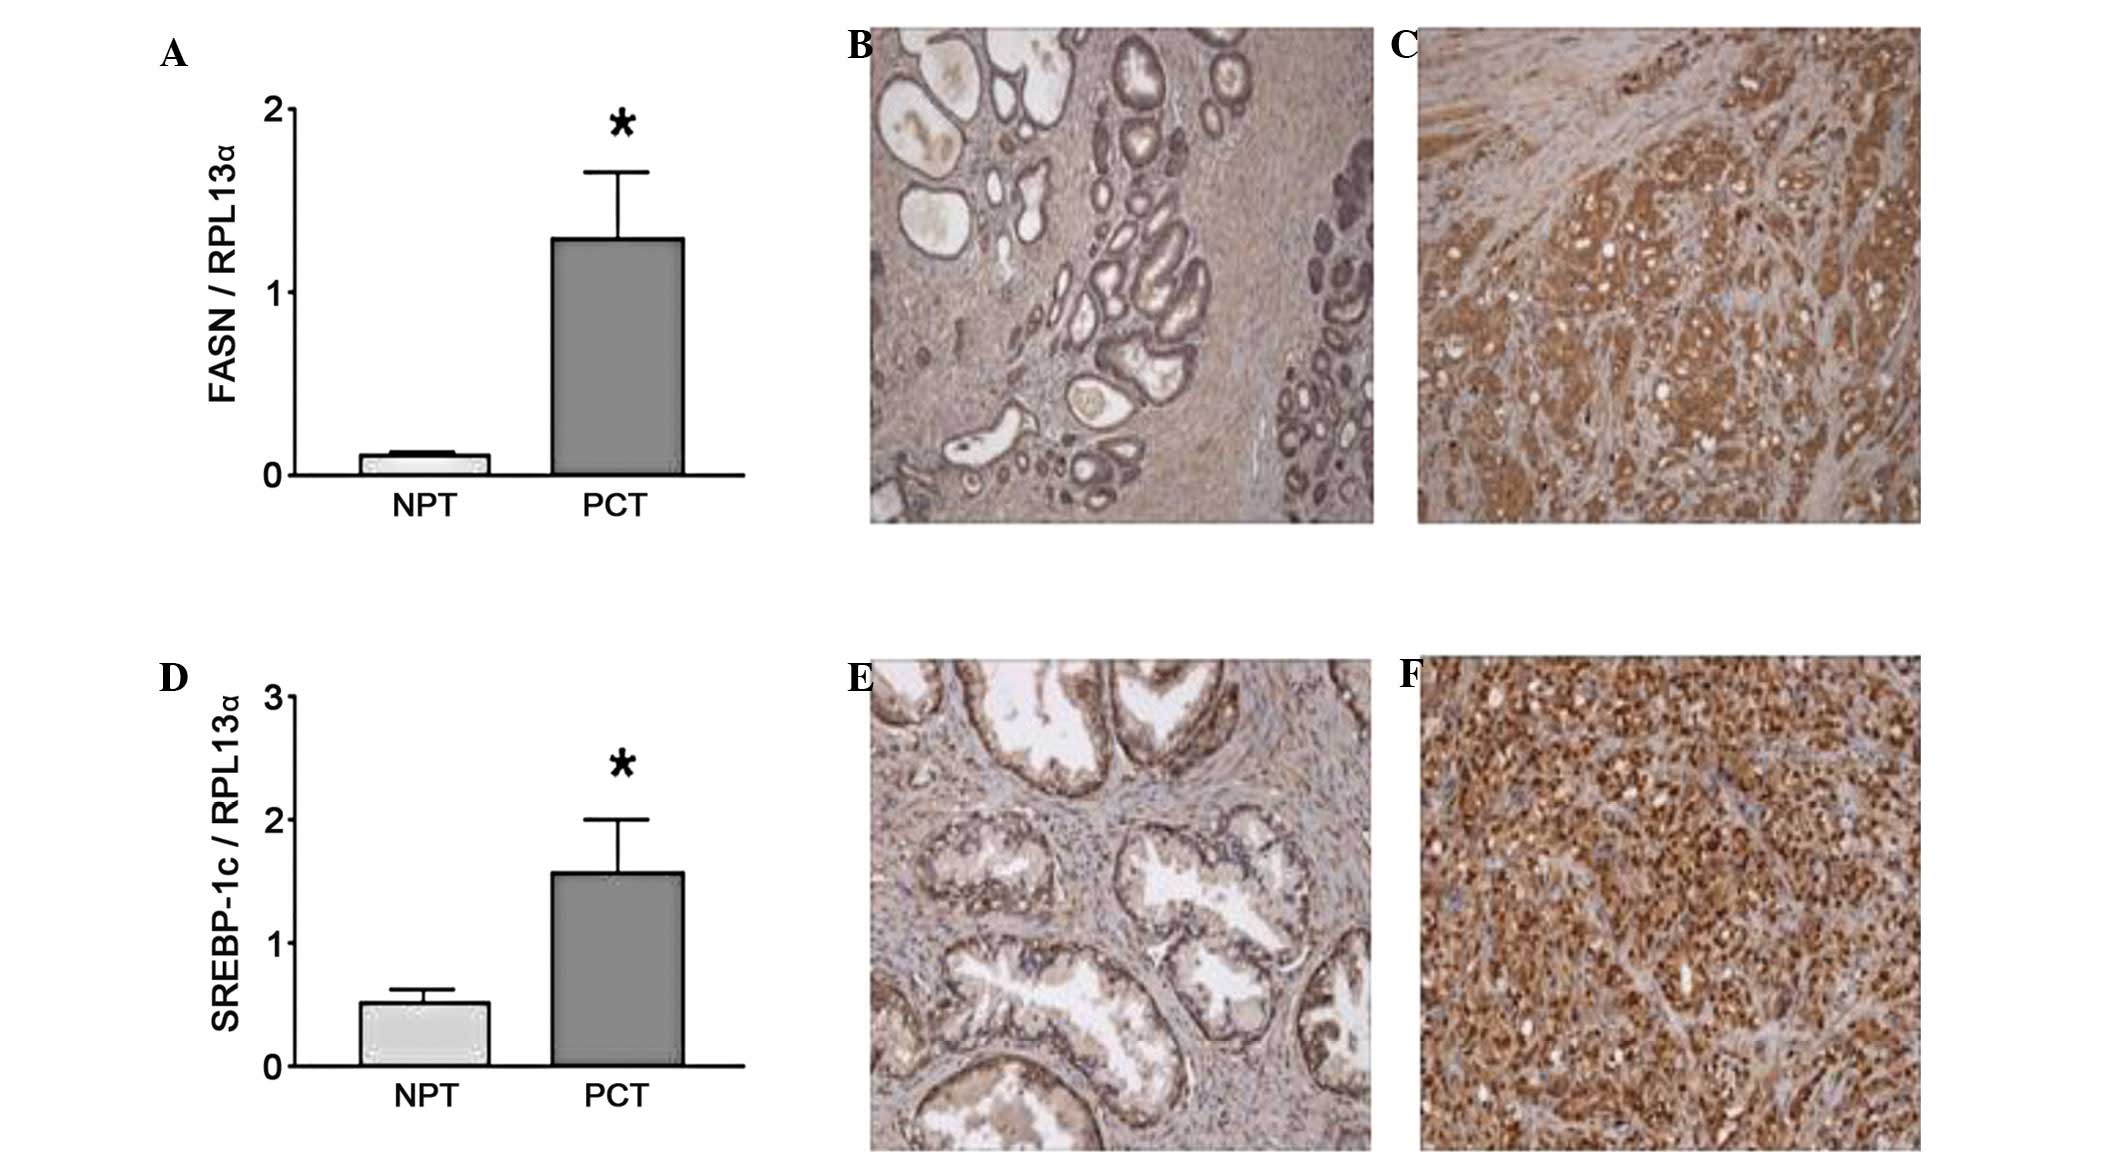
FASN has been suggested to be a prostate cancer
oncogene (36). FASN RNA
transcript and the protein have been shown to be increased in
prostate cancer Gleason grade 4 and 5 tumor samples compared to
normal prostate tissue (37), as
shown in Fig. 3A by real-time PCR
and confirmed by immunohistochemistry (IHC) (Fig. 3B vs. C). FASN mRNA expression was
decreased by 50% in PC-3 cells following treatment with ω-3 fatty
acids (Table I) with no
significant difference between fatty acid treatments. FASN is
regulated by the sterol response element binding protein-1c
(SREBP-1c), which is also increased in tumor samples (Fig. 3D). In addition, IHC results
demonstrated a translocation of SREBP-1 to the nucleus in prostate
cancer tumor cells (Fig. 3F)
compared to normal prostate tissue (Fig. 3E) where SREBP-1 was predominantly
located in the cytoplasm. SREBP-1c mRNA was decreased to a
comparable extent by all ω-3 fatty acid treatments (Table I). The expression of caveolin-1
(Cav-1), a gene negatively regulated by SREBP-1c, was examined to
validate the downstream effects of SREBP-1c. As expected, the RNA
expression pattern of Cav-1 inversely followed the pattern of
SREBP-1c levels in both prostate cancer and control cell lines
(data not shown). None of the fatty acid treatments had any effect
on Low Density Lipoprotein Receptor (LDLR) or SREBP-2.
FASN inhibition suppresses PC-3
proliferation in a similar pattern to ALA
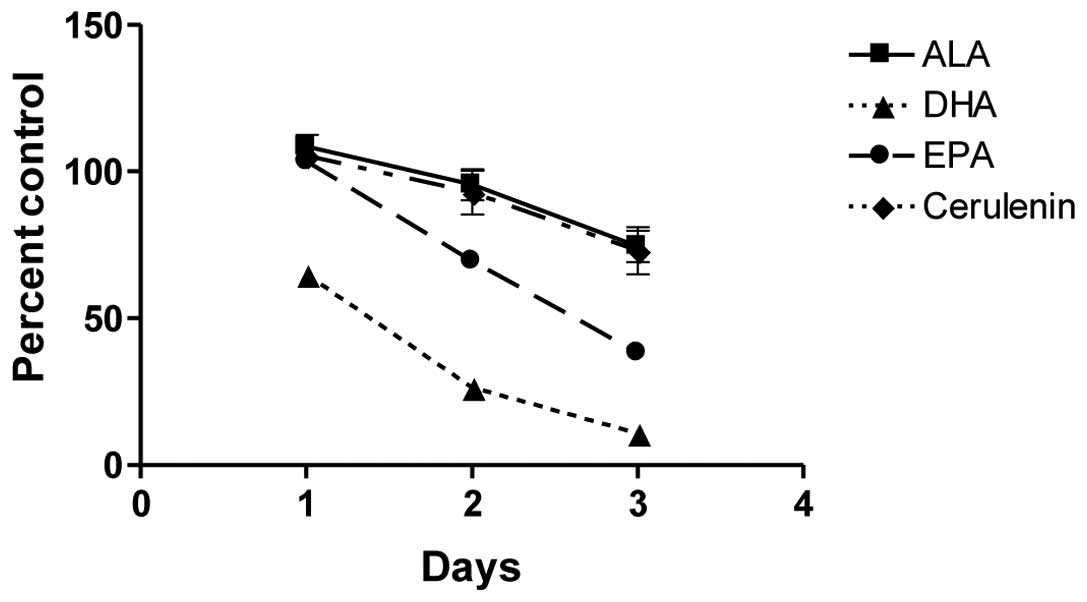
Chemical and siRNA inhibition of FASN leads to
slower proliferation and ultimately apoptosis in prostate cancer
cells (36). Since all the ω-3
fatty acids inhibited FASN gene transcription to a similar extent,
we examined whether this repression resulted in growth inhibition
of cells similar to the chemical repression of FASN. Cerulenin, a
chemical inhibitor of fatty acid synthase, was used as a positive
control. Dose-response data indicated that cerulenin inhibited PC-3
cell growth with an EC50 of 2.5 μM (data not
shown). The effect of cerulenin at 2 μM was compared to the
effect of the ω-3 fatty acid treatments (100 μM) on PC-3
cell growth (Fig. 4). DHA and EPA
inhibited growth more rapidly and to a greater extent compared to
either cerulenin or ALA, which showed an identical extent of growth
suppression.
Discussion
The treatment of androgen-independent (PC-3) and
-dependent (LNCaP) prostate cancer cell lines with individual ω-3
fatty acids at 100 μM inhibited cell growth in a
time-dependent manner. This concentration was selected since
several previous studies have demonstrated that basal level in
subjects fed balanced diets yielded plasma concentrations for DHA
>80 μM and EPA in the range of 25–30 μM (38–40).
Furthermore, supplementation with fish oil increased DHA and EPA to
serum concentrations >125 μM (38). For consistency reasons, ALA was
examined at the same concentration even though most studies
indicate that basal levels are lower compared to those for DHA and
EPA with ranges from 7 to 25 μM (39–41)
and supplementation levels only reaching 35 μM (40).
All the ω-3 fatty acids effectively inhibited the
proliferation of PC-3 and LNCaP prostate cancer cells. The
androgen-dependent LNCaP cell line demonstrated a delay in response
that may be attributed to the slower cell division observed in this
cell line as compared to PC-3 cells. Based on the fact that DHA
leads to a more rapid and extensive effect on cell proliferation
and gene expression, there appear to be different mechanisms of
inhibition by the ω-3 PUFAs. DHA was the most efficient and potent
inhibitor of PC-3 proliferation, followed by EPA and then ALA. The
observation that ALA was the least toxic of the fatty acids
examined indicates that, although the 100 μM concentration
has not been reported in vivo, overt toxicity with this
molecule in the cell model used in this study is unlikely. To
examine whether the differences observed in the viability assay
were a result of mechanistic differences, we investigated the
pathways involved in fatty acid metabolism, cell cycle regulation,
and apoptosis.
All the ω-3 PUFAs examined modulated fatty acid
synthesis by decreasing the accumulation of SREBP-1c mRNA.
Moreover, additional studies have shown that ω-3 fatty acids
inhibit the cleavage of inactive to active SREBP-1c (10). In prostate cancer tissue, the
majority of SREBP-1 staining is nuclear compared to cytosolic in
the normal prostate tissue indicating the activation of SREBP-1.
The inhibition of SREBP-1c, a major regulator of FASN, leads to
accumulation of cholesteryl esters within the cell, resulting in
cell cycle arrest (42). Since
fatty acid metabolism is an important source of energy for prostate
cancer cells, the inhibition of SREBP-1c and its target gene FASN
is likely to have contributed to the decrease in PC-3 and LNCaP
cell viability observed in this study following treatment with the
ω-3 fatty acids. The low density lipoprotein receptor pathway is
important in providing cells with essential fatty acids, especially
those for prostaglandin synthesis. None of the ω-3 fatty acids used
in this study altered the transcription of LDLR or SREBP-2, a
potent regulator of the LDLR promoter, indicating that this pathway
was not involved in the observed inhibition. While all the ω-3
fatty acids examined resulted in equal inhibition of SREBP-1c and
FASN (∼50% reduction), they exhibited different efficiencies in the
inhibition of proliferation. This suggested that alternative
apoptotic or anti-proliferative mechanisms needed to be invoked to
cause the more substantial inhibitory trends observed following DHA
and EPA treatment of PC-3 and LNCaP cells.
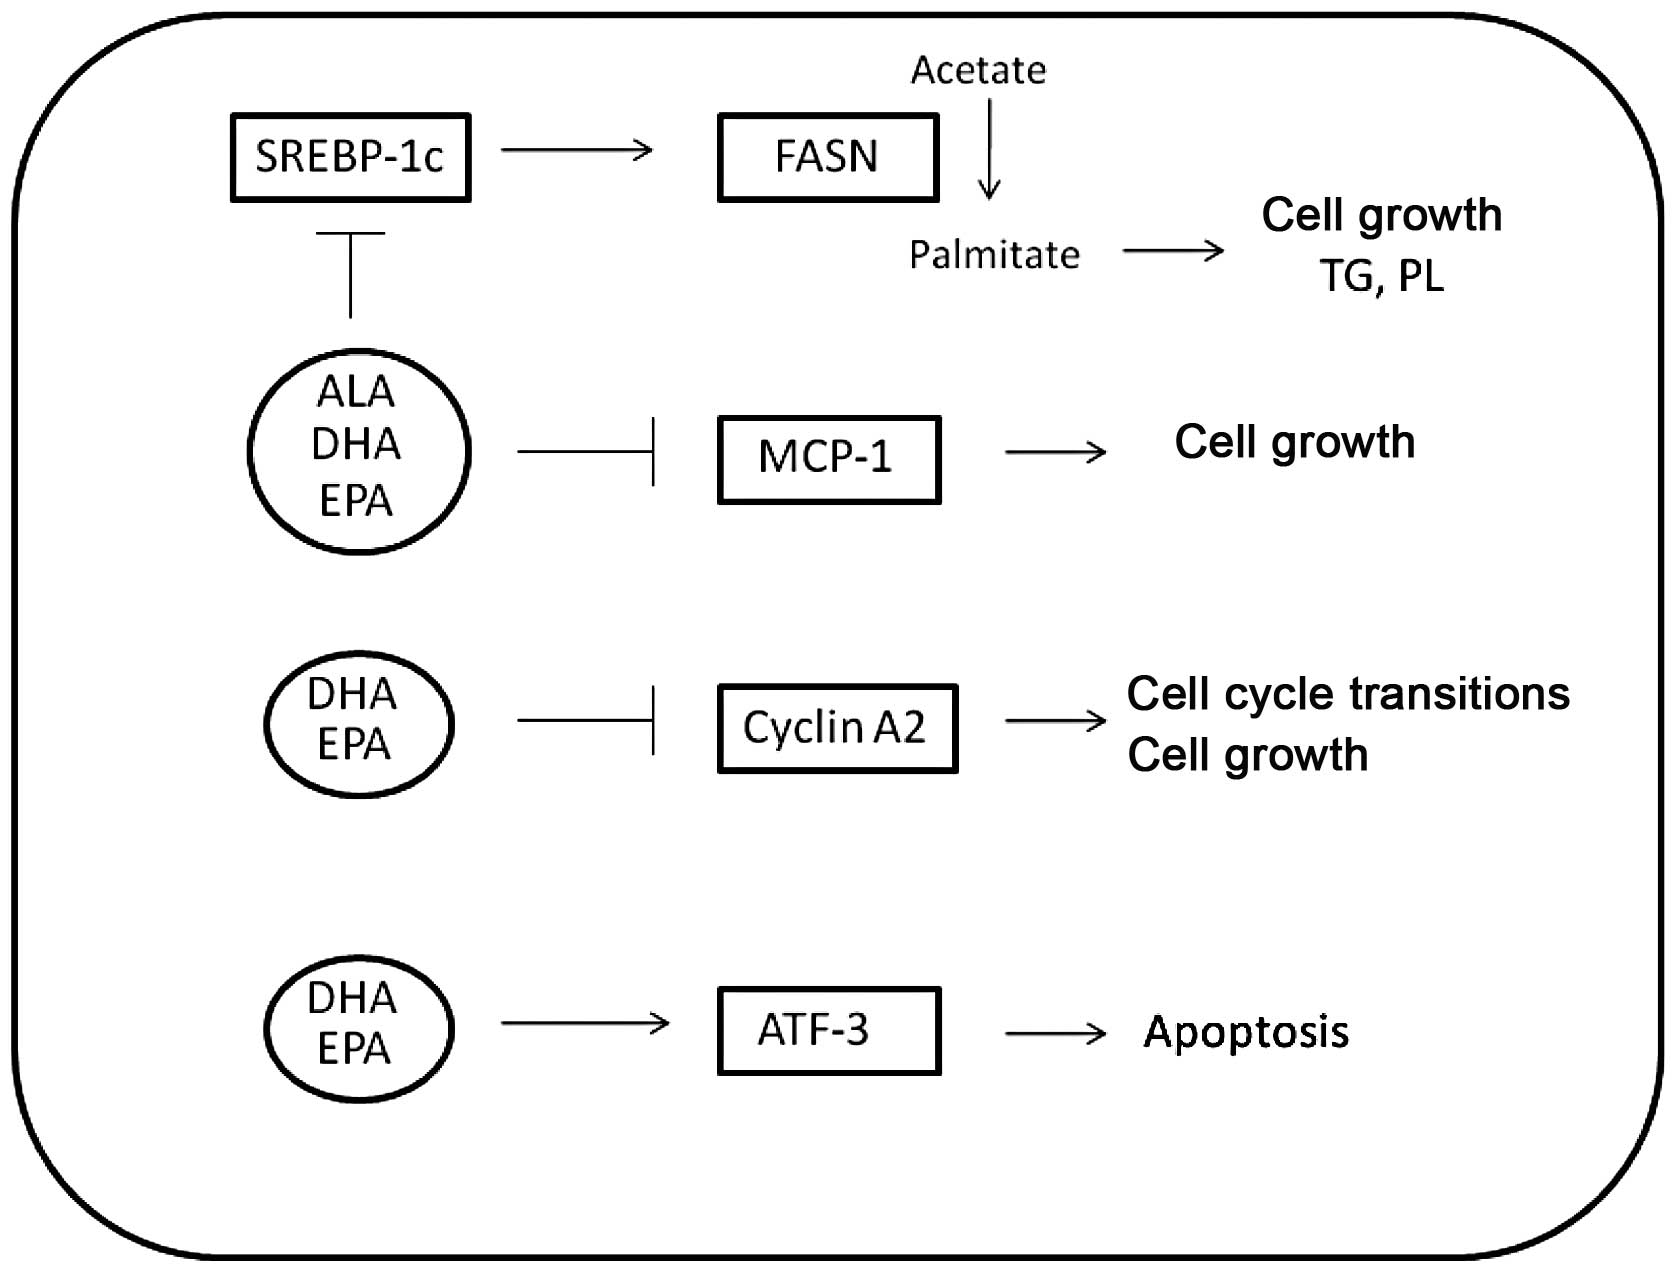
Differences in PC-3 proliferation and cell viability
over time may be attributed to the differential regulation by the
ω-3 fatty acids of several target genes involved in cell cycle,
inflammation and apoptosis (Fig.
5). Of particular importance to the androgen-independent
prostate cancer model studied was the inhibition of MCP-1 by all
the ω-3 fatty acids used, with DHA and EPA exhibiting inhibition of
∼95 and 80% decrease compared to control, respectively.
Specifically, the pattern of MCP-1 mRNA inhibition mimics the
pattern of growth inhibition. MCP-1 not only acts as an autocrine
growth factor for prostate cancer, but it is also involved in the
hypoxic response and angiogenesis of primary tumors (22). In prostate cancer that has
metastasized to bone, MCP-1 is involved in the paracrine modulation
of osteoblast and osteoclast activity, leading to
osteoclastogenesis and alteration of the bone matrix (20). Differential modulation of MCP-1 in
prostate cancer cells results in growth inhibition and decrease of
metastatic ability as well as success of androgen-independent
prostate cancer.
Considering the known role of ω-3 fatty acids as
anti-inflammatory substances, the 13-fold induction of IL-6 in DHA-
and EPA-treated samples and the >3-fold induction of COX-2
constituted contradictory findings. Since the chronic expression of
IL-6 and Cox-2 has been correlated with the development and
progression of prostate cancer and multi-drug resistance (19,24,26),
a decreased expression of these genes following fish oil treatment
was expected. Although IL-6 is induced at the early 24-h time
point, in DHA- and EPA-treated PC-3 cells, its expression rapidly
decreased to half the original induction at 48 h (data not shown).
Therefore, induction of IL-6 by these ω-3 fatty acids does not
appear to cause the chronic inflammatory response that promotes
carcinogenesis and growth. Both genes could be regulated by NF-κB.
However, there were no alterations in the transcript levels for
this transcription factor. In addition, none of the fatty acids
increased NF-κB activity as determined by an NF-κB reporter assay.
The involvement of NF-κB in sensitizing prostate cells to growth
arrest by DHA has been previously reported (43). However, the cell models used in
various studies differ and the lack of NF-κB reporter activity in
PC-3 cells suggests that NF-κB is not involved in the induction of
IL-6 and Cox-2 expression in DHA- and EPA-treated cells.
DHA also increased the expression of genes involved
in induction of apoptosis to a greater extent compared to the other
fatty acid treatments. The induction of apoptosis is confirmed by
the annexin staining of PC-3 cells treated with DHA and EPA. DHA
induced annexin staining earlier and to a greater extent compared
to EPA, while ALA-treated cells showed no staining above
background. In a comparison analysis, cell growth was inhibited by
all the fatty acids as measured by CellTiter-Glo® assay
and flow cytometry. The differences in the extent of inhibition
presented in Table II could be a
result of the end point measurement. Flow cytometry measured live
or dead cells based on membrane integrity (dye uptake), while the
CellTiter-Glo® assay measured the amount of ATP present.
The ATP value would decrease prior to loss of membrane integrity.
Furthermore, although there appear to be differences in statistical
significance at certain time points between the two assays, as
shown by ANOVA tests for each assay, most viability values attained
are comparable, and may be statistically equivalent (unpaired
Student’s t-tests show viability measurements following 72 h of
ALA, and EPA treatment according to CellTiter-Glo® and
flow cytometry are statistically equivalent). Both fish oils
induced apoptosis in PC-3 cells. ATF-3 is the most modulated
pro-apoptotic gene identified. It has been reported that the
transfection of PC-3 cells with an ATF-3 expression construct
resulted in apoptosis (31).
Additionally, the activation of KLF-6, which activates ATF-3 in
PC-3 and LNCaP cells, resulted in apoptotic death of the cells due
to the induced apoptosis by inhibiting NF-κB activity. While our
data demonstrate that NF-κB pathways are not involved, these
results clearly indicate that DHA activates an ATF-3-dependent
apoptotic pathway in androgen-independent prostate cancer
cells.
DHA consistently inhibited gene expression of cell
cycle promoting genes and affected genes involved in the induction
of apoptosis to a greater extent compared to the other fatty acid
treatments. DHA was the most effective fatty acid in decreasing
prostate cancer cell viability, since it targeted
anti-inflammatory/anti-proliferative and pro-apoptotic genes and
induced more substantial changes compared to the other ω-3 fatty
acids examined in this study. Taken together, these results may
indicate that the different efficacies of the fatty acids examined
in decreasing cell viability may be due to not only the
modification of different pathways within androgen-independent
prostate cancer cells, but also to different magnitudes of
response. Encouragement of patients to alter their diets in favor
of fish products or adding ω-3 fatty acid supplements rich in DHA
to their diets should be considered. The ω-3-acid ethyl esters
contained in the hypertriglyceridemia medication Lovaza™ could also
be considered in prostate cancer treatment or prevention
strategies.
Acknowledgements
The authors would like to acknowledge
the Microscopy and Cytometry Facilities of the Huck Institutes of
the Life Sciences (University Park, PA, USA) for the support in
flow cytometry procedures. This study was supported by the National
Cancer Institute (grant no. P50 CA140388).
References
|
1.
|
Rambeaud JJ: Intermittent complete
androgen blockade in meta-static prostate cancer. Eur Urol.
35(Suppl 1): 32–36. 1999. View Article : Google Scholar : PubMed/NCBI
|
|
2.
|
Harris KA and Reese DM: Treatment options
in hormone-refractory prostate cancer: current and future
approaches. Drugs. 61:2177–2192. 2001. View Article : Google Scholar : PubMed/NCBI
|
|
3.
|
Chan JM, Gann PH and Giovannucci EL: Role
of diet in prostate cancer development and progression. J Clin
Oncol. 23:8152–8160. 2005. View Article : Google Scholar : PubMed/NCBI
|
|
4.
|
King IB, Kristal AR, Schaffer S,
Thornquist M and Goodman GE: Serum trans-fatty acids are associated
with risk of prostate cancer in beta-Carotene and Retinol Efficacy
Trial. Cancer Epidemiol Biomarkers Prev. 14:988–992. 2005.
View Article : Google Scholar : PubMed/NCBI
|
|
5.
|
Haaland CM, Heaphy CM, Butler KS, Fischer
EG, Griffith JK and Bisoffi M: Differential gene expression in
tumor adjacent histologically normal prostatic tissue indicates
field cancerization. Int J Oncol. 35:537–546. 2009.PubMed/NCBI
|
|
6.
|
Baron A, Migita T, Tang D and Loda M:
Fatty acid synthase: a metabolic oncogene in prostate cancer? J
Cell Biochem. 91:47–53. 2004. View Article : Google Scholar : PubMed/NCBI
|
|
7.
|
Di Nunzio M, van Deursen D, Verhoeven AJ
and Bordoni A: n-3 and n-6 Polyunsaturated fatty acids suppress
sterol regulatory element binding protein activity and increase
flow of non-esterified cholesterol in HepG2 cells. Br J Nutr.
103:161–167. 2010.
|
|
8.
|
Worgall TS, Sturley SL, Seo T, Osborne TF
and Deckelbaum RJ: Polyunsaturated fatty acids decrease expression
of promoters with sterol regulatory elements by decreasing levels
of mature sterol regulatory element-binding protein. J Biol Chem.
273:25537–25540. 1998. View Article : Google Scholar
|
|
9.
|
Xu J, Nakamura MT, Cho HP and Clarke SD:
Sterol regulatory element binding protein-1 expression is
suppressed by dietary polyunsaturated fatty acids. A mechanism for
the coordinate suppression of lipogenic genes by polyunsaturated
fats. J Biol Chem. 274:23577–23583. 1999. View Article : Google Scholar
|
|
10.
|
Nakatani T, Kim HJ, Kaburagi Y, Yasuda K
and Ezaki O: A low fish oil inhibits SREBP-1 proteolytic cascade,
while a high-fish-oil feeding decreases SREBP-1 mRNA in mice liver:
relationship to anti-obesity. J Lipid Res. 44:369–379. 2003.
View Article : Google Scholar : PubMed/NCBI
|
|
11.
|
Pizer ES, Pflug BR, Bova GS, Han WF, Udan
MS and Nelson JB: Increased fatty acid synthase as a therapeutic
target in androgen-independent prostate cancer progression.
Prostate. 47:102–110. 2001. View Article : Google Scholar : PubMed/NCBI
|
|
12.
|
Pizer ES, Jackisch C, Wood FD, Pasternack
GR, Davidson NE and Kuhajda FP: Inhibition of fatty acid synthesis
induces programmed cell death in human breast cancer cells. Cancer
Res. 56:2745–2747. 1996.PubMed/NCBI
|
|
13.
|
Menendez JA and Lupu R: Fatty acid
synthase and the lipogenic phenotype in cancer pathogenesis. Nat
Rev Cancer. 7:763–777. 2007. View
Article : Google Scholar : PubMed/NCBI
|
|
14.
|
Neumann F: Pharmacology and clinical use
of antiandrogens: a short review. Ir J Med Sci. 151:61–70. 1982.
View Article : Google Scholar : PubMed/NCBI
|
|
15.
|
Gaillard-Moguilewsky M: Pharmacology of
antiandrogens and value of combining androgen suppression with
antiandrogen therapy. Urology. 37:5–12. 1991. View Article : Google Scholar : PubMed/NCBI
|
|
16.
|
Feldman BJ and Feldman D: The development
of androgen-independent prostate cancer. Nat Rev Cancer. 1:34–45.
2001. View
Article : Google Scholar : PubMed/NCBI
|
|
17.
|
Lin WW and Karin M: A cytokine-mediated
link between innate immunity, inflammation, and cancer. J Clin
Invest. 117:1175–1183. 2007. View
Article : Google Scholar : PubMed/NCBI
|
|
18.
|
Cansino Alcaide JR, Vera San Martin R,
Rodriguez de Bethencourt Codes F, Bouraoui Y, Rodriguez Berriguete
G, Oueslati R, Perez-Utrilla M, De la Pena Barthel J, Paniagua
Gomez-Alvarez R and Royuela Garcia M: Prostatic specific antigen
(PS), pro-inflammatory cytokines, and prostatic pathology (benign
prostatic hyperplasia and cancer). Relationship with malignancy.
Arch Esp Urol. 62:359–366. 2009.(In Spanish).
|
|
19.
|
Bouraoui Y, Ricote M, Garcia-Tunon I,
Rodriguez-Berriguete G, Touffehi M, Rais NB, Fraile B, Paniagua R,
Oueslati R and Royuela M: Pro-inflammatory cytokines and
prostate-specific antigen in hyperplasia and human prostate cancer.
Cancer Detect Prev. 32:23–32. 2008. View Article : Google Scholar : PubMed/NCBI
|
|
20.
|
Lu Y, Cai Z, Xiao G, Keller ET, Mizokami
A, Yao Z, Roodman GD and Zhang J: Monocyte chemotactic protein-1
mediates prostate cancer-induced bone resorption. Cancer Res.
67:3646–3653. 2007. View Article : Google Scholar : PubMed/NCBI
|
|
21.
|
Lu Y, Cai Z, Galson DL, Xiao G, Liu Y,
George DE, Melhem MF, Yao Z and Zhang J: Monocyte chemotactic
protein-1 (MCP-1) acts as a paracrine and autocrine factor for
prostate cancer growth and invasion. Prostate. 66:1311–1318. 2006.
View Article : Google Scholar : PubMed/NCBI
|
|
22.
|
Shi CL, Yu CH, Zhang Y, Zhao D, Chang XH
and Wang WH: Monocyte chemoattractant protein-1 modulates invasion
and apoptosis of PC-3M prostate cancer cells via regulating
expression of VEGF, MMP9 and caspase-3. Asian Pac J Cancer Prev.
12:555–559. 2011.PubMed/NCBI
|
|
23.
|
Hsieh TC and Chiao JW: Growth modulation
of human prostatic cancer cells by interleukin-1 and interleukin-1
receptor antagonist. Cancer Lett. 95:119–123. 1995. View Article : Google Scholar : PubMed/NCBI
|
|
24.
|
Giri D, Ozen M and Ittmann M:
Interleukin-6 is an autocrine growth factor in human prostate
cancer. Am J Pathol. 159:2159–2165. 2001. View Article : Google Scholar : PubMed/NCBI
|
|
25.
|
Shariat SF, Andrews B, Kattan MW, Kim J,
Wheeler TM and Slawin KM: Plasma levels of interleukin-6 and its
soluble receptor are associated with prostate cancer progression
and metastasis. Urology. 58:1008–1015. 2001. View Article : Google Scholar : PubMed/NCBI
|
|
26.
|
Kim SW, Kim JS, Papadopoulos J, Choi HJ,
He J, Maya M, Langley RR, Fan D, Fidler IJ and Kim SJ: Consistent
interactions between tumor cell IL-6 and macrophage TNF-α enhance
the growth of human prostate cancer cells in the bone of nude
mouse. Int Immunopharmacol. 11:862–872. 2011.
|
|
27.
|
Kyprianou N: Apoptosis: therapeutic
significance in the treatment of androgen-dependent and
androgen-independent prostate cancer. World J Urol. 12:299–303.
1994. View Article : Google Scholar : PubMed/NCBI
|
|
28.
|
Raffo AJ, Perlman H, Chen MW, Day ML,
Streitman JS and Buttyan R: Overexpression of bcl-2 protects
prostate cancer cells from apoptosis in vitro and confers
resistance to androgen depletion in vivo. Cancer Res. 55:4438–4445.
1995.PubMed/NCBI
|
|
29.
|
Thompson MR, Xu D and Williams BR: ATF3
transcription factor and its emerging roles in immunity and cancer.
J Mol Med (Berl). 87:1053–1060. 2009. View Article : Google Scholar : PubMed/NCBI
|
|
30.
|
Chen BP, Liang G, Whelan J and Hai T: ATF3
and ATF3 delta Zip. Transcriptional repression versus activation by
alternatively spliced isoforms. J Biol Chem. 3:15819–15826.
1994.PubMed/NCBI
|
|
31.
|
Huang X, Li X and Guo B: KLF6 induces
apoptosis in prostate cancer cells through up-regulation of ATF3. J
Biol Chem. 283:29795–29801. 2008. View Article : Google Scholar : PubMed/NCBI
|
|
32.
|
Terry PD, Rohan TE and Wolk A: Intakes of
fish and marine fatty acids and the risks of cancers of the breast
and prostate and of other hormone-related cancers: a review of the
epidemiologic evidence. Am J Clin Nutr. 77:532–543. 2003.PubMed/NCBI
|
|
33.
|
Friedrichs W, Ruparel SB, Marciniak RA and
DeGraffenried L: Omega-3 fatty acid inhibition of prostate cancer
progression to hormone independence is associated with suppression
of mTOR signaling and androgen receptor expression. Nutr Cancer.
63:771–777. 2011. View Article : Google Scholar : PubMed/NCBI
|
|
34.
|
De Stefani E, Deneo-Pellegrini H, Boffetta
P, Ronco A and Mendilaharsu M: Alpha-linolenic acid and risk of
prostate cancer: a case-control study in Uruguay. Cancer Epidemiol
Biomarkers Prev. 9:335–338. 2000.
|
|
35.
|
Leitzmann MF, Stampfer MJ, Michaud DS,
Augustsson K, Colditz GC, Willett WC and Giovannucci EL: Dietary
intake of n-3 and n-6 fatty acids and the risk of prostate cancer.
Am J Clin Nutr. 80:204–216. 2004.PubMed/NCBI
|
|
36.
|
Migita T, Ruiz S, Fornari A, Fiorentino M,
Priolo C, Zadra G, Inazuka F, Grisanzio C, Palescandolo E, Shin E,
et al: Fatty acid synthase: a metabolic enzyme and candidate
oncogene in prostate cancer. J Natl Cancer Inst. 101:519–532. 2009.
View Article : Google Scholar : PubMed/NCBI
|
|
37.
|
Rossi S, Graner E, Febbo P, Weinstein L,
Bhattacharya N, Onody T, Bubley G, Balk S and Loda M: Fatty acid
synthase expression defines distinct molecular signatures in
prostate cancer. Mol Cancer Res. 1:707–715. 2003.PubMed/NCBI
|
|
38.
|
Gillies PJ, Bhatia SK, Belcher LA, Hannon
DB, Thompson JT and Vanden Heuvel JP: Regulation of inflammatory
and lipid metabolism genes by eicosapentaenoic acid-rich oil. J
Lipid Res. 53:1679–1689. 2012. View Article : Google Scholar : PubMed/NCBI
|
|
39.
|
Pawlosky RJ, Hibbeln JR and Salem N Jr:
Compartmental analyses of plasma n-3 essential fatty acids among
male and female smokers and nonsmokers. J Lipid Res. 48:935–943.
2007. View Article : Google Scholar : PubMed/NCBI
|
|
40.
|
Harper CR, Edwards MJ, DeFilippis AP and
Jacobson TA: Flaxseed oil increases the plasma concentrations of
cardioprotective (n-3) fatty acids in humans. J Nutr. 136:83–87.
2006.PubMed/NCBI
|
|
41.
|
Harvei S, Bjerve KS, Tretli S, Jellum E,
Robsahm TE and Vatten L: Prediagnostic level of fatty acids in
serum phospholipids: omega-3 and omega-6 fatty acids and the risk
of prostate cancer. Int J Cancer. 71:545–551. 1997. View Article : Google Scholar : PubMed/NCBI
|
|
42.
|
Schonberg SA, Lundemo AG, Fladvad T,
Holmgren K, Bremseth H, Nilsen A, Gederaas O, Tvedt KE, Egeberg KW
and Krokan HE: Closely related colon cancer cell lines display
different sensitivity to polyunsaturated fatty acids, accumulate
different lipid classes and downregulate sterol regulatory
element-binding protein 1. FEBS J. 273:2749–2765. 2006. View Article : Google Scholar
|
|
43.
|
Cavazos DA, Price RS, Apte SS and
deGraffenried LA: Docosahexaenoic acid selectively induces human
prostate cancer cell sensitivity to oxidative stress through
modulation of NF-κB. Prostate. 71:1420–1428. 2011.PubMed/NCBI
|