Introduction
Rectal cancer is associated with a high risk of
locoregional relapse and remains one of the leading causes of
cancer-related mortality. In western countries, preoperative
chemoradiotherapy (CRT) followed by total mesorectal excision is
the standard treatment for advanced rectal cancer, and it may
decrease local recurrence and improve clinical outcome (1–5). To date,
a number of clinical trials have demonstrated that 5-fluorouracil
(5-FU) is a key chemotherapeutic agent in CRT (6–9). It is
also considered that preoperative CRT improves the local control
rate in Japan; however, it is still not a standard treatment due to
issues regarding its effectiveness and side effects.
Recently, a prospective randomized phase III trial
evaluating the survival benefit of adjuvant chemotherapy of an oral
fluoropyrimidine (S-1) in patients with advanced rectal cancer
demonstrated the superiority of S-1 to tegafur-uracil (10). It was also reported that preoperative
CRT using concurrent S-1 and irinotecan achieved excellent
long-term survival with acceptable adverse events in patients with
rectal cancer (11). We conducted a
multi-institutional phase II trial to evaluate the feasibility of
preoperative S-1 plus radiotherapy for rectal cancer (UMIN ID:
03396) (12). Our results
demonstrated that the treatment completion rate was comparable with
that reported by studies conducted in western countries; a high
rate of R0 and a low rate of occurrence of adverse side effects
were demonstrated (12).
To perform preoperative CRT effectively and avoid
adverse side effects, it is crucial to develop a predictive marker
of response to CRT. Predictive markers for the therapeutic effects
of preoperative CRT have been described in several studies
(13–15). Furthermore, it has been reported that
peripheral blood lymphocyte subsets were associated with
susceptibility to preoperative CRT (16). Additionally, the genes signal
transducer and activator of transcription 3, Ras association
(RalGDS/AF-6) domain family member 1, docking protein 3 and erbB-2
receptor tyrosine kinase 2, were found to be associated with
response to CRT in vitro (17). However, none of these factors have
reached the stage where they may be clinically applied. Therefore,
a reliable preoperative marker is still required.
Based on our multicenter phase II trial, the aim of
the present study was to identify a predictor of response to CRT in
patients with locally advanced rectal cancer. We herein attempted
to identify a gene expression set for predicting the response to
preoperative CRT by principle component analysis (PCA) as a novel
statistical approach with microarray analysis using biopsy
specimens prior to treatment.
Patients and methods
Patients
From April, 2009 to August, 2011, a total of 37
patients diagnosed with primary rectal cancer were prospectively
enrolled in a multicenter phase II study (UMIN ID 03396). The trial
design and eligibility criteria have been previously reported
(12). Of the 37 patients, 26 whose
biopsy specimens were available for microarray analysis were
investigated in the present study. The protocol of this study was
approved by the local Ethics Committee (Institutional Review Board,
Faculty of Medicine, Oita University) and written informed consent
was obtained for the therapy and tissue specimen collection from
all the patients. Regarding the inclusion criteria, cases with
cancer of the upper, middle, or lower third of the rectum, stage
T3-4, N0-2 and M0 according to the International Union Against
Cancer TNM Classification of Malignant Tumors 7th edition (18), were included in this study.
Treatment schedules
The details of the CRT were previously described
(12). CRT was administered
concurrently with four cycles of chemotherapy. A radiosensitizing
dose of S-1 was orally administered at the respective dose on days
1–5, 8–12, 22–26 and 29–33. Radiotherapy comprised 45 Gy of
preoperative pelvic radiation in 25 fractions over 5 weeks (1.8
Gy/day on days 1–5, 8–12, 15–19, 22–26 and 29–33).
Pathological evaluation
Histological response was evaluated by grading the
post-treatment resection specimens according to the Japanese
Classification of Colorectal Carcinoma (19). The absence of residual tumor was
defined as grade 3; grade 2 was defined as ≥2/3
degeneration/necrosis area; and grade 0/1a/1b was defined as
<2/3 degeneration/necrosis area. Subsequently, patients were
classified as ‘responders’ when assigned to regression grade 2 or 3
and as ‘non-responders’ when assigned to grade 0 or 1.
Sample analysis
Biopsy specimens
Biopsy specimens were collected from several
enriched cancer lesions in primary tumors prior to preoperative
CRT. These specimens were immediately embedded in Tissue-Tek O.C.T
Compound (Sakura Finetek Japan Co., Ltd., Tokyo, Japan), frozen in
liquid nitrogen and maintained at −80°C until RNA extraction.
Total RNA extraction
Frozen biopsy specimens were stained by hematoxylin
and eosin. We examined the specimens microscopically and confirmed
that abundant cancer cells were included in each specimen.
Subsequently, total RNA was extracted with an RNeasy Mini kit
(Qiagen, Valencia, CA, USA). Total RNA (300 ng) was
reverse-transcribed to cDNA using murine leukemia virus reverse
transcriptase (Invitrogen Corp., Carlsbad, CA, USA).
Microarray analysis
Gene expression was conducted using the Whole Human
Genome Oligo DNA Microarray kit (Agilent Technologies, Santa Clara,
CA, USA). Labeled cDNA was fragmented and hybridized to an
oligonucleotide microarray (Whole Human Genome 4×44 K; G4112F,
Agilent Technologies). Fluorescent intensities were determined with
an Agilent DNA Microarray scanner and analyzed using G2567AA
Feature Extraction Software, version A.7.5.1 (Agilent
Technologies), which uses the locally weighted regression curve fit
normalization method (20). This
microarray study followed the Minimum Information About a
Microarray Experiment guidelines issued by the Microarray Gen
Expression Data group (21). We
performed functional analyses of the expressed genes using
GeneSpring version 11.5 (Silicon Genetics, San Carlos, CA, USA).
The Database for Annotation, Visualization and Integrated Discovery
v6.7 was used to search for each gene and its functions (22,23).
Statistical analysis
Clinical data were statistically analyzed using the
χ2 test or Fisher's exact test. All the differences were
considered statistically significant if the P-value was <0.05.
To evaluate the difference among the expression levels of two
groups, i.e., responder and non-responder groups, we used the
normalized score of each gene expression. We performed a hypothesis
test and assumed as a null hypothesis H that the two groups have
equal mean values of a particular expression level. This means that
the gene expression in a particular DNA spot on the microarray does
not correlate to the type of response. We employed Welch's t-test
to perform the hypothesis test for H. This method calculates
a P-value for each DNA spot where the P-value is the probability of
H. If the P-value is small, it indicates that H should be rejected.
Additionally, silhouette distance is a method of validation within
clusters of data. This technique provides a precise graphical
representation of how well each object lies within its cluster
(24). Each DNA spot has a P-value.
All DNA spots are sorted in ascending order using the P-value of
the existing datasets of 26 subjects. The top-k DNA spots are
selected using this order and only the selected DNA spots are used
in the next step. To analyze the correlation between gene
expression levels, we performed a dimension reduction method called
PCA. The k expression levels of the selected k DNA spots were used
for each individual. Some of the expression levels were correlated
with each other; analysis of this correlation is useful to reduce
noise in expression levels and obtain better prediction
results.
Results
Comparison of clinical parameters
between responders and non-responders to CRT
Of the 26 patients, 11 were classified as responders
and 15 as non-responders by histological examination of surgically
resected specimens according to the grading system. The
characteristics of the 26 patients are summarized in Table I. For various clinical parameters, our
results demonstrated that all P-values calculated using the
Fisher's exact test were >0.05 in a 2×2 contingency table
comparing the responder and non-responder groups. We concluded that
there is no significant association between the groups and any of
the clinical parameters.
 | Table I.Comparison of various clinical
parameters between responders and non-responders to
chemoradiotherapy. |
Table I.
Comparison of various clinical
parameters between responders and non-responders to
chemoradiotherapy.
| Parameters | Responders
(n=11) | Non-responders
(n=15) | P-valued |
|---|
| Gender |
|
| 0.277 |
| Male | 8 | 8 |
|
|
Female | 3 | 7 |
|
| Age (years) |
|
| 0.054 |
|
Mediana | 62.5±8.9 | 54.3±10.8 |
|
| Performance
status |
|
|
|
| 0 | 11 | 15 |
|
| ≤1 | 0 | 0 |
|
| Tumor location |
|
| 0.426 |
| Upper
rectum | 2 | 4 |
|
|
Middle-lower rectum | 9 | 11 |
|
| Histology |
|
| 0.381 |
|
Well/moderately
differentiated | 9 | 14 |
|
| Poorly
differentiated/mucinous/papillary adenocarcinoma | 2 | 1 |
|
| cT stageb |
|
| 0.175 |
| T3 | 11 | 12 |
|
| T4 | 0 | 3 |
|
| cN stageb |
|
| 0.169 |
|
Negative | 5 | 3 |
|
|
Positive | 6 | 12 |
|
| cStageb |
|
| 0.085 |
| II | 5 | 2 |
|
|
III | 6 | 13 |
|
|
Surgeryc |
|
| 0.384 |
|
LAR | 6 | 9 |
|
|
APR | 4 | 6 |
|
|
Hartmann's procedure | 1 | 0 |
|
P-value distribution, silhouette
distance validation and processing results
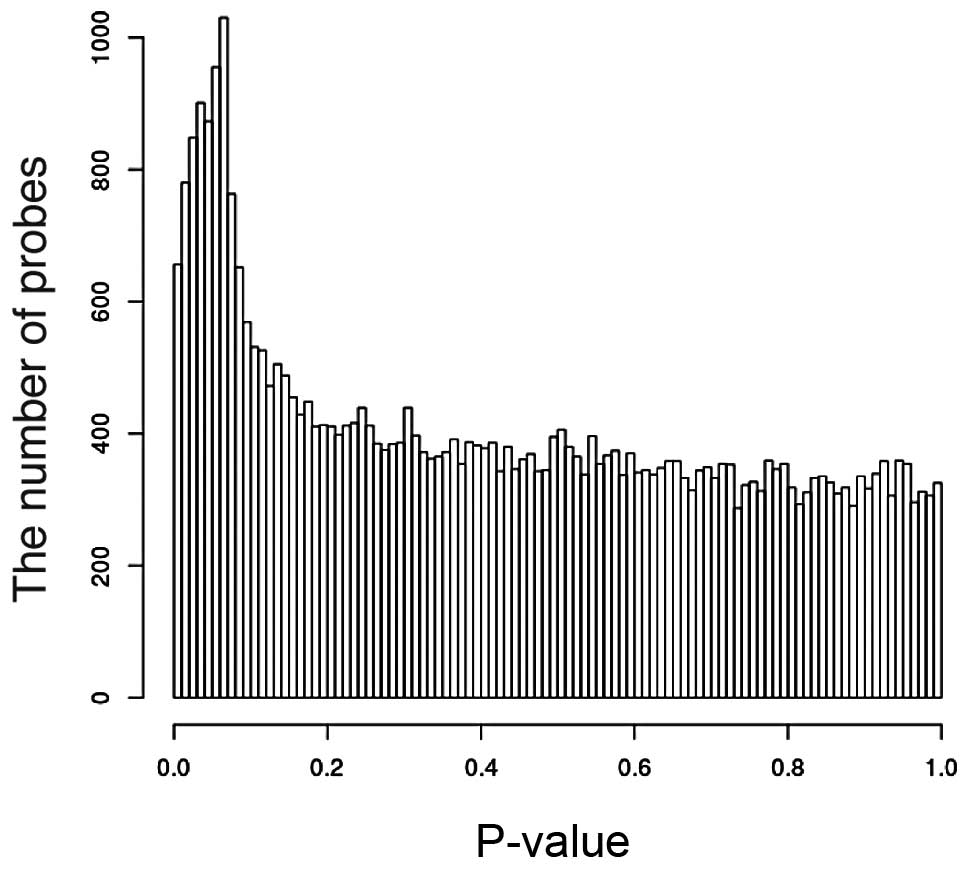
Given a set of 40,000 gene expression levels, we
obtained 40,000 P-values for H. The P-value distribution is shown
in Fig. 1. If there is no correlation
between the DNA spots and the type of response, there will be no
obvious peak at a small P-value. However, we observed a peak at the
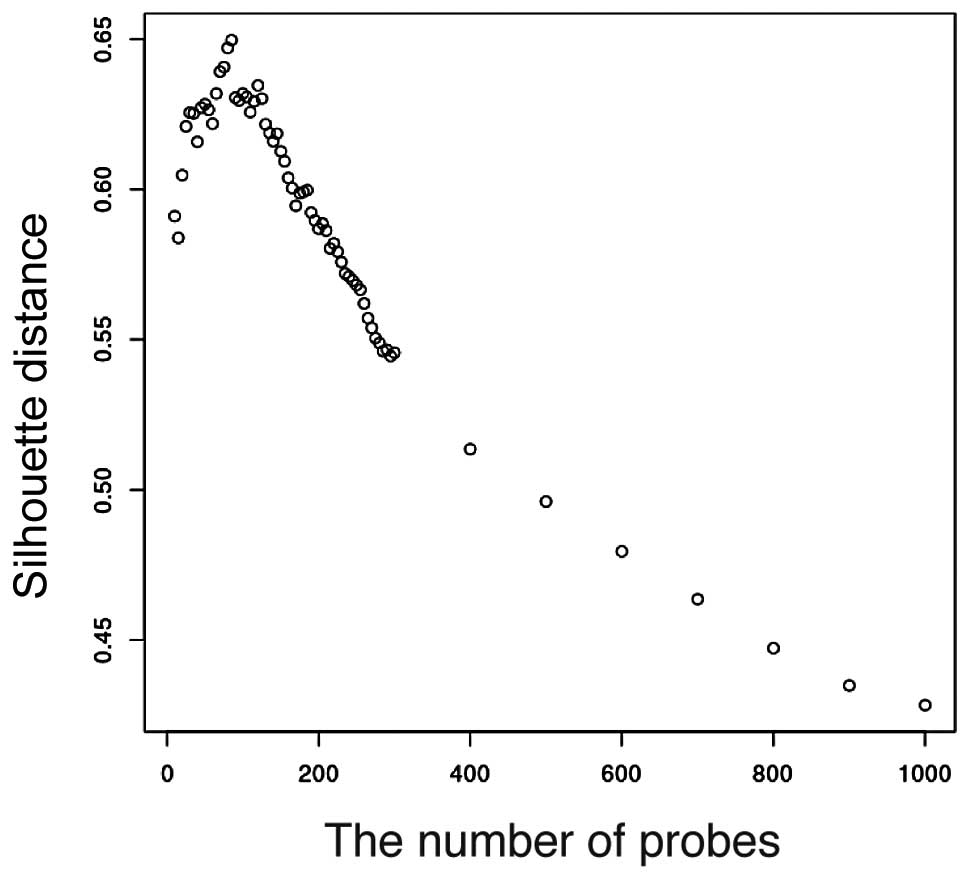
interval between 0.06≤ P-value <0.07. Furthermore, we calculated
the silhouette distance of the two sets as Vr and
Vn. The prediction results are better with increasing
silhouette value. The silhouette analysis is shown in Fig. 2. The silhouette distance increases
from k=1 to k=80 and decreases from k=80 to k=1,000. Therefore,
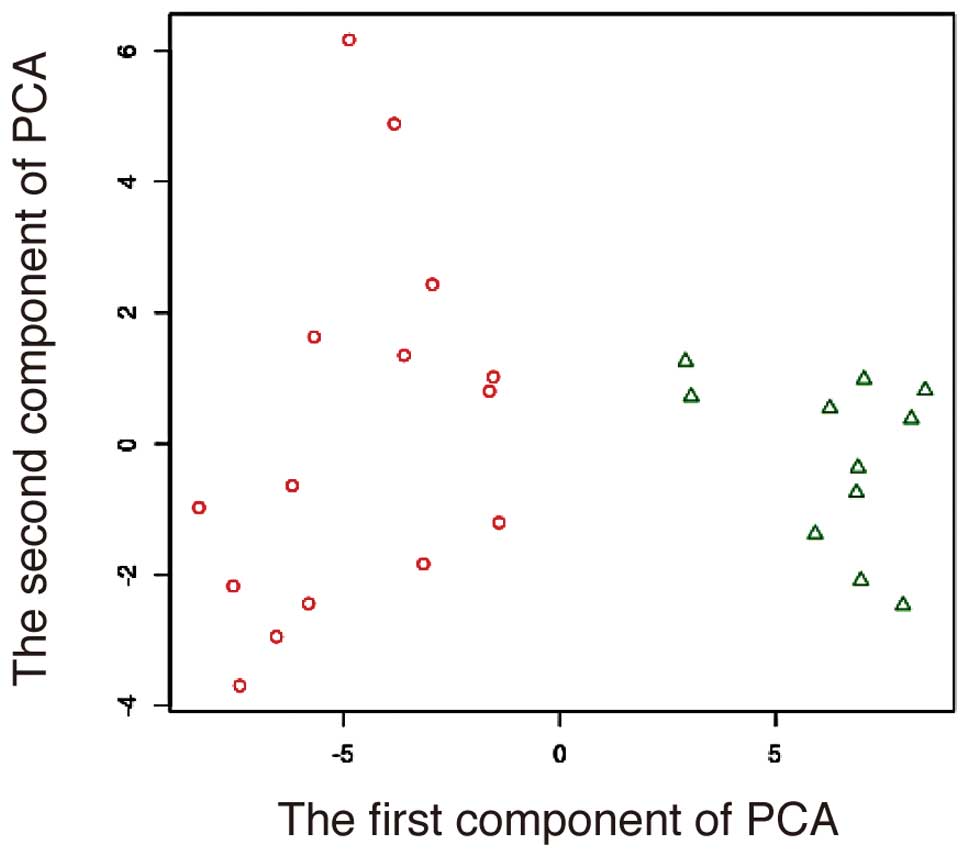
k=80 is optimal for prediction. There are 11 two-dimensional
vectors Vr for the 11 responders, and 15 two-dimensional
vectors Vn for the 15 non-responders. The result of the
existing datasets of the 26 subjects is shown in Fig. 3 and the 80-gene expression set
correlates with the type of response.
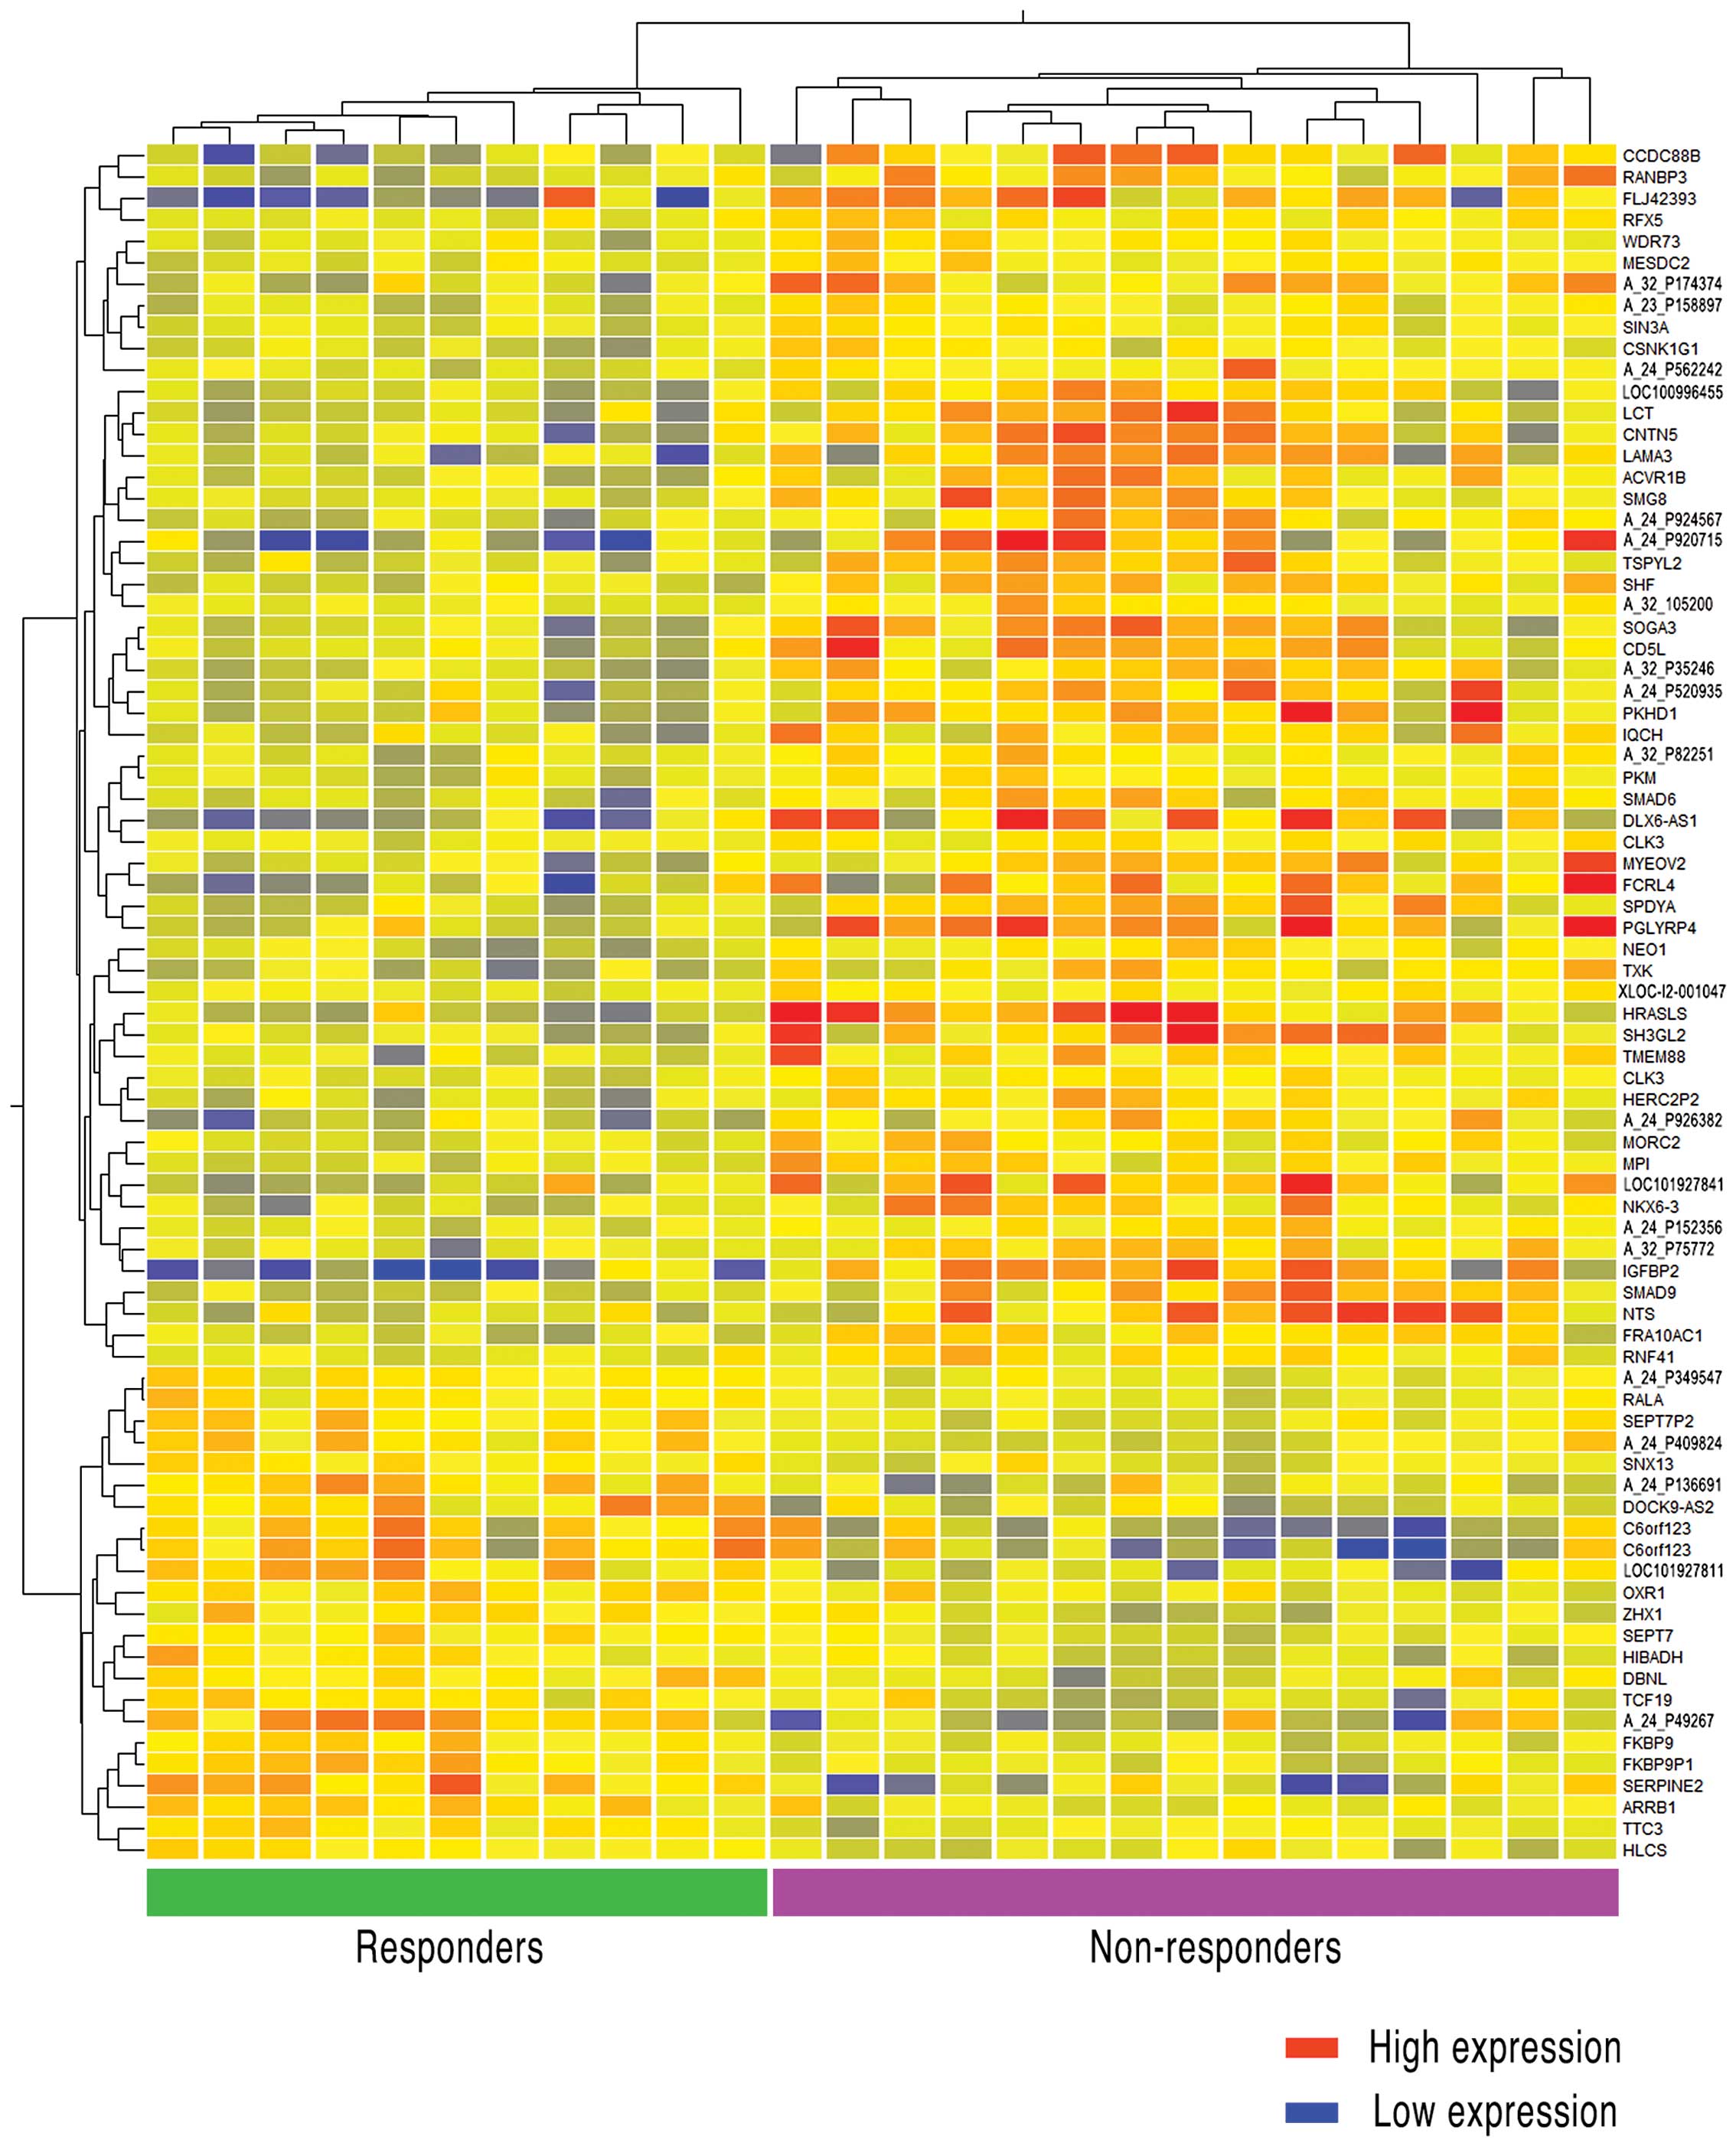
Analysis of the 80-gene expression
set
The 80-gene expression set was analyzed using
GeneSpring v.11.5 (Agilent Technologies). After having classified
the 80 genes according to the response to preoperative CRT, the
method of analysis displayed the genes in a hierarchy according to
major function. Additionally, the clustering entities were
presented in a correlation heatmap (Fig.
4). As 16 of the 80 gene names and their functions were
unknown, we described probe ID number as unknown genes according to
the database of Agilent Technologies. As shown in Fig. 4, there were 57 genes that were
strongly expressed in non-responder for responder, whereas 38 gene
names were found to be clear. By contrast, 23 genes strongly
expressed in responder for non-responder, and 14 genes of those
were found to be clear. The functional annotation results are shown
in Table II, which included
functions that strongly or weakly emerged in non-responders as
compared with responders. In the non-responder group, 38 highly
expressed genes were clearly annotated in terms of function. The
major function found in 22 of the 38 genes (57.9%) was alternative
splicing; the second major function that was found in 21 of the 38
genes (55.3%) was phosphoprotein.
| Table II.Molecular functions of genes with
high expression and low expression levels in non-responders as
compared with those in responders. |
Table II.
Molecular functions of genes with
high expression and low expression levels in non-responders as
compared with those in responders.
| Genes | Molecular
functions | Counta | %b |
P-valuec |
|---|
| Genes exhibiting
high expression | Alternative
splicing | 22 | 57.9 | 0.0058 |
|
| Phosphoprotein | 21 | 55.3 | 0.01 |
|
| Regulation of
phosphorylation | 5 | 13.2 | 0.011 |
|
| Regulation of
phosphorus metabolic process | 5 | 13.2 | 0.013 |
|
| Regulation of
phosphate metabolic process | 5 | 13.2 | 0.013 |
|
| Dwarfin | 2 | 5.3 | 0.015 |
|
| MAD homology,
MH1 | 2 | 5.3 | 0.015 |
|
| Transmembrane
receptor protein serine/threonine kinase signaling pathway | 3 | 7.9 | 0.017 |
|
| DWB | 2 | 5.3 | 0.017 |
|
| Transforming growth
factor β receptor, cytoplasmic mediator activity | 2 | 5.3 | 0.018 |
|
| TGF-β signaling
pathway | 3 | 7.9 | 0.02 |
|
| Signal | 12 | 31.6 | 0.02 |
|
| MAD homology 1,
Dwarfin-type | 2 | 5.3 | 0.022 |
|
| DWA | 2 | 5.3 | 0.026 |
|
| SMAD
domain-like | 2 | 5.3 | 0.028 |
|
| Regulation of
protein kinase activity | 4 | 10.5 | 0.028 |
|
| Regulation of
kinase activity | 4 | 10.5 | 0.03 |
|
| Kinase | 5 | 13.2 | 0.032 |
|
| Regulation of
transferase activity | 4 | 10.5 | 0.034 |
|
|
Phosphotransferase | 3 | 7.9 | 0.049 |
| Genes exhibiting
low expression | Septin complex | 2 | 14.3 | 0.0084 |
|
| Septin
cytoskeleton | 2 | 14.3 | 0.0084 |
|
| Cell cortex | 3 | 21.4 | 0.0044 |
|
| GTP binding | 3 | 21.4 | 0.038 |
|
| Guanyl nucleotide
binding | 3 | 21.4 | 0.04 |
|
| Guanyl
ribonucleotide binding | 3 | 21.4 | 0.04 |
Discussion
In the present study, we demonstrated that an
80-gene expression set may predict response to preoperative CRT
with an oral fluorouracil agent (S-1) for locally advanced rectal
cancer. The 80 genes identified in this study were selected from
40,000 genes by a novel statistical technique, i.e., the dimension
reduction method referred to as PCA. Several investigators
previously reported that one gene or a few genes were associated
with response to preoperative CRT for rectal cancer (13–15,17,25).
However, it was considered that the prediction of CRT response
using a few genes as biomarkers may be difficult, as this
comprehensive treatment has various mechanisms associated with
antitumor effects. In this study, we focused on a new statistically
analytical system of gene expression by microarray analysis, in
order to identify a set of genes predicting response to CRT using
biopsy samples of tumors prior to CRT treatment. To the best of our
knowledge, this is the first study to investigate a gene set as a
biomarker of response to radiation with various chemotherapies
using a novel statistical technique.
We obtained the expression levels of 40,000 genes
from DNA spots in a microarray for each patient. One of the main
aims of this study was to automatically identify and predict the
type of response to preoperative CRT and classify it into either
responders or non-responders based on the expression levels. We
were then certain that there must be a particular number of genes
correlated with susceptibility. The basic idea was to use the
existing datasets of 26 subjects for prediction. Herein, we
proposed a new method of prediction. First, the existing datasets
of 26 subjects were processed to prepare an automatic predictor, as
explained in Materials and methods. Our goal was to estimate the
optimal number k of DNA spots that were obtained in the
optimal predication results. To evaluate the prediction, we
calculated the silhouette distance of the two sets
Vr and Vn. Our results
demonstrated that these 80 genes were correlated with the type of
response. If the number of genes were > or <80 DNA spots, the
prediction would be incorrect.
It was previously reported that alternative splicing
was significantly associated with cancer development (26). In rectal cancers of the same
pathological differentiation, alternative splicing of a gene may
lead to different resistances to various treatments, including CRT.
Haley et al and Cutillas et al reported that
phosphoproteomics enabled tumor cells to survive against
chemotherapeutics (27,28). However, the septin complex was the
major annotated function among genes expressed at a low level,
accounting for 4 out of 14 genes (28.6%). It has also been reported
that septin is associated with the cytoskeleton and cell division
(29), and that the septin family
facilitates differentiation between patients without cancer and
those with cancer (30). These
reports support the idea that our functional cluster analysis of
the gene expression set is a possible predictive marker for CRT
response in rectal cancer. Although Nishino et al reported
that the organic anion transporter 2 gene was associated with the
major uptake transporters of 5-FU, this gene was not found in our
80-gene set (25). In the future, it
is necessary to elucidate the functions of unknown genes and to
evaluate the interaction of the expression of these genes with
response to preoperative CRT.
Our study had several limitations. First, the
heterogeneity of cancer tissue is a factor that makes anticancer
treatment difficult; thus, it was necessary to consider
heterogeneity when the tissue samples were obtained. Therefore, we
decided to sample from the pretreatment biopsy site, which was
located in an elevated part of the tumor nearest to the anus.
Second, it was necessary to evaluate whether prediction using this
80-gene set is possible for radiation therapy with other types of
chemotherapy. Furthermore, the accuracy of the 80-gene expression
set could not be validated, which will be addressed in a future
multi-institutional study to evaluate the utility of this 80-gene
expression set for CRT prior to surgery for locally advanced rectal
cancer (UMIN ID 03398). The results of this validation trial will
demonstrate whether this 80-gene expression set is reliable as a
predictive biomarker of response to preoperative CRT.
In conclusion, the 80-gene expression set identified
in our study may be a predictor of response to preoperative CRT for
locally advanced rectal cancer. We demonstrated that the
application of PCA is useful for the identification of a gene set
in this context. To the best of our knowledge, this is the first
study to develop a prediction gene set based on microarray analysis
for response to CRT using pretreatment biopsy specimens.
Acknowledgments
The following are acknowledged for their
contribution to this study: Dr Toshifumi Matsumoto and Dr Teijiro
Hirashita, National Hospital Organization Beppu Medical Center; Dr
Koichiro Tahara and Dr Satoshi Sugita, National Hospital
Organization Oita Medical Center; Dr Akio Morimoto, Dr Atsushi
Sasaki, Dr Yu Takeuchi and Dr Fumitaka Yoshizumi, Japan Community
Health Care Organization Nankai Medical Center; Dr Toshio Bando and
Dr Yasuhiro Hirabayashi, Oita Prefectural Hospital; Dr Akihiko
Kuwahara, Dr Koichi Ishikawa, Dr Kazuya Sonoda, Tsukumi Central
Hospital; Dr Akio Shiromizu, Oita Red Cross Hospital; Dr Kyuzo
Fujii and Dr Toru Kusano, Nakatsu Municipal Hospital; Dr Nobuhiro
Kubo, Dr Kohei Shibata and Dr Takuya Noguchi, JA Oita Koseiren
Tsurumi Hospital; Dr Koshi Mimori and Dr Hidetoshi Eguchi, Kyushu
University Beppu Hospital; Dr Tadahiko Kinoshita, Dr Yuji Morii, Dr
Masaaki Tajima and Dr Yohei Kono, Bungoono City Hospital; Dr
Katsuhiro Shimoda, Dr Tadashi Ogawa, Dr Kosuke Suzuki, Dr Yoko
Komori, Usuki Cosmos Hospital; Dr Kazuaki Hiroishi and Dr Shigeo
Ninomiya, Arita Gastrointestinal Hospital; Dr Toshiya Abe, Dr
Masahiro Fukano, Dr Seitaro Hirano, Nakatsu Gastrointestinal
Hospital; Dr Masanori Aramaki and Dr Hiroshi Sato, Oita Oka
Hospital; Dr Kenji Zeze, Zeze Hospital; Dr Toshihiro Suematsu, Oita
Tobu Hospital. We would like to express our gratitude to Ms. Mami
Kimoto, Ms. Mayumi Takeda and Ms. Yuiko Aso for the technical
assistance.
Glossary
Abbreviations
Abbreviations:
|
CRT
|
chemoradiotherapy
|
|
5-FU
|
5-fluorouracil
|
|
S-1
|
oral fluoropyrimidine
|
|
PCA
|
principle component analysis
|
References
|
1
|
Garcia-Aguilar J, Smith DD, Avila K,
Bergsland EK, Chu P and Krieg RM: Timing of Rectal Cancer Response
to Chemoradiation Consortium: Optimal timing of surgery after
chemoradiation for advanced rectal cancer: Preliminary results of a
multicenter, nonrandomized phase II prospective trial. Ann Surg.
254:97–102. 2011. View Article : Google Scholar : PubMed/NCBI
|
|
2
|
Van Gijn W, Marijnen CA, Nagtegaal ID,
Kranenbarg EM, Putter H, Wiggers T, Rutten HJ, Påhlman L, Glimelius
B and van de Velde CJ: Dutch Colorectal Cancer Group: Preoperative
radiotherapy combined with total mesorectal excision for resectable
rectal cancer: 12-year follow-up of the multicentre, randomised
controlled TME trial. Lancet. 12:575–582. 2011. View Article : Google Scholar : PubMed/NCBI
|
|
3
|
Sauer R, Becker H, Hohenberger W, Rödel C,
Wittekind C, Fietkau R, Martus P, Tschmelitsch J, Hager E, Hess CF,
et al: Preoperative versus postoperative chemoradiotherapy for
rectal cancer. N Engl J Med. 351:1731–1740. 2004. View Article : Google Scholar : PubMed/NCBI
|
|
4
|
Bosset JF, Collette L, Calais G, Mineur L,
Maingon P, Radosevic-Jelic L, Daban A, Bardet E, Beny A and Ollier
JC: EORTC Radiotherapy Group Trial 22921: Chemotherapy with
preoperative radiotherapy in rectal cancer. N Engl J Med.
355:1114–1123. 2006. View Article : Google Scholar : PubMed/NCBI
|
|
5
|
Martling A, Holm T, Johansson H, Rutqvist
LE and Cedermark B: Stockholm Colorectal Cancer Study Group: The
Stockholm II trial on preoperative radiotherapy in rectal
carcinoma: Long-term follow-up of a population-based study. Cancer.
92:896–902. 2001. View Article : Google Scholar : PubMed/NCBI
|
|
6
|
Bosset JF, Calais G, Mineur L, Maingon P,
Stojanovic-Rundic S, Bensadoun RJ, Bardet E, Beny A, Ollier JC,
Bolla M, et al: Fluorouracil-based adjuvant chemotherapy after
preoperative chemoradiotherapy in rectal cancer: Long-term results
of the EORTC 22921 randomised study. Lancet Oncol. 15:184–190.
2014. View Article : Google Scholar : PubMed/NCBI
|
|
7
|
Gérard JP, Conroy T, Bonnetain F, Bouché
O, Chapet O, Closon-Dejardin MT, Untereiner M, Leduc B, Francois E,
Maurel J, et al: Preoperative radiotherapy with or without
concurrent fluorouracil and leucovorin in T3-4 rectal cancers:
Results of FFCD 9203. J Clin Oncol. 24:4620–4625. 2006. View Article : Google Scholar : PubMed/NCBI
|
|
8
|
Sebag-Montefiore D, Stephens RJ, Steele R,
Monson J, Grieve R, Khanna S, Quirke P, Couture J, de Metz C, Myint
AS, et al: Preoperative radiotherapy versus selective postoperative
chemoradiotherapy in patients with rectal cancer (MRC CR07 and
NCIC-CTG C016): A multicenter, randomised trial. Lancet.
373:811–820. 2009. View Article : Google Scholar : PubMed/NCBI
|
|
9
|
Aschele C, Cionini L, Lonardi S, Pinto C,
Cordio S, Rosati G, Artale S, Tagliagambe A, Ambrosini G, Rosetti
P, et al: Primary tumor response to preoperative chemoradiation
with or without oxaliplatin in locally advanced rectal cancer:
Pathologic results of the STAR-01 randomized phase III trial. J
Clin Oncol. 29:2773–2780. 2011. View Article : Google Scholar : PubMed/NCBI
|
|
10
|
Murata A, Yoshida K, Maeda K, et al: A
randomized phase III trial comparing S-1 versus UFT as adjuvant
chemotherapy for stage II/III rectal cancer (JFMC35-C1: ACTS-RC).
ASCO abstract. #3515:2015.
|
|
11
|
Nakamura T, Yamashita K, Sato T, Ema A,
Naito M and Watanabe M: Neoadjuvant chemoradiation therapy using
concurrent S-1 and irinotecan in rectal cancer: Impact on long-term
clinical outcomes and prognostic factors. Int J Radiat Oncol Biol
Phys. 89:547–555. 2014. View Article : Google Scholar : PubMed/NCBI
|
|
12
|
Inomata M, Akagi T, Nakajima K, Etoh T,
Shiraishi N, Tahara K, Matsumoto T, Kinoshita T, Fujii K, Shiromizu
A, et al: A prospective feasibility study to evaluate
neoadjuvant-synchronous S-1 with radiotherapy for locally advanced
rectal cancer: A multicentre phase II trial. Mol Clin Oncol.
4:510–514. 2016.
|
|
13
|
Garcia-Aguilar J, Chen Z, Smith DD, Li W,
Madoff RD, Cataldo P, Marcet J and Pastor C: Identification of a
biomarker profile associated with resistance to neoadjuvant
chemoradiation therapy in rectal cancer. Ann Surg. 254:486–493;
discussion 492–493. 2011. View Article : Google Scholar : PubMed/NCBI
|
|
14
|
Watanabe T, Kobunai T, Yamamoto Y, Matsuda
K, Ishihara S, Nozawa K, Iinuma H, Konishi T, Horie H, Ikeuchi H,
et al: Gene expression signature and response to the use of
leucovorin, fluorouracil and oxaliplatin in colorectal cancer
patients. Clin Transl Oncol. 13:419–425. 2011. View Article : Google Scholar : PubMed/NCBI
|
|
15
|
Nishioka M, Shimada M, Kurita N, Iwata T,
Morimoto S, Yoshikawa K, Higashijima J and Miyatani T: Gene
expression profile can predict pathological response to
preoperative chemoradiotherapy in rectal cancer. Cancer Genomics
Proteomics. 8:87–92. 2011.PubMed/NCBI
|
|
16
|
Tada N, Kawai K, Tsuno NH, Ishihara S,
Yamaguchi H, Sunami E, Kitayama J, Oba K and Watanabe T: Prediction
of the preoperative chemoradiotherapy response for rectal cancer by
peripheral blood lymphocyte subsets. World J Surg Oncol. 13:302015.
View Article : Google Scholar : PubMed/NCBI
|
|
17
|
Spitzner M, Emons G, Kramer F, Gaedcke J,
Rave-Fränk M, Scharf JG, Burfeind P, Becker H, Beissbarth T,
Ghadimi BM, et al: A gene expression signature for
chemoradiosensitivity of colorectal cancer cells. Int J Radiat
Oncol Biol Phys. 78:1184–1192. 2010. View Article : Google Scholar : PubMed/NCBI
|
|
18
|
Sobin LH, Gospodarowicz MK and Wittekind
C: TNM Classification of Malignant Tumours (7th). Wiley-Blackwell.
Hoboken: 2009.
|
|
19
|
Japanese Society for Cancer of the Colon
and Rectum: Japanese Classification of Colorectal Carcinoma (2nd
English). Kanehara Shuppan Co. Ltd. Japan: 2009.
|
|
20
|
Quackenbush J: Microarray data
normalization and transformation. Nat Genet. 32(Suppl): 496–501.
2002. View
Article : Google Scholar : PubMed/NCBI
|
|
21
|
Brazma A, Hingamp P, Quackenbush J,
Sherlock G, Spellman P, Stoeckert C, Aach J, Ansorge W, Ball CA,
Causton HC, et al: Minimum information about a microarray
experiment (MIAME)-toward standards for microarray data. Nat Genet.
29:365–371. 2001. View Article : Google Scholar : PubMed/NCBI
|
|
22
|
da Huang W, Sherman BT and Lempicki RA:
Systematic and integrative analysis of large gene lists using DAVID
bioinformatics resources. Nat Protoc. 4:44–57. 2009. View Article : Google Scholar : PubMed/NCBI
|
|
23
|
da Huang W, Sherman BT and Lempicki RA:
Bioinformatics enrichment tools: Paths toward the comprehensive
functional analysis of large gene lists. Nucleic Acids Res.
37:1–13. 2009. View Article : Google Scholar : PubMed/NCBI
|
|
24
|
Rousseeuw PJ: Silhouettes: A graphical aid
to the interpretation and validation of cluster analysis. Comput
Appl Math. 20:53–65. 1987. View Article : Google Scholar
|
|
25
|
Nishino S, Itoh A, Matsuoka H, Maeda K and
Kamoshida S: Immunohistochemical analysis of organic anion
transporter 2 and reduced folate carrier 1 in colorectal cancer:
Significance as a predictor of response to oral uracil/ftorafur
plus leucovorin chemotherapy. Mol Clin Oncol. 1:661–667.
2013.PubMed/NCBI
|
|
26
|
Pal S, Gupta R and Davuluri RV:
Alternative transcription and alternative splicing in cancer.
Pharmacol Ther. 136:283–294. 2012. View Article : Google Scholar : PubMed/NCBI
|
|
27
|
Haley J and White FM: Adaptive protein and
phosphoprotein networks which promote therapeutic sensitivity or
acquired resistance. Biochem Soc Trans. 42:758–764. 2014.
View Article : Google Scholar : PubMed/NCBI
|
|
28
|
Cutillas PR: Role of phosphoproteomics in
the development of personalized cancer therapies. Proteomics Clin
Appl. 9:383–395. 2015. View Article : Google Scholar : PubMed/NCBI
|
|
29
|
Mostowy S and Cossart P: Septins: The
fourth component of the cytoskeleton. Nat Rev Mol Cell Biol.
13:183–194. 2012.PubMed/NCBI
|
|
30
|
Connolly D, Abdesselam I, Verdier-Pinard P
and Montagna C: Septin roles in tumorigenesis. Biol Chem.
392:725–738. 2011. View Article : Google Scholar : PubMed/NCBI
|