Introduction
With the growing incidence of cancer worldwide and
the persisting high number of deaths due to late discovery of the
disease, the identification of new reliable cancer biomarkers is
urgently needed for early detection, for follow-up of patients, and
for targeted therapeutic interventions to achieve prevention and
better outcomes (1,2). A major challenge in harnessing the
discovery of new cancer biomarkers is that cancer initiation and
promotion and tumor progression are indeed complex processes
involving various abnormal genetic and epigenetic molecular
mechanisms and cellular interactions (3). Moreover, these processes may result
from exposure to multiple and diverse environmental carcinogenic
agents in different susceptible hosts. Such complexity accounts for
the fact that cancers vary widely in etiology and pathogenesis
(4), placing a premium on the
discovery of new reliable biomarkers of malignant tumors.
Since Otto Warburg published in 1956 his hypothesis
on the aerobic glycolysis of cancer cells (5), it was supposed that to generate ATP,
malignant cells reduce mitochondrial respiration and compensate it
by increasing glycolysis and even can replace it totally by
glycolysis, despite sufficient amounts of oxygen penetrating into
malignant cells (6). Aerobic
glycolysis was thus recognized as a putative hallmark of cancer
cell metabolism (7); and today's
hypothesis is that to promote cancer cell survival and
proliferation, suppressing mitochondrial respiration may increase
glycolysis for ATP production, whereas maintaining mitochondrial
respiration puts cancer cells at risk of apoptosis (8). By bypassing the Embden-Meyerhof-Parnas
glycolytic pathway (9), a key waste
glycolysis-associated metabolite preceding formation of the end
product D-Lactate is the aldehyde form of pyruvic acid,
methylglyoxal (MG), also called pyruvaldehyde or 2-oxopropanal
(CH3-CO-CH=O or C3H4O2)
(10).
Because aerobic glycolysis appears to be a general
metabolic property of malignant cells and because MG is a naturally
occurring metabolic byproduct of glycolysis, we measured levels of
this molecule in the peripheral blood of rats using a specially
dedicated tumor graft experimental model, to determine whether free
MG can be a reliable tumor growth-associated biomarker. This paper
is the first part of a recently patented three step study showing
that free MG is a reliable metabolic biomarker of cancer growth
(11).
Materials and methods
Experimental design
To compare the peripheral blood levels of free MG in
cancerous and healthy animals we used a DHD non-diabetic rat
colonic adenocarcinoma tumor model from which two cell clones were
derived, one being tumorigenic (PROb) and the other non-tumorigenic
(REGb), both obtained from a colonic adenocarcinoma in BD-IX rats.
As previously reported, the tumor progressive PROb (DHD-K12/TRb)
clone and the tumor regressive REGb (DHD-K12/TSb) clone were
established from a unique DHD colon adenocarcinoma induced by 1-2
dimethylhydrazine in a BD-IX strain of female rat (12).
Animals and tumor growth assay
Syngeneic BD-IX rats aged 8-10 weeks were used in
the tumor growth assay. BD-IX rats initially provided by Charles
River were harvested locally in the animal facility (research unit
U1098 animal facility (Dijon, France) of the French Institute of
Health and Medical Research (INSERM). Animal health and behavior
were monitored twice a week. The welfare of animals used in this
assay was in agreement with international guidelines. Animals were
housed under specific pathogen-free conditions and cared for
according to the guidelines of the institutional Veterinary
Committee and the European laws for animal experimentation. More
precisely animal use and handling were approved by the local
veterinary committee and were performed according to the European
laws for animal experimentation including the use of anesthetics
and efforts to minimize animal distress. For anesthesia, we used
isoflurane. We placed animals in an induction chamber and adjusted
the oxygen flowmeter to 0.8-1.5 l/min and the isoflurane vaporizer
to 3-5%. After prolonged exposure on isoflurane, cervical
dislocation were performed. During the 9 week duration of the
experiments, we observed no spontaneous death and all animals being
euthanized at the end of the experimental period.Cells of the two
clones were cultured in Ham F10 medium (BioWhittaker) complemented
with 10% fetal bovine serum (Gibco; Thermo Fisher Scientific,
Inc.). Cells (1x10⁶) of the two clones were injected
subcutaneously in 100 µl of serum-free Ham F10 medium into the
antero-lateral thoracic wall of BD-IX rats.
Blood samples were harvested at 0, 2, 3, 4, 6 and 9
weeks after the cell injection of each clones in 18 animals (9
males and 9 females). Blood (3-5 ml) was collected through orbital
cavity or 5 ml by cardiac puncture after rats were sacrificed by
cervical dislocation.
Tumor volume was measured, using a caliper to
determine two perpendicular diameters. We calculated tumor volume
(V) from the caliper measurements using the formula V =
(W2 x L)/2, where W is the tumor width and L, the tumor
length.
The endpoint assessment was based on tumor volume
measurement according to the pre-established time scale i.e., at 0,
2, 3, 4, 6 and 9 weeks during which blood samples were
obtained.
During the experimental process all animals were
checked twice a week for suffering analysis which include
particularly prostration, damaged fur, half-closed eyes and
irritated eyes. We never observed any suffering of the animal so we
did not stop the experimental process up to week 9 (T9). Tumor
volume never exceeded 3,000 mm3 at T9.
MG measurement Chemicals and technical
devices used in the assay
All chemicals were analytical grade. MG (40% aqueous
solution), glyoxalase I (from Saccharomyces cerevisiae, grade IV,
buffered aqueous glycerol solution) and reduced glutathione (GSH)
were supplied by Sigma-Aldrich, Merck KGaA. O-phenylenediamine also
called 1,2-diaminobenzene (o-PD) was purchased from
AcrosOrganics-Fisher Scientific and 5-methylquinoxaline (5-MQX)
from Interchim. Acetonitrile and trifluoroacetic acid (TFA) for
High performance liquid chromatography (HPLC) gradient grade were
purchased from Carlo Erba and formic acid (99-100%, Normapur) from
Grosseron. Water used in these experiments was purified using a
Milli-Q Water Purification System (EMD Millipore Corp.). The
reversed phase chromatography column (symmetry C18: 3.9x150 mm; 5
µm) and the Symmetry Sentry™ guard column (3.9x20 mm, 5 µm) were
purchased from Waters (Milford).
Preparation of blood samples
The whole blood (0.5 g) was diluted twice in water
and the proteins were precipitated with TFA (50 µl, 0.65 M final
concentration). The supernatant obtained by centrifugation (12,000
g, 10 min, 4˚C) was supplemented with the deriviatising agent, o-PD
(50 µl of a 0.01% solution in water) and incubated at 23˚C for 6 h
in the dark. After centrifugation (10,000 g, 5 min) the supernatant
was then analysed by using an HPLC for quantitative analysis of the
2-quinoxaline free MG derivative (2-MQX) by liquid
chromatography-electrospray ionization (ESI) mass spectrometry (MS)
(ESI-MS) method with 5-MQX used as internal standard.
Preparation of standards
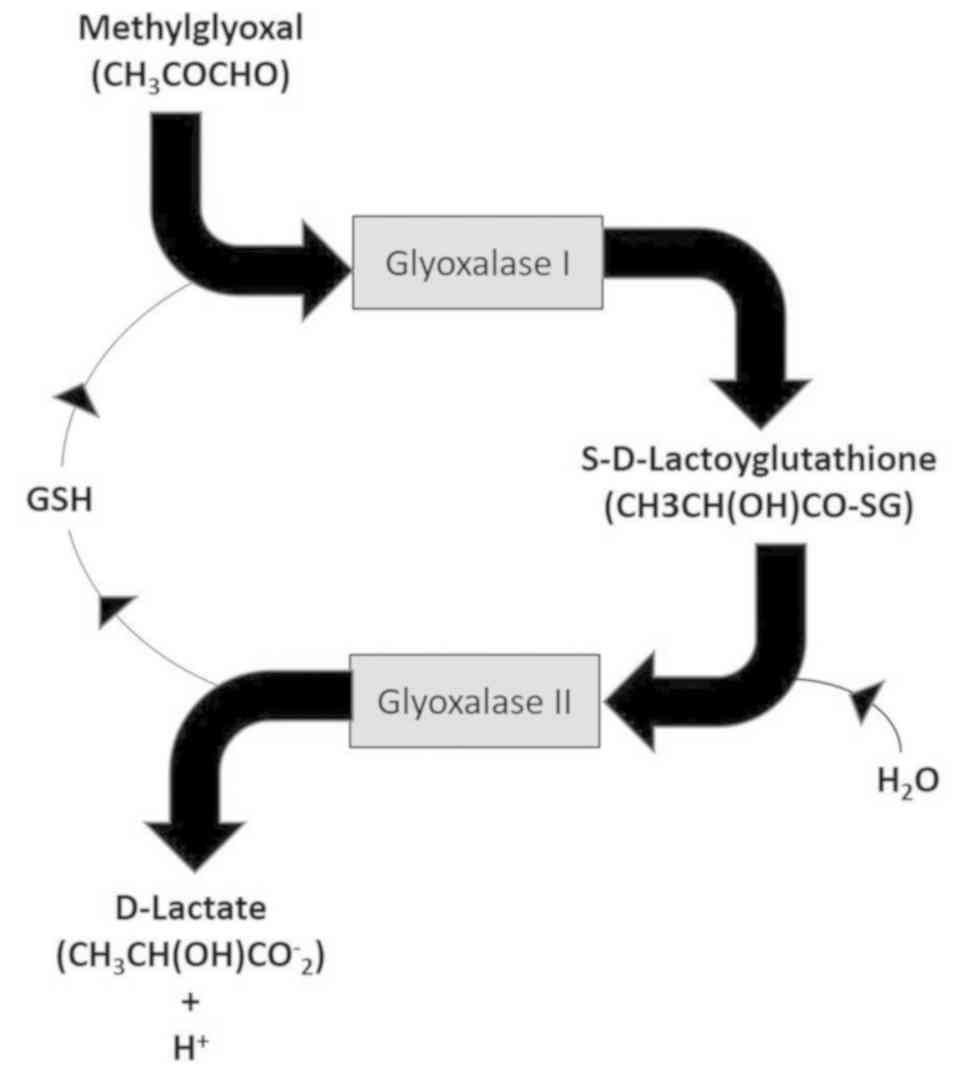
The concentration of the stock aqueous solution of
free MG was determined enzymatically by endpoint assay. Free MG
quantification involves conversion to S-D-lactoylglutathione by
glyoxalase I in the presence of GSH (Fig. 1). Calibrating standards containing
0.0625-1.6 µmol of MG in 1 ml of water were prepared.
Derivatization was carried out by the procedure described above
(see ‘preparation of blood sample’). Calibration curves were
constructed by plotting the pick area ratios of 2-MQX and 5-MQX
internal standard against the MG concentrations.
MG dosage
MG was measured in the whole blood using an already
described method (11). To identify
free MG and quantify its blood level in studied animals, we used a
free MG dosage method adapted from that of Chaplen et al
(13) and that of Rabbani and
Thornalley (14) but using whole
blood instead of plasma, and TFA instead of trichloroacetic acid as
precipitating agent. We also did not add sodium azide because
according to the method we used we did not find any statistically
significant difference with or without this anti-peroxidase agent.
In any case our results were established in comparison with normal
T0 values.
The quinoxaline derivatives (2-MQX and 5-MQX) were
resolved by reversed-phase HPLC (RP-HPLC) and analysed by
ESI/single ion monitoring.
Chromatographic analysis was performed using a
Waters Alliance e2695 separation module (Waters) coupled with a
Waters Micromass ZQ 2000 module (Waters) as ESI-MS Detector. The
analytical column employed was a Symmetry C18 analytical column
100Å, 5 µm, 3.9x150 mm combined with a Symmetry Sentry TM guard
column 100Å, 5 µm, 3.9x20 mm from Waters. The mobile phase
consisted of solvent A: 0.5% (v/v) formic acid in water and solvent
B: 0.5% (v/v) formic acid in acetonitrile, and was delivered at 0.8
ml/min. The program of HPLC run was the following: 12-18% of mobile
phase B over 4 min and held for 16 min. This was followed by 18%
solvent B for 16 min.
The injection volume was 85 µl of the sample and 5
µl of a 5-MQX water solution (1 mg/ml diluted 1/200). The
autosampler temperature was maintained at 4˚C throughout the
analysis.
The quinoxaline derivatives (2-MQX and 5-MQX) were
resolved by reversed-phase HPLC (RP-HPLC) and analysed by
ESI/single ion monitoring.
MS conditions were as follows: Cone voltage, 30 V;
source temperature, 110˚C; desolvatation gas flow, 400 l/h; probe
temperature, 110˚C. The MS used positive ion electrospray with
capillary voltage held at very high voltage (order of kV). Empower
software (Waters) was used to control the analytical system and
data processing.
Free MG quantification was performed by calculating
a peak area ratio of protonated molecular ion peak intensity (m/z
145) to a protonated molecular internal standard ion peak intensity
(5-MQX, m/z 145) in the selected ion monitoring mode.
MG measurements were done in triplicate for each
blood sample analyzed and histograms were constructed by plotting
each MG mean values against time for the two studied group of
rats.
Statistical analysis
We used two different statistical tests: The
Friedman's test with Nemenyi post-hoc comparisons concerning MG,
tumoral volume and glucose concentration analysis as we
hypothesized our data would not be a normal distribution for a
within-group comparison between the different values obtainedat
time measurement (at T0 and after 2, 3, 4, 6 and 9 weeks); and the
Pearson product-moment correlation test, to measure the strength of
association. All statistical analysis were conducted using the
XLSTAT software. P<0.05 was considered to indicate a
statistically significant difference.
Results
Tumor development
The results are depicted in Figs. 2 and 3. Fig. 1
presents the increase in free MG blood levels and tumor volume
(+/-SD) after PROb cell transplantation. As indicated in Fig. 2, subcutaneous injection of PROb cells
into syngeneic hosts allowed the establishment of progressively
growing cancerous tumors, whereas injection of REGb cells into
these syngeneic hosts induced a limited and transient development
of tumors which completely regressed in less than 4 weeks (Fig. 3).
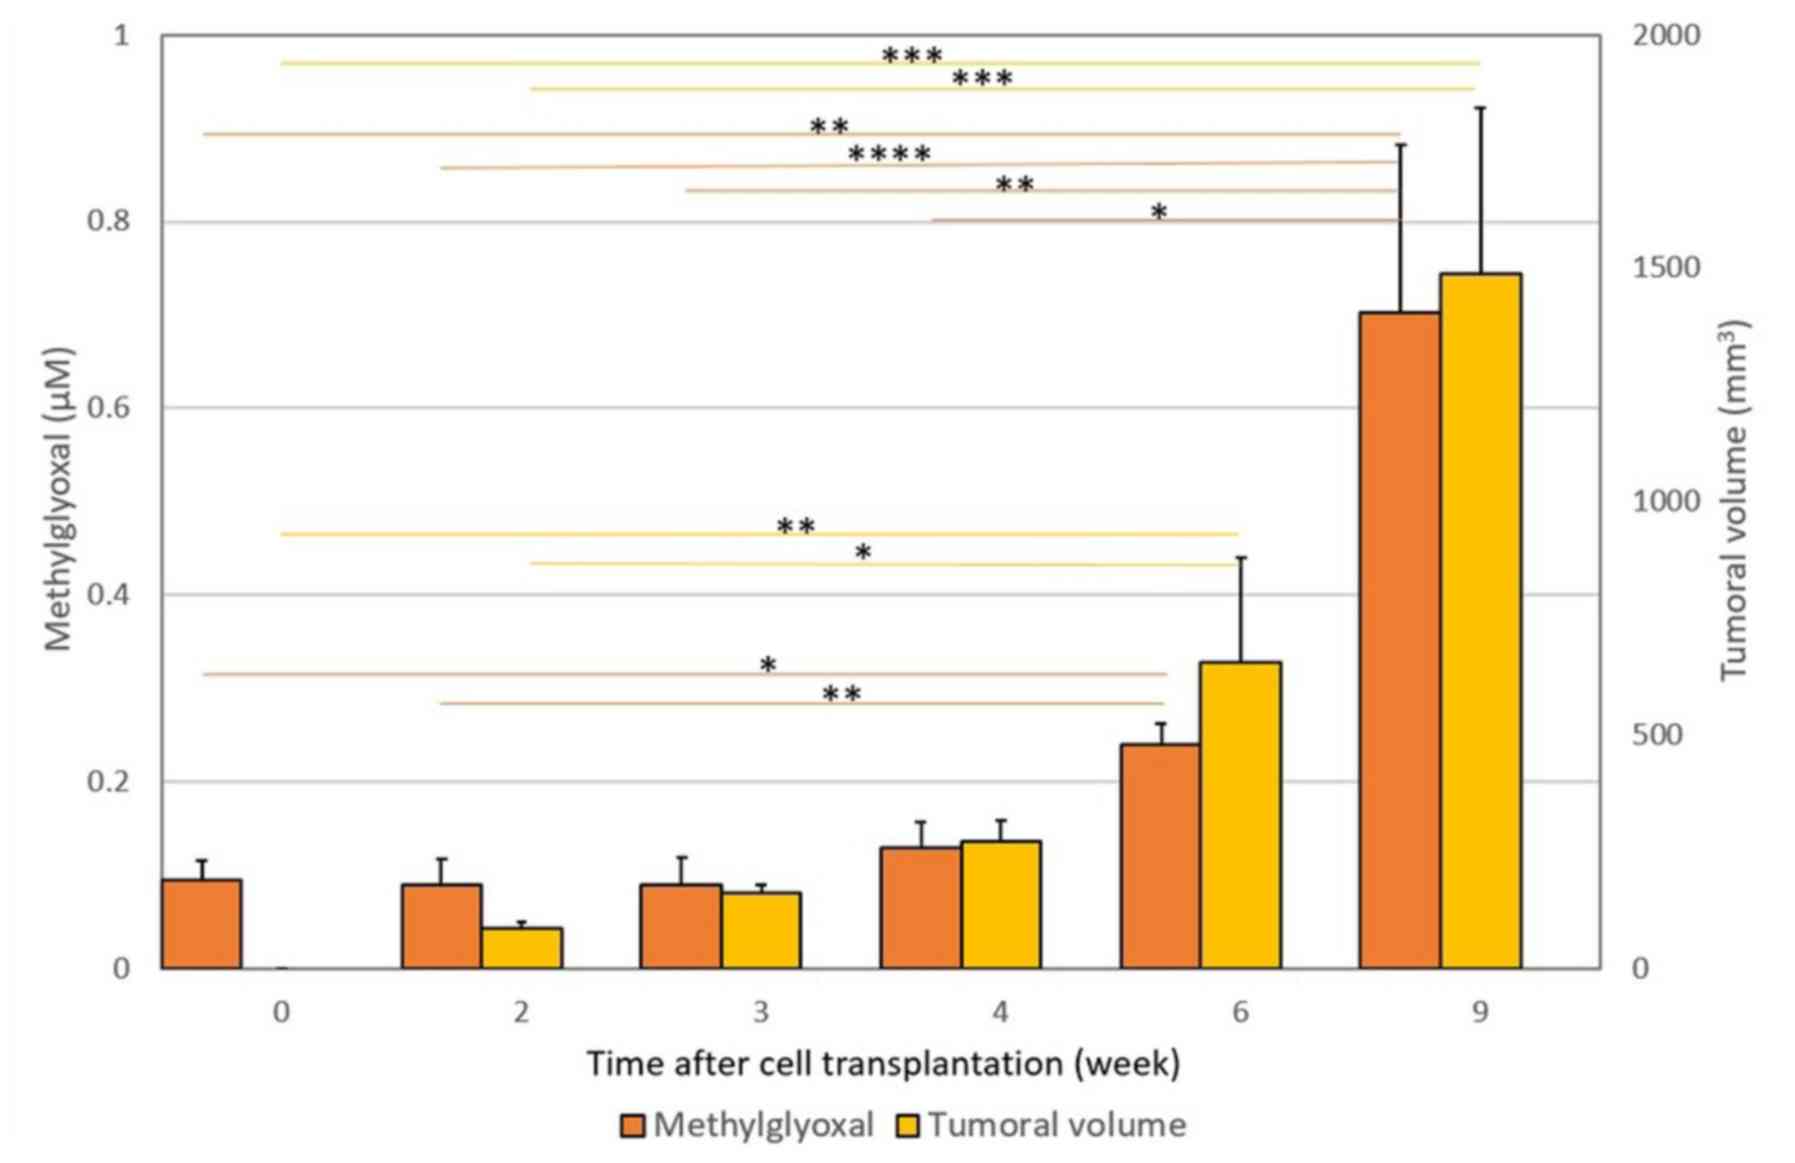 | Figure 2.Increase in free MG blood levels and
tumor volume (± SD) following PROb cell transplantation.
Subcutaneous injection of PROb cells into syngeneic BD-IX rats
allows the establishment of progressively growing tumors. A
significant 7-fold increase (P=0.003) in MG blood level was
observed. Free MG blood levels increased from 0.095±0.021 µM at T0,
to 0.703±0.178 µM at 9 weeks after transplantation.At each time
point, the measured tumor volume and the MG blood level obtained at
time T were compared with those obtained previously, i.e. T9 vs.
T6, T6 vs. T4, T4 vs. T3, T3 vs. T2 and T2 vs. T0. Horizontal bars
represent the significant statistical results obtained using
Friedman's test with Nemenyi post-hoc comparisons.
*P<0.05, **P<0.01,
***P<0.001,
****P<0.0001, as
indicated. PROb cells, tumorigenic clone cells; MG,
methylglyoxal. |
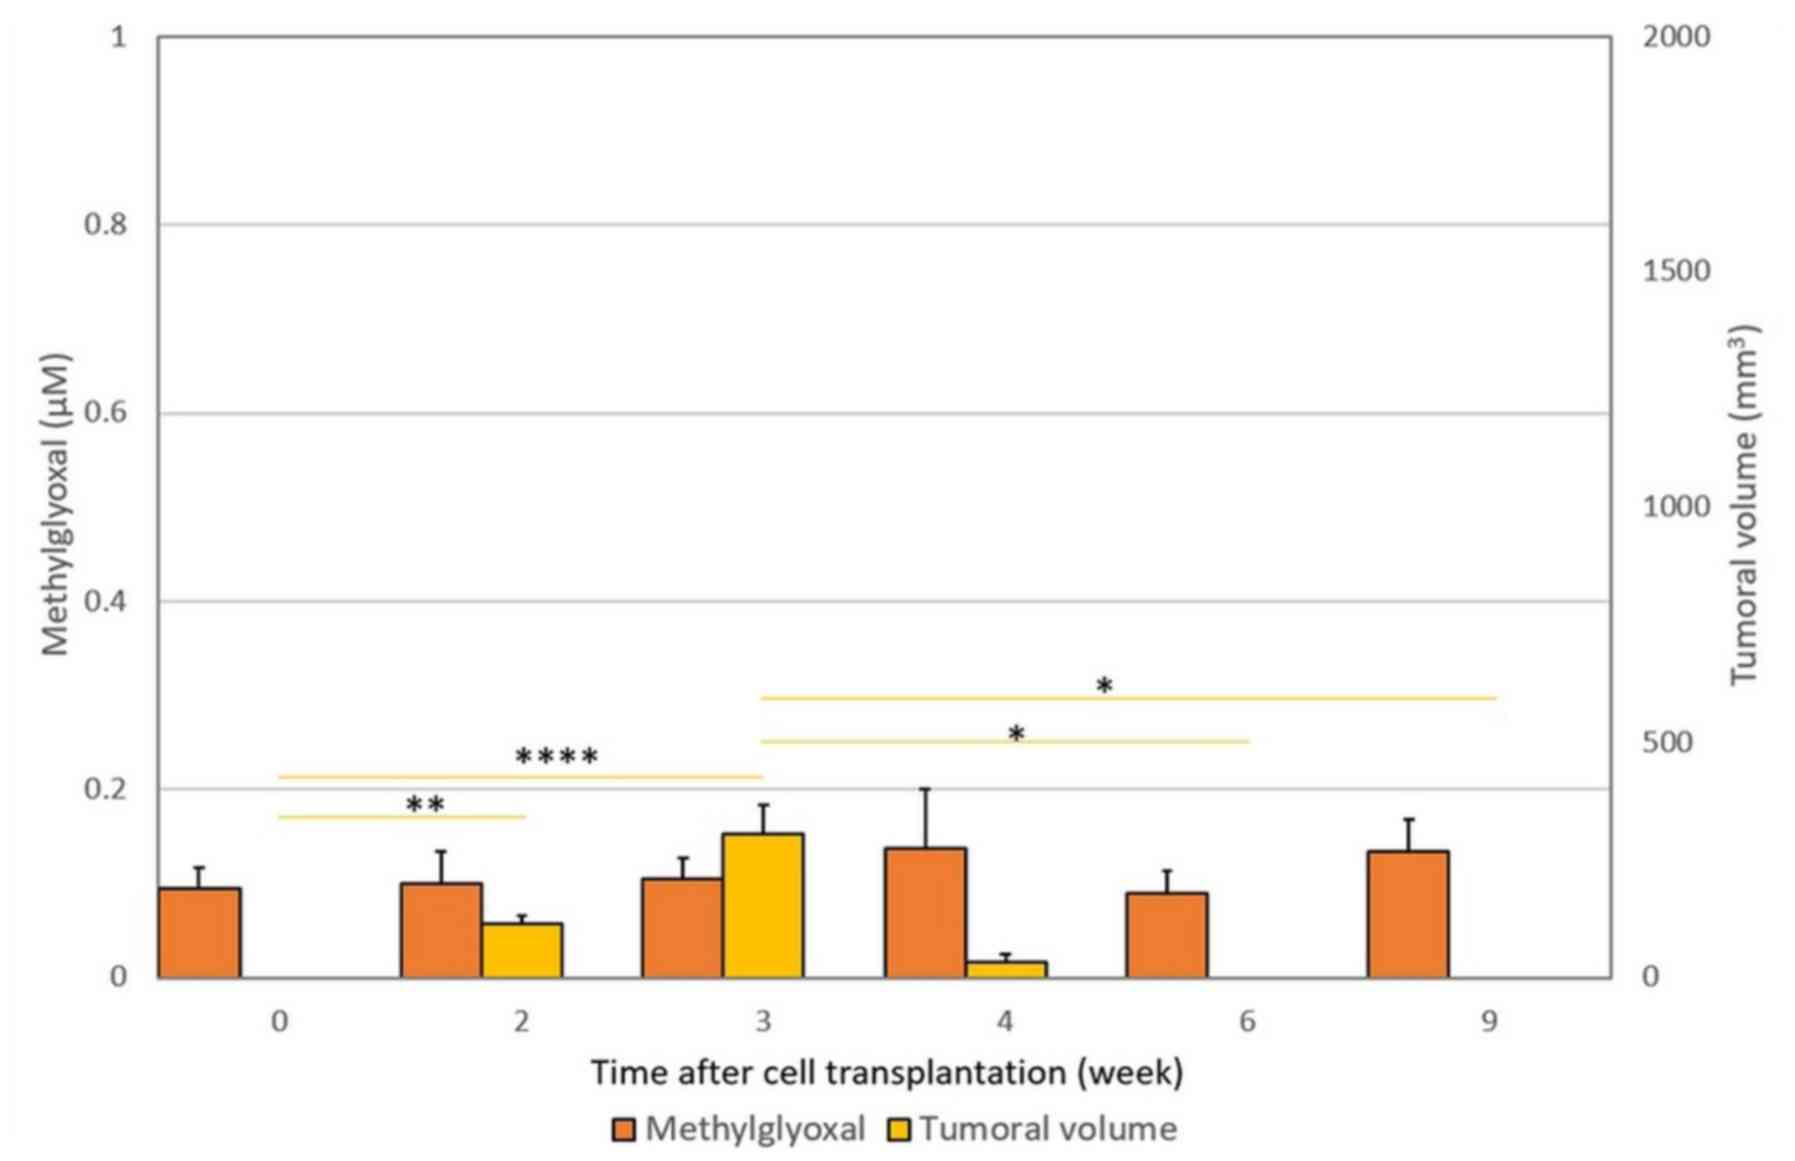 | Figure 3.Lack of change in free MG blood levels
and tumor volume (± SD) after REGb cell transplantation.
Subcutaneous injection of REGb cells into syngeneic BD-IX rats
resulted in complete rejection of measurable tumors at 4 weeks
after transplantation. The levels of free MG did not differ
significantly from normal T0 values during the entire experimental
study period (P=0.63). At each time point, the measured tumor
volume and the MG blood level obtained at time T were compared with
those obtained previously, i.e., T9 vs. T6, T6 vs. T4, T4 vs. T3,
T3 vs. T2 and T2 vs. T0. Horizontal bars represent the significant
statistical results obtained using the Friedman's test with Nemenyi
post-hoc comparisons. *P<0.05,
**P<0.01,
****P<0.0001, as
indicated. MG, methylglyoxal; REGb cells, non-tumorigenic clone
cells. |
Free MG blood levels
The results are depicted in Figs. 2 and 3. Rats having been grafted with PROb cells
had growing tumors and a statistically significant increase in free
MG blood levels in comparison with T0 values (P=0.003), whereas
rats transplanted with REGb cells were associated with tumor
rejection and no statistically significant increase in free MG
blood levels (P=0.863) (Figs. 2 and
3). For the rats grafted with the
growing tumor-associated PROb cells, MG levels varied from
0.095±0.021 µM at time T0 to 0.703±0.178 µM at week 9 after tumor
transplantation (Fig. 2). Also the
Pearson correlation statistical test showed a good statistical
correlation between free MG blood levels and tumour volume along
with tumor progression (P=0.0006).
Glucose blood levels
The results are depicted in Table I. It is worthy of note that during
the whole study period glucose concentrationremained normal and
that there was no statistical correlation between free MG levels
and glucose concentration in the blood with the Pearson correlation
statistical test (P=0.476).
 | Table IGlucose measurement in blood of rats
with progressive tumor (PROb clone). |
Table I
Glucose measurement in blood of rats
with progressive tumor (PROb clone).
| | Glucose (mmol/l) ±
SD |
|---|
| Sex | T0 | T4 | P-valuea | T6 | P-valueb | T9 | P-valuec |
|---|
| Male (n=9) | 11.58±1.42 | 13.23±1.17 | 0.82 | 11.50±0.98 | 0.97 | 10.67±1.63 | 0.87 |
| Female (n=9) | 11.51±0.66 | 14.35±1.68 | 0.27 | 11.99±1.73 | 0.85 | 11.86±1.23 | 0.82 |
| Total (n=18) | 11.54±0.62 | 13.74±1.06 | 0.17 | 11.75±0.98 | 0.92 | 11.26±1.00 | 0.93 |
Discussion
We used an already described free MG dosage method
(11) adapted from Chaplen et
al (13) and Rabbani and
Thornalley (14) but using whole
blood instead of plasma, and TFA instead of trichloroacetic acid as
precipitating agent. We also did not add sodium azide because
according to the method we used we did not find any statistically
significant difference with or without this anti-peroxidase agent.
In any case our results are presented in comparison with normal T0
values.
We showed that after grafting BD-IX rats with PROb
tumorigenic cancer cells, there was a clear statistically
significant increase in free MG blood levels and a statistically
positive correlation between free MG blood levels and tumor volume;
whereas for rats transplanted with cells of the REGb non-growing
tumor-associated clone, for which the tumor graft did not take,
there was a low free MG blood levels not differing statistically
from normal levels.
In this experimental study we have showed for the
first time that significantly increased blood levels of free MG are
associated with colon cancer progression. Although it has been
established that cancer development may be associated with the
increased formation of MG-derived intracellular advanced glycation
end-products (AGE) (15,16), only one publication was specifically
devoted to the measurement of MG in cancer animals (17); and more recently, only one in cancer
patients, in which it was shown that MG may have cancer promoting
properties (18). We emphasize that
there was no previous reported study on free MG level measurement
in cancer animals or cancer patients. By contrast, contrary to what
we showed in this paper, it has been claimed that high dose
external MG could inhibit cancer cell growth in vitro
(19), a finding which has never
been confirmed clinically. These different considerations may
explain why the results we obtained in the present study and those
we provided in vitro by studying MG production and release
by cancer cells in cell culture (part 2 of our general study) and
in vivo, by showing that free MG can be clinically used as a
cancer biomarker (part 3 of our general study) have been considered
as new data and so have been patented (11).
A major point to discuss in our study deals with the
fact that free MG levels may have been increased through a putative
induction of hyperglycemia since it has been shown that free MG
levels can also be increased in the case of human type 2 diabetes
(20). Since we used a non-diabetic
rat model, this excludes a priori the possibility that the
observed increase in free MG blood levels was due to diabetes
(21). However since hyperglycemia
have been shown to be a risk factor for cancer progression
(22), we systematically measured
glucose in addition to MG in the blood of rats. As indicated in
Table I, glucose concentration in
rats with progressive tumors (clone PROb) remained normal during
the whole study period, a finding proving that the increase in free
MG was not caused by the existence of a tumor
progression-associated hyperglycemia. In the present study we did
not perform any molecular investigation of cancer cells nor any
immunohistochemistry study in tumor cell sections in an attempt to
prove that free MG really are produced by cancer cells. Such a lack
constitutes indeed some limitation of the hypothesis we propose
that free MG can be directly produced and released by cancer cells.
However such hypothesis has been validated in part 2 and 3 of our
three step general study (11) by
showing that cancer cell extracts contain a statistically
significant higher quantity of free MG in comparison with that of
non-cancer cells, a finding that has been demonstrated not only in
cell cultures but also clinically in patients (11). In the present study, as free MG blood
levels increase as the tumor progresses, and free MG blood levels
remain at normal values in the case of tumor rejection by
inflammatory and/or immune response, we therefore hypothesized that
free MG blood levels correlate positively with the number of cancer
cells in the tumor. Consequently, our data strongly suggest that
levels of circulating free MG may accurately reflect the metabolic
and proliferative capacity of cancer cells. An explanation could be
that MG is normally detoxified by the GLO-I and GLO-II glyoxalase
system up to a threshold concentration (23) (Fig.
1). Although GLO-I activity has been shown to be increased in
many human cancers (17,24-27)
and particularly in aggressive tumors (24,25),
GLO-II activity is generally lower (26,27).
This means that in comparison with normal cells, cancer cells may
be less capable of detoxifying intracellular free MG and so be less
capable of recovering normal GSH concentration (Fig. 1). This could explain why an increase
of both carbonyl stress and oxidative stress (28) is associated with tumor promotion and
progression (29); and why,
depending on the free radical concentration in cancer cells
(28), there is an increased degree
of intra-tumoral apoptosis/necrosis as the tumor progresses
(7). A further limitation of our
study is that we could not measure any cancer blood marker to
determine precisely the growth of the tumor, due to the fact that
to our knowledge such cancer marker has not been previously
identified in this rats model. However since MG is a cancer-unique
yet ubiquitous glycolysis-associated molecule that is produced and
released from many different types of cells, including
microorganisms (30) and mammalian
cells (31), we propose that the
experimental data obtained from this rat colon cancer model may be
extended to other cancer types, and more particularly to human
cancers. This is what our forthcoming clinical data (part 3 of our
general study) will prove by showing that MG is a putative new
metabolic biomarker of malignant tumors that could be used
routinely for early detection and follow-up of patients and for
therapeutic decision making (11).
Acknowledgements
The authors would like to thank Dr. Bernard
Bonnotte, Ms. Malika Trad and Ms. Jennifer Fraszczak from CHU
Dijon-Bocage, Médecine interne et Immunologie Clinique (Dijon,
France) for the high quality of the animals experiments, Dr. Sylvie
Barbier and Mr. Clément Poletti from Bioavenir Laboratory (Metz,
France) for the high quality of the blood analysis, and Mr. Tony
Tweedale from R.I.S.K. (RebuttingIndustry Science with Knowledge;
Brussels, Belgium) for his review and valuable comments on an early
draft.
Funding
The present study received a grant from the ARTAC
(grant no. BM2706/05).
Availability of data and materials
The datasets used and/or analyzed during the current
study are available from the corresponding author on reasonable
request.
Authors' contributions
DB and PI conceived and designed the analysis,
contributed data or analysis tools and performed the analysis. PI
collected the data. Both authors wrote, read and approved the final
version of the manuscript.
Ethics approval and consent to
participate
Parts of the study using animals were performed at
the animal facility of the University Hospital of Dijon and the
Research Unit U1098 of the French Institute of Health and Medical
Research (Inserm U1098) with the ethical approval of the ‘Comité
d'Ethique de l'ExpérimentationAnimale Grand Campus Dijon’.
Patient consent for publication
Not applicable.
Competing interests
The authors declare that they have no competing
interests. This study is part of the patent PCT/EP2013/072459
(Inventors, DB and PI; Status: national phase; the fact that free
methylglyoxal blood level increases with the development of the
tumor is covered by this patent).
References
|
1
|
Ludwig JA and Weinstein JN: Biomarkers in
cancer staging, prognosis and treatment selection. Nat Rev Cancer.
5:845–856. 2005.PubMed/NCBI View
Article : Google Scholar
|
|
2
|
Henry NL and Hayes DF: Cancer biomarkers.
Mol Oncol. 6:140–146. 2012.PubMed/NCBI View Article : Google Scholar
|
|
3
|
Irigaray P and Belpomme D: Basic
properties and molecular mechanisms of exogenous chemical
carcinogens. Carcinogenesis. 31:135–148. 2010.PubMed/NCBI View Article : Google Scholar
|
|
4
|
Belpomme D, Irigaray P, Hardell L, Clapp
R, Montagnier L, Epstein S and Sasco AJ: The multitude and
diversity of environmental carcinogens. Environ Res. 105:414–429.
2007.PubMed/NCBI View Article : Google Scholar
|
|
5
|
Warburg O: On the origin of cancer cells.
Science. 123:309–314. 1956.PubMed/NCBI View Article : Google Scholar
|
|
6
|
Kim A: Mitochondria in cancer energy
metabolism: Culprits or bystanders? Toxicol Res. 31:323–330.
2015.PubMed/NCBI View Article : Google Scholar
|
|
7
|
Hanahan D and Weinberg RA: Hallmarks of
cancer: The next generation. Cell. 144:646–674. 2011.PubMed/NCBI View Article : Google Scholar
|
|
8
|
Lopez J and Tait SW: Mitochondrial
apoptosis: Killing cancer using the enemy within. Br J Cancer.
112:957–962. 2015.PubMed/NCBI View Article : Google Scholar
|
|
9
|
Peretó J: Embden-meyerhof-parnas pathway.
In: Encyclopedia of Astrobiology. Amils R, Cernicharo Quintanilla,
J, Cleaves HJ, Irvine WM, Pinti D and Viso M (eds). Springer,
Berlin, Heidelberg, 2014.
|
|
10
|
Thornalley PJ: Pharmacology of
methylglyoxal: Formation, modification of proteins and nucleic
acids, and enzymatic detoxification-a role in pathogenesis and
antiproliferative chemotherapy. Gen Pharmacol. 27:565–573.
1996.PubMed/NCBI View Article : Google Scholar
|
|
11
|
Belpomme D and Irigaray P: Methylglyoxal
as a marker of cancer. Patent PCT/EP2013/072459. Filed: October 25,
2013; issued October 25, 2017.
|
|
12
|
Martin F, Caignard A, Jeannin JF, Leclerc
A and Martin M: Selection by trypsin of two sublines of rat colon
cancer cells forming progressive or regressive tumors. Int J
Cancer. 32:623–627. 1983.PubMed/NCBI View Article : Google Scholar
|
|
13
|
Chaplen FW, Fahl WE and Cameron DC:
Detection of methylglyoxal as a degradation product of DNA and
nucleic acid components treated with strong acid. Anal Biochem.
236:262–269. 1996.PubMed/NCBI View Article : Google Scholar
|
|
14
|
Rabbani N and Thornalley PJ: Measurement
of methylglyoxal by stable isotopic dilution analysis LC-MS/MS with
corroborative prediction in physiological samples. Nat Protoc.
9:1969–1979. 2014.PubMed/NCBI View Article : Google Scholar
|
|
15
|
Turner DP: Advanced glycation
end-products: A biological consequence of lifestyle contributing to
cancer disparity. Cancer Res. 75:1925–1929. 2015.PubMed/NCBI View Article : Google Scholar
|
|
16
|
Schröter D and Höhn A: Role of advanced
glycation end products in carcinogenesis and their therapeutic
implications. Curr Pharm Des. 24:5245–5251. 2018.PubMed/NCBI View Article : Google Scholar
|
|
17
|
Matsuura T, Owada K, Sano M, Saito S,
Tomita I and Ikekawa T: Studies on methylglyoxal. II. Changes of
methylglyoxal level accompanying the changes of glyoxalase I and II
activities in mice bearing L1210 leukemia and sarcoma 180. Chem
Pharm Bull. 34:2926–2930. 1986.PubMed/NCBI View Article : Google Scholar
|
|
18
|
Antognelli C, Moretti S, Frosini R,
Puxeddu E, Sidoni A and Talesa VN: Methylglyoxal acts as a
tumor-promoting factor in anaplastic thyroid cancer. Cells.
8(E547)2017.PubMed/NCBI View Article : Google Scholar
|
|
19
|
Talukdar D, Ray S, Ray M and Das S: A
brief critical overview of the biological effects of methylglyoxal
and further evaluation of a methylglyoxal-based anticancer
formulation in treating cancer patients. Drug Metabol Drug
Interact. 23:175–210. 2008.PubMed/NCBI View Article : Google Scholar
|
|
20
|
Beisswenger PJ, Howell SK, Touchette AD,
Lal S and Szwergold BS: Metformin reduces systemic methylglyoxal
levels in type 2 diabetes. Diabetes. 48:198–202. 1999.PubMed/NCBI View Article : Google Scholar
|
|
21
|
Lapolla A, Flamini R, Dalla Vedova A,
Senesi A, Reitano R, Fedele D, Basso E, Seraglia R and Traldi P:
Glyoxal and methylglyoxal levels in diabetic patients: Quantitative
determination by a new GC/MS method. ClinChem Lab Med.
41:1166–1173. 2003.PubMed/NCBI View Article : Google Scholar
|
|
22
|
Ryu TY, Park J and Scherer PE:
Hyperglycemia as a risk factor for cancer progression. Diabetes
Metab J. 38:330–336. 2014.PubMed/NCBI View Article : Google Scholar
|
|
23
|
Honek JF: Glyoxalase biochemistry. Biomol
Concepts. 6:401–414. 2015.PubMed/NCBI View Article : Google Scholar
|
|
24
|
Zhang D, Tai LK, Wong LL, Chiu LL, Sethi
SK and Koay ES: Proteomic study reveals that proteins involved in
metabolic and detoxification pathways are highly expressed in
HER-2/neu-positive breast cancer. Mol Cell Proteomics. 4:1686–1696.
2005.PubMed/NCBI View Article : Google Scholar
|
|
25
|
Chiavarina B, Nokin MJ, Durieux F, Bianchi
E, Turtoi A, Peulen O, Peixoto P, Irigaray P, Uchida K, Belpomme D,
et al: Triple negative tumors accumulate significantly less
methylglyoxal specific adducts than other human breast cancer
subtypes. Oncotarget. 5:5472–5482. 2014.PubMed/NCBI View Article : Google Scholar
|
|
26
|
Hutschenreuther A, Bigl M, Hemdan NY,
Debebe T, Gaunitz F and Birkenmeier G: Modulation of GLO1
expression affects malignant properties of cells. Int J Mol.
17(pii: E2133)2016.PubMed/NCBI View Article : Google Scholar
|
|
27
|
Antognelli C, Baldracchini F, Talesa VN,
Costantini E, Zucchi A and Mearini E: Overexpression of glyoxalase
system enzymes in human kidney tumor. Cancer J. 12:222–228.
2006.PubMed/NCBI View Article : Google Scholar
|
|
28
|
Kalapos MP: The tandem of free radicals
and methylglyoxal. ChemBiol Interact. 171:251–271. 2008.PubMed/NCBI View Article : Google Scholar
|
|
29
|
Dreher D and Junod AF: Role of oxygen free
radicals in cancer development. Eur J Cancer. 32A:30–38.
1996.PubMed/NCBI View Article : Google Scholar
|
|
30
|
Inoue Y and Kimura A: Methylglyoxal and
regulation of its metabolism in microorganisms. Adv Microb Physiol.
37:177–227. 1995.PubMed/NCBI View Article : Google Scholar
|
|
31
|
Kalapos MP: Methylglyoxal in living
organisms: Chemistry, biochemistry, toxicology and biological
implications. Toxicol Lett. 110:145–175. 1999.PubMed/NCBI View Article : Google Scholar
|