Introduction
Prostate cancer (PCa) is the second most common
cancer in the male population, with a prevalence of 59% (48-71%) in
men over 79 years of age (1). The
incidence of PCa diagnosis varies widely between different
geographic areas, reaching peaks in Australia/New Zealand, North
America and Western and Northern Europe. The greater incidence in
these geographical areas is largely due to the use of prostate
specific antigen (PSA) and the aging of the population. On the
contrary, the incidence is low in eastern and central-southern Asia
while the rates in eastern and southern Europe, once low, show a
steady increase (2,3). PCa mortality rates are generally high
in populations of African descent, intermediate in the United
States and very low in Asia (2).
Having no symptoms except in very advanced stages
(such as hematuria and urinary obstruction), PCa is usually
suspected on the result of rectal examination (DRE) and/or PSA
level. The definitive diagnosis is histopathological in prostate
biopsy specimens or from pathological pieces resulting from
surgical treatment for benign prostatic hypertrophy.
The increase in the incidence of PCa, in the
presence of a family history or a racial background, suggests a
genetic predisposition (4,5). However, only a small subpopulation of
men with PCa truly have a hereditary disease, defined as three or
more affected relatives or at least two relatives who have
developed early-onset PCa (<55 years) (5). Although the disease is diagnosed six
to seven years earlier than average, the aggression and the
clinical course do not seem to differ (5,6). On
the contrary, in men of African origin there is a higher incidence
of disease with a generally more aggressive course (7). Genomic studies have identified 100
susceptibility loci contributing to the risk of PCa, explaining
approximately 39% of the familial risk for this disease (8,9). In
addition, a 12% incidence of germline mutations in genes that
mediate DNA repair processes was found among men with metastatic
disease (10). Germinal mutations
in genes such as BRCA 1/2 and HOXB13 have been associated with an
increased risk of PCa (11,12).
Numerous exogenous/environmental factors have been
associated with the risk of developing PCa or discussed as
etiologically important for progression from latent to clinically
significant disease (13). A study
of Japanese men showed a lower risk of PCa than men in the Western
world. However, after moving to California, their risk of PCa
increased, becoming similar to that of American men, implying an
involvement of environmental or dietary factors (14). In this regard, it is very important
to assess the role of obesity which is an increasing health
problem; it affects more than 300 million people worldwide
(15). In epidemiological and
basic research studies, obesity has been repeatedly linked to the
development of different cancers (16,17).
As a cancer risk factor, obesity is second only to tobacco
consumption (18) and is linked to
increased mortality from all cancers, including PCa (19).
Among the reasons for cancer-related deaths are
obesity-mediated delays in diagnosis (due to the insufficiencies of
our testing) and the underestimation of disease severity due to
obesity. The obesity-mediated delay in PCa diagnosis is due to the
relative association between obesity and lower PSA
(prostate-specific antigen) levels found in this category of
patients (20-28).
It is possible that this inverse association is due to hemodilution
along with increased blood volume and lower testosterone levels in
obese patients (29). Moreover,
several studies have argued that obesity is a possible impediment
to cancer screening in general (30-32).
Thus, obese patients are affected by occult locally advanced
disease, even with relatively low PSA levels, stage for stage
(33,34). Several studies in Western
populations have shown that progression and prognosis in PCa, which
causes more than a quarter of a million deaths worldwide every year
(35), are inversely correlated
with the patient's body mass index (36,37).
For example, in a study that involved a free prostate screening
program in North Carolina, Price et al (28) found that PSA and body mass index
were inversely related. Since then, however, several reports have
shown conflicting results. Some studies have not found associations
(38-40),
but most have suggested an inverse relationship between BMI and PSA
(20-28).
A previous meta-analysis showed an association of a BMI over 30
with a 15 and 37% higher risk of PCa and high-grade PCa detection,
respectively, at biopsy (41). In
addition, MacInnis and English (42), in their meta-analysis and
systematic review involving 31 cohort and 25 case-control studies,
found that BMI was a weak, but statistically significant, predictor
of tumor risk (relative risk: 1.05 per 5 kg/m2
increment; 95% confidence interval: 1.01-1.08).
To further investigate the relationship between BMI
and PCa and HGPCa detection at biopsy in a Western population, we
conducted a retrospective analysis not only of BMI but also of PCa
and high-grade PCa risk at biopsy. The impact of this study could
be extensive, as revealing the true impact of BMI on biopsy results
could be helpful for current PCa screening strategies for patients
with different body weights. We supposed that, after controlling
for clinical characteristics, we would find not only an inverse
association between the prebiopsy PSA level and the BMI but also a
significant direct relationship between PCa risk and BMI.
Patients and methods
Study population and study
variables
Once patients gave informed consent for us to obtain
their clinical data before their biopsies, we retrospectively
reviewed the clinical data of 2372 consecutive patients undergoing
transrectal ultrasound (TRUS)-guided initial multicore (≥10)
prostate biopsies between May 2010 and December 2018 at Department
of Urology of Umberto I Hospital in Nocera Inferiore. The biopsy
indications included three conditions: (1) elevated PSA levels (≥4 ng/ml);
(2) digital rectal examination
(DRE) findings suggestive of malignancy; and (3) both. All the multicore needle biopsies
were performed under TRUS guidance. The exclusion criteria were as
follows: (1) previous prostate
biopsy, (2) prostate surgery,
(3) current or previous therapy
with 5-alpha-reductase inhibitors, and (4) a known diagnosis of PCa. Additionally,
patients with unavailable BMI data, dates of birth or Gleason
scores were also excluded, leaving a total study population of
1,079 patients. All the men showed at least one measured serum PSA
level and underwent DRE. Data on age, pre-biopsy BMI, pre-treatment
PSA, DRE, diagnostic imaging and pathological results of prostate
biopsy were collected retrospectively. The BMI (kg/m2)
was calculated as weight in kilograms divided by height in meters
squared. All the men were divided into four groups depending on
their BMIs, which were calculated according to the criteria and
classification of obesity in Western countries as follows:
underweight (<18.5 kg/m2), normal weight (18.5-24.99
kg/m2), overweight (25-30 kg/m2), and obese
(>30 kg/m2). Prostate biopsy was performed
transrectally and guided by ultrasound, with the patient placed in
the left lateral position. The prostate volume was measured using
the ellipsoid formula. A 12-core or 20-core systematic biopsy was
performed depending on the urologist's assessment of the prostate
volume and DRE findings. The core specimens were examined by an
expert pathologist in our institution. When diagnosed at biopsy,
PCa was scored according to the Gleason grading system as follows:
0 <GS ≤7 (3 + 4) indicated low-grade PCa (considered clinically
insignificant), while GS ≥7 (4 + 3) indicated high-grade PCa
(considered clinically significant).
Statistical analysis
Differences in the patients' characteristics (age,
BMI and PSA), overall PCa detection rate and HGPCa detection rate
across the BMI categories were evaluated. Normality was evaluated
from histograms and Shapiro-Wilks (SW) tests while uniformity of
variance was evaluated using Levene's test after which the analysis
proceeded in both parametric and non-parametric fashion using
one-way ANOVA (with Bonferroni correction as the post hoc test), or
Kruskal-Wallis and Dunn's test to determine the significance of the
observed variations in patients' characteristics. Correlation
between the patients' characteristics was evaluated using Pearson's
and Spearman's tests. The effect of BMI on the distribution of
patients undergoing biopsy was determined by the chi-squared
goodness of fit testing against a model distribution built from
data obtained from population surveys. In addition to linear and
rank-order correlation, multivariate logistic modeling was used to
determine the effect of the patients' characteristics on the biopsy
outcome. Modeling was divided in two groups: the first group of
models was performed on no cancer/cancer result, while the second
group of models was performed on PCa/HGPCa result provided that a
cancer is detected. Within each group a leave-one-out approach was
used to determine the impact of omitted characteristics on the
model's performance, which was described by means of area under
receiver operating characteristic curve (ROC AUC), sensitivity and
specificity. Since there were only four patients in the underweight
BMI category, these patients were neglected in the statistical
analyses because of their lower statistical significance.
Results
Patient BMI distribution vs. modeled
distribution
A BMI distribution under the hypothesis that BMI has
no effect on the probability of being included in the study was
calculated from data obtained from ISTAT for the population in the
Campania region. The model was weighed for the age of the patients
under observation and the number of patients in each year under the
study. The results from Chi squared goodness of fit testing are
reported in Table I and show that
there is a statistically significant difference between the
observed and modeled distributions with the obesity and overweight
categories that are over-represented in the sample and the
normal-weight category being under-represented.
 | Table INumber of patients per category in
modelled and observed cases and χ2 test results. |
Table I
Number of patients per category in
modelled and observed cases and χ2 test results.
| Parameter | Underweight | Normal-weight | Overweight | Obese |
|---|
| Expected patients
from model distribution, n (%) | 7 (0.7) | 375 (34.8) | 532 (49.3) | 164 (15.2) |
| Observed patients,
n (%) | 4 (0.4) | 318 (29.5) | 546 (50.6) | 211 (19.6) |
| Difference in
observed vs. modeled, % | -0.3 | -5.3 | +1.3 | +4.4 |
| χ2 test
statistic (P-value) | 10.46 (0.015) | | | |
Patient characteristics
The baseline characteristics of the overall study
population are presented in Table
II. For the 1,079 patients enrolled in this study, the median
age was 69.4 years, the median BMI was 26.4 kg/m2 and
the median PSA level was 7.6 ng/ml. In total, PCa was detected at
biopsy in 320 men (29.7%), while HGPCa was found in 218 men
(20.2%). It is worth noting that the patients affected by HGPCa
were not included in the evaluation of patients within the PCa
subgroup. Upon applying the aforementioned Western countries'
criteria for BMI categories, there were 4 (0.4%) underweight (UW)
patients, 318 (29.5%) normal-weight (NW) patients, 546 (50.6%)
overweight patients (OW) and 211 (19.6%) obese (OB) patients.
| Table IIClinical characteristics and results
of biopsy stratified by BMI. |
Table II
Clinical characteristics and results
of biopsy stratified by BMI.
| Variable | Overall | Underweight (BMI
<18.5) | Normal weight
(18.5≤ BMI <25) | Overweight (25≤ BMI
<30) | Obese (30≤
BMI) |
|---|
| Patients, n
(%) | 1,079 | 4 (0.4) | 318 (29.5) | 546 (50.6) | 211 (19.6) |
| BMI,
kg/m2 | | | | | |
|
Mean
(SD) | 27.0 (3.5) | 17.8 (0.7) | 23.5 (1.2) | 27.1 (1.4) | 32.5 (2.7) |
|
Median
(IQR) | 26.4
(24.6-29.1) | 18.0
(17.4-18.4) | 23.9
(22.8-24.4) | 27.0
(25.8-28.2) | 31.8
(30.9-33.3) |
|
Range | 16.9-50.4 | 16.9-18.4 | 18.9-24.9 | 25.0-29.8 | 30.0-50.4 |
| Age, years | | | | | |
|
Mean
(SD) | 69.4 (7.8) | 70.9 (6.8) | 70.2 (8.3) | 69.2 (7.7) | 68.1 (7.4) |
|
Median
(IQR) | 69.4
(63.8-75.4) | 72.0
(69.2-73.7) | 71.0
(65.5-76.6) | 68.5
(63.2-75.3) | 68.7
(63.2-73.4) |
|
Range | 42.9-93.5 | 61.7-78.0 | 42.9-93.5 | 44.7-88.2 | 51.1-86.1 |
| PSA, ng/ml | | | | | |
|
Mean
(SD) | 14.1 (35.1) | 22.6 (18.8) | 15.0 (45.6) | 14.3 (33.4) | 11.9 (15.9) |
|
Median
(IQR) | 7.6 (5.3-11.3) | 23.8
(10.4-36.0) | 7.9 (5.4-12.5) | 7.3
(5.25-10.7) | 8.15
(5.4-11.5) |
|
Range | 0.01-750 | 0.8-42 | 0.1-750 | 0.01-522 | 0.1-134 |
| PCa detected from
biopsy, n (%) | 320 (29.7) | 3(75) | 93 (29.3) | 161 (29.5) | 63 (29.9) |
| HGPCa detected from
biopsy, n (%) | 218 (20.2) | 0 (0) | 62 (19.5) | 110 (20.1) | 46 (21.8) |
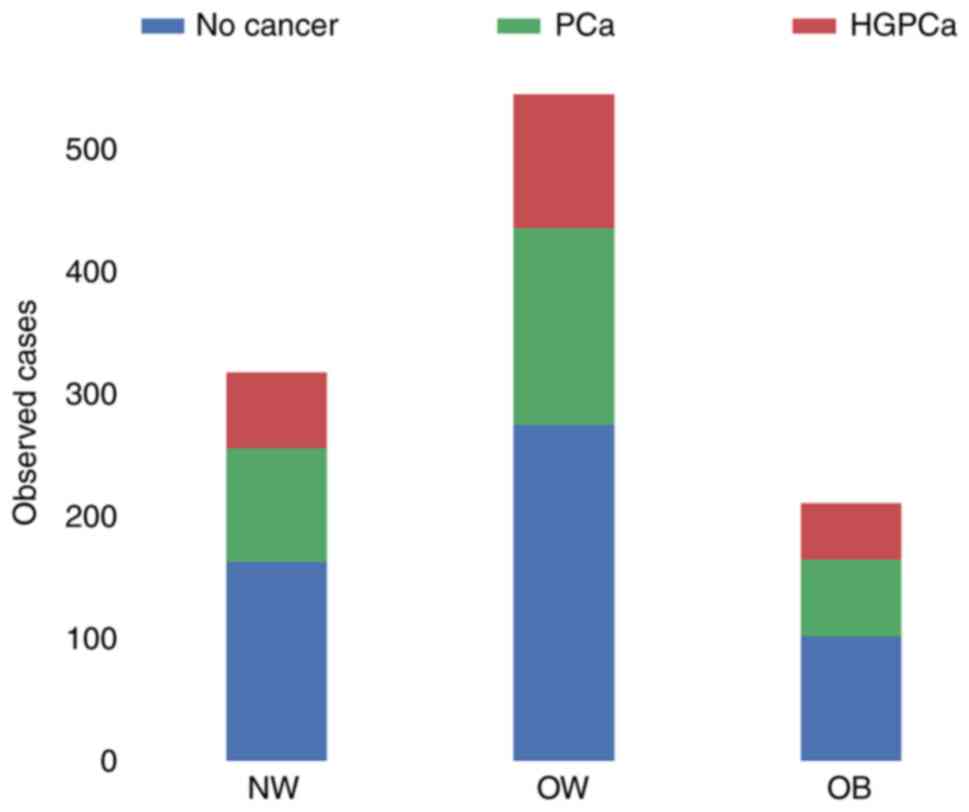
BMI and PCa detection
Fig. 1 shows the
risk of overall cancer detection at biopsy across the BMI
categories. The percentage of men diagnosed with PCa at biopsy was
75% in the underweight group, 29.3% in the normal-weight group,
29.5% in the overweight group and 29.9% in the obese group. With
regard to high-grade PCa, 0% of the underweight, 19.5% of the
normal-weight, 20.1% of the overweight and 21.8% of the obese men
were affected. In these cases, the percentages were calculated not
with respect to the total number of patients in each cancer class,
but with respect to the total number of patients in each BMI class.
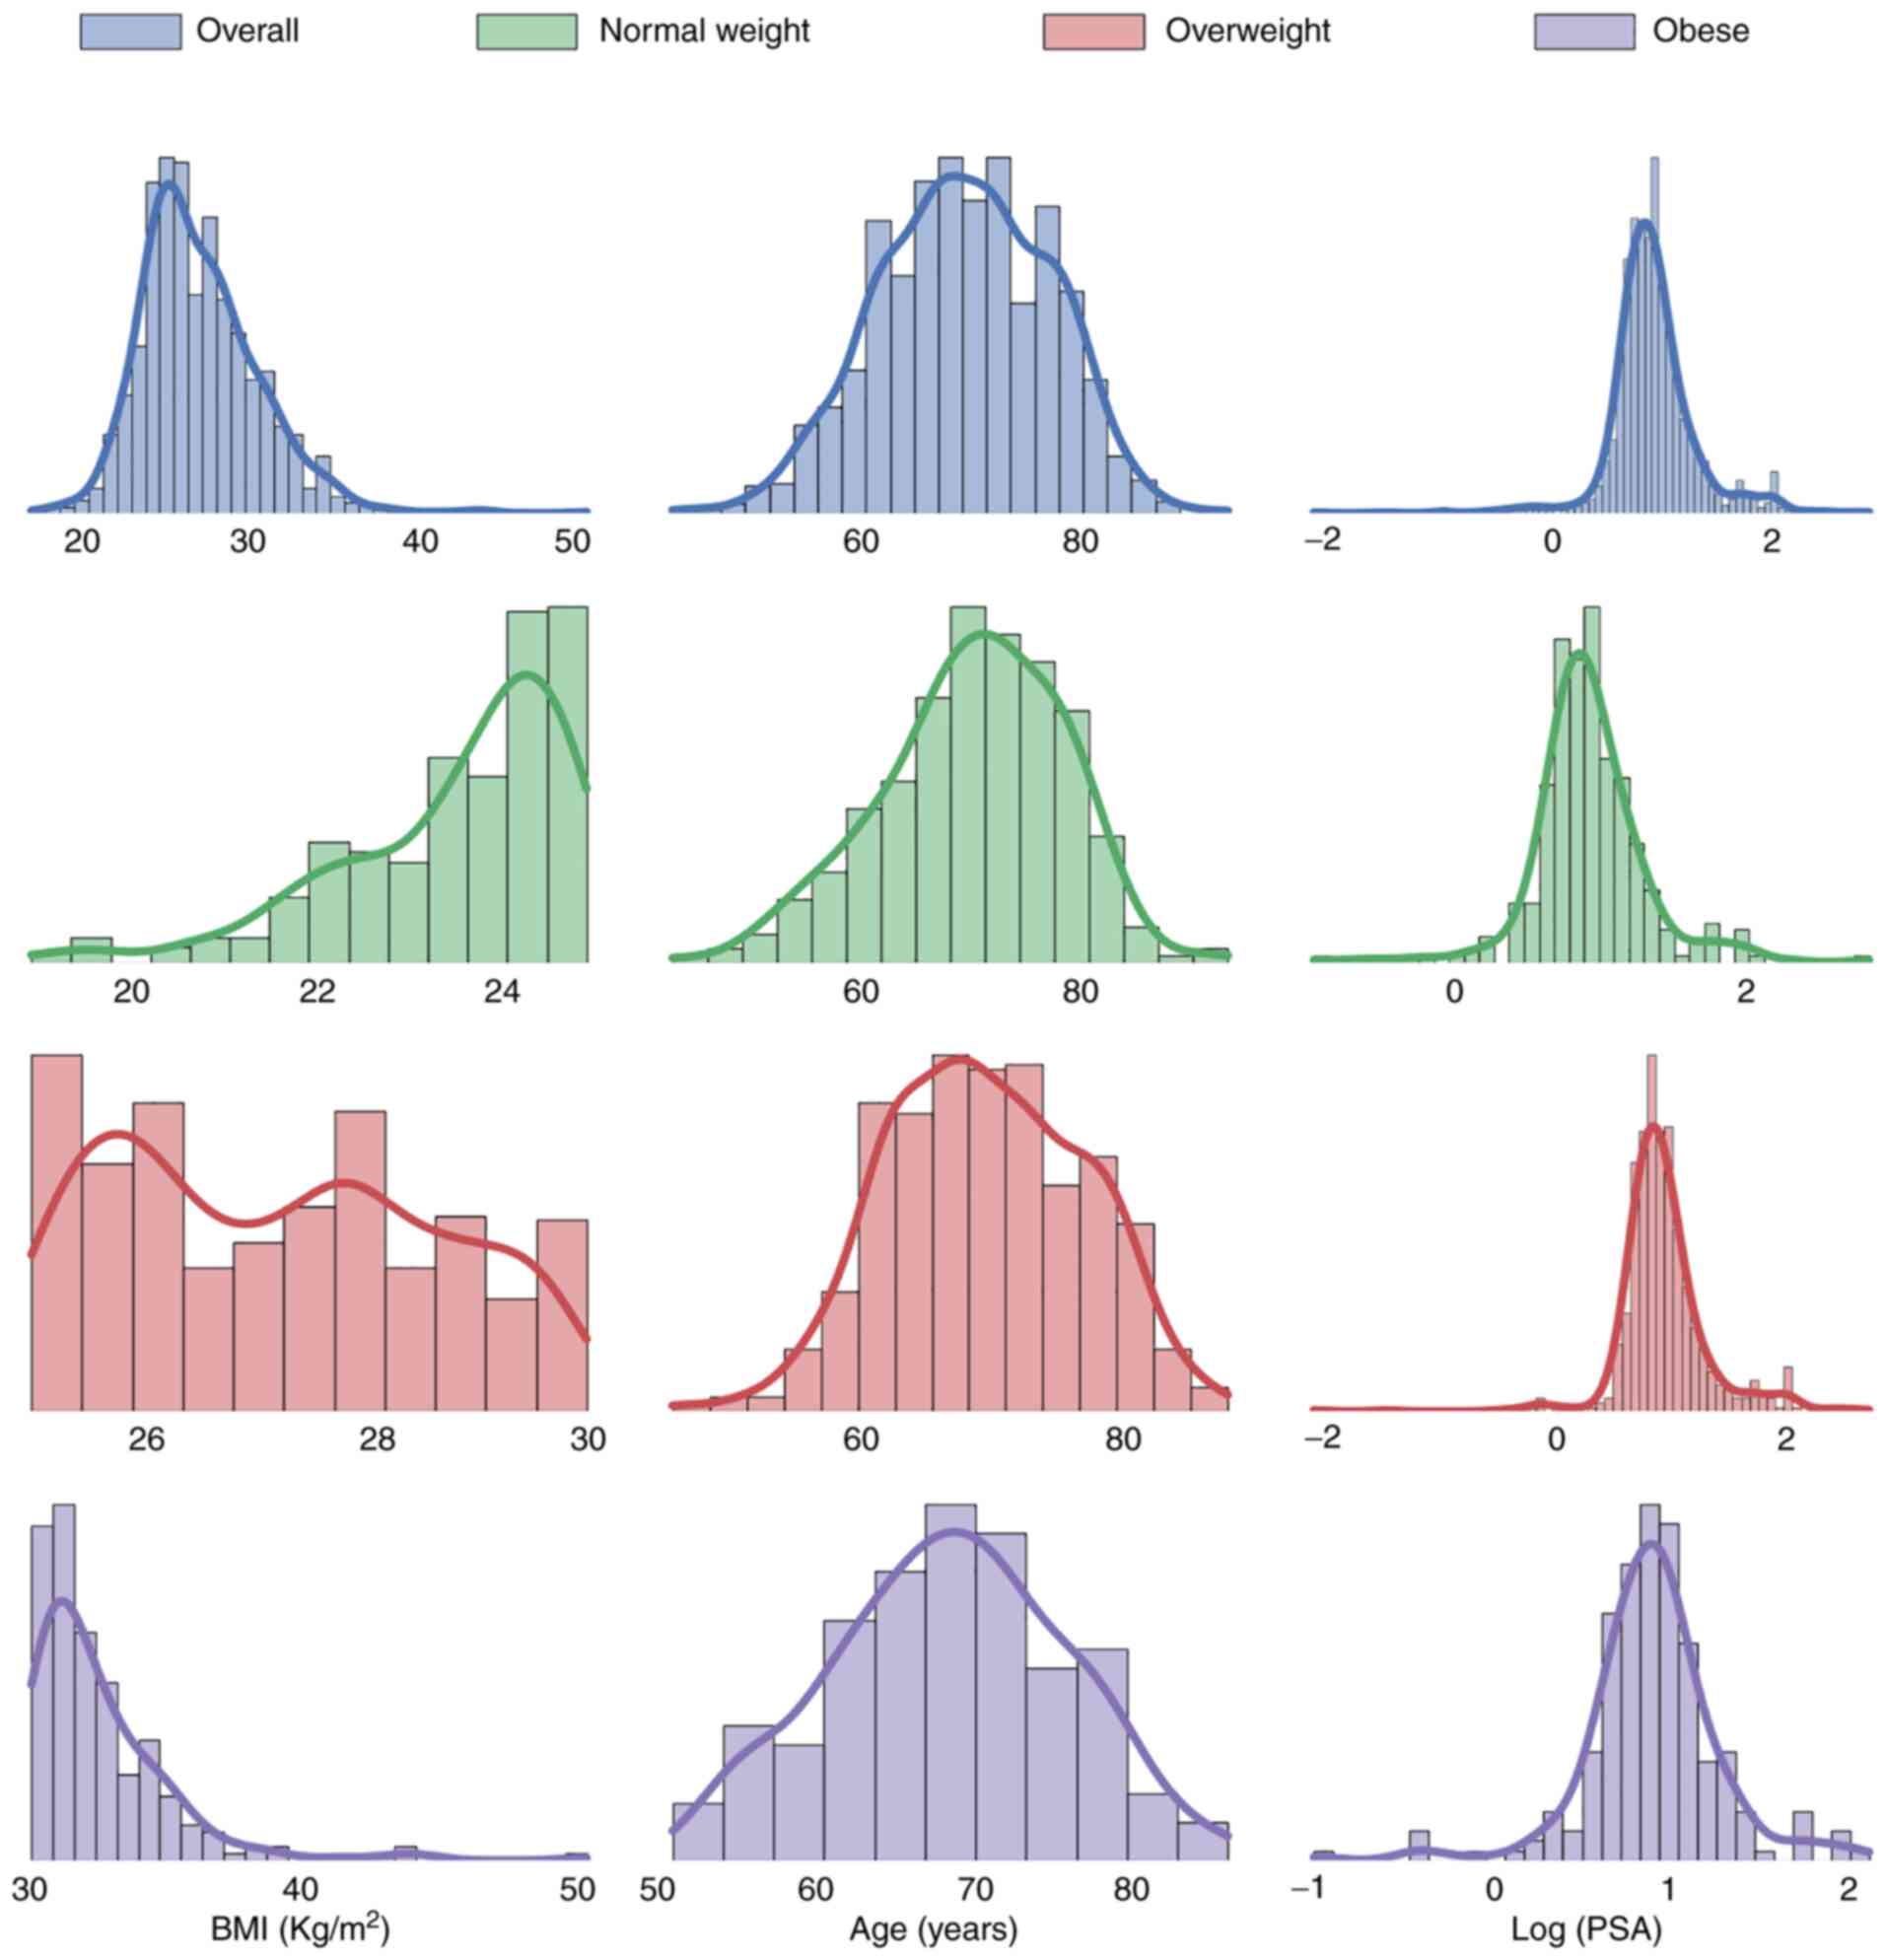
Histograms and kernel density estimates were calculated and are
plotted in Fig. 2. The plots show
the patients' characteristics overall and among BMI categories. Due
to the very wide range of values taken by PSA level a logarithmic
(log) transformation on this parameter was applied in order to
obtain a distribution closer to a gaussian. Shapiro-Wilk's (SW)
test, Levene's (L) test, one way ANOVA (OWA) test Kruskal-Wallis
(KW) and Dunn's test results are shown in Table III. Across the BMI categories,
the hypotheses of normal distribution could be rejected according
to the SW test in the NW and OW categories for age distribution and
in all the categories for log(PSA) distribution. Across all
categories, for age and log(PSA), the hypotheses of equal variances
could not be rejected. The OWA and KW/Dunn's tests indicated that
the obese men were younger than the normal-weight patients and this
result was statistically significant, as shown in Table III. PSA, analyzed as log(PSA),
did not return statistically significant differences across the
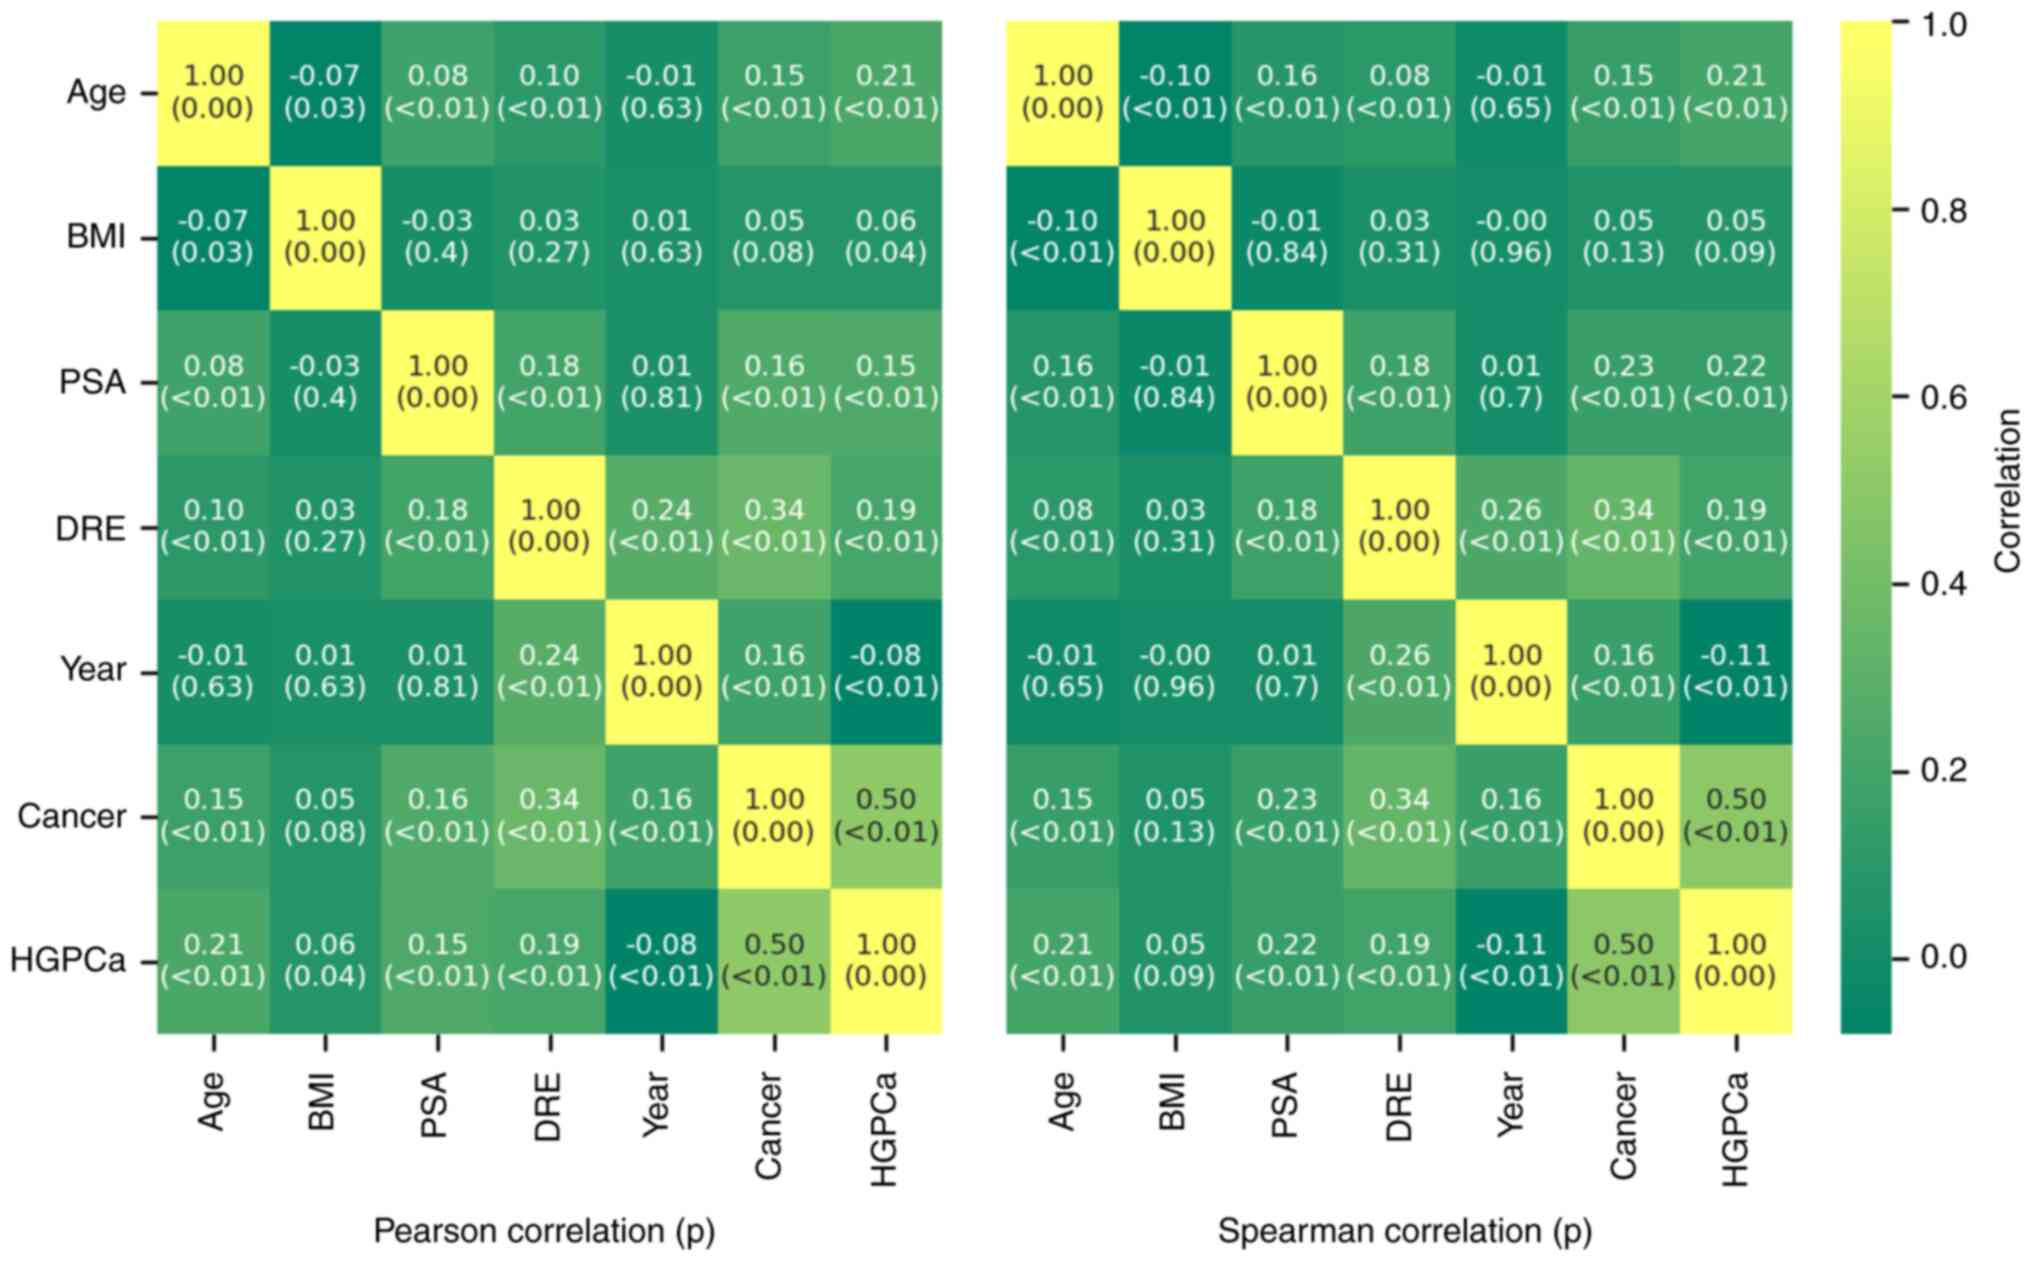
categories. Parameter correlation results given in Fig. 3 show that BMI has a very low
positive correlation with the cancer outcome and the HGPCa. PSA,
Age and DRE have a stronger correlation against the outcomes in
both cases. BMI has a very low negative correlation with age and
PSA while the inverse is true for DRE. The results are true both
under Pearson's test and under Spearman's.
| Table IIIShapiro-Wilks, Levene, one-way ANOVA,
Kruskal-Wallis and Dunn's test results across BMI categories. |
Table III
Shapiro-Wilks, Levene, one-way ANOVA,
Kruskal-Wallis and Dunn's test results across BMI categories.
| Test | Variable | Category | Test result
(P-value) |
|---|
| Shapiro-Wilks | Age | NW | 0.988 (0.011) |
| Shapiro-Wilks | Age | OW | 0.992 (0.009) |
| Shapiro-Wilk | Age | OB | 0.992 (0.300) |
| Shapiro-Wilks | log(PSA) | NW | 0.903
(<0.001) |
| Shapiro-Wilks | log(PSA) | OW | 0.832
(<0.001) |
| Shapiro-Wilks | log(PSA) | OB | 0.909
(<0.001) |
| Levene's | Age | NW vs. OW | 0.631 (0.427) |
| Levene's | Age | NW vs. OB | 2.188 (0.138) |
| Levene's | Age | OW vs. OB | 1.075 (0.300) |
| Levene's | log(PSA) | NW vs. OW | 0.631 (0.427) |
| Levene's | log(PSA) | NW vs. OB | 2.188 (0.138) |
| Levene's | log(PSA) | OW vs. OB | 1.075 (0.300) |
| One-way ANOVA | Age | NW vs. OW vs.
OB | 3.252 (0.039) |
| One-way ANOVA | log(PSA) | NW vs. OW vs.
OB | 0.107 (0.898) |
| One-way ANOVA,
Bonferroni post hoc | Age | NW vs. OW | 3.374 (0.200) |
| One-way ANOVA,
Bonferroni post hoc | Age | NW vs. OB | 5.775 (0.0498) |
| One-way ANOVA,
Bonferroni post hoc | Age | OW vs. OB | 1.177 (0.834) |
| Kruskal-Wallis | Age | NW vs. OW vs.
OB | 8.55 (0.014) |
| Kruskal-Wallis | log(PSA) | NW vs. OW vs.
OB | 1.687 (0.430) |
| Dunn's | Age | NW vs. OW | 0.065 |
| Dunn's | Age | NW vs. OB | 0.020 |
| Dunn's | Age | OW vs. OB | 0.984 |
Multiple logistic modeling of PCa and
HGPCa outcomes
The results obtained from logistic modeling are
shown in Table IV, Table V, Table VI and Table VII. In the cancer vs. no cancer
models the BMI parameter estimates are always positive when
included; however, omitting BMI, it does not have an effect on the
performance of the model. Model performance as determined by AUC
ROC is affected mostly by the removal of log(PSA) and DRE with a
simultaneous drop in specificity for the former and sensitivity for
the latter. In general, there is an increase in a cancer diagnosis
at biopsy with increasing BMI, PSA level, Age, Year of examination
and positive DRE findings. For the model discriminating between
HGPCa and PCa, given a cancer diagnosis, the results were in
general statistically more uncertain. In this case the model
indicated that the ratio of HGPCa/PCa was decreasing as the years
under study progressed and increased with an increase in BMI, age,
PSA level and positive DRE findings.
| Table IVParameter estimates and model
performance statistics from multiple logistic modeling for
prediction of cancer presence vs. absence. |
Table IV
Parameter estimates and model
performance statistics from multiple logistic modeling for
prediction of cancer presence vs. absence.
| Model | Intercept
(P-value) | BMI (P-value) | log(PSA)
(P-value) | Age (P-value) | DRE (P-value) | Year (P-value) | Median
residual | AUC ROC | Specificity (0.5
threshold) | Sensitivity (0.5
threshold) |
|---|
| Model 1 | -5.238
(<0.001) | 0.036 (0.064) | 1.321
(<0.001) | 0.034
(<0.001) | 1.385
(<0.001) | 0.153 (0.001) | 0.012 | 0.729 | 0.566 | 0.8 |
| Model 2 | -4.180
(<0.001) | Omitted | 1.319
(<0.001) | 0.033
(<0.001) | 1.390
(<0.001) | 0.153 (0.001) | 0.002 | 0.729 | 0.566 | 0.783 |
| Model 3 | -4.316
(<0.001) | 0.035 (0.065) | Omitted | 0.038
(<0.001) | 1.522
(<0.001) | 0.137 (0.003) | -0.144 | 0.701 | 0.508 | 0.8 |
| Model 4 | -2.793
(<0.001) | 0.030 (0.112) | 1.406
(<0.001) | Omitted | 1.412
(<0.001) | 0.144 (0.002) | 0.03 | 0.716 | 0.55 | 0.798 |
| Model 5 | -5.580
(<0.001) | 0.038 (0.040) | 1.512
(<0.001) | 0.037
(<0.001) | Omitted | 0.236
(<0.001) | 0.058 | 0.685 | 0.615 | 0.654 |
| Model 6 | -4.756
(<0.001) | 0.035 (0.065) | 1.289
(<0.001) | 0.033
(<0.001) | 1.493
(<0.001) | Omitted | 0.025 | 0.721 | 0.563 | 0.774 |
| Table VParameter estimates and model
performance statistics from multiple logistic modeling for
prediction of HGPCa vs. PCa conditional on cancer being
present. |
Table V
Parameter estimates and model
performance statistics from multiple logistic modeling for
prediction of HGPCa vs. PCa conditional on cancer being
present.
| Model | Intercept
(P-value) | BMI (P-value) | log(PSA)
(P-value) | Age (P-value) | DRE (P-value) | Year (P-value) | Median
residual | AUC ROC | Specificity (at 0.5
threshold) | Sensitivity (at 0.5
threshold) |
|---|
| Model 7 | -4.319
(<0.001) | 0.025 (0.311) | 0.562 (0.015) | 0.048
(<0.001) | 0.248 (0.229) | -0.285
(<0.001) | -0.718 | 0.675 | 0.313 | 0.856 |
| Model 8 | -3.549
(<0.001) | Omitted | 0.565 (0.015) | 0.044 (0.001) | 0.256 (0.215) | -0.285
(<0.001) | -0.728 | 0.676 | 0.294 | 0.871 |
| Model 9 | -4.058
(<0.001) | 0.026 (0.295) | Omitted | 0.049
(<0.001) | 0.371 (0.062) | -0.296
(<0.001) | -0.730 | 0.66 | 0.294 | 0.880 |
| Model 10 | -0.975 (0.176) | 0.016 (0.517) | 0.668 (0.004) | Omitted | 0.272 (0.181) | -0.295
(<0.001) | -0.760 | 0.654 | 0.229 | 0.913 |
| Model 11 | -4.412
(<0.001) | 0.026 (0.289) | 0.632 (0.005) | 0.045
(<0.001) | Omitted | -0.260
(<0.001) | -0.718 | 0.671 | 0.328 | 0.874 |
| Model 12 | -5.117
(<0.001) | 0.024 (0.330) | 0.636 (0.006) | 0.047
(<0.001) | -0.034 (0.857) | Omitted | -0.787 | 0.639 | 0.199 | 0.892 |
| Table VIConfidence intervals (95%) for the
variable coefficients estimated by the logistic regression models
for prediction of cancer presence vs. absence. |
Table VI
Confidence intervals (95%) for the
variable coefficients estimated by the logistic regression models
for prediction of cancer presence vs. absence.
| Model | Intercept | BMI | log(PSA) | Age | DRE | Year |
|---|
| Model 1 | -6.972, -3.547 | -0.002, 0.074 | 0.909, 1.758 | 0.017, 0.052 | 1.061, 1.720 | 0.062, 0.246 |
| Model 2 | -5.475, -2.916 | Omitted | 0.908, 1.757 | 0.016, 0.050 | 1.066, 1.724 | 0.061, 0.245 |
| Model 3 | -5.983, -2.686 | -0.002, 0.072 | Omitted | 0.021, 0.056 | 1.206, 1.848 | 0.047, 0.227 |
| Model 4 | -3.936, -1.677 | -0.007, 0.068 | 0.990, 1.846 | Omitted | 1.090, 1.744 | 0.053, 0.235 |
| Model 5 | -7.250, -3.955 | 0.002, 0.075 | 1.120, 1.930 | 0.021, 0.054 | Omitted | 0.149, 0.325 |
| Model 6 | -6.444, -3.104 | -0.002, 0.073 | 0.881, 1.723 | 0.015, 0.050 | 1.176, 1.821 | Omitted |
| Table VIIConfidence intervals (95%) for the
variable coefficients estimated by the logistic regression models
for prediction of HGPCa vs. PCa conditional on cancer being
present. |
Table VII
Confidence intervals (95%) for the
variable coefficients estimated by the logistic regression models
for prediction of HGPCa vs. PCa conditional on cancer being
present.
| Model | Intercept | BMI | log(PSA) | Age | DRE | Year |
|---|
| Model 7 | -6.692, -2.004 | -0.023, 0.073 | 0.112, 1.022 | 0.020, 0.070 | -0.156, 0.654 | -0.418, -0.157 |
| Model 8 | -5.370, -1.781 | Omitted | 0.115, 1.025 | 0.019, 0.069 | -0.148, 0.661 | -0.418, -0.157 |
| Model 9 | -6.413, -1.759 | -0.022, 0.074 | Omitted | 0.024, 0.074 | -0.018, 0.763 | -0.428, -0.168 |
| Model 10 | -2.391, 0.445 | -0.032, 0.063 | 0.221, 1.127 | Omitted | -0.127, 0.672 | -0.426, -0.168 |
| Model 11 | -6.778, -2.102 | -0.022, 0.074 | 0.195, 1.079 | 0.021, 0.071 | Omitted | -0.384, -0.139 |
| Model 12 | -7.440, -2.870 | -0.024, 0.071 | 0.188, 1.094 | 0.023, 0.072 | -0.413, 0.340 | Omitted |
Discussion
The impact of body weight gain on PCa detection is a
global health problem, affecting not only Western countries but
also Asian countries due to increasingly prevalent unhealthy
lifestyle changes. The increasing obesity rates and higher
incidence of PCa in Asia have inspired several studies to address
the correlation between BMI and PCa detection among Asian
populations (43-47).
Furthermore, Lavalette et al (48) found that men with a normal BMI at
age 20 developing overweight or obesity during adulthood were at
increased risk of aggressive PCa compared to men who maintained a
normal BMI. These results emphasized the importance of maintaining
a healthy BMI throughout adulthood. Then, according to Michael
et al (49), regardless of
exercise, higher BMI is linked with higher risk of aggressive PC
while exercise is unrelated to PC risk. Therefore, in this study,
we evaluated the biological association between a higher body mass
index and an increased risk of PCa development. We initially
constructed a model for the BMI distribution of the patients under
study under the hypothesis that BMI did not affect the chance of
passing the inclusion criteria for this study. Chi squared goodness
of fit testing indicated that this model distribution was
significantly different than the observed patient distribution.
This difference is correlated with BMI as the higher BMI categories
(OW, OB) showed an increase in inclusion from the model
distribution with the lower BMI categories showing a decrease. This
is significant because the parameters for inclusion themselves
(PSA, DRE) were shown to be positively correlated with the
probability of detecting PCa or HGPCa at biopsy. We further
hypothesized that several factors, such as PSA levels, can play an
important role in PCa detection; specifically, we hypothesized that
increases in BMI are inversely correlated with serum PSA levels
(50,51). This inverse relation may be linked
to the low testosterone levels in obese patients (40) or to larger plasma volumes as a
hemodilution effect (29). In
either case, the lower PSA levels in obese men could obscure the
presence of PCa. In an attempt to test this hypothesis, we
investigated the associations among BMI, PSA levels, age at biopsy,
DRE and PCa risk. In particular, correlation tests showed that BMI,
PSA, age and DRE were positively correlated with cancer detection.
The same tests showed that BMI was negatively correlated with both
age, as found in other studies (44), and PSA. Upon further investigation
with ANOVA, Kurskal-Wallis and Dunn's tests the age distribution
among the normal-weight and obese categories was found to be
significantly different; in particular, Dunn's test showed that
difference in the median age between normal-weight patients and
obese patients was statistically significant i.e., the obese
patients were younger. It is interesting to note that, although age
and PSA levels decrease with increasing BMI category, the rate of
cancer detection rises slightly. This suggests that BMI, or a
factor positively correlated with it, is driving cancer detection
and compensating for the age and PSA level decrease. Furthermore,
higher BMI contributes to creating a more favorable biological
microenvironment for cancer onset and growth. According to some
studies, men with a higher BMI are likely to produce less
testosterone, resulting in PCa that is less androgen-dependent and,
consequently, more aggressive (52). About this, in his prospective,
hospital-based, cross-sectional study involving consecutive
patients with PCa, Nwadi et al (53) found that the BMI of patients with
PCa correlated positively with their Gleason score. Excessive
adiposity might also result in the secretion of different
adipokines and inflammatory cytokines, which may promote tumor
growth (54). In addition, obese
men usually have high levels of insulin and insulin-like growth
factor 1 (IGF-1), both of which can inhibit apoptosis and encourage
carcinogenesis (55). Prostate
biopsy is usually prompted by either an abnormal DRE finding
suggestive of cancer or, more often, an elevated PSA blood value.
Factors such as patients' ages can potentially hide the impact of
BMI on PCa detection at biopsy, as has also been evidenced by
previous studies (40,56). Logistic models allow us to estimate
the influence that BMI has on cancer detection by controlling for
such factors. Table VIII shows
the results from Model 1 (full model) on 'median patients' where
the patients have median characteristics and vary only in their
BMI. Two cases, one with a positive DRE outcome and one with a
negative DRE outcome, are considered. The above results suggest
that BMI has a substantial incidence on PCa detection, especially
in those patients where the expectation of finding PCa would be
lower such as those with a negative DRE finding (as shown in table)
or have a lower age or PSA level. In patients with positive DRE
result, the increase in BMI still contributes positively to the
likelihood of cancer detection; however, the relative difference
between normal weight and obese patients is less marked due to the
high baseline detection associated with a positive DRE outcome.
When estimating the influence of BMI on the rate of HGPCa when
cancer is detected, the results from Table VI. show that BMI has a positive
coefficient as well. The result is, however, statistically
insignificant; this fact indicates that, although it can be
concluded that BMI drives cancer detection in general, it cannot be
concluded with certainty that HGPCa is driven more than, or at the
expense of, PCa. These results suggest, however, that a larger
study might confirm this, provided the trends are similar. The
present study presents some limitations that must be taken into
account. First, the study was carried out in a single center and,
for this reason, it might not represent the whole population of
Italy. However, to the best of our knowledge, there has not, to
date, been a single-center Italian study that has evaluated such a
large number of patients undergoing prostate biopsy. Therefore, our
study is the first of its kind. Second, the prebiopsy PSA levels
were collected over eight years, making our findings susceptible to
laboratory heterogeneity. Nonetheless, this level of variation was
taken into account by controlling for the year in which the
measurement was done. Third, BMI (calculated from self-reported
height and weight) might be an imperfect measure of obesity,
leading to potential deviations from patients' true measurements.
It was impossible to distinguish fat from muscle with the BMI,
whereas the waist circumference (57), waist-to-hip ratio (58) and percentage of visceral adipose
tissue (59) have recently been
shown to be better obesity indicators. Furthermore, according to
Choi et al (60), there is
a discrepancy in the trend of PCa development according to BMI
among the groups with different categories for waist circumference:
higher the waist circumference category, the stronger was the
association with BMI. Nonetheless, BMI is a convenient alternative
to other obesity indicators and has a universal measurement
standard. Moreover, its association with PSA has been thoroughly
studied, making it a generalizable and convenient proxy for
obesity. Finally, the study failed to adjust for additional
confounding factors that could possibly be associated with PSA
levels, such as the duration of obesity, medication use,
comorbidities, daily diet and exercise. When considering the
implications of this study on a random sample of the population the
effect of BMI on PCa outcome is likely to be underestimated due to
the effect of the inclusion criteria.
| Table VIIIModel patient characteristics and
probability of cancer detection based on Model 1. |
Table VIII
Model patient characteristics and
probability of cancer detection based on Model 1.
| Patient
characteristics | BMI,
kg/m2 | Age, years | log(PSA) | Year | DRE | Probability of
cancer detection, % | Relative risk |
|---|
| Normal weight,
negative DRE | 23.9 | 69.4 | 0.881 | 2 | 0 (negative) | 22.1 | 1.00 |
| Overweight,
negative DRE | 27.0 | 69.4 | 0.881 | 2 | 0 (negative) | 26.8 | 1.21 |
| Obese, negative
DRE | 31.8 | 69.4 | 0.881 | 2 | 0 (negative) | 35.3 | 1.60 |
| Normal weight,
positive DRE | 23.9 | 69.4 | 0.881 | 2 | 1 (positive) | 87.3 | 3.96 |
| Overweight,
positive DRE | 27.0 | 69.4 | 0.881 | 2 | 1 (positive) | 89.9 | 4.07 |
| Obese, positive
DRE | 31.8 | 69.4 | 0.881 | 2 | 1 (positive) | 93.0 | 4.21 |
In conclusion, taking into account the above
limitations, our results still have important implications for PCa
screening and detection for obese patients. In the current study,
the risk of developing PCa was found to be higher in men with
higher BMI with significantly younger obese patients suffering from
similar levels of pathology as older normal-weight patients. In
model patients with median characteristics, the relative risk
analysis of cancer diagnosis shows that for patients with a
negative DRE result, obesity accounts for a 60% increased risk.
Instead, when the DRE outcome is positive, the increase is subdued
due to the high baseline risk in this scenario. This suggests that
obese patients are more likely to be affected by advanced disease
at a younger age and, hence, might benefit from more aggressive
treatment options.
Acknowledgements
Not applicable.
Funding
Funding: No funding was received.
Availability of data and materials
All data generated or analyzed during this study are
included in this published article.
Authors' contributions
RB was the major contributor in writing the
manuscript. RB, GM and GN performed the prostate biopsies. CC, CG
and ABF performed the statistical analysis of the data. CD and FP
made substantial contributions to conception and design of this
study. RB and GM confirm the authenticity of all the raw data. RS,
UDM, OI and UP interpreted the patient data regarding urological
disease. All authors read and approved the final manuscript.
Ethics approval and consent to
participate
The study was conducted according to the guidelines
of the Declaration of Helsinki. However, ethics approval was not
applicable because this was a retrospective study that did not
include procedures outside of common and correct clinical practice.
Furthermore, all patients included in the study gave their written
informed consent for the processing of medical data.
Patient consent for publication
Written informed consent was obtained from all
patients for the publication of the present study and for
processing their medical data.
Competing interests
The authors declare that they have no competing
interests.
References
|
1
|
Bell KJ, Del Mar C, Wright G, Dickinson J
and Glasziou P: Prevalence of incidental prostate cancer: A
systematic review of autopsy studies. Int J Cancer. 137:1749–1757.
2015.PubMed/NCBI View Article : Google Scholar
|
|
2
|
Ferlay J, Soerjomataram I, Dikshit R, Eser
S, Mathers C, Rebelo M, Parkin DM, Forman D and Bray F: Cancer
incidence and mortality worldwide: Sources, methods and major
patterns in GLOBOCAN 2012. Int J Cancer. 136:E359–E386.
2015.PubMed/NCBI View Article : Google Scholar
|
|
3
|
Haas GP, Delongchamps N, Brawley OW, Wang
CY and de la Roza G: The worldwide epidemiology of prostate cancer:
Perspectives from autopsy studies. Can J Urol. 15:3866–3871.
2008.PubMed/NCBI
|
|
4
|
Jansson KF, Akre O, Garmo H, Bill-Axelson
A, Adolfsson J, Stattin P and Bratt O: Concordance of tumor
differentiation among brothers with prostate cancer. Eur Urol.
62:656–561. 2012.PubMed/NCBI View Article : Google Scholar
|
|
5
|
Hemminki K: Familial risk and familial
survival in prostate cancer. World J Urol. 30:143–148.
2012.PubMed/NCBI View Article : Google Scholar
|
|
6
|
Randazzo M, Müller A, Carlsson S, Eberli
D, Huber A, Grobholz R, Manka L, Mortezavi A, Sulser T, Recker F
and Kwiatkowski M: A positive family history as a risk factor for
prostate cancer in a population-based study with organised
prostate-specific antigen screening: Results of the Swiss European
randomised study of screening for prostate cancer (ERSPC, Aarau).
BJU Int. 117:576–583. 2016.PubMed/NCBI View Article : Google Scholar
|
|
7
|
Tan DS, Mok TS and Rebbeck TR: Cancer
genomics: Diversity and disparity across ethnicity and geography. J
Clin Oncol. 34:91–101. 2016.PubMed/NCBI View Article : Google Scholar
|
|
8
|
Eeles RA, Olama AA, Benlloch S, Saunders
EJ, Leongamornlert DA, Tymrakiewicz M, Ghoussaini M, Luccarini C,
Dennis J, Jugurnauth-Little S, et al: Identification of 23 new
prostate cancer susceptibility loci using the iCOGS custom
genotyping array. Nat Genet. 45:385–391, 391e1-e2. 2013.PubMed/NCBI View
Article : Google Scholar
|
|
9
|
Amin Al Olama A, Dadaev T, Hazelett DJ, Li
Q, Leongamornlert D, Saunders EJ, Stephens S, Cieza-Borrella C,
Whitmore I, Benlloch Garcia S, et al: Multiple novel prostate
cancer susceptibility signals identified by fine-mapping of known
risk loci among Europeans. Hum Mol Genet. 24:5589–5602.
2015.PubMed/NCBI View Article : Google Scholar
|
|
10
|
Pritchard CC, Mateo J, Walsh MF, De Sarkar
N, Abida W, Beltran H, Garofalo A, Gulati R, Carreira S, Eeles R,
et al: Inherited DNA-repair gene mutations in men with metastatic
prostate cancer. N Engl J Med. 375:443–453. 2016.PubMed/NCBI View Article : Google Scholar
|
|
11
|
Lynch HT, Kosoko-Lasaki O, Leslie SW,
Rendell M, Shaw T, Snyder C, D'Amico AV, Buxbaum S, Isaacs WB, Loeb
S, et al: Screening for familial and hereditary prostate cancer.
Int J Cancer. 138:2579–2591. 2016.PubMed/NCBI View Article : Google Scholar
|
|
12
|
Ewing CM, Ray AM, Lange EM, Zuhlke KA,
Robbins CM, Tembe WD, Wiley KE, Isaacs SD, Johng D, Wang Y, et al:
Germline mutations in HOXB13 and prostate-cancer risk. N Engl J
Med. 366:141–149. 2012.PubMed/NCBI View Article : Google Scholar
|
|
13
|
Leitzmann MF and Rohrmann S: Risk factors
for the onset of prostatic cancer: Age, location, and behavioral
correlates. Clin Epidemiol. 4:1–11. 2012.PubMed/NCBI View Article : Google Scholar
|
|
14
|
Breslow N, Chan CW, Dhom G, Drury RA,
Franks LM, Gellei B, Lee YS, Lundberg S, Sparke B, Sternby NH and
Tulinius H: Latent carcinoma of prostate at autopsy in seven areas.
The international agency for research on cancer, Lyons, France. Int
J Cancer. 20:680–688. 1977.PubMed/NCBI View Article : Google Scholar
|
|
15
|
Global Health Risks: Mortality and burden
of disease attributable to selected major risks. World Health
Organisation: Geneva, Switzerland, 2019.
|
|
16
|
Kaaks R and Kühn T: Epidemiology: Obesity
and cancer-the evidence is fattening up. Nat Rev Endocrinol.
10:644–645. 2014.PubMed/NCBI View Article : Google Scholar
|
|
17
|
Bhaskaran K, Douglas I, Forbes H,
dos-Santos-Silva I, Leon DA and Smeeth L: Body-mass index and risk
of 22 specific cancers: A population-based cohort study of 5·24
million UK adults. Lancet. 384:755–765. 2014.PubMed/NCBI View Article : Google Scholar
|
|
18
|
American Cancer Society: Cancer facts and
figures. American Cancer Society: Atlanta, GA, USA, 2012.
|
|
19
|
Buschemeyer WC III and Freedland SJ:
Obesity and prostate cancer: Epidemiology and clinical
implications. Eur Urol. 52:331–343. 2007.PubMed/NCBI View Article : Google Scholar
|
|
20
|
Culp S and Porter M: The effect of obesity
and lower serum prostate-specific antigen levels on prostate-cancer
screening results in American men. BJU Int. 104:1457–1461.
2009.PubMed/NCBI View Article : Google Scholar
|
|
21
|
Baillargeon J, Pollock BH, Kristal AR,
Bradshaw P, Hernandez J, Basler J, Higgins B, Lynch S, Rozanski T,
Troyer D and Thompson I: The association of body mass index and
prostate-specific antigen in a population-based study. Cancer.
103:1092–1095. 2005.PubMed/NCBI View Article : Google Scholar
|
|
22
|
Freedland SJ, Terris MK, Platz EA and
Presti JC Jr: Body mass index as a predictor of prostate cancer:
Development versus detection on biopsy. Urology. 66:108–113.
2005.PubMed/NCBI View Article : Google Scholar
|
|
23
|
Fowke JH, Signorello LB, Chang SS,
Matthews CE, Buchowski MS, Cookson MS, Ukoli FM and Blot WJ:
Effects of obesity and height on prostate-specific antigen (PSA)
and percentage of free PSA levels among African-American and
Caucasian men. Cancer. 107:2361–2367. 2006.PubMed/NCBI View Article : Google Scholar
|
|
24
|
Beebe-Dimmer JL, Faerber GJ, Morgenstern
H, Werny D, Wojno K, Halstead-Nussloch B and Cooney KA: Body
composition and serum prostate-specific antigen: Review and
findings from Flint men's health study. Urology. 71:554–560.
2008.PubMed/NCBI View Article : Google Scholar
|
|
25
|
Rundle A and Neugut AI: Obesity and
screening PSA levels among men undergoing an annual physical exam.
Prostate. 68:373–380. 2008.PubMed/NCBI View Article : Google Scholar
|
|
26
|
Grubb RL III, Black A, Izmirlian G, Hickey
TP, Pinsky PF, Mabie JE, Riley TL, Ragard LR, Prorok PC, Berg CD,
et al: Serum prostate-specific antigen hemodilution among obese men
undergoing screening in the prostate, lung, colorectal, and ovarian
cancer screening trial. Cancer Epidemiol Biomarkers Prev.
18:748–751. 2009.PubMed/NCBI View Article : Google Scholar
|
|
27
|
Barqawi AB, Golden BK, O'Donnell C, Brawer
MK and Crawford ED: Observed effect of age and body mass index on
total and complexed PSA: Analysis from a national screening
program. Urology. 65:708–712. 2005.PubMed/NCBI View Article : Google Scholar
|
|
28
|
Price MM, Hamilton RJ, Robertson CN, Butts
MC and Freedland SJ: Body mass index, prostate-specific antigen,
and digital rectal examination findings among participants in a
prostate cancer screening clinic. Urology. 71:787–791.
2008.PubMed/NCBI View Article : Google Scholar
|
|
29
|
Bañez LL, Hamilton RJ, Partin AW, Vollmer
RT, Sun L, Rodriguez C, Wang Y, Terris MK, Aronson WJ, Presti JC
Jr, et al: Obesity-related plasma hemodilution and PSA
concentration among men with prostate cancer. JAMA. 298:2275–2280.
2007.PubMed/NCBI View Article : Google Scholar
|
|
30
|
Fontaine KR, Heo M and Allison DB: Obesity
and prostate cancer screening in the USA. Public Health.
119:694–698. 2005.PubMed/NCBI View Article : Google Scholar
|
|
31
|
Fowke JH, Signorello LB, Underwood W III,
Ukoli FA and Blot WJ: Obesity and prostate cancer screening among
African-American and Caucasian men. Prostate. 66:1371–1380.
2006.PubMed/NCBI View Article : Google Scholar
|
|
32
|
Scales CD Jr, Curtis LH, Norris RD,
Schulman KA, Dahm P and Moul JW: Relationship between body mass
index and prostate cancer screening in the United States. J Urol.
177:493–498. 2007.PubMed/NCBI View Article : Google Scholar
|
|
33
|
Engeland A, Tretli S and Bjørge T: Height,
body mass index, and prostate cancer: A follow-up of 950000
Norwegian men. Br J Cancer. 89:1237–1242. 2003.PubMed/NCBI View Article : Google Scholar
|
|
34
|
Andersson SO, Wolk A, Bergström R, Adami
HO, Engholm G, Englund A and Nyrén O: Body size and prostate
cancer: A 20-year follow-up study among 135006 Swedish construction
workers. J Natl Cancer Inst. 89:385–389. 1997.PubMed/NCBI View Article : Google Scholar
|
|
35
|
Jemal A, Bray F, Center MM, Ferlay J, Ward
E and Forman D: Global cancer statistics. CA Cancer J Clin.
61:69–90. 2011.PubMed/NCBI View Article : Google Scholar
|
|
36
|
Freedland SJ, Bañez LL, Sun LL, Fitzsimons
NJ and Moul JW: Obese men have higher-grade and larger tumors: An
analysis of the duke prostate center database. Prostate Cancer
Prostatic Dis. 12:259–263. 2009.PubMed/NCBI View Article : Google Scholar
|
|
37
|
Hu MB, Xu H, Bai PD, Jiang HW and Ding Q:
Obesity has multifaceted impact on biochemical recurrence of
prostate cancer: A dose-response meta-analysis of 36,927 patients.
Med Oncol. 31(829)2014.PubMed/NCBI View Article : Google Scholar
|
|
38
|
Hutterer G, Perrotte P, Gallina A, Walz J,
Jeldres C, Traumann M, Suardi N, Saad F, Bénard F, Valiquette L, et
al: Body mass index does not predict prostate-specific antigen or
percent free prostate-specific antigen in men undergoing prostate
cancer screening. Eur J Cancer. 43:1180–1187. 2007.PubMed/NCBI View Article : Google Scholar
|
|
39
|
Capitanio U, Perrotte P, Hutterer GC,
Suardi N, Jeldres C, Shariat SF, Duclos A, Arjane P, Montorsi F and
Karakiewicz PI: Effect of body mass index on prostate-specific
antigen and percentage free prostate-specific antigen: Results from
a prostate cancer screening cohort of 1490 men. Int J Urol.
16:91–95. 2009.PubMed/NCBI View Article : Google Scholar
|
|
40
|
Freedland SJ, Platz EA, Presti JC Jr,
Aronson WJ, Amling CL, Kane CJ and Terris MK: Obesity, serum
prostate specific antigen and prostate size: Implications for
prostate cancer detection. J Urol. 175:500–504. 2006.PubMed/NCBI View Article : Google Scholar
|
|
41
|
Hu MB, Liu SH, Jiang HW, Bai PD and Ding
Q: Obesity affects the biopsy-mediated detection of prostate
cancer, particularly high-grade prostate cancer: A dose-response
meta-analysis of 29,464 Patients. PLoS One.
9(e106677)2014.PubMed/NCBI View Article : Google Scholar
|
|
42
|
MacInnis RJ and English DR: Body size and
composition and prostate cancer risk: Systematic review and
meta-regression analysis. Cancer Causes Control. 17:989–1003.
2006.PubMed/NCBI View Article : Google Scholar
|
|
43
|
Kobayashi T, Mitsumori K, Nishizawa K,
Kawahara T, Ogura K and Ide Y: Association between body mass index
and prostate cancer detection rates in Japanese urologic patients.
Urology. 66:130–134. 2005.PubMed/NCBI View Article : Google Scholar
|
|
44
|
Masuda H, Kagawa M, Kawakami S, Numao N,
Matsuoka Y, Yokoyama M, Yamamoto S, Yonese J, Fukui I and Kihara K:
Body mass index influences prostate cancer risk at biopsy in
Japanese men. Int J Urol. 20:701–707. 2013.PubMed/NCBI View Article : Google Scholar
|
|
45
|
Park J, Cho SY, Lee SB, Son H and Jeong H:
Obesity is associated with higher risk of prostate cancer detection
in a biopsy population in Korea. BJU Int. 114:891–895.
2014.PubMed/NCBI View Article : Google Scholar
|
|
46
|
Lee SE, Hong SK, Park HZ, Chang JS, Yoon
CY, Byun SS and Abdullajanov M: Higher body mass index is
associated with lower risk of prostate cancer detection via multi
(≥12)-core prostate biopsy in Korean men. Urology. 76:1063–1066.
2010.PubMed/NCBI View Article : Google Scholar
|
|
47
|
Oh JJ, Jeong SJ, Lee BK, Jeong CW, Byun
SS, Hong SK and Lee SE: Does obesity affect the accuracy of
prostate-specific antigen (PSA) for predicting prostate cancer
among men undergoing prostate biopsy. BJU Int. 112:E265–E271.
2013.PubMed/NCBI View Article : Google Scholar
|
|
48
|
Lavalette C, Cordina Duverger E, Artaud F,
Rébillard X, Lamy PJ, Trétarre B, Cénée S and Menegaux F: Body mass
index trajectories and prostate cancer risk: Results from the
EPICAP study. Cancer Med. 9:6421–6429. 2020.PubMed/NCBI View Article : Google Scholar
|
|
49
|
Michael J, Oyekunle T, Howard L, De Hoedt
A, Hoyo C, Grant D and Freedland S: Interplay between exercise and
BMI; results from an equal access, racially diverse biopsy study.
Cancer Causes Control. 30:13–20. 2019.PubMed/NCBI View Article : Google Scholar
|
|
50
|
Werny DM, Thompson T, Saraiya M, Freedman
D, Kottiri BJ, German RR and Wener M: Obesity is negatively
associated with prostate-specific antigen in U.S. men, 2001-2004.
Cancer Epidemiol Biomarkers Prev. 16:70–76. 2007.PubMed/NCBI View Article : Google Scholar
|
|
51
|
Kim YJ, Han BK, Hong SK, Byun SS, Kim WJ
and Lee SE: Body mass index influences prostate-specific antigen in
men younger than 60 years of age. Int J Urol. 14:1009–1012.
2007.PubMed/NCBI View Article : Google Scholar
|
|
52
|
Isom-Batz G, Bianco FJ Jr, Kattan MW,
Mulhall JP, Lilja H and Eastham JA: Testosterone as a predictor of
pathological stage in clinically localized prostate cancer. J Urol.
173:1935–1937. 2005.PubMed/NCBI View Article : Google Scholar
|
|
53
|
Nwadi UV, Nwofor AME, Oranusi CK, Orakwe
JC, Obiesie EA, Mbaeri TU, Abiahu JA and Mbonu OO: Correlation
between body mass index and gleason score in men with prostate
cancer in Southeastern Nigeria. Niger J Surg. 27:22–27.
2021.PubMed/NCBI View Article : Google Scholar
|
|
54
|
Price RS, Cavazos DA, De Angel RE,
Hursting SD and deGraffenried LA: Obesity-related systemic factors
promote an invasive phenotype in prostate cancer cells. Prostate
Cancer Prostatic Dis. 15:135–143. 2012.PubMed/NCBI View Article : Google Scholar
|
|
55
|
Nandeesha H: Insulin: A novel agent in the
pathogenesis of prostate cancer. Int Urol Nephrol. 41:267–272.
2009.PubMed/NCBI View Article : Google Scholar
|
|
56
|
Fowke JH, Motley SS, Cookson MS,
Concepcion R, Chang SS, Wills ML and Smith JA Jr: The association
between body size, prostate volume and prostate-specific antigen.
Prostate Cancer Prostatic Dis. 10:137–142. 2007.PubMed/NCBI View Article : Google Scholar
|
|
57
|
Park JH, Cho BL, Kwon HT, Lee CM and Han
HJ: Effect of body mass index and waist circumference on prostate
specific antigen and prostate volume in a generally healthy Korean
population. J Urol. 182:106–111. 2009.PubMed/NCBI View Article : Google Scholar
|
|
58
|
Yang CY, Peng CY, Liu YC, Chen WZ and
Chiou WK: Surface anthropometric indices in obesity-related
metabolic diseases and cancers. Chang Gung Med J. 34:1–22.
2011.PubMed/NCBI
|
|
59
|
Qu YY, Dai B, Kong YY, Chang K, Ye DW, Yao
XD, Zhang SL, Zhang HL and Yang WY: Influence of obesity on
localized prostate cancer patients treated with radical
prostatectomy. Asian J Androl. 15:747–752. 2013.PubMed/NCBI View Article : Google Scholar
|
|
60
|
Choi JB, Myong JP, Lee Y, Kim I, Kim JH,
Hong SH and Ha US: Does increased body mass index lead to elevated
prostate cancer risk? It depends on waist circumference. BMC
Cancer. 20(589)2020.PubMed/NCBI View Article : Google Scholar
|