Introduction
According to the 'World Cancer Report 2020' released
by the World Health Organization International Agency for Research
on Cancer, lung cancer (1.8 million cases per year) remains to be
the leading cause of cancer-associated mortality (1). Non-small cell lung cancer (NSCLC),
including lung squamous cell carcinoma, lung adenocarcinoma and
large cell carcinoma, is the most common type of lung cancer,
accounting for ~85% of all cases (2). Significant progress has been
achieved in the development of treatment methods for NSCLC over the
past decade. The clinical application of molecularly targeted
drugs, including gefitinib, osimertinib, crizotinib and loratinib
and immune checkpoint inhibitors, such as nivolumab and
pembrolizumab, has significantly prolonged the survival time of
patients with advance NSCLC (3,4).
However, NSCLC cells can develop resistance to these targeted
therapy or immunotherapy, thereby resuming disease progression
(5-7). Therefore, drug resistance has
become a major obstacle to the survival of patients with NSCLC
(5-7). At present the primary strategy to
address drug resistance is by either combining multiple antitumor
agents or by identifying novel therapeutic agents specifically
targeting the mechanism underlying drug resistance (8-10). However, adverse side effects
following multi-drug therapy limit its clinical application
(10,11). Therefore, investigating novel
effective therapeutic strategies is essential for overcoming drug
resistance and prolong the survival of patients with lung
cancer.
By gaining an in-depth understanding of the cancer
pathological mechanism, targeted therapeutic drugs can be designed
and developed based on the specific physiological characteristics
of the cancer (12). However,
screening existing compounds or naturally occurring medicinal
compounds for potential therapeutic effects on cancer remains to be
an indispensable part of cancer treatment research. Vinblastine
(13), platinum compounds
(14) and paclitaxel (15) are all examples of anti-cancer
agents that can be found naturally. In addition, monomer compounds
purified from natural products also form part of the drug screening
libraries (16-18). Their biological activities on
various processes, including inflammation, infection and cancer
development, have been extensively investigated (19).
Schizandrin A (SchA), also known as
deoxyschizandrin, is one of the most biologically active lignans
isolated from the fruit of the medicinal vine plant Schisandra
chinensis (20). Wang et
al previously revealed that male Sprague-Dawley rats fed with
an extract of Schisandra chinensis (50 mg/kg) retained
detectable levels of SchA in the plasma 6 h after feeding (21). Since SchA has symmetrical methoxy
and methyl groups, the loss of these groups forms part of the
catabolic mechanism of SchA when it is broken down (22). Based on the results from another
pharmacokinetic study into Schizandrol A, Liu et al
(23) found that hydroxylation
and demethylation may also occur when SchA is broken down.
Previous pharmacological studies have reported that
SchA has a variety of biologically active properties.
Anti-inflammatory (24-27) and antiviral effects (28,29) of SchA and its analogs were
initially found. However, it was subsequently found that SchA also
confers antitumor (30,31), anti-allergy (32) and anti-fibrosis (33) effects whilst enhancing immunity
(34). Over the past decade,
studies investigating the potential antitumor effects of SchA have
been gradually increasing. It was previously reported that SchA can
inhibit cell proliferation, induce cell apoptosis, inhibit cell
invasion and tumor metastasis in breast cancer, ovarian cancer,
choriocarcinoma, thyroid cancer and colorectal cancer (31,35-42), in addition to enhancing drug
efficacy in NSCLC and colon carcinoma (43,44) or overcome drug resistance in
breast cancer and esophageal carcinoma (30,45,46). In particular, Xian et al
revealed that SchA combined with gefitinib could inhibit
proliferation whilst promoting apoptosis in gefitinib-resistant
NSCLC cells (43). However, the
underlying mechanistic effects of SchA on NSCLC remain poorly
understood. Therefore, the potential biological effects of SchA on
NSCLC was investigated in the present study.
Materials and methods
Cell culture and treatment
The human NSCLC cell lines A549, H1299 and H1975 and
the normal human lung epithelial cell lines BEAS-2B were purchased
from The Cell Bank of Type Culture Collection of The Chinese
Academy of Sciences. RPMI-1640 medium and PBS were purchased from
Corning, Inc. and FBS was purchased from PAN-Biotech GmbH (cat. no.
P30-3302). All cell lines were cultured in RPMI-1640 medium
supplemented with 10% FBS at 37°C in a humidified atmosphere with
5% CO2. SchA, with a purity of >98%, was purchased
from Chengdu Must Bio-Technology Co., Ltd. (cat. no. 19092908).
SchA was dissolved DMSO at a concentration of 50 mM for subsequent
experiments.
Cell viability assay
The A549, H1299, H1975 and BEAS-2B cell lines were
seeded into a 96-well plate at a density of 3,000 cells per well
and incubated at 37°C overnight. For concentration dependence
experiments, different concentrations of SchA (0, 25, 50, 75 and
100 µM) or an equal volume of DMSO were added to the cell
culture medium to treat the cells for 24 h at 37°C. For time
dependence experiments, the cells were treated with 50 µM
SchA for 0, 12, 24, 36 and 48 h at 37°C. A Cell Titer-Glo
Luminescence Viability Assay kit (cat. no. G7571; Promega
Corporation) was used to detect cell viability according to the
manufacturer's protocol. Each concentration and time dependence
assay was repeated three times. The IC50 and its 95%
confidence interval of SchA was evaluated using best-fit
dose-response inhibition curves with GraphPad Prism v7.0 Software
(GraphPad Software, Inc.).
Cell colony formation assay
The effect of SchA on cell colony formation was
evaluated using colony formation assays. Single-cell suspensions of
A549 and H1975 were seeded into a six-well plates at a density of
800 cells/well. After the cells adhered, SchA at concentrations of
0, 25 and 50 µM was added into the culture medium. The cells
were placed in an incubator and cultured for 10-14 days at 37°C
until a single cell clone contained ~50 cells. The colonies were
then fixed with 4% paraformaldehyde for 1 h at room temperature and
stained with 0.2% crystal violet for 20 min (Sigma-Aldrich; Merck
KGaA) at room temperature. The number of colonies visible to the
naked eye (Each colony contains >50 cells; ×1 magnification)
were counted using ImageJ v2 software (ImageJ; National Institutes
of Health).
Cell cycle analysis using flow
cytometry
The cells were trypsinized with trypsin and
centrifuged at 300 × g for 3 min at room temperature, before being
re-suspended in 1 ml pre-chilled 70% ethanol. After fixation
overnight at -20°C, the cells were re-suspended and stained with
500 µl PI/RNase staining buffer (cat. no. 550825; BD
Biosciences) at a density of 1×10⁶ cells/ml at room temperature for
30 min. The cells were then detected using a CytoFLEX analysis flow
cytometer (Beckman Coulter, Inc.) and the FL2-A: B610-ECD channel.
The results were analyzed using the FlowJo v10 software (FlowJo
LLC).
Cell apoptosis analysis using flow
cytometry
After the A549 and H1975 cells were treated with
SchA (0, 25 and 50 µM) for 24 h at 37°C, the cells were
trypsinized without EDTA (cat. no. CR27250; Guangzhou Ruisen
Biotechnology Co., Ltd.). After washing twice with pre-chilled PBS,
the cells were re-suspended in 1X buffer provided in the FITC
Annexin V Apoptosis Detection kit (cat. no. 556547; BD Biosciences)
to 1×10⁶ cells/ml. Next, 100 µl cell suspension
was added to a flow cytometry tube and 5 µl Annexin V-FITC
and 5 µl PI staining solution (cat. no. 556547; BD
Biosciences) was added. The samples were incubated at room
temperature for 15 min in the dark, before 400 µl 1X buffer
provided in the kit was added. A CytoFLEX analysis flow cytometer
(Beckman Couler, Inc.) and the FL1-A: B525-FITC and FL4-A: Y585-PE
channels were used to measure cell apoptosis, where the results
were analyzed using the FlowJo v10 software (FlowJo LLC).
The A549 and H1975 cells were also treated with 5 mM
3-MA for 4 h at 37°C and then treated with 50 µM SchA for 24
h at 37°C. The apoptosis of the cells was measured by the FITC
Annexin V Apoptosis Detection kit (cat. no. 556547; BD Biosciences)
and a CytoFLEX analysis flow cytometer (Beckman Coulter, Inc.). The
results of apoptosis were also analyzed using the FlowJo v10
software (FlowJo LLC).
DNA electrophoresis
A DNeasy Blood & Tissue kit (cat. no. 69504;
Qiagen GmbH) was used to extract DNA from the cells based on the
manufacturer's protocols. The DNA sample was mixed with 10X loading
buffer (cat. no. 317051; Vazyme Biotech Co., Ltd.) at a ratio of
9:1 before being separated in 1% agarose gels with the 0.01% Ultra
GelRed nucleic acid stain (cat. no. GR501-01; Vazyme Biotech Co.,
Ltd.). A 200-bp DNA Ladder (cat. no. 3423A; Takara Bio, Inc.) was
used to calculate the size of the DNA molecules. The FluorChem FC3
System (ProteinSimple) was used for gel imaging and the AlphaView
v1.0 software (ProteinSimple) was used to analyze the density of
the DNA bands.
Hoechst 33342 and PI staining
The single-cell suspensions of A549 and H1975 were
seeded into six-well plates at a density of 2×10⁵
cells/well. After the cells were treated with SchA (0, 25 and 50
µM) for 24 h at 37°C, the cells were washed twice with PBS
and incubated with Hoechst 33342 (1 µg/ml; cat. no. C1029;
Beyotime Institute of Biotechnology) for 15 min at room
temperature, followed by incubation with PI (5 µg/ml) for
another 15 min at room temperature. Subsequently, the cells were
washed three times with PBS and the blue and red fluorescence
emitted by the cells was observed. Images were captured using a
fluorescence microscope (Leica Microsystems GmbH) at ×200
magnification. Image-Pro Plus v6.0 software (Media Cybernetics,
Inc.) was used to merge the monochromatic fluorescence images.
Detection of mitochondrial membrane
potential (MMP)
A MMP Detection kit (MitoScreen; cat. no. 551302; BD
Biosciences) was used to measure the level of damage to the MMP in
the cell. The JC-1 dye was diluted into a JC-1 working solution
according to the manufacturer's protocol. The cells were
re-suspended with the JC-1 working solution at a density of
1×10⁶ cells/ml and incubated at 37°C for 15 min. After
staining, the cells were centrifuged at 240 × g for 3 min and
washed twice with 1X buffer provided in the kit. The cells were
re-suspended in 500 µl 1X buffer provided in the kit and
detected using a CytoFLEX analysis flow cytometer (Beckman Coulter,
Inc.), with the FL1-A: B525-FITC and FL4-A: Y585-PE channels. Red
JC-1 dye fluorescence represents live cells with intact MMP whereas
green JC-1 monomer fluorescence represents apoptotic or dead cells
with impaired MMP. The ratio of red (JC-1 aggregates) to green
(JC-1 monomers) fluorescence intensity was used to assess MMP using
the FlowJo v10 software (BD Biosciences).
Detection of reactive oxygen species
(ROS)
The single-cell suspensions of A549 and H1975 were
seeded into a six-well plates at a density of 2×10⁵
cells/well. The cells were treated with SchA (0, 25 and 50
µM) for 24 h at 37°C, then ROS probe DCFH-DA (cat. no.
287810; Sigma-Aldrich; Merck KGaA) was added to the cell culture
medium at 1:1,000 before the cells were incubated at 37°C for 20
min and washed twice with PBS. Intracellular ROS levels were
detected using a fluorescence microscope at ×200 magnification
(Leica Microsystems GmbH).
After the cells were treated with SchA (0, 25 and 50
µM) for 24 h at 37°C, the cells were trypsinized to form a
single cell suspension with trypsin and re-suspended. The cells
were re-suspended in medium containing 0.1% DCFH-DA at a density of
1×10⁶ cells/ml and incubated at 37°C for 20 min. They
were then washed twice with PBS and re-suspended with 500 µl
PBS after centrifugation at 240 × g for 3 min at 37°C. The FL1-A:
B525-FITC channel in a CytoFLEX analysis flow cytometer (Beckman
Coulter, Inc.) was used to detect the level of intracellular ROS.
The flow cytometry data was analyzed using the FlowJo v10 software
(FlowJo LLC).
Staining with Dansylcadaverine (MDC) and
Hoechst 33342
MDC was purchased from Sigma-Aldrich (cat. no.
10121-91-2; Sigma-Aldrich; Merck KGaA). The single-cell suspensions
of A549 and H1975 were seeded into a six-well plates at a density
of 2×10⁵ cells/well. After treatment with SchA (0, 25,
50 µM) for 24 h at 37°C, the cells were washed twice with
PBS and incubated with MDC (final concentration, 0.05 mM) and
Hoechst 33342 (final concentration, 1 µg/ml) for 15 min at
room temperature in the dark. After washing the cells three times
with PBS, the green and blue fluorescence emitted by the cells, was
observed. Images were captured using a fluorescence microscope at
×200 magnification (Leica Microsystems GmbH). Image-Pro Plus v6.0
software (Media Cybernetics, Inc.) was used to merge the monochrome
fluorescent images. Autophagy inhibitor 3-methyladenine (3-MA) was
purchased from Sigma-Aldrich (cat. no. M9281; Sigma-Aldrich; Merck
KGaA).
Measurement of ATP levels
The ATP levels were assessed by ATP Detection Assay
kit (cat. no. 700410, Cayman Chemical Company) according to the
manufacturer's protocols. The single-cell suspensions of A549 and
H1975 were seeded into a six-well plates at a density of
2×10⁵ cells/well. After the cells were treated with SchA
(0, 25 and 50 µM) for 24 h at 37°C, the cell culture medium
was first discarded and the cells were washed with pre-chilled PBS
before 1 ml 1X sample buffer was added to each well (6-well plate)
to lyse the cells. D-luciferin and luciferase were added to the ATP
detection buffer to prepare the reaction mixture. The detection
holes on the black 96-well plates and three duplicate wells for
each sample were organized. A total of 100 µl freshly
prepared reaction mixture and 10 µl cell lysate were added
to each well, mixed and incubated for 15 min in the dark at room
temperature. A multifunctional microplate reader was used to
measure the fluorescence value in each well. GraphPad Prism v7.0
software (GraphPad Software, Inc.) was used to generate a histogram
to show the fluorescence values.
Western blot analysis
The cells were lysed using the RIPA Lysis Buffer
(cat. no. P0013B; Beyotime Institute of Biotechnology) containing
the Protease Inhibitor Cocktail (cat. no. 05892791001; Roche
Diagnostics GmbH) and Phosphatase Inhibitor Cocktail (cat. no.
524629; EMD Millipore). The BCA Protein Assay kit (cat. no. PC0020;
Beijing Solarbio Science & Technology Co., Ltd.) was used to
determine protein concentration. Loading buffer (5X) was then added
to the protein lysate at a ratio of 1:4. A total of 30 µg
protein sample per line was separated using 12% SDS-PAGE and then
transferred onto PVDF membranes (EMD Millipore). The membranes were
blocked with 5% BSA (cat. no. 97061-422; VWR International) in
TBS-0.1% Tween-20 (TBST) before being incubated with primary
antibodies on a shaker overnight at 4°C. The p53 (cat. no. 2527),
p21 (cat. no. 2947), cyclin D1 (cat. no. 2922), CDK4 (cat. no.
12790), CDK6 (cat. no. 13331), cyclin E1 (cat. no. 20808), cyclin
E2 (cat. no. 4132), CDK2 (cat. no. 2546), capspase-3 (cat. no.
14220), poly (ADP-ribose) polymerase (PARP; cat. no. 9542),
Bcl2-like 11 (Bim; cat. no. 2933), Bcl2 (cat. no. 4223), Bax (cat.
no. 5023), caspase-9 (cat. no. 9502), LC3 (cat. no. 4108), p62
(cat. no. 8025), phosphorylated (p-) AMPKα-T172 (cat. no. 2535) and
AMPKα (cat. no. 5831) antibodies were purchased from Cell Signaling
Technology, Inc. The primary antibodies against SOX4 (cat. no.
DF2610; Affinity Biosciences) and β-actin (cat. no. A1978;
Sigma-Aldrich; Merck KGaA) were also used. All primary antibodies
were diluted in primary antibody dilution buffer (cat. no. P0256;
Beyotime Institute of Biotechnology) at a ratio of 1:1,000. The
membrane were washed three times with TBST and then incubated with
HRP-conjugated anti-rabbit (cat. no. 7074; Cell Signaling
Technology, Inc.) or anti-mouse (cat. no. 7076; Cell Signaling
Technology, Inc.) secondary antibodies at room temperature for 1 h.
After washing the membrane three times with TBST, an ECL kit
chemiluminescent substrate (cat. no. BL523B; Biosharp Life
Sciences) was used to visualize the protein bands.
Total RNA extraction and PCR
Total RNA was extracted using a RNA Quick
Purification kit (cat. no. ES-RN001; Shanghai YiShan Biotechnology
Co., Ltd.) and reverse transcribed into single-strand cDNA using a
HiScript II Q RT SuperMix kit (cat. no. R223; Vazyme Biotechnology
Co., Ltd.) at 50°C for 15 min, followed by 85°C for 5 sec.
Quantitative PCR (qPCR) was performed using the PowerUp™
SYBR™-Green Master Mix (cat. no. A25742; Thermo Fisher Co., Ltd.)
and an Applied Biosystems 7500 Fast Real-Time PCR System (Thermo
Fisher Scientific, Inc.). The thermocycling conditions of qPCR were
set as follows: 95°C for 1 min, followed by 95°C for 10 sec, 60°C
for 20 sec and 72°C for 30 sec for 40 cycles. Relative expression
levels were calculated by the 2−ΔΔCq method normalized
to the internal reference gene β-actin (47).
Reverse transcription (RT)-semiquantitative PCR
(RT-PCR) was conducted using 2X Taq Master mix (cat. no. P112;
Vazyme Biotech Co., Ltd.) and a Bio-Rad T100 thermal cycler
(Bio-Rad Laboratories, Inc.). The thermocycling conditions of
RT-PCR were set as follows: 95°C for 3 min, followed by 95°C for 15
sec, 60°C for 15 sec and 72°C for 60 sec for 25 cycles. The primer
sequences were as follows: Bim forward, 5′-TAAGTTCTGA
GTGTGACCGAGA-3′ and reverse, 5′-GCTCTGTCTGTA GGGAGGTAGG-3′; Bim
(BimEL, BimL and BimS), which contained exons 2 and 5 (48), forward, 5′-ATGGCAAAGC
AACCTTCTGA-3′ and reverse, 5′-TCAATGCATTCTCCACA CCA-3′ and β-actin
forward, 5′-CATGTACGTTGCTATCCA GGC-3′ and reverse,
5′-CTCCTTAATGTCACGCACGAT-3′. A total of 10 µg DNA per lane
was separated using 1% agarose gel and stained with 0.01% Ultra
GelRed nucleic acid stain (cat. no. GR501-01; Vazyme Biotech Co.,
Ltd.).
Statistical analysis
All experiments were repeated 3 times for each assay
and the results were presented as the mean ± SD. One-way ANOVA was
used to evaluate the quantitative data for statistical
significance, then Dunnett's test was used for multiple
comparisons. P<0.05 was considered to indicate a statistically
significant difference.
Results
SchA reduces cell viability and inhibits
the proliferation of NSCLC cells
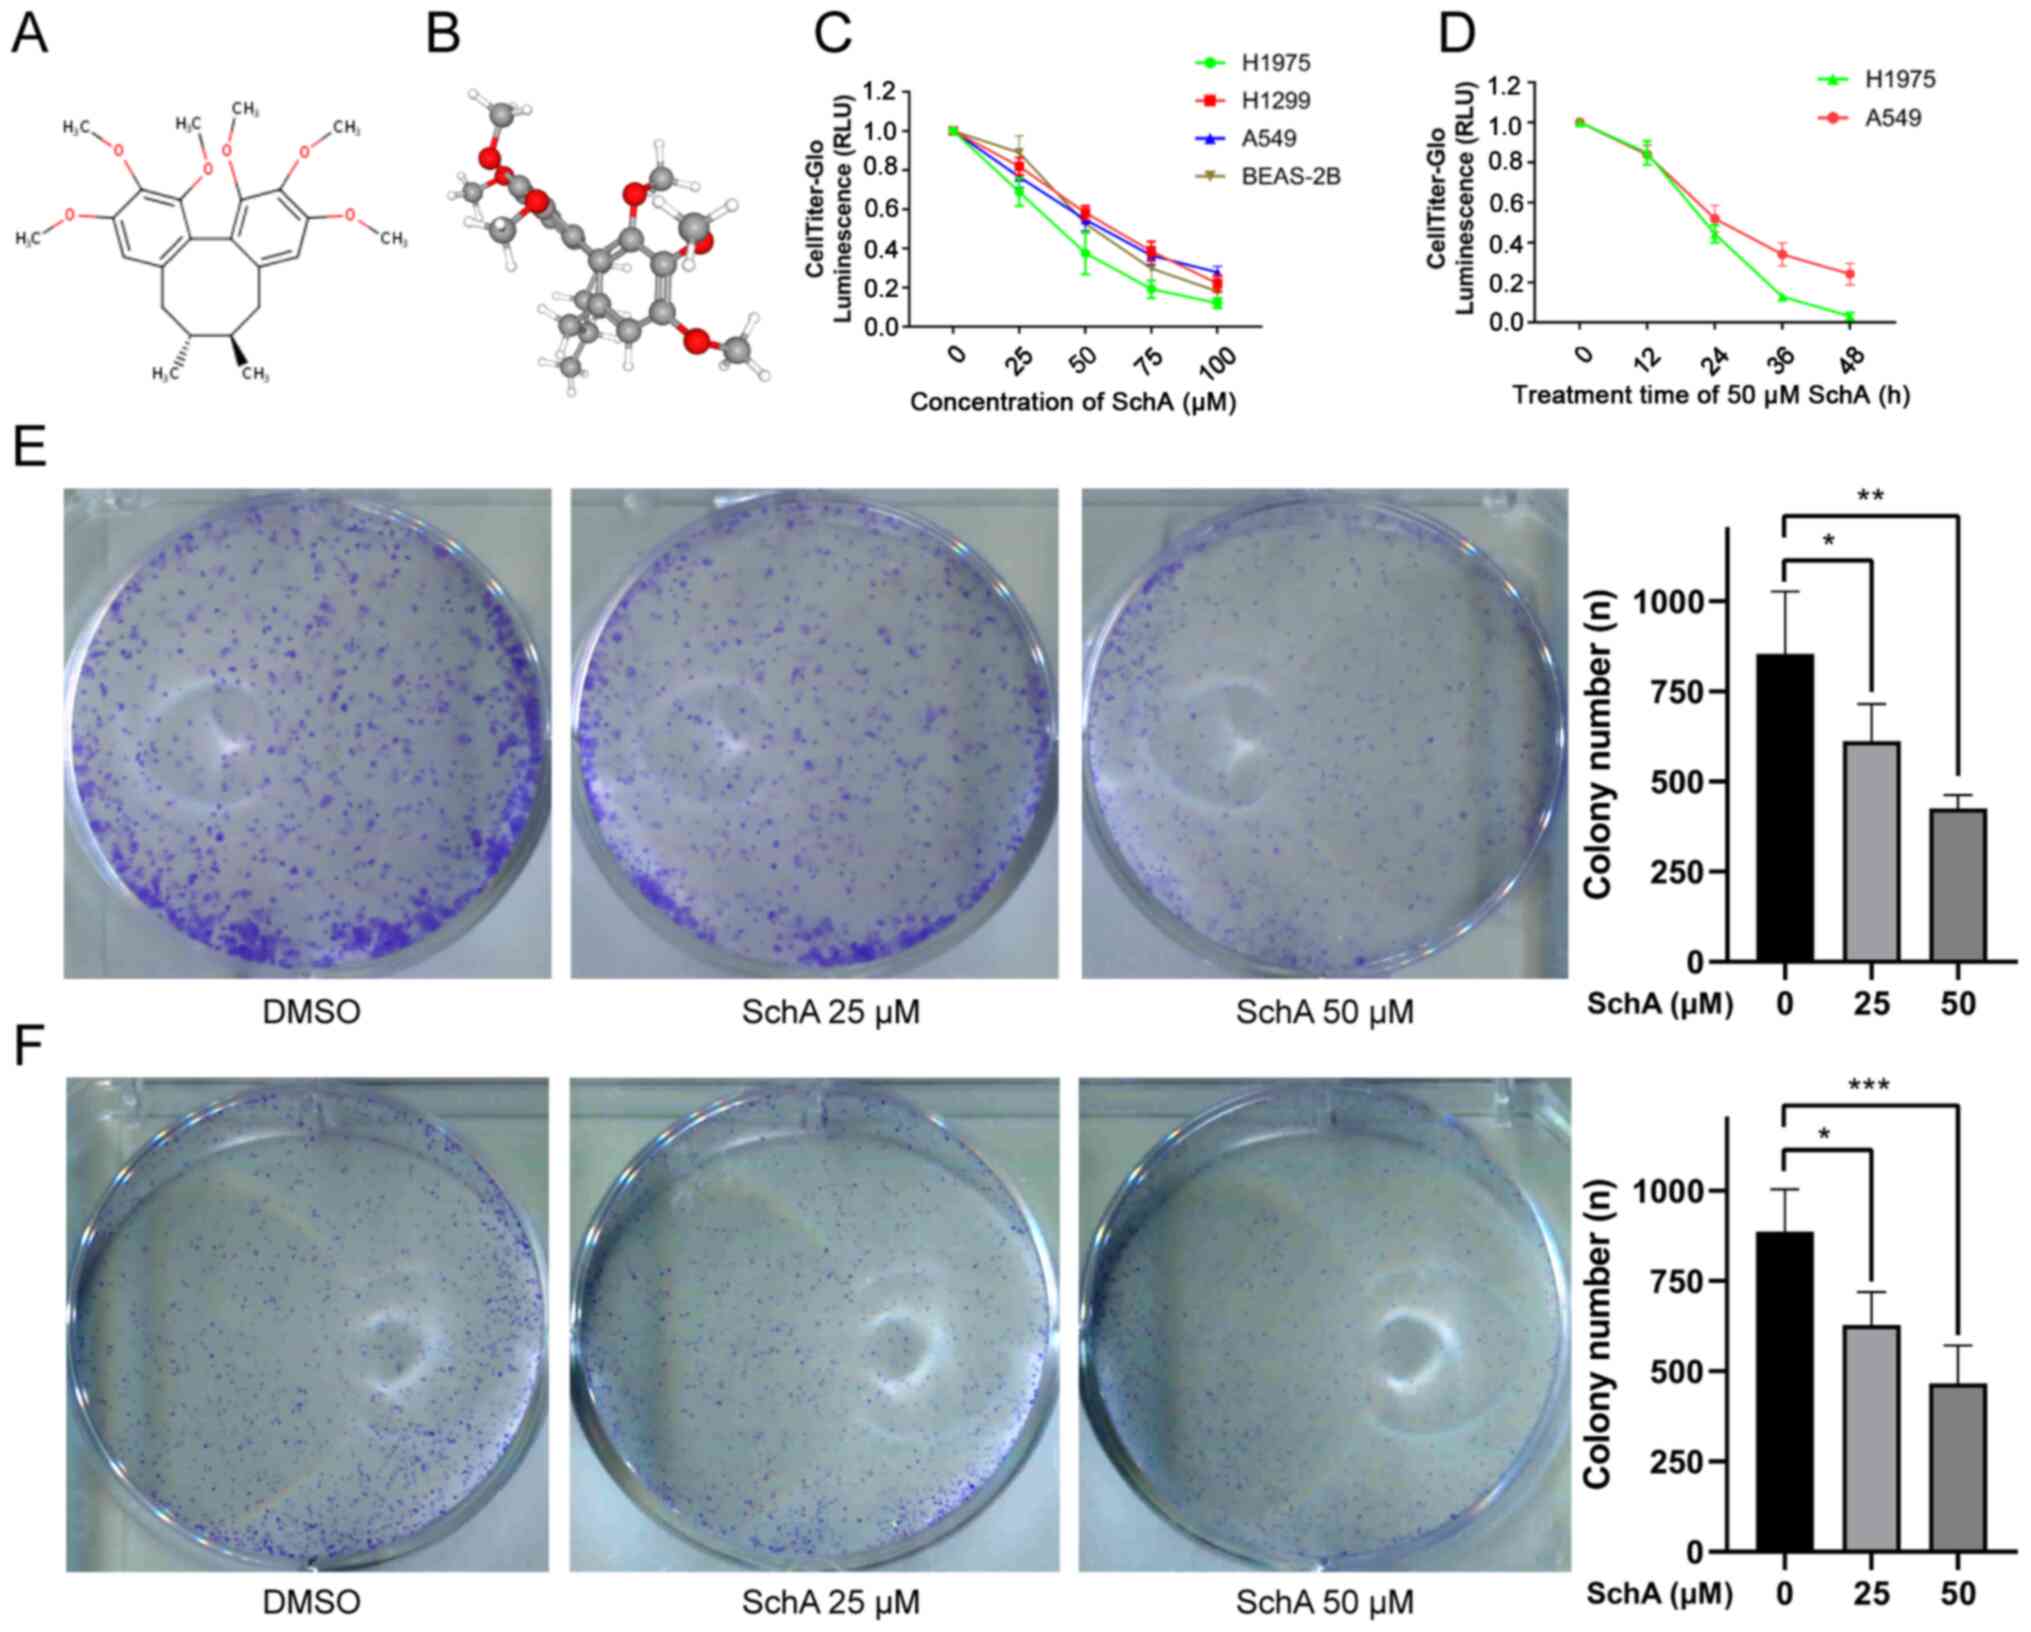
The 2D and 3D structures of SchA (PubChem compound
ID, 43595; C24H32O6; molecular
weight, 416.5 g/mol) are shown in Fig. 1A and B. SchA belongs to the
dibenzocyclooctadiene family of lignans (49). Its main feature is that the
biaryl units are connected via aliphatic chains to form an
eight-membered ring carbon skeleton (50).
The CellTiter-Glo assay was used to measure the
viability of cells treated with different concentrations of SchA
(0, 25, 50, 75 and 100 µM) for 24 h. The results showed that
SchA exerted inhibitory effects on the viability of A549, H1975,
H1299 and BEAS-2B cells in a concentration-dependent manner
(Fig. 1C). The IC50
and its 95% confidence interval (CI) were used to evaluate the
ability of SchA to inhibit cell viability. The IC50 and
95% CI in the A549, H1299, H1975 and BEAS-2B cell lines were 61.09
(44.47-177.0), 101.5 (65.45-529.2), 39.99 (33.48-59.28) and 49.45
(44.84-57.16) µM, respectively. The A549 and H1975 cell
lines appeared to be more sensitive to SchA, whilst the H1299 cell
line was more resistant. As the treatment time with 50 µM
SchA was prolonged (0, 12, 24, 36 and 48 h), the viability of the
A549 and H1975 cell lines was also markedly reduced (Fig. 1D). SchA (50 µM) exerted a
potent inhibitory effect on the viability of A549 and H1975 cells
24 h after treatment (Fig. 1C and
D).
Colony formation assay was used to detect the effect
of SchA on cell proliferation and colony formation. The results
showed that SchA could significantly inhibit the colony formation
abilities of A549 and H1975 cells, where this inhibitory effect was
concentration-dependent (Fig. 1E and
F).
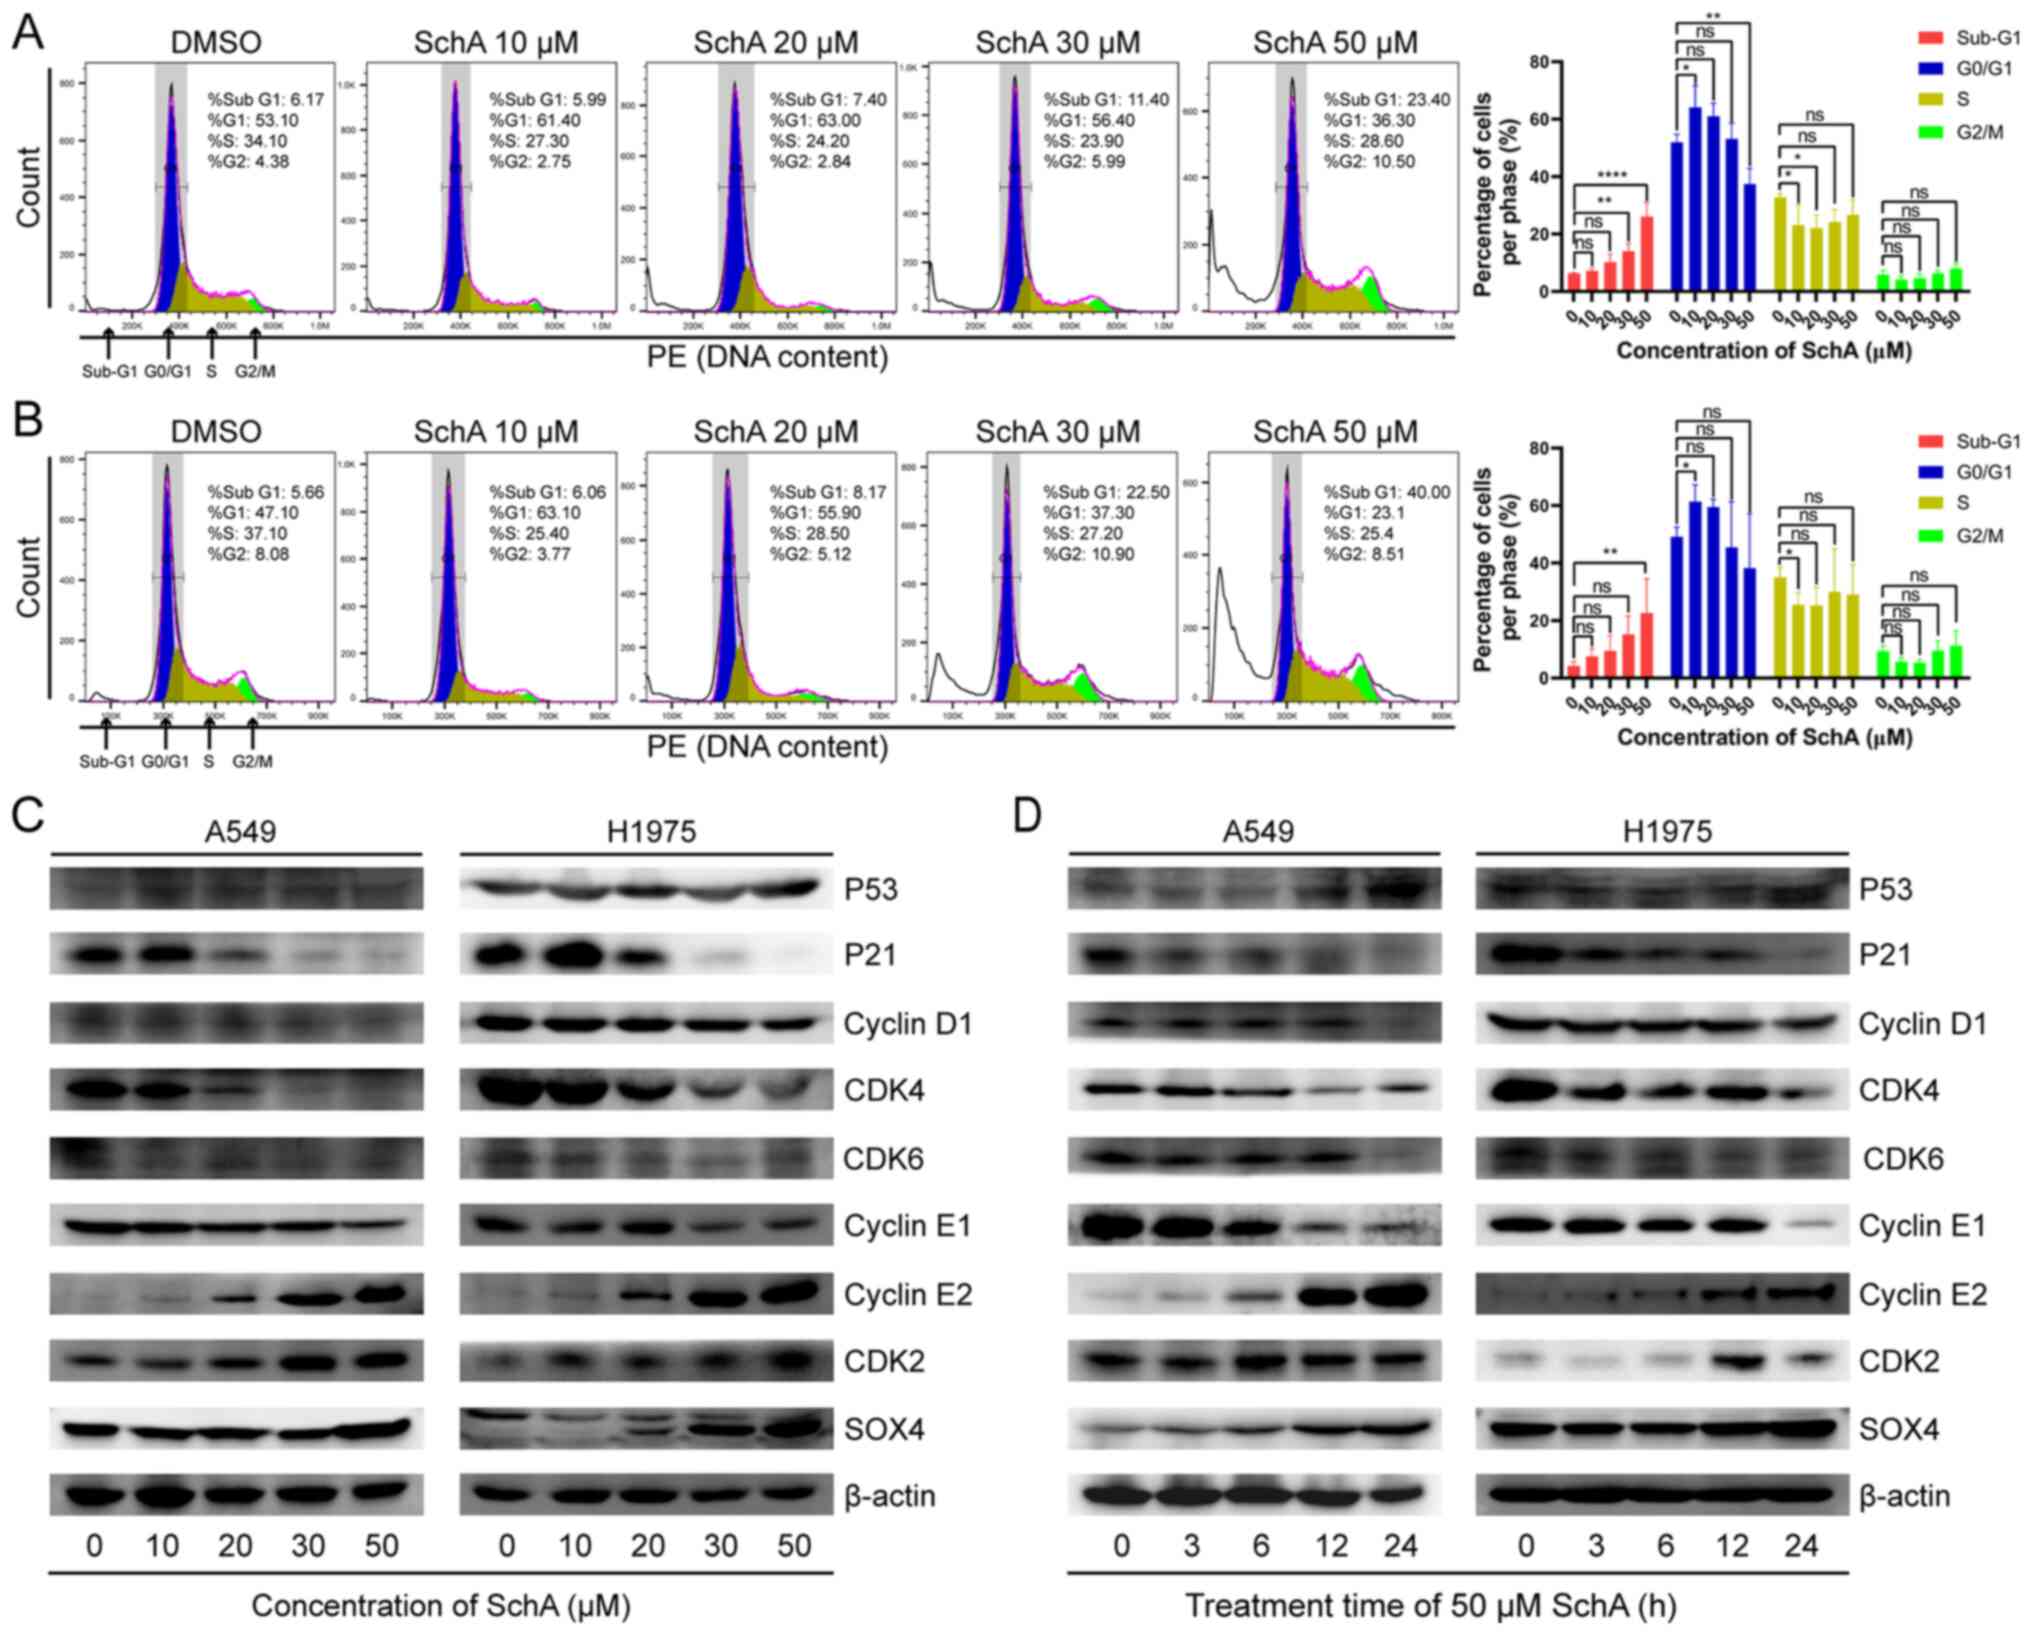
SchA triggers cell cycle arrest in A549
and H1975 cells
The biological process that is most closely
associated with cell proliferation is cell mitosis. Therefore, to
investigate the effect of SchA on mitosis, the cell cycle was
evaluated using flow cytometry after PI staining. After treatment
of A549 and H1975 cells with increasing concentrations of SchA (0,
10, 20, 30 and 50 µM) for 24 h, cell cycle progression was
assessed. As shown in Fig. 2A and
B, after the cells were treated with lower concentrations of
SchA (10-20 µM), the percentage of cells in the
G0/G1 phase was significantly increased.
However, after the cells were treated with higher concentrations of
SchA (20-50 µM), the percentage of cells in the
G0/G1 phase was gradually decreased (Fig. 2A and B). Although the percentage
of cells in S phase and G2/M phase gradually increased,
no statistical significance could be found. In addition, as the
concentration of SchA increased, the proportion of cells in the
sub-G1 phase was also significantly increased. This
suggest that lower concentrations of SchA (10-20 µM) can
induce G1/S-phase arrest, whilst higher concentrations
of SchA (20-50 µM) can induce apoptosis.
Western blot analysis was subsequently used to
measure changes in the expression levels of cell cycle-related
proteins. As the concentration of SchA was increased (0, 10, 20, 30
and 50 µM), the protein expression levels of p53, cyclin E2,
CDK2 and SOX4 were increased, whilst the protein expression levels
of cyclin D1, CDK4, CDK6 and cyclin E1 were decreased (Fig. 2C and D). The protein expression
levels of p21 were increased initially, peaking at 10 µM
SchA before decreasing again at higher concentrations (Fig. 2C). After the cells were treated
with 50 µM SchA for increasing periods time (0, 3, 6, 12 and
24 h), the protein expression levels of p53, cyclin E2, CDK2 and
SOX4 were increased, whereas the protein expression levels of p21,
cyclin D1, CDK4, CDK6 and cyclin E1 were decreased (Fig. 2D).
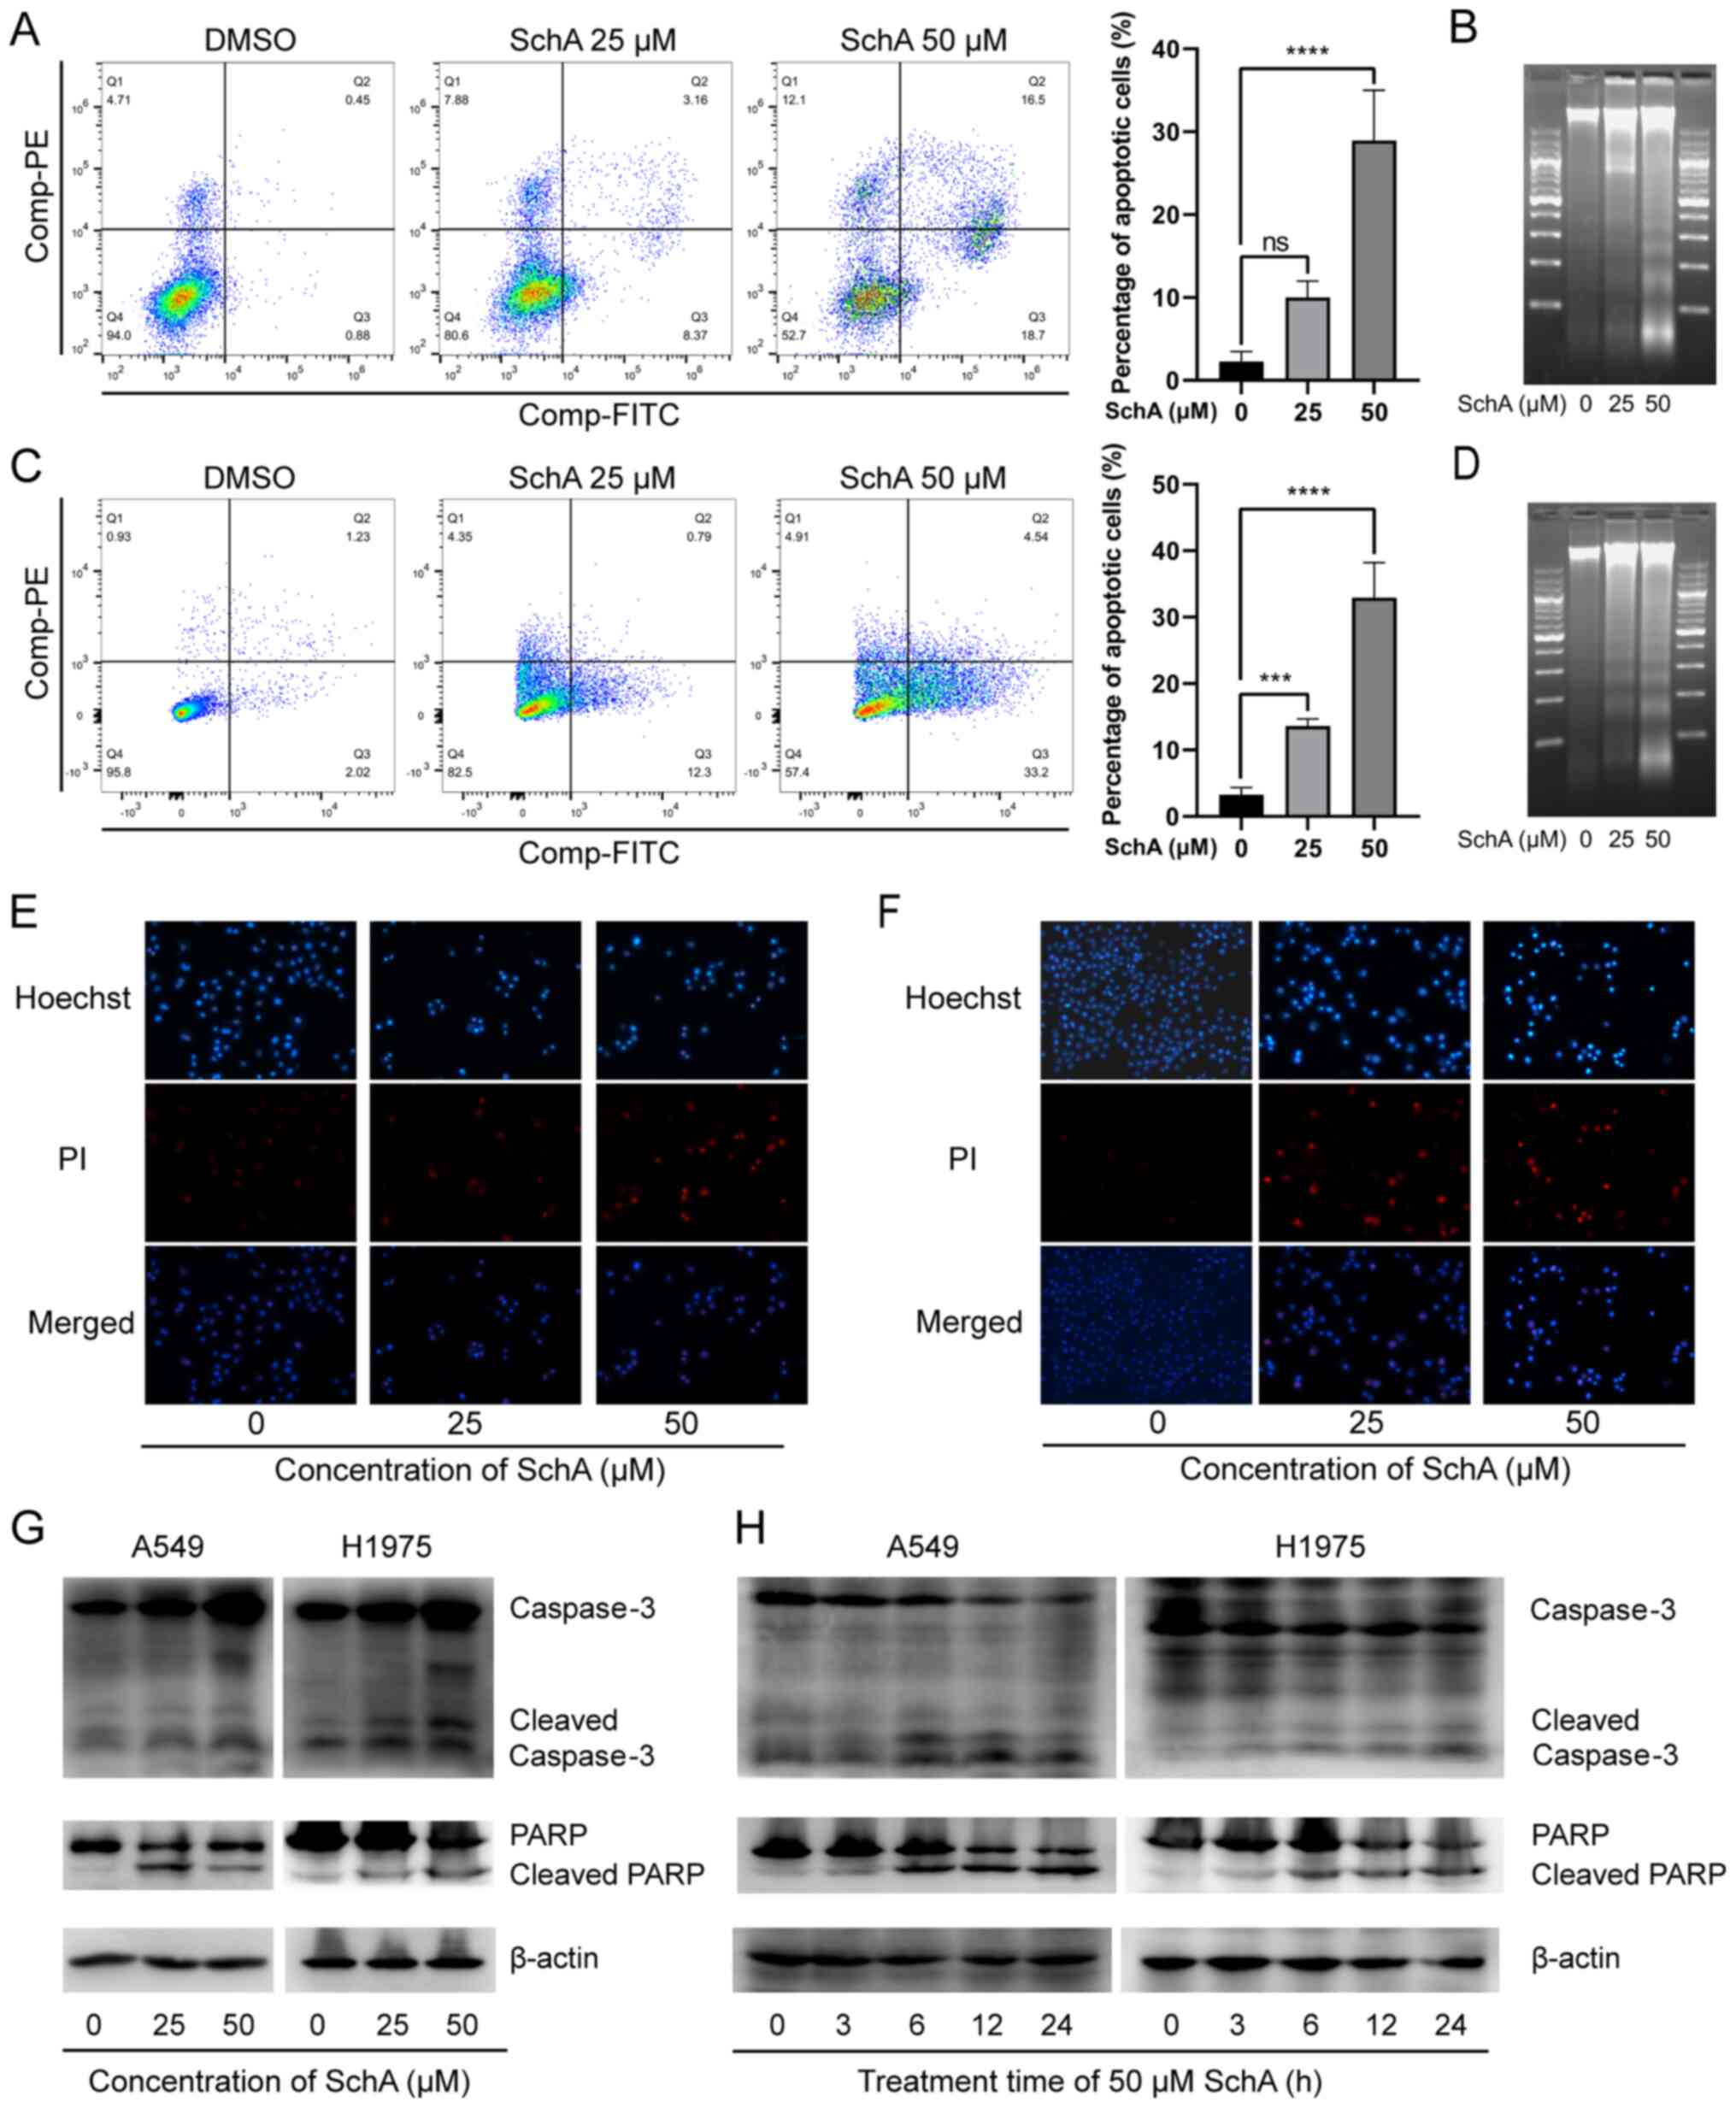
SchA induces apoptosis in A549 and H1975
cells
Sub-G1 cells are hypodiploid cells with
an incomplete genome (51). SchA
was previously found to increase the percentage of
sub-G1 cells whilst also increasing the expression of
the DNA damage-related proteins p53 and SOX4 (52). This suggests that DNA damage and
apoptosis occurred in the cells following treatment with SchA. In
the present study, the percentage of apoptotic cells was detected
using flow cytometry and Annexin V-FITC/PI double-staining. The
results indicated that the number of early and late apoptotic cells
was significantly increased with increasing SchA concentrations
(Fig. 3A and B). In addition,
DNA electrophoresis was used to detect the effect of SchA on DNA
integrity. It was found that SchA treatment caused DNA to break
into a characteristic ladder-like pattern (Fig. 3C and D). To investigate the
apoptosis-related morphological changes, the SchA-treated cells
were stained with Hoechst 33342 and PI before being observed using
fluorescence microscopy. The results showed that the cells treated
with SchA were shrunken, with evidence of fragmentation and emitted
irregular dense masses of blue fluorescence (Fig. 3E and F). In addition, PI red
fluorescence was also increased by SchA treatment (Fig. 3E and F).
To verify the effects of SchA on apoptosis on the
molecular level, western blot analysis was performed to measure
changes in the protein expression levels of apoptosis-related
proteins in cells treated with SchA. Following SchA treatment,
caspase-3 and PARP in A549 and H1975 cells were cleaved, such that
the expression levels of cleaved caspase-3 and cleaved PARP were
markedly increased (Fig. 3G and
H). These findings suggest that SchA induced apoptosis in A549
and H1975 cells.
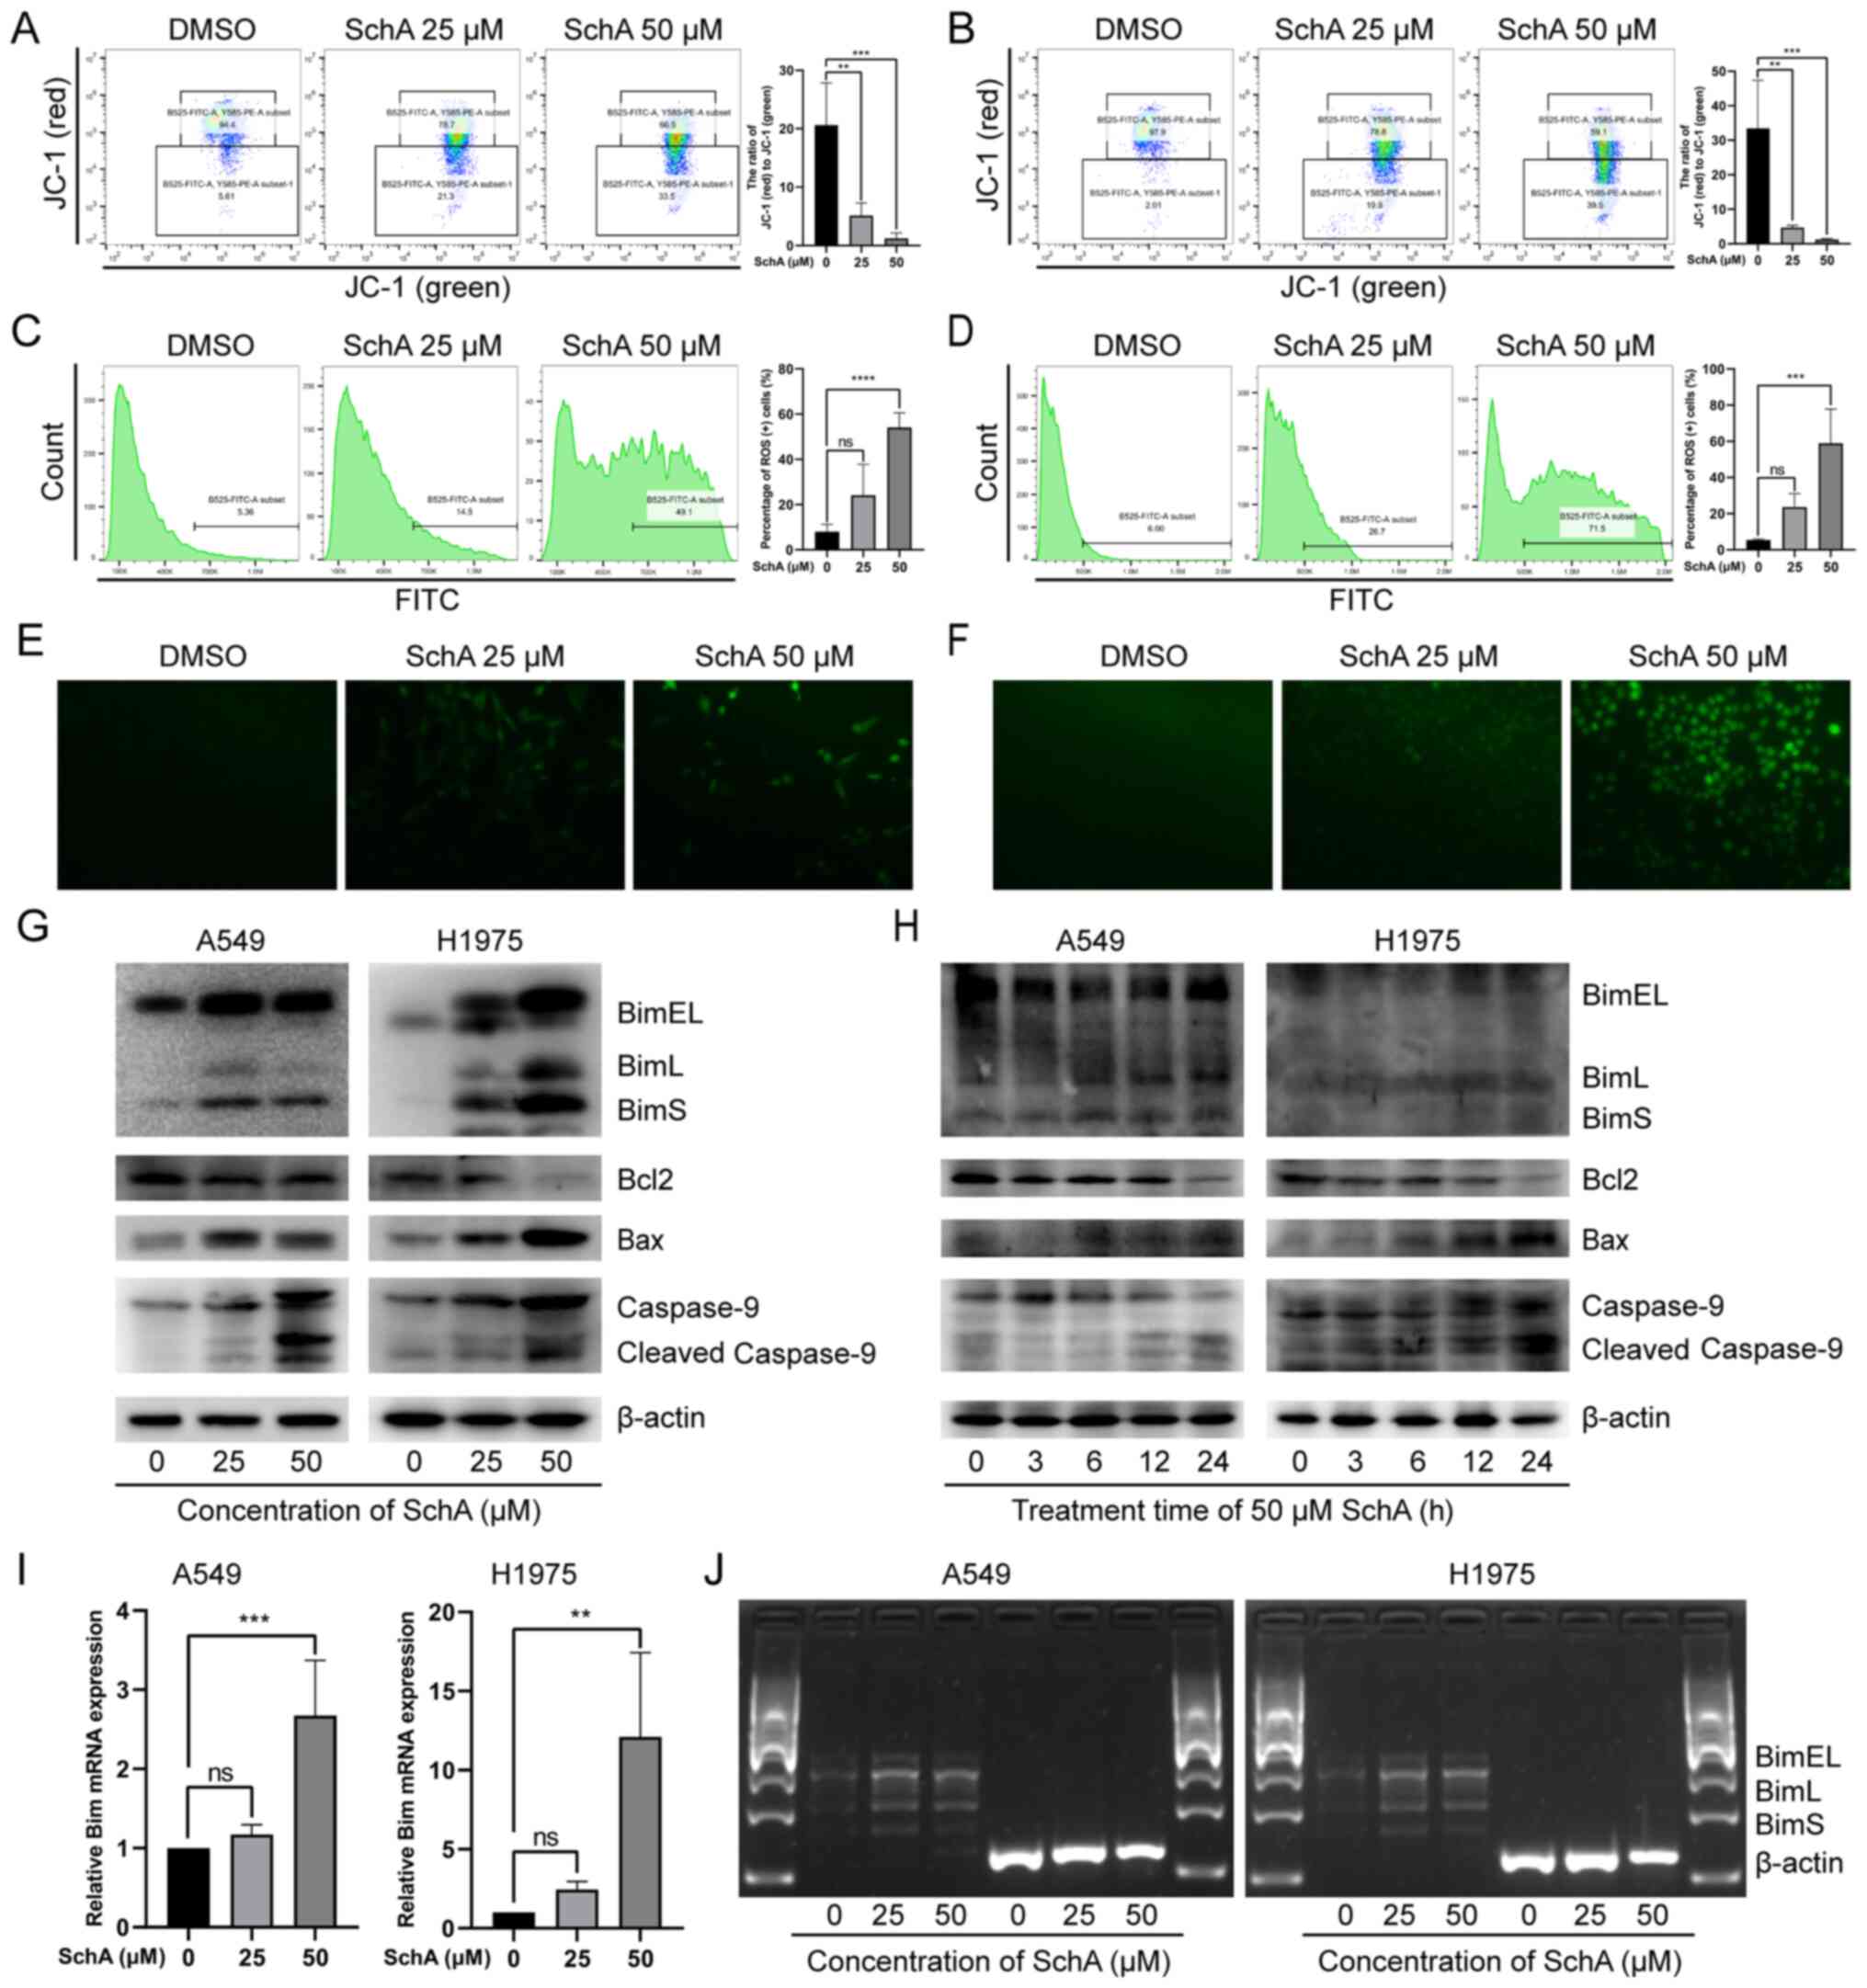
SchA induces the loss of MMP in the NSCLC
cell lines
Mitochondrial damage is one of the key features of
apoptotic cells, where the loss of MMP is an essential
manifestation of mitochondrial damage (53). To investigate the effect of SchA
on mitochondrial physiology, JC-1 staining was used to detect the
integrity of the MMP in A549 and H1975 cells after treatment with
SchA. The red JC-1 aggregates represent intact MMP, whilst green
JC-1 monomers represents damaged MMP. As the concentration of SchA
increased (0, 25 and 50 µM), the number of cells emitting
red fluorescence was decreased, whilst the number of cells emitting
green fluorescence was increased (Fig. 4A and B). As a result, there was a
significant decrease in the ratio of red (JC-1 aggregates)/green
(JC-1 monomers) fluorescence (Fig.
4A and B), suggesting that SchA induced MMP damage in A549 and
H1975 cells.
SchA induces changes in the level and
distribution of intracellular ROS
Mitochondrial damage leads to impaired oxidative
phosphorylation and electron transport chain, which results in
excessive ROS production and release from mitochondria (54). Excessive and abnormally
distributed ROS can also affect mitochondrial function and reduce
cell viability (54). To detect
whether the ROS level was affected by SchA, DCFH-DA probes were
used to evaluate intracellular ROS levels in the A549 and H1975
cells. The results of DCFH-DA staining were first detected using
flow cytometry (Fig. 4C and D).
As the concentration of SchA was increased, the number of cells
emitting green fluorescence was also markedly and gradually
increased, with the green fluorescence intensity strengthening
progressively.
The results of DCFH-DA probe staining were also
observed using fluorescence microscopy. As shown in Fig. 4E and F, after SchA treatment
DCFH-DA green fluorescence in A549 and H1975 cells increased in
intensity, which was widely distributed in the cytoplasm. These
findings indicate that SchA increased the levels of intracellular
ROS and disrupted the distribution of ROS in A549 and H1975
cells.
SchA induces changes in the expression of
mitochondrial apoptosis pathway-related proteins
To verify if SchA induces cell apoptosis by
activating the mitochondrial pathway, western blot analysis was
used to detect the expression levels of mitochondrial apoptosis
pathway-related proteins. As shown in Fig. 4G and H, after SchA treatment the
expression levels of pro-apoptotic mitochondrial proteins, BimEL,
BimL, BimS and Bax in A549 and H1975 cells were markedly increased.
By contrast, the expression level of the anti-apoptotic protein
Bcl-2 was decreased. In addition, the expression level of
mitochondrial apoptosis biomarker, cleaved-caspase 9 (55), was markedly increased.
Bim is involved in sensing cellular stress and
initiates the mitochondrial apoptosis pathway (56). Bim gene transcription typically
increases after the cellular stress response and is expressed in
the form of various alternative splice variants, including BimEL,
BimL and BimS (48,57). Subsequently, it was found that
the protein expression levels of BimEL, BimL and BimS in the cells
were increased after SchA treatment. This may be due to reduced
degradation or increased expression of the Bim protein. To detect
the effect of SchA on the mRNA expression level of the Bim
gene, RT-qPCR was used to detect the mRNA expression levels of Bim.
As shown in Fig. 4I, SchA
increased of the mRNA expression levels of total Bim in A549 and
H1975 cells. In addition, the expression of the mRNA levels of
BimEL, BimL and BimS in the A549 and H1975 cells were also measure
through RT-PCR. It was found that the mRNA expression levels of
BimEL, BimL and BimS were also increased after SchA treatment
(Fig. 4J). These results suggest
that SchA enhanced Bim gene transcription in A549 and H1975
cells.
SchA induces autophagy in A549 and H1975
cells
To investigate the effect of SchA on autophagy in
A549 and H1975 cells, they were treated with SchA and stained with
MDC and Hoechst 33342. Results were then observed by fluorescence
microscopy. In the control cells, Hoechst 33342 emitted weak and
uniform blue fluorescence whereas MDC emitted uniform yellow/green
fluorescence. In the SchA treated cells, Hoechst 33342 showed
irregularly concentrated blue fluorescence whilst MDC showed dense
green bodies in the cytoplasm (Fig.
5A and B). The blue fluorescence of Hoechst 33342 and the
yellow/green fluorescence intensity of MDC were increased as the
SchA concentration was increased (Fig. 5A and B).
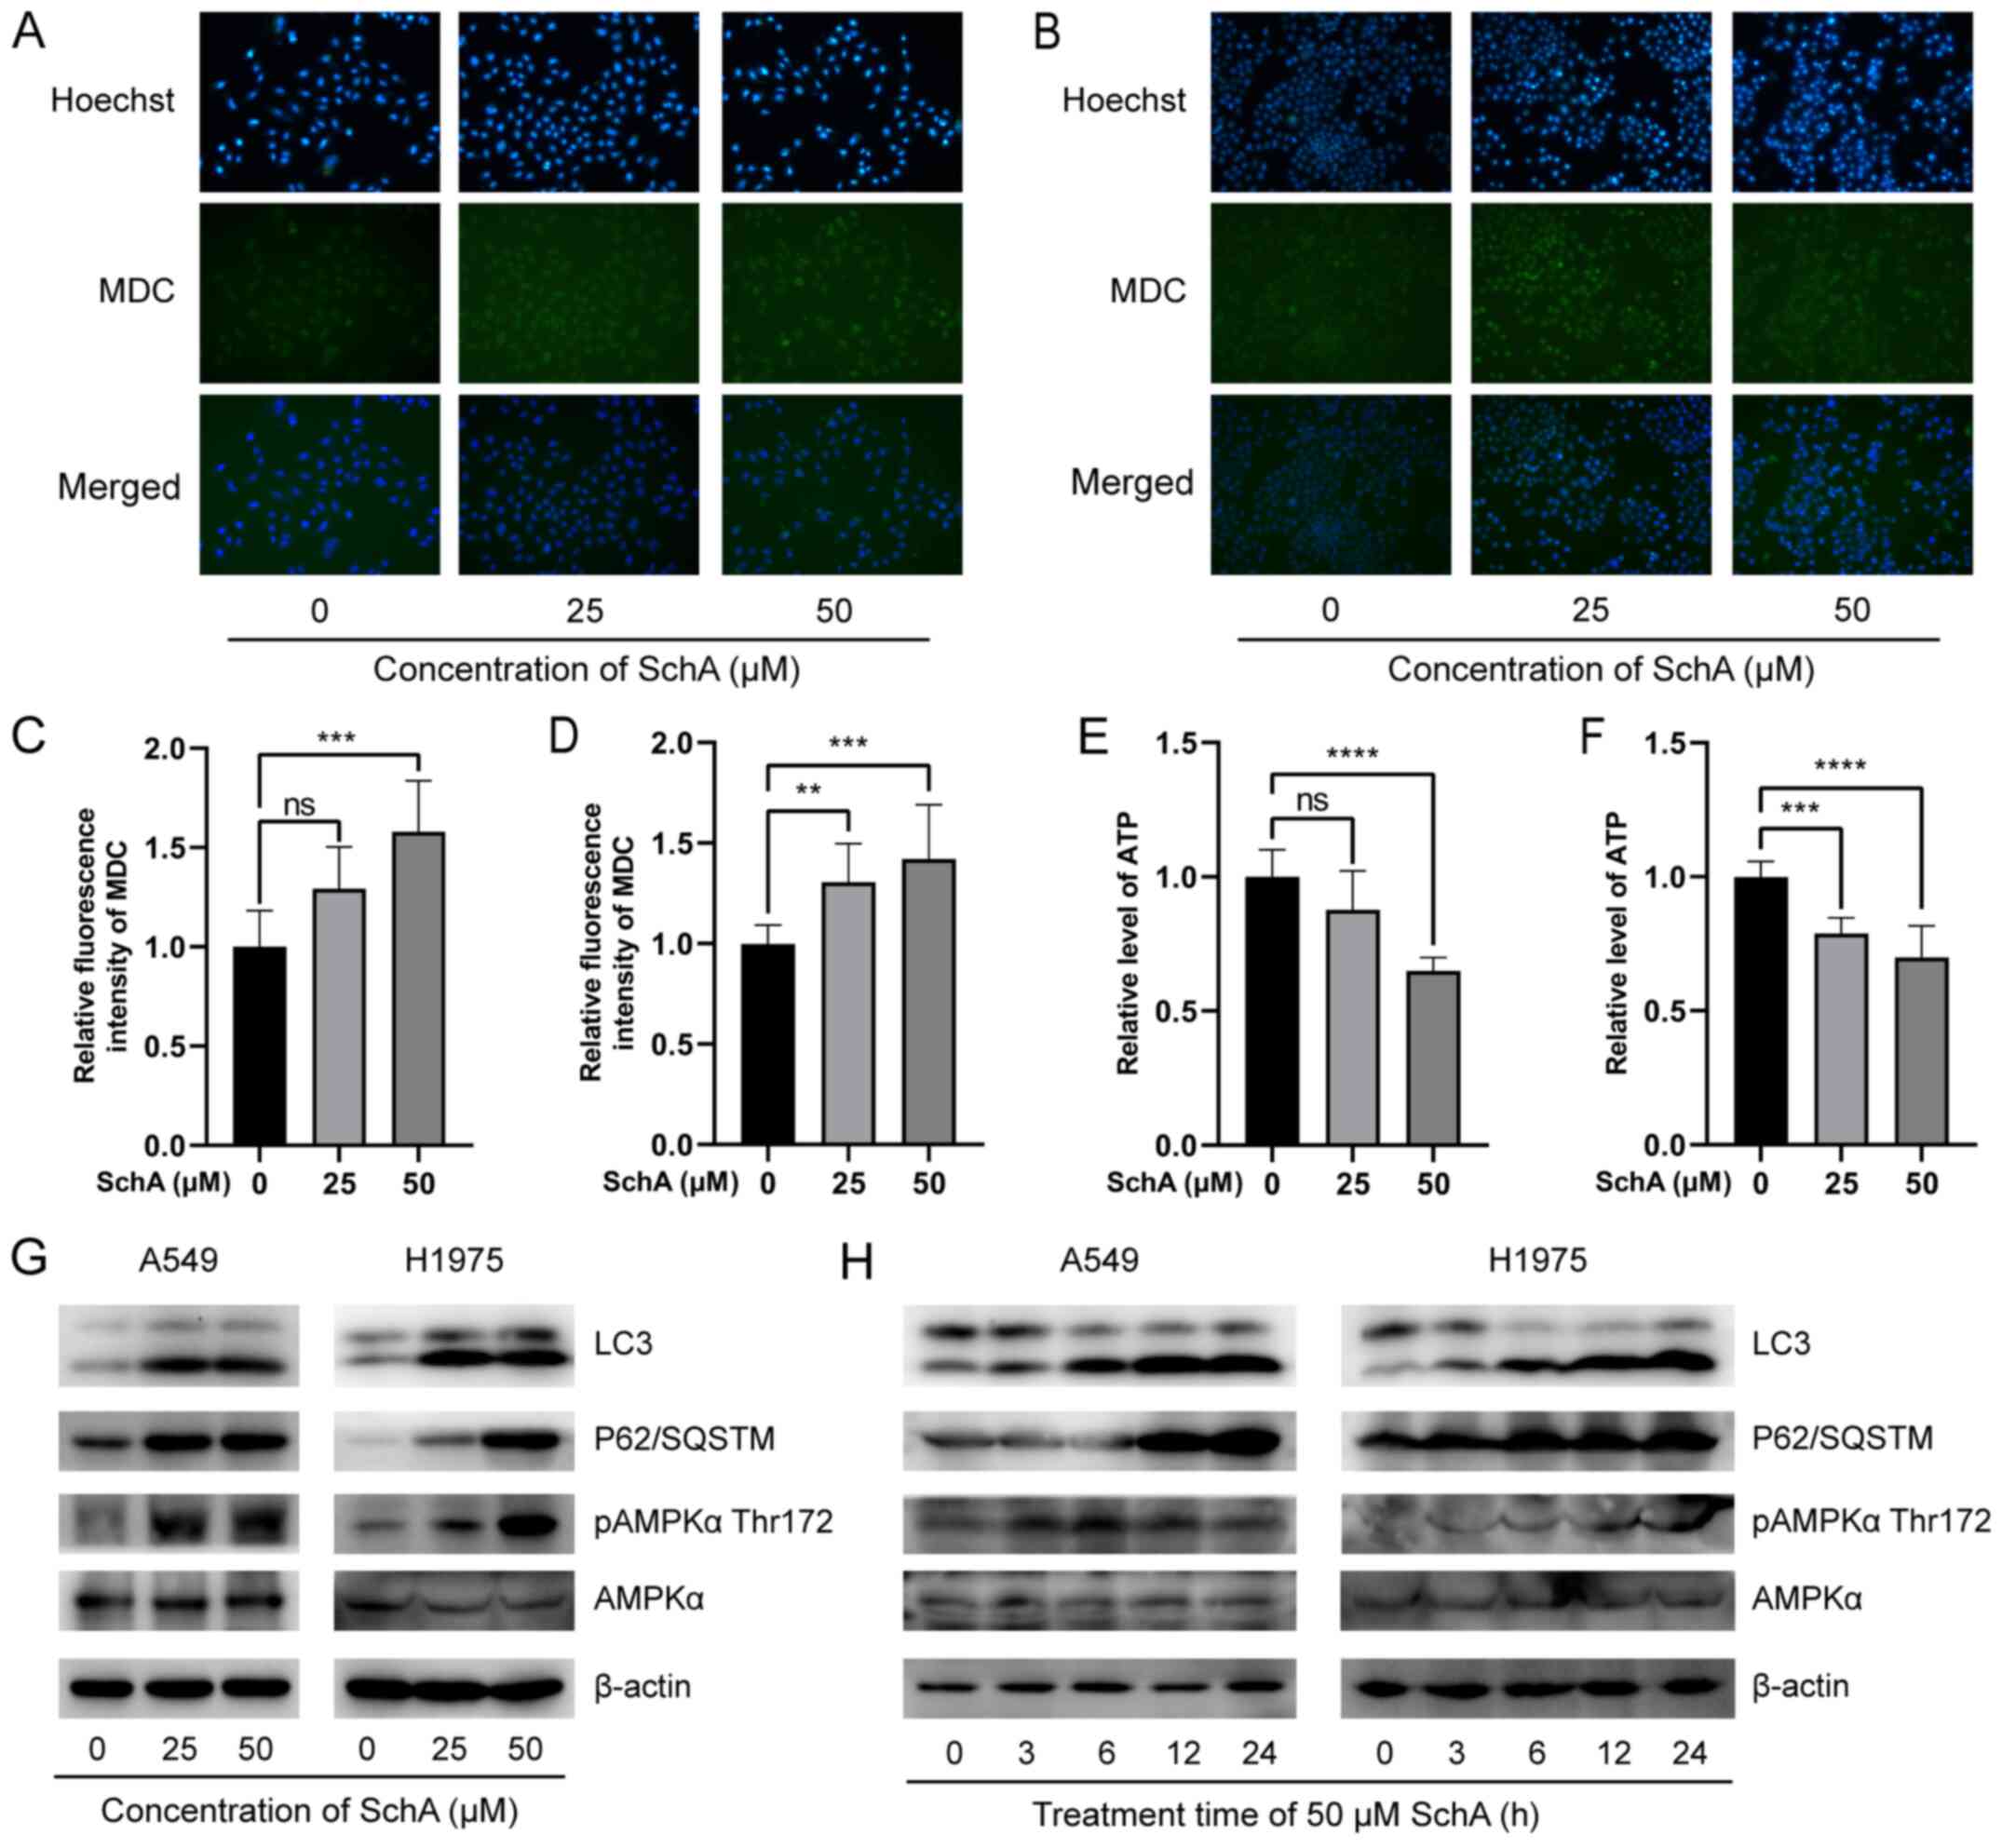 | Figure 5Effects of SchA on autophagy in A549
and H1975 cells. MDC and Hoechst 33342 staining, observed using
fluorescence microscopy at ×200 magnification showed that SchA
caused the blue fluorescence of Hoechst 33342 and the green
fluorescence of MDC in the (A) A549 and (B) H1975 cell lines to
increase at irregular concentrations. MDC staining measured using a
microplate reader showed that SchA significantly increased the
fluorescence intensity of MDC in (C) A549 and (D) H1975 cells. SchA
reduced intracellular ATP levels in (E) A549 and (F) H1975 cells.
(G) As the concentration of SchA increased, the protein expression
levels of LC3, p62 and AMPKα-T172 phosphorylation in A549 and H1975
cells were increased. (H) The protein expression levels of LC3,
p62/SQSTM1 and AMPKα-T172 phosphorylation in the A549 and H1975
cells were increased following treatment with 50 µM SchA at
different time points. **P<0.01,
***P<0.001 and ****P<0.0001. MDC,
dansylcadaverine; SchA, Schizandrin A; ns, non-significant; p,
phosphorylated; AMPK, 5'AMP-activated protein kinase. |
In addition, a multifunctional microplate reader was
used to detect the fluorescence intensity of the MDC-stained cells.
Compared with that in the control cells, the green fluorescence
intensity in A549 and H1975 cells treated with SchA was
significantly increased (Fig. 5C and
D).
To verify that SchA activated the autophagy pathway,
western blot analysis was used to evaluate the expression levels of
the autophagy-related proteins. The results are shown in Fig. 5G and H. As the concentration or
the treatment time of SchA increased, the protein expression levels
of LC3-II were significantly increased. However, p62 protein
expression was increased, suggesting that p62 was not degraded
during the autophagic flux. This process was similar to the
inhibition of autophagy by chloroquine (CQ) and bafilomycin A1
(BafA1), which inhibited the fusion of autophagosomes and lysosomes
(58,59). This observation suggests that
whilst SchA did activate autophagy, it hindered the degradation of
autophagy substrates, specifically the p62 protein.
SchA induces autophagy in A549 and H1975
cells by reducing ATP levels and activating the AMPK pathway
Insufficient energy and ATP production is an
important cause of autophagy in cells (60). In the present study, an ATP
detection kit was used to detect the effects of SchA on
intracellular ATP levels. As shown in Fig. 5E and F, as the concentration of
SchA increased, the intracellular ATP levels were significantly
decreased. This suggests that SchA reduced the levels of
intracellular ATP.
AMPK is a key intracellular energy sensor (61). Changes in the protein levels of
pAMPKα-T172 and AMPKα in A549 and H1975 cells after SchA treatment
were measured using western blot analysis. It was found that with
increasing the concentration and the treatment time of SchA,
markedly increased AMPKα-T172 phosphorylation in A549 and H1975
cells (Fig. 5G and H). This
indicated that SchA activated the AMPK signaling pathway in these
cells, consistent with the finding that SchA reduced the
intracellular ATP levels. This reduction in intracellular ATP
levels and activation of the AMPK signaling pathway may be the
cause of autophagy induction by SchA.
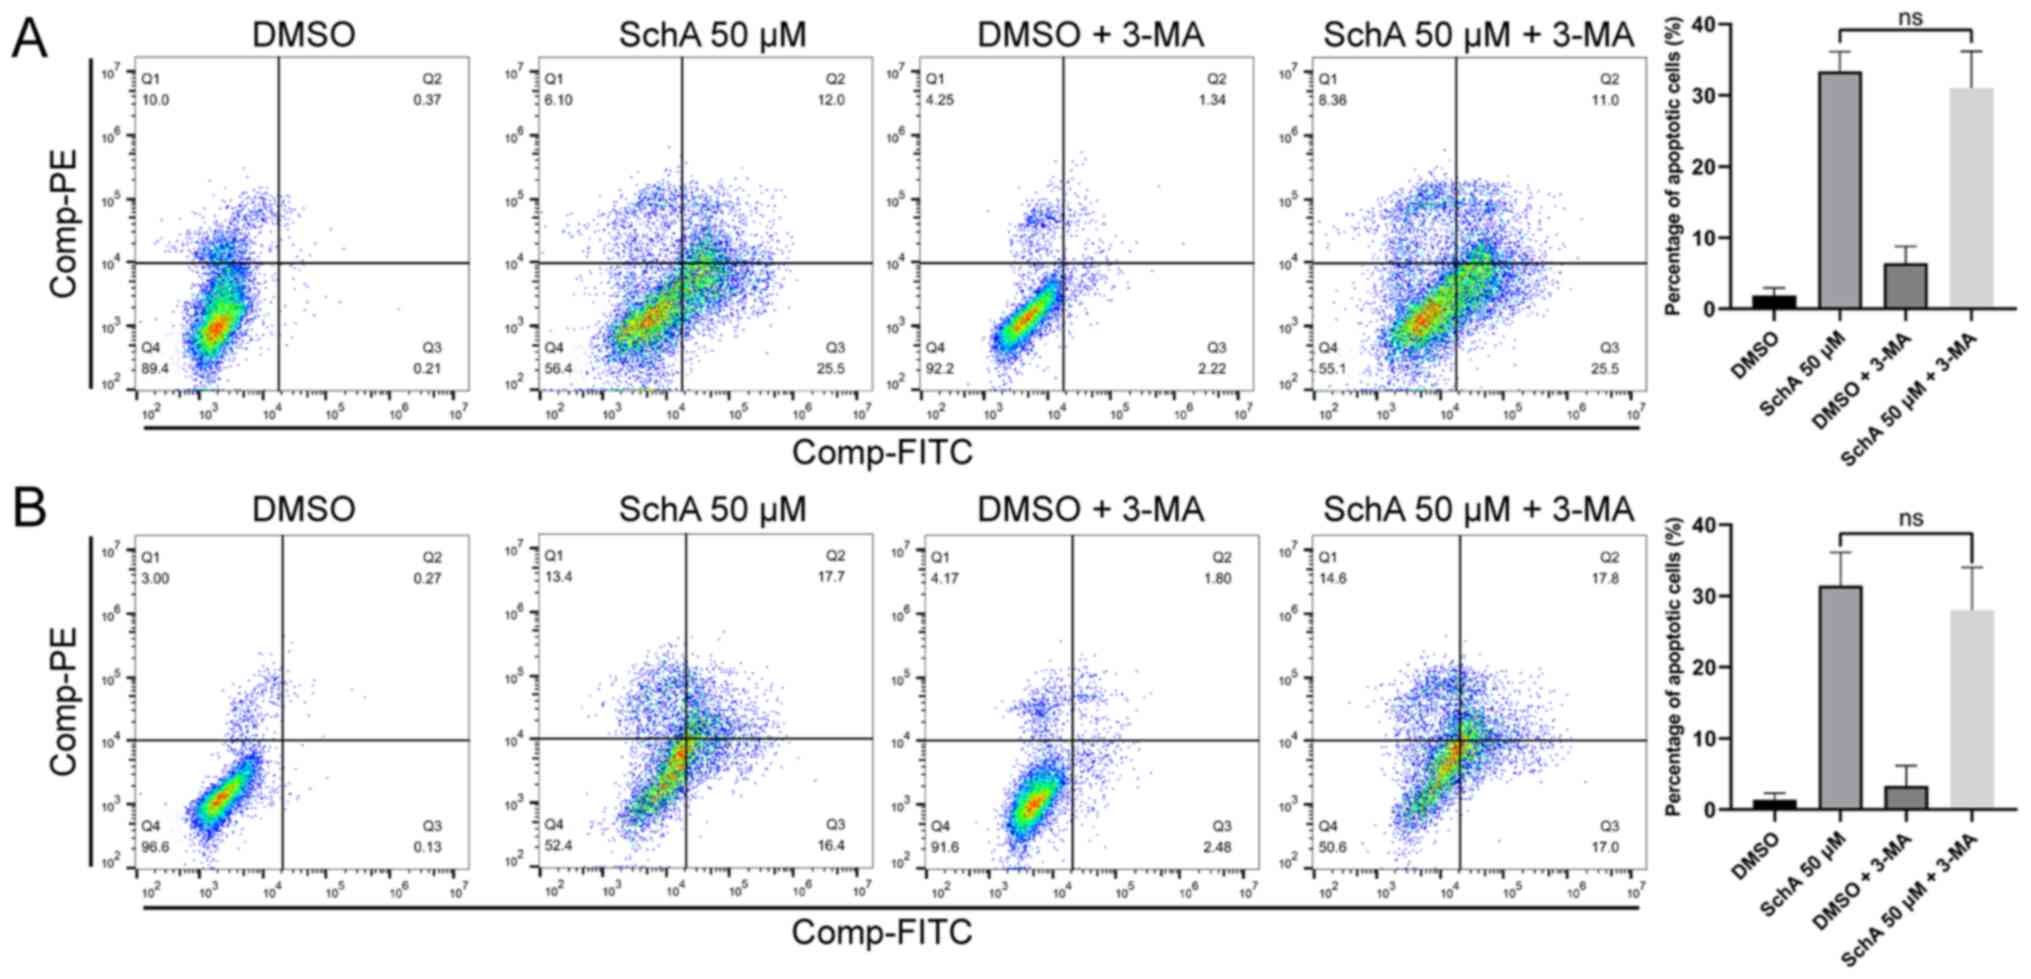
Effect of inhibiting autophagy on
SchA-induced apoptosis
Although SchA-treated A549 and H1975 cells exhibited
autophagy activation, this process of autophagy did not result in
substrate degradation. Commonly used autophagy inhibitors include
3-methyladenine (3-MA), CQ and BafA1 (62). CQ and BafA1 mainly inhibit the
fusion of autophagosomes and lysosomes, whereas 3-MA inhibits
autophagosome formation (62).
In the present study, the autophagosome formation inhibitor, 3-MA
was used to inhibit the early stages of autophagy flux and observe
the effects of 3-MA on the cytotoxicity of SchA. After the cells
were pre-treated with 3-MA for 4 h, 50 µM SchA was added to
treat the cells for 24 h, before apoptosis of the cells was
measured using flow cytometry. As shown in Fig. 6A and B, the autophagy inhibitor
3-MA did not induce any significant effects on cell apoptosis
induced by SchA. This result suggests that SchA-induced autophagy
has little impact on apoptosis.
Discussion
Designing or screening drugs based on the biological
characteristics of cancer is an effective method of developing
novel strategies for treatment (63). In recent years, numerous studies
have shown that SchA has anti-tumor effects. Yan and Guo (35) previously reported that 30
µM SchA could inhibit proliferation, promote apoptosis and
inhibit invasion in breast cancer cells. In another study, Xu et
al (38) reported that 41.4
µM SchA could inhibit breast cancer cell proliferation and
induce cell apoptosis, where the oral administration of SchA (25
mg/kg) could inhibit breast cancer growth in tumor-bearing nude
mice. In addition, the weight of the nude mice was not
significantly reduced, suggesting that the oral application of SchA
was relatively safe (38). Ji
and Ma revealed that 50 µM SchA could inhibit
choriocarcinoma cell proliferation, invasion and migration whilst
inducing apoptosis (36). In
addition, Chen et al (37) reported that 68.65 µM SchA
could inhibit the proliferation and colony formation by colorectal
cancer cells in addition to inducing apoptosis. Ding et al
demonstrated that 100 µM SchA could significantly inhibit
the proliferation, invasion and migration of thyroid cancer cells
(39). Furthermore, Bi et
al reported that 30 µM SchA can inhibit the
proliferation and invasion of malignant melanoma cells to induce
apoptosis (40). In the present
study, SchA was found to inhibit the proliferation of NSCLC cells
and induced apoptosis. SchA was cytotoxic to the H1975 cell lines
at 39.99 µM, whilst higher concentrations (101.5 µM)
were required for H1299 cell cytotoxicity. The normal lung
epithelial cell line BEAS-2B, was also sensitive to SchA, which may
limit the clinical application of SchA. However, SchA is an
important agent for investigation, since it could provide a basic
starting point and has the potential for the optimization of more
selective and effective, but less toxic derivatives (64).
SchA at low concentrations (10-20 µM) induced
G1/S-phase arrest, whereas high concentrations of SchA
(≥30 µM) caused cell apoptosis. This suggests that SchA
caused DNA damage at low concentrations, but the cells could
maintain G1/S-phase arrest to repair the DNA damage. As
the concentration of SchA increased and the treatment time was
prolonged, the cells gradually lost the ability to maintain the
G1/S-phase arrest and entered the S-phase for DNA replication. DNA
replication under stress will lead to fatal DNA damage (65,66), causing a large number of cells to
be blocked at the G2/M cycle checkpoint and undergo cell
death.
At low concentrations of SchA, the expression level
of the p21 protein increased and the cells were blocked at the
G1/S-phase. As the concentration of SchA increased, the
expression level of the p21 protein was decreased, whilst the
expression levels of cyclin E2 and CDK2 were increased. This
suggest that the increase in p21 may cause SchA-mediated cell
G1/S-phase arrest. However, subsequently the reduction
in p21 expression and elevated CDK2 and cyclin E2 expression could
cause the cells to overcome G1/S-phase arrest and enter
the S-phase. In colorectal cancer cells, Rehman et al
(67) found that when the
colorectal cancer cells were treated with the chemotherapy drugs
irinotecan or FOLFIRI (5-FU, leucovorin and irinotecan), they would
enter a slow-dividing, diapause-like, drug-tolerant persister (DTP)
state with low energy consumption to resist chemotherapy.
Therefore, it was proposed that a precise attack on cancer cells
entering the diapause-like DTP state could be an effective method
to overcome cancer resistance to chemotherapy (67). In the present study, it was found
that G1/S phase arrest occurred when the cells were
damaged by SchA, thereby preventing the cells from entering the
S-phase and subsequent apoptosis. G1/S-phase arrest could also be
one of the protection mechanisms of cancer cells (68). Reduction in p21 protein
expression and increase in CDK2 and cyclin E2 protein expression
could cause DNA-damaged cancer cells to overcome G1/S
phase arrest and enter the S-phase, thereby inducing apoptosis.
Therefore, p21, CDK2 and cyclin E2 proteins could potentially be
effective targets for overcoming drug resistance in NSCLC
cells.
Autophagy is a self-degradation cellular process
activated by stress responses, such as starvation, hypoxia or
oxidative stress (69). The
autophagy mechanism can decompose and recycle intracellular
aggregated macromolecular structures or damaged organelles to
provide raw materials for the pro-survival metabolic cycle
(70). This regulates
intracellular homeostasis and assist cells in surviving unfavorable
environments (60). Autophagy
serves a key role in the development and progression of a variety
of tumors, such as lung cancer, breast cancer, stomach cancer,
bowel cancer, prostate cancer and pancreatic cancer, and is also
one of the main causes of cancer drug resistance (70-75). In the present study, SchA could
activate the stress response and induce autophagy in the A549 and
H1975 cell lines. However, the autophagy activated by SchA was
incomplete, which mainly manifested as the efficient degradation of
the autophagy substrate p62.
AMPK is an evolutionarily conserved
serine/threonine protein kinase that acts as an energy sensor in
cells (76). It serves a crucial
role in the activation of catabolism and inactivation of anabolism
(61). Under physiological and
pathological conditions, AMPK can be phosphorylated by upstream
kinases and bind to AMP or ADP instead of ATP, leading to AMPK
activation (77). Activated AMPK
regulates various metabolic processes, including autophagy
(78). AMPK directly promotes
autophagy by phosphorylating autophagy-related proteins in the mTOR
complex 1, unc-51 like autophagy activating kinase 1 and
phosphatidylinositol 3-kinase catalytic subunit type 3 complex, or
indirectly promoting autophagy by regulating transcription factors,
such as forkhead box O3, transcription factor EB and
bromodomain-containing protein 4 (78). In the present study, it was found
that SchA reduced the level of intracellular ATP and activated AMPK
signaling, which may be one of the mechanisms by which SchA induces
autophagy in the NSCLC cell lines.
If autophagy mediates protective effects on cells,
then promoting autophagy could inhibit SchA-induced apoptosis and
inhibiting autophagy could promote SchA-induced apoptosis. Commonly
used inhibitors of autophagy are CQ (79), BafA1 (59), 3-MA (80) and specific and potent autophagy
inhibitor-1 (62,81,82). In the present study, the
inhibitor 3-MA, which can inhibit the early stage of autophagy
(62), was added to inhibit
autophagy before the effects of SchA on cell apoptosis was
analyzed. It was found that 3-MA did not promote or inhibit
SchA-induced cell apoptosis. The present study showed that the
incomplete autophagy induced by SchA did not promote cell survival.
It was suggested that insufficient autophagy failed to supply
recycled materials to sustain pro-survival cellular metabolic
processes and maintain homeostasis.
To conclude, the small molecule compound SchA
extracted from the medicinal plant Schisandra exerted specific
cytotoxic effects on the NSCLC cell lines. When the concentration
of SchA is low, it mediated G1/S-phase cell cycle
arrest, whilst at higher concentrations SchA it can cause cell
apoptosis. Although, SchA can induce autophagy by activating the
AMPK signal, the autophagy process induced by SchA remains
incomplete and fails to promote cell survival.
Availability of data and materials
The datasets used and/or analyzed during the
current study are available from the corresponding author on
reasonable request.
Authors' contributions
LZ and JH designed the study. YW also designed the
study and performed the cell viability assays. WL designed the
study and performed drug screening and reagent preparation. XW
performed the western blotting experiments. HS designed the study
and performed the flow cytometry experiments. CH performed the PCR
and western blotting experiments. LZ and JH can confirm the
authenticity of all the raw data. All authors have read and
approved the final version of the manuscript.
Ethics approval and consent to
participate
Not applicable.
Patient consent for publication
Not applicable.
Competing interests
The authors declare that they have no competing
interests.
Acknowledgments
Not applicable.
References
|
1
|
International Agency for Research on
Cancer (IARC): Latest global cancer data: Cancer burden rises to
19.3 million new cases and 10.0 million cancer deaths in 2020.
Questions and Answers (Q&A). https://www.iarc.who.int/faq/latest-global-cancer-data-2020-qa/.
Accessed January 10, 2021.
|
|
2
|
Zheng M: Classification and pathology of
lung cancer. Surg Oncol Clin N Am. 25:447–468. 2016. View Article : Google Scholar : PubMed/NCBI
|
|
3
|
Duma N, Santana-Davila R and Molina JR:
Non-small cell lung cancer: Epidemiology, screening, diagnosis, and
treatment. Mayo Clin Proc. 94:1623–1640. 2019. View Article : Google Scholar : PubMed/NCBI
|
|
4
|
Siegel RL, Miller KD, Fuchs HE and Jemal
A: Cancer Statistics, 2021. CA Cancer J Clin. 71:7–33. 2021.
View Article : Google Scholar : PubMed/NCBI
|
|
5
|
Jänne PA, Yang JC, Kim DW, Planchard D,
Ohe Y, Ramalingam SS, Ahn MJ, Kim SW, Su WC, Horn L, et al: AZD9291
in EGFR inhibitor-resistant non-small-cell lung cancer. N Engl J
Med. 372:1689–1699. 2015. View Article : Google Scholar : PubMed/NCBI
|
|
6
|
Ko B, Paucar D and Halmos B: EGFR T790M:
Revealing the secrets of a gatekeeper. Lung Cancer (Auckl).
8:147–159. 2017.
|
|
7
|
Shergold AL, Millar R and Nibbs RJ:
Understanding and overcoming the resistance of cancer to PD-1/PD-L1
blockade. Pharmacol Res. 145:1042582019. View Article : Google Scholar : PubMed/NCBI
|
|
8
|
Kobayashi S, Boggon TJ, Dayaram T, Jänne
PA, Kocher O, Meyerson M, Johnson BE, Eck MJ, Tenen DG and Halmos
B: EGFR mutation and resistance of non-small-cell lung cancer to
gefitinib. N Engl J Med. 352:786–792. 2005. View Article : Google Scholar : PubMed/NCBI
|
|
9
|
Regales L, Gong Y, Shen R, de Stanchina E,
Vivanco I, Goel A, Koutcher JA, Spassova M, Ouerfelli O,
Mellinghoff IK, et al: Dual targeting of EGFR can overcome a major
drug resistance mutation in mouse models of EGFR mutant lung
cancer. J Clin Invest. 119:3000–3010. 2009.PubMed/NCBI
|
|
10
|
Oxnard GR, Yang JC, Yu H, Kim SW, Saka H,
Horn L, Goto K, Ohe Y, Mann H, Thress KS, et al: TATTON: A
multi-arm, phase Ib trial of osimertinib combined with selumetinib,
savolitinib, or durvalumab in EGFR-mutant lung cancer. Ann Oncol.
31:507–516. 2020. View Article : Google Scholar : PubMed/NCBI
|
|
11
|
Yang JC, Shepherd FA, Kim DW, Lee GW, Lee
JS, Chang GC, Lee SS, Wei YF, Lee YG, Laus G, et al: Osimertinib
plus durvalumab versus osimertinib monotherapy in EGFR
T790M-positive NSCLC following previous EGFR TKI therapy: CAURAL
Brief Report. J Thorac Oncol. 14:933–939. 2019. View Article : Google Scholar : PubMed/NCBI
|
|
12
|
Hanahan D and Weinberg RA: Hallmarks of
cancer: The next generation. Cell. 144:646–674. 2011. View Article : Google Scholar : PubMed/NCBI
|
|
13
|
Noble RL, Beer CT and Cutts JH: Role of
chance observations in chemotherapy: Vinca rosea. Ann NY Acad Sci.
76:882–894. 1958. View Article : Google Scholar : PubMed/NCBI
|
|
14
|
Rosenberg B: Platinum coordination
complexes in cancer chemotherapy. Naturwissenschaften. 60:399–406.
1973. View Article : Google Scholar : PubMed/NCBI
|
|
15
|
Rowinsky EK and Donehower RC: Paclitaxel
(taxol). N Engl J Med. 332:1004–1014. 1995. View Article : Google Scholar : PubMed/NCBI
|
|
16
|
Zhang H, Bai L, He J, Zhong L, Duan X,
Ouyang L, Zhu Y, Wang T, Zhang Y and Shi J: Recent advances in
discovery and development of natural products as source for
anti-Parkinson's disease lead compounds. Eur J Med Chem.
141:257–272. 2017. View Article : Google Scholar : PubMed/NCBI
|
|
17
|
Ying J, Zhang M, Qiu X and Lu Y: The
potential of herb medicines in the treatment of esophageal cancer.
Biomed Pharmacother. 103:381–390. 2018. View Article : Google Scholar : PubMed/NCBI
|
|
18
|
Afanasenko A and Barta K: Pharmaceutically
relevant (hetero) cyclic compounds and natural products from
lignin-derived monomers: Present and perspectives. iScience.
24:1022112021. View Article : Google Scholar
|
|
19
|
Efferth T, Li PC, Konkimalla VS and Kaina
B: From traditional Chinese medicine to rational cancer therapy.
Trends Mol Med. 13:353–361. 2007. View Article : Google Scholar : PubMed/NCBI
|
|
20
|
Szopa A, Ekiert R and Ekiert H: Current
knowledge of Schisandra chinensis (Turcz.) Baill. (Chinese magnolia
vine) as a medicinal plant species: A review on the bioactive
components, pharmacological properties, analytical and
biotechnological studies. Phytochem Rev. 16:195–218. 2017.
View Article : Google Scholar :
|
|
21
|
Wang J, Jiang B, Shan Y, Wang X, Lv X,
Mohamed J, Li H, Wang C, Chen J and Sun J: Metabolic mapping of
Schisandra chinensis lignans and their metabolites in rats using a
metabolomic approach based on HPLC with quadrupole time-of-flight
MS/MS spectrometry. J Sep Sci. 43:378–388. 2020. View Article : Google Scholar
|
|
22
|
Liu M, Zhao S, Wang Z, Wang Y, Liu T, Li
S, Wang C, Wang H and Tu P: Identification of metabolites of
deoxyschizandrin in rats by UPLC-Q-TOF-MS/MS based on multiple mass
defect filter data acquisition and multiple data processing
techniques. J Chromatogr B Analyt Technol Biomed Life Sci.
949-950:115–126. 2014. View Article : Google Scholar : PubMed/NCBI
|
|
23
|
Liu X, Cong L, Wang C, Li H, Zhang C, Guan
X, Liu P, Xie Y, Chen J and Sun J: Pharmacokinetics and
distribution of schisandrol A and its major metabolites in rats.
Xenobiotica. 49:322–331. 2019. View Article : Google Scholar
|
|
24
|
Jung KY, Lee IS, Oh SR, Kim DS and Lee HK:
Lignans with platelet activating factor antagonist activity from
Schisandra chinensis (Turcz.) Baill. Phytomedicine. 4:229–231.
1997. View Article : Google Scholar : PubMed/NCBI
|
|
25
|
Guo M and Lu Y, Yang J, Zhao X and Lu Y:
Inhibitory effects of Schisandra chinensis extract on acne-related
inflammation and UVB-induced photoageing. Pharm Biol. 54:2987–2994.
2016. View Article : Google Scholar : PubMed/NCBI
|
|
26
|
Kwon DH, Cha HJ, Choi EO, Leem SH, Kim GY,
Moon SK, Chang YC, Yun SJ, Hwang HJ, Kim BW, et al: Schisandrin A
suppresses lipopolysaccharide-induced inflammation and oxidative
stress in RAW 264.7 macrophages by suppressing the NF-κB, MAPKs and
PI3K/Akt pathways and activating Nrf2/HO-1 signaling. Int J Mol
Med. 41:264–274. 2018.
|
|
27
|
Li S, Xie R, Jiang C and Liu M:
Schizandrin A alleviates LPS-induced injury in human keratinocyte
cell hacat through a MicroRNA-127-dependent regulation. Cell
Physiol Biochem. 49:2229–2239. 2018. View Article : Google Scholar : PubMed/NCBI
|
|
28
|
Chen DF, Zhang SX, Xie L, Xie JX, Chen K,
Kashiwada Y, Zhou BN, Wang P, Cosentino LM and Lee KH: Anti-AIDS
agents - XXVI. Structure-activity correlations of gomisin-G-related
anti-HIV lignans from Kadsura interior and of related synthetic
analogues. Bioorg Med Chem. 5:1715–1723. 1997. View Article : Google Scholar : PubMed/NCBI
|
|
29
|
Ma WH, Lu Y, Huang H, Zhou P and Chen DF:
Schisanwilsonins A-G and related anti-HBV lignans from the fruits
of Schisandra wilsoniana. Bioorg Med Chem Lett. 19:4958–4962. 2009.
View Article : Google Scholar : PubMed/NCBI
|
|
30
|
Huang M, Jin J, Sun H and Liu GT: Reversal
of P-glycoprotein-mediated multidrug resistance of cancer cells by
five schizandrins isolated from the Chinese herb Fructus
Schizandrae. Cancer Chemother Pharmacol. 62:1015–1026. 2008.
View Article : Google Scholar : PubMed/NCBI
|
|
31
|
Min HY, Park EJ, Hong JY, Kang YJ, Kim SJ,
Chung HJ, Woo ER, Hung TM, Youn UJ, Kim YS, et al:
Antiproliferative effects of dibenzocyclooctadiene lignans isolated
from Schisandra chinensis in human cancer cells. Bioorg Med Chem
Lett. 18:523–526. 2008. View Article : Google Scholar
|
|
32
|
Moon PD, Jeong HJ and Kim HM: Effects of
schizandrin on the expression of thymic stromal lymphopoietin in
human mast cell line HMC-1. Life Sci. 91:384–388. 2012. View Article : Google Scholar : PubMed/NCBI
|
|
33
|
Park JH and Yoon J: Schizandrin inhibits
fibrosis and epithelial-mesenchymal transition in transforming
growth factor-β1-stimulated AML12 cells. Int Immunopharmacol.
25:276–284. 2015. View Article : Google Scholar : PubMed/NCBI
|
|
34
|
Lin RD, Mao YW, Leu SJ, Huang CY and Lee
MH: The immuno-regulatory effects of Schisandra chinensis and its
constituents on human monocytic leukemia cells. Molecules.
16:4836–4849. 2011. View Article : Google Scholar : PubMed/NCBI
|
|
35
|
Yan H and Guo M: Schizandrin A inhibits
cellular phenotypes of breast cancer cells by repressing miR-155.
IUBMB Life. 72:1640–1648. 2020. View Article : Google Scholar : PubMed/NCBI
|
|
36
|
Ji L and Ma L: MEG3 is restored by
schisandrin A and represses tumor growth in choriocarcinoma cells.
J Biochem Mol Toxicol. 34:e224552020. View Article : Google Scholar : PubMed/NCBI
|
|
37
|
Chen BC, Tu SL, Zheng BA, Dong QJ, Wan ZA
and Dai QQ: Schizandrin A exhibits potent anticancer activity in
colorectal cancer cells by inhibiting heat shock factor 1. Biosci
Rep. 40:402020.
|
|
38
|
Xu X, Rajamanicham V, Xu S, Xu S, Liu Z,
Yan T, Liang G, Guo G, Zhou H, Wang Y, et al: Schisandrin A
inhibits triple negative breast cancer cells by regulating Wnt/ER
stress signaling pathway. Biomed Pharmacother. 115:1089222019.
View Article : Google Scholar : PubMed/NCBI
|
|
39
|
Ding Q, Li X, Sun Y and Zhang X:
Schizandrin A inhibits proliferation, migration and invasion of
thyroid cancer cell line TPC-1 by down regulation of microRNA-429.
Cancer Biomark. 24:497–508. 2019. View Article : Google Scholar : PubMed/NCBI
|
|
40
|
Bi Y, Fu Y, Wang S, Chen X and Cai X:
Schizandrin A exerts anti-tumor effects on A375 cells by
down-regulating H19. Braz J Med Biol Res. 52:e83852019. View Article : Google Scholar : PubMed/NCBI
|
|
41
|
Lee K, Ahn JH, Lee KT, Jang DS and Choi
JH: Deoxyschizandrin, isolated from Schisandra berries, induces
cell cycle arrest in ovarian cancer cells and inhibits the
protumoural activation of tumour-associated macrophages. Nutrients.
10:102018. View Article : Google Scholar
|
|
42
|
Kim SJ, Min HY, Lee EJ, Kim YS, Bae K,
Kang SS and Lee SK: Growth inhibition and cell cycle arrest in the
G0/G1 by schizandrin, a dibenzocyclooctadiene lignan isolated from
Schisandra chinensis, on T47D human breast cancer cells. Phytother
Res. 24:193–197. 2010. View Article : Google Scholar
|
|
43
|
Xian H, Feng W and Zhang J: Schizandrin A
enhances the efficacy of gefitinib by suppressing IKKβ/NF-κB
signaling in non-small cell lung cancer. Eur J Pharmacol.
855:10–19. 2019. View Article : Google Scholar : PubMed/NCBI
|
|
44
|
Kong D, Zhang D, Chu X and Wang J:
Schizandrin A enhances chemosensitivity of colon carcinoma cells to
5-fluorouracil through up-regulation of miR-195. Biomed
Pharmacother. 99:176–183. 2018. View Article : Google Scholar : PubMed/NCBI
|
|
45
|
Zhang ZL, Jiang QC and Wang SR:
Schisandrin A reverses doxorubicin-resistant human breast cancer
cell line by the inhibition of P65 and Stat3 phosphorylation.
Breast Cancer. 25:233–242. 2018. View Article : Google Scholar
|
|
46
|
Su X, Gao C, Shi F, Feng X, Liu L, Qu D
and Wang C: A micro-emulsion co-loaded with Schizandrin A-docetaxel
enhances esophageal carcinoma treatment through overcoming
multidrug resistance. Drug Deliv. 24:10–19. 2017. View Article : Google Scholar : PubMed/NCBI
|
|
47
|
Livak KJ and Schmittgen TD: Analysis of
relative gene expression data using real-time quantitative PCR and
the 2(-Delta Delta C(T)) method. Methods. 25:402–408. 2001.
View Article : Google Scholar
|
|
48
|
Ng KP, Hillmer AM, Chuah CT, Juan WC, Ko
TK, Teo AS, Ariyaratne PN, Takahashi N, Sawada K, Fei Y, et al: A
common BIM deletion polymorphism mediates intrinsic resistance and
inferior responses to tyrosine kinase inhibitors in cancer. Nat
Med. 18:521–528. 2012. View Article : Google Scholar : PubMed/NCBI
|
|
49
|
Opletal L, Sovová H and Bártlová M:
Dibenzo[a, c]cyclooctadiene lignans of the genus Schisandra:
Importance, isolation and determination. J Chromatogr B Analyt
Technol Biomed Life Sci. 812:357–371. 2004. View Article : Google Scholar : PubMed/NCBI
|
|
50
|
Zheng S, Aves SJ, Laraia L, Galloway WR,
Pike KG, Wu W and Spring DR: A concise total synthesis of
deoxyschizandrin and exploration of its antiproliferative effects
and those of structurally related derivatives. Chemistry.
18:3193–3198. 2012. View Article : Google Scholar : PubMed/NCBI
|
|
51
|
Newbold A, Martin BP, Cullinane C and Bots
M: Detection of apoptotic cells using propidium iodide staining.
Cold Spring Harb Protoc. 2014:1202–1206. 2014.PubMed/NCBI
|
|
52
|
Pan X, Zhao J, Zhang WN, Li HY, Mu R, Zhou
T, Zhang HY, Gong WL, Yu M, Man JH, et al: Induction of SOX4 by DNA
damage is critical for p53 stabilization and function. Proc Natl
Acad Sci USA. 106:3788–3793. 2009. View Article : Google Scholar : PubMed/NCBI
|
|
53
|
Santos JH, Hunakova L, Chen Y, Bortner C
and Van Houten B: Cell sorting experiments link persistent
mitochondrial DNA damage with loss of mitochondrial membrane
potential and apoptotic cell death. J Biol Chem. 278:1728–1734.
2003. View Article : Google Scholar
|
|
54
|
Yang Y, Karakhanova S, Hartwig W, D'Haese
JG, Philippov PP, Werner J and Bazhin AV: Mitochondria and
mitochondrial ROS in cancer: Novel targets for anticancer therapy.
J Cell Physiol. 231:2570–2581. 2016. View Article : Google Scholar : PubMed/NCBI
|
|
55
|
Chen M, Guerrero AD, Huang L, Shabier Z,
Pan M, Tan TH and Wang J: Caspase-9-induced mitochondrial
disruption through cleavage of anti-apoptotic BCL-2 family members.
J Biol Chem. 282:33888–33895. 2007. View Article : Google Scholar : PubMed/NCBI
|
|
56
|
Willis SN and Adams JM: Life in the
balance: How BH3-only proteins induce apoptosis. Curr Opin Cell
Biol. 17:617–625. 2005. View Article : Google Scholar : PubMed/NCBI
|
|
57
|
Bouillet P, Zhang LC, Huang DC, et al:
Gene structure alternative splicing, and chromosomal localization
of pro-apoptotic Bcl-2 relative Bim. Mamm Genome. 12:163–168. 2001.
View Article : Google Scholar : PubMed/NCBI
|
|
58
|
Mauthe M, Orhon I, Rocchi C, Zhou X, Luhr
M, Hijlkema KJ, Coppes RP, Engedal N, Mari M and Reggiori F:
Chloroquine inhibits autophagic flux by decreasing
autophagosome-lysosome fusion. Autophagy. 14:1435–1455. 2018.
View Article : Google Scholar : PubMed/NCBI
|
|
59
|
Mauvezin C and Neufeld TP: Bafilomycin A1
disrupts autophagic flux by inhibiting both V-ATPase-dependent
acidification and Ca-P60A/SERCA-dependent autophagosome-lysosome
fusion. Autophagy. 11:1437–1438. 2015. View Article : Google Scholar : PubMed/NCBI
|
|
60
|
Kim KH and Lee MS: Autophagy - a key
player in cellular and body metabolism. Nat Rev Endocrinol.
10:322–337. 2014. View Article : Google Scholar : PubMed/NCBI
|
|
61
|
Ha J, Guan KL and Kim J: AMPK and
autophagy in glucose/glycogen metabolism. Mol Aspects Med.
46:46–62. 2015. View Article : Google Scholar : PubMed/NCBI
|
|
62
|
Pasquier B: Autophagy inhibitors. Cell Mol
Life Sci. 73:985–1001. 2016. View Article : Google Scholar
|
|
63
|
Seebacher NA, Stacy AE, Porter GM and
Merlot AM: Clinical development of targeted and immune based
anti-cancer therapies. J Exp Clin Cancer Res. 38:1562019.
View Article : Google Scholar : PubMed/NCBI
|
|
64
|
Keglevich P, Hazai L, Kalaus G and Szántay
C: Modifications on the basic skeletons of vinblastine and
vincristine. Molecules. 17:5893–5914. 2012. View Article : Google Scholar : PubMed/NCBI
|
|
65
|
Gaillard H, García-Muse T and Aguilera A:
Replication stress and cancer. Nat Rev Cancer. 15:276–289. 2015.
View Article : Google Scholar : PubMed/NCBI
|
|
66
|
Cortez D: Replication-coupled DNA repair.
Mol Cell. 74:866–876. 2019. View Article : Google Scholar : PubMed/NCBI
|
|
67
|
Rehman SK, Haynes J, Collignon E, Brown
KR, Wang Y, Nixon AM, Bruce JP, Wintersinger JA, Singh Mer A, Lo
EB, et al: Colorectal cancer cells enter a Diapause-like DTP state
to survive chemotherapy. Cell. 184:226–242.e21. 2021. View Article : Google Scholar : PubMed/NCBI
|
|
68
|
Recasens A and Munoz L: Targeting cancer
cell dormancy. Trends Pharmacol Sci. 40:128–141. 2019. View Article : Google Scholar : PubMed/NCBI
|
|
69
|
Glick D, Barth S and Macleod KF:
Autophagy: Cellular and molecular mechanisms. J Pathol. 221:3–12.
2010. View Article : Google Scholar : PubMed/NCBI
|
|
70
|
Li YJ, Lei YH, Yao N, Wang CR, Hu N, Ye
WC, Zhang DM and Chen ZS: Autophagy and multidrug resistance in
cancer. Chin J Cancer. 36:522017. View Article : Google Scholar : PubMed/NCBI
|
|
71
|
Farrow JM, Yang JC and Evans CP: Autophagy
as a modulator and target in prostate cancer. Nat Rev Urol.
11:508–516. 2014. View Article : Google Scholar : PubMed/NCBI
|
|
72
|
Liu G, Pei F, Yang F, Li L, Amin AD, Liu
S, Buchan JR and Cho WC: Role of autophagy and apoptosis in
non-small-cell lung cancer. Int J Mol Sci. 18:182017.
|
|
73
|
Piffoux M, Eriau E and Cassier PA:
Autophagy as a therapeutic target in pancreatic cancer. Br J
Cancer. 124:333–344. 2021. View Article : Google Scholar :
|
|
74
|
Zarzynska JM: The importance of autophagy
regulation in breast cancer development and treatment. BioMed Res
Int. 2014:7103452014. View Article : Google Scholar : PubMed/NCBI
|
|
75
|
Zhou H, Yuan M, Yu Q, Zhou X, Min W and
Gao D: Autophagy regulation and its role in gastric cancer and
colorectal cancer. Cancer Biomark. 17:1–10. 2016. View Article : Google Scholar : PubMed/NCBI
|
|
76
|
Hardie DG, Ross FA and Hawley SA: AMPK: A
nutrient and energy sensor that maintains energy homeostasis. Nat
Rev Mol Cell Biol. 13:251–262. 2012. View Article : Google Scholar : PubMed/NCBI
|
|
77
|
Lin SC and Hardie DG: AMPK: Sensing
Glucose as well as Cellular Energy Status. Cell Metab. 27:299–313.
2018. View Article : Google Scholar
|
|
78
|
Li Y and Chen Y: AMPK and autophagy. Adv
Exp Med Biol. 1206:85–108. 2019. View Article : Google Scholar : PubMed/NCBI
|
|
79
|
Kimura T, Takabatake Y, Takahashi A and
Isaka Y: Chloroquine in cancer therapy: A double-edged sword of
autophagy. Cancer Res. 73:3–7. 2013. View Article : Google Scholar : PubMed/NCBI
|
|
80
|
Wu YT, Tan HL, Shui G, Bauvy C, Huang Q,
Wenk MR, Ong CN, Codogno P and Shen HM: Dual role of
3-methyladenine in modulation of autophagy via different temporal
patterns of inhibition on class I and III phosphoinositide
3-kinase. J Biol Chem. 285:10850–10861. 2010. View Article : Google Scholar : PubMed/NCBI
|
|
81
|
Levy JMM, Towers CG and Thorburn A:
Targeting autophagy in cancer. Nat Rev Cancer. 17:528–542. 2017.
View Article : Google Scholar : PubMed/NCBI
|
|
82
|
Pesce E, Sondo E, Ferrera L, Tomati V,
Caci E, Scudieri P, Musante I, Renda M, Baatallah N, Servel N, et
al: The autophagy inhibitor Spautin-1 antagonizes rescue of mutant
CFTR through an autophagy-independent and USP13-mediated mechanism.
Front Pharmacol. 9:14642018. View Article : Google Scholar
|