Introduction
Colorectal cancer (CRC) is the third most common
cancer type worldwide and the second leading cause of global
cancer-related deaths (1).
Approximately 20% of patients with CRC exhibit metastasis at the
time of diagnosis and ~50% eventually develop metastatic disease
(2). The majority of patients with
metastatic CRC (mCRC) cannot be cured. For patients not eligible
for metastasis-directed therapy, the treatment strategy for mCRC is
palliative focusing on prolonging survival and maintaining quality
of life (3). It is important to
establish prognostic and predictive markers to detect early
treatment failure and avoid prolonged, ineffective therapy.
It has been known for decades that small fragments
of cell-free DNA (cfDNA) are present in the circulation (4) with elevated levels in cancer patients
(5). A proportion of cfDNA
detected in cancer patients is derived from cancer cells, so-called
circulating tumor DNA (ctDNA) (6).
At present, the research landscape is focusing on investigating the
clinical value of tumor-specific mutations in ctDNA, rather than on
the value of cfDNA. Compared to ctDNA, the measurement of cfDNA is
applicable to all cancer types and not dependent on the presence of
specific mutations. It has been demonstrated that cfDNA levels in
plasma have a prognostic and predictive value in patients with
mCRC, but the methods used to measure cfDNA are complex,
time-consuming and expensive, which limits their clinical utility
(7-11).
Direct fluorescent assay (DFA), first described by
Goldshtein et al (12) in
2009 and refined by Boysen et al (13) in 2018, is able to quantify cfDNA in
plasma or serum. This method is simple, rapid and inexpensive. The
method has proved feasible in patients with locally advanced rectal
cancer (14), mCRC (15,16)
and squamous cell carcinoma of the anus undergoing
chemoradiotherapy (17).
The aim of the present study was to measure the
levels of cfDNA by DFA in patients with mCRC prior to palliative
systemic therapy, during treatment and at progression, and to
determine their possible association with patient characteristics,
treatment response and survival. It was hypothesized that in
patients with mCRC, high cfDNA levels were associated with advanced
disease and shorter survival compared to low cfDNA levels.
Materials and methods
Study design
The OPTIPAL II study was designed to prospectively
enroll patients with mCRC prior to the start of systemic palliative
treatment. The study was a non-interventional biomarker study for
patients receiving standard systemic treatment for mCRC. The study
was explorative and designed to include ~50 patients for analysis.
The examined variable in OPTIPAL II was ‘circulating free DNA’. The
term ‘circulating free DNA’ covers both measurements of total cfDNA
and measurements of the proportion of cfDNA originating from tumor
cells (ctDNA). In the present study, the cfDNA results are
presented.
Patients
Patients with mCRC, who, according to standard
guidelines, were considered for treatment with EGFR inhibitors,
were included in a prospective biomarker study (OPTIPAL II:
ClinicalTrials.gov identifier no. NCT03750175) at
the Department of Oncology, Aarhus University Hospital (Aarhus,
Denmark). The OPTIPAL II trial was designed to evaluate the
feasibility of ctDNA for anti-EGFR therapy selection and the
primary outcome data will be presented in a separate publication.
The level of total DNA measurement and correlation to outcome was
among the prespecified secondary endpoints.
The key inclusion criteria were as follows:
Histopathologically verified mCRC, indication for systemic
palliative treatment with standard anti-EGFR monoclonal antibodies,
fit for therapy with EGFR inhibition and age ≥18 years. The
exclusion criteria were a World Health Organization (WHO)
performance status >2, significant other cancer disease within 5
years of inclusion, conditions precluding sampling during therapy
and treatment breaks.
In the case of plasma RAS/RAF wild-type status
[determined by droplet digital (dd)PCR], treatment consisted of
chemotherapy and cetuximab/panitumumab. Patients with plasma
RAS/RAF mutation (determined by ddPCR) were treated with
chemotherapy.
Imaging response was determined based on CT scans of
the chest, abdomen and pelvis performed at baseline, after every
fourth cycle of treatment and thereafter every third month during
follow-up until progression, death or end of follow-up, whichever
came first. Progression-free survival (PFS) was measured from the
date of inclusion to progression according to RECIST version
1.1(18), death or censoring,
whichever came first. Overall survival (OS) was calculated from the
date of inclusion to the date of death from any cause. Patients
still alive were censored at the last known date alive. Disease
control (DC) was defined as stable disease (SD), partial response
(PR) or complete response (CR) as the best response according to
RECIST version 1.1(18).
For comparison, blood samples were available from 94
fully anonymized presumed healthy individuals from the
Lolland-Falster Health Study (NCT02482896), as previously described
(13). All healthy donors gave
written informed consent and the study was approved by Region
Zealand's Ethical Committee on Health Research (approval no.
SJ-421).
Total circulating DNA analysis
Blood samples were collected prospectively at
baseline; prior to the third treatment cycle; and the first, second
and third response evaluation during treatment. The last sample was
drawn at the documented time of progression. A total of 30 ml was
drawn at each time-point.
Plasma samples were obtained in EDTA tubes and after
30 min, they were centrifuged at 1,200 x g for 10 min at 21˚C and
then stored at -80˚C. cfDNA levels were detected directly in the
plasma samples by a modified version (13) of the method described by Goldshtein
et al (12). In brief, 40
µl of plasma was added to 160 µl PBS containing DMSO (1:8) and
SYBR® Gold Nucleic Acid Gel Stain (1:8,000; Invitrogen;
Thermo Fisher Scientific, Inc.). Samples were analyzed in a black
96-well plate (Pio-Plex Pro Flat Bottom Plates; Bio-Rad
Laboratories, Inc.). Fluorescence was measured with the 96-well
fluorometer (Infinite F200 PRO; Tecan Group) at an emission
wavelength of 535 nm and an excitation wavelength of 485 nm.
Standards for DNA were prepared from Human Control
Genomic DNA (Thermo Fisher Scientific, Inc.) diluted in PBS
containing 10% bovine serum albumin (Sigma-Aldrich; Merck KGaA).
The concentration of cfDNA in the plasma samples was calculated
from a standard curve.
The final concentration of each sample was
calculated as the mean of four measurements. Outliers were removed
according to Dixon's q-test if the standard deviation (SD) exceeded
10% if the removal of one value was able to bring the SD <10%;
otherwise, the sample was discarded if SD >15%.
The samples were analyzed blinded to clinical
parameters and study endpoints.
Statistical analysis
Categorized variables were expressed as counts and
proportions and continuous variables were expressed as median
values and ranges. The Mann-Whitney U-test was applied to examine
the association between patient characteristics and cfDNA levels.
Fisher's exact test was applied to compare categorical variables.
Wilcoxon's signed-rank test was used for comparison of
nonparametric paired samples. Values for cfDNA levels, lactate
dehydrogenase (LDH) levels and tumor burden were not normally
distributed; therefore, natural log transformation was performed to
achieve a normal distribution (confirmed with histograms and
QQ-plots) prior to analyses of the associations with a linear
regression model.
In a normal reference cohort, the mean cfDNA level
was 0.54 ng/µl as measured by the DFA (13), which was used for cut-off point
analysis as described below. PFS and OS were estimated by
Kaplan-Meier curves and differences between groups with an
unadjusted univariate Cox proportional hazards model. All analysis
was by intention to treat. The prognostic value of all baseline
characteristics was analyzed. Multivariate analysis was performed
using the Cox proportional hazards model. Variables with P<0.05
by univariate analysis were included in the multivariate analysis.
cfDNA was included as a continuous variable.
All reported P-values were two-sided and P<0.05
was considered to indicate statistical significance. Effect sizes
were indicated by 95% confidence intervals (95% CI). Statistical
analyses were performed using STATA/IC16.0 (StataCorp LLC).
The study is reported in accordance with the REMARK
guideline (19).
Results
Patient characteristics
Between 2018 and 2020, a total of 48 patients were
included, but one patient was excluded due to failed analysis of
the baseline sample. Blood samples were collected between 2018 and
2020. All baseline characteristics collected are presented in
Table I. The median age was 65
years (range, 37-76 years) and the majority of patients were male
(57%). The WHO performance status was 0-1 in all patients except
three patients with a WHO performance status of 2. Of all primary
tumors, 28 (60%) were left-sided. In one-third of the patients
(n=15), the primary tumor was in situ at inclusion.
Furthermore, 50% of the patients (n=24) were diagnosed with liver
involvement. The majority of patients were included prior to
first-line therapy (n=45) and two prior to second- and third-line
treatment, respectively.
 | Table IBaseline characteristics of patients
(n=47) and association with cfDNA levels at baseline. |
Table I
Baseline characteristics of patients
(n=47) and association with cfDNA levels at baseline.
| Characteristic | Value | cfDNA, ng/µl [median
(95% CI)] | P-valuea |
|---|
| All patients | 47(100) | | |
| Age, years | | | |
| Median (interquartile
range) | 65 (60-70) | | |
|
≤65 | 24(51) | 0.81 (0.61-0.97) | 0.32 |
|
>65 | 23(49) | 0.66
(0.55-0.89) | |
| Sex | | | 0.64 |
|
Male | 27(57) | 0.73
(0.61-0.92) | |
|
Female | 20(43) | 0.74
(0.57-1.05) | |
| WHO PSb | | | 0.07 |
|
0, 1 | 43(93) | 0.73
(0.61-0.86) | |
|
2 | 3(7) | 1.18
(0.81-2.85c) | |
| Location primary
tumor | | | 0.04 |
|
Colon | 30(64) | 0.83
(0.61-1.01) | |
|
Rectum | 17(36) | 0.65
(0.54-0.81) | |
| Sidedness primary
tumor | | | 0.02 |
|
Right | 19(40) | 0.87
(0.61-1.20) | |
|
Left | 28(60) | 0.66
(0.55-0.80) | |
| Resection status
primary tumor | | | 0.04 |
|
Resected | 32(68) | 0.63
(0.57-0.77) | |
|
Not
resected | 15(32) | 0.93
(0.70-1.04) | |
| Number of lines of
previous anticancer therapies | | | 0.07 |
|
0 | 45(96) | 0.73
(0.61-0.86) | |
|
≥1 | 2(4) | 1.20
(1.08-1.32c) | |
| Time of
metastases | | | 0.19 |
|
Synchronous | 26(55) | 0.86
(0.63-0.95) | |
|
Metachronous | 21(45) | 0.61
(0.54-0.81) | |
| Number of
metastatic sites | | | 0.24 |
|
1 site | 20(43) | 0.73
(0.56-0.85) | |
|
>1
site | 27(57) | 0.77
(0.61-0.96) | |
| Metastatic
location | | | |
|
Non-liver | 23(49) | 0.61
(0.55-0.75) | 0.01d |
|
Liver (+
other sites) | 24(51) | 0.94
(0.66-1.11) | |
|
Non-lung | 27(57) | 0.76
(0.58-0.87) | 0.32e |
|
Lung (+
other sites) | 20(43) | 0.66
(0.57-1.21) | |
| Tissue mutation
statusf | | | 0.60 |
|
RAS/BRAF
wild-type | 8(17) | 0.75
(0.49-1.26) | |
|
RAS/BRAF
mutation | 38(83) | 0.70
(0.59-0.87) | |
| LDHg | | | <0.01 |
|
<ULN | 23(56) | 0.66
(0.59-0.79) | |
|
>ULN | 18(44) | 0.98
(0.88-1.27) | |
A total of 37 patients were treated with FOLFIRI as
the study treatment with the addition of anti-EGFR in 18 cases.
Furthermore, three patients had contraindications to 5-fluorouracil
and were treated with irinotecan in combination with anti-EGFR.
Moreover, one patient was treated with CAPOX. A total of six
patients deteriorated prior to receiving the first cycle of
treatment and were not treated. At the end of the follow-up,
disease progression had occurred in 38 and 21 patients had died. No
patients were lost to follow-up. The median follow-up time was 12.8
months (range, 0.2-28.4 months) and the median PFS and OS were 8.0
months (95% CI 5.7-8.7) and 21.4 months (95% CI 12.8-not reached),
respectively.
None of the patients achieved a CR during treatment,
but one patient underwent successful salvage surgery after major
tumor regression during chemotherapy. A PR was observed in 11
patients and SD in 24 patients. Early disease progression occurred
in 10 patients; including four patients who experienced progressive
disease at the first radiographic response evaluation and six
patients where radiographic response evaluation was not possible
due to symptomatic deterioration.
Baseline levels of cfDNA
The total cfDNA levels were measured by DFA in all
baseline samples, with a mean value of 0.84 ng/µl (95% CI 0.71-0.98
ng/µl) and a median level of 0.73 ng/µl, respectively. The baseline
levels of cfDNA in the study cohort were significantly higher
compared to the cfDNA levels of a previously analyzed normal cohort
of 94 presumed healthy individuals with a median level of 0.52
ng/µl and mean level of 0.54 ng/µl (95% CI 0.50-0.59, P<0.001)
(13).
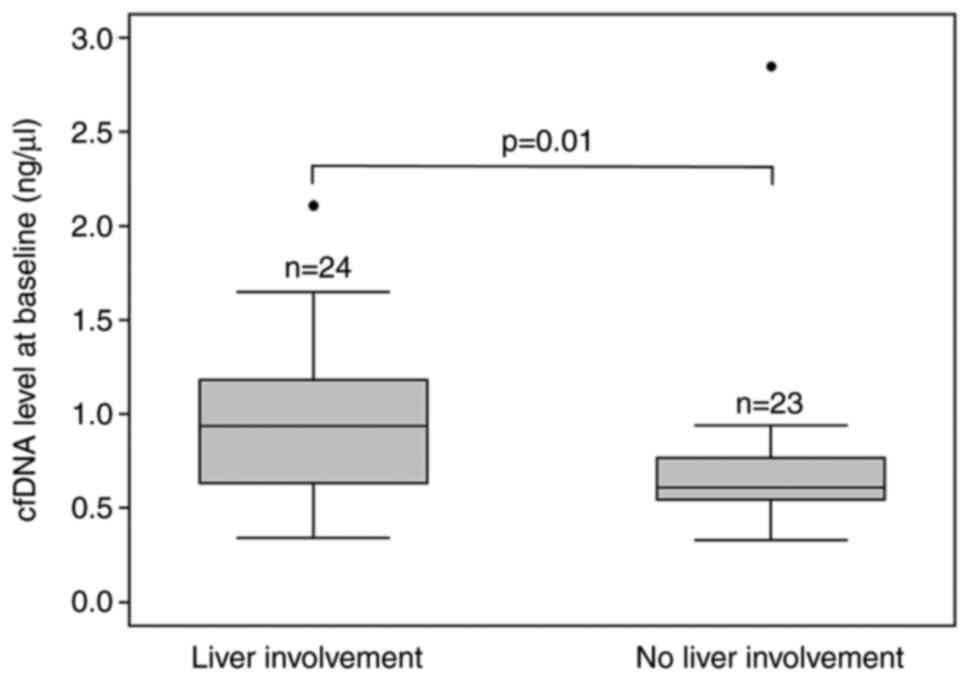
At baseline, the median cfDNA level was higher in
patients with right-sided primary tumor (0.87 ng/µl, 95% CI
0.61-1.20) compared to patients with left-sided primary tumor (0.66
ng/µl, 95% CI 0.55-0.80, P=0.02). The same applied to patients with
primary tumor in situ (0.93 ng/µl, 95% CI 0.70-1.04)
compared to patients with resected primary tumor (0.63 ng/µl, 95%
CI 0.57-0.77, P=0.04). Furthermore, the median cfDNA level was
higher in patients with LDH > upper limit of normal (ULN;
>205 U/l) (0.66 ng/µl, 95% CI 0.59-0.79) compared to patients
with LDH<ULN (0.98 ng/µl, 95% CI 0.88-1.27, P<0.01) and in
patients with liver involvement (0.94 ng/µl, 95% CI 0.66-1.11)
compared to patients without liver involvement (0.61 ng/µl, 95% CI
0.55-0.75, P=0.01) (Table I and
Fig. 1).
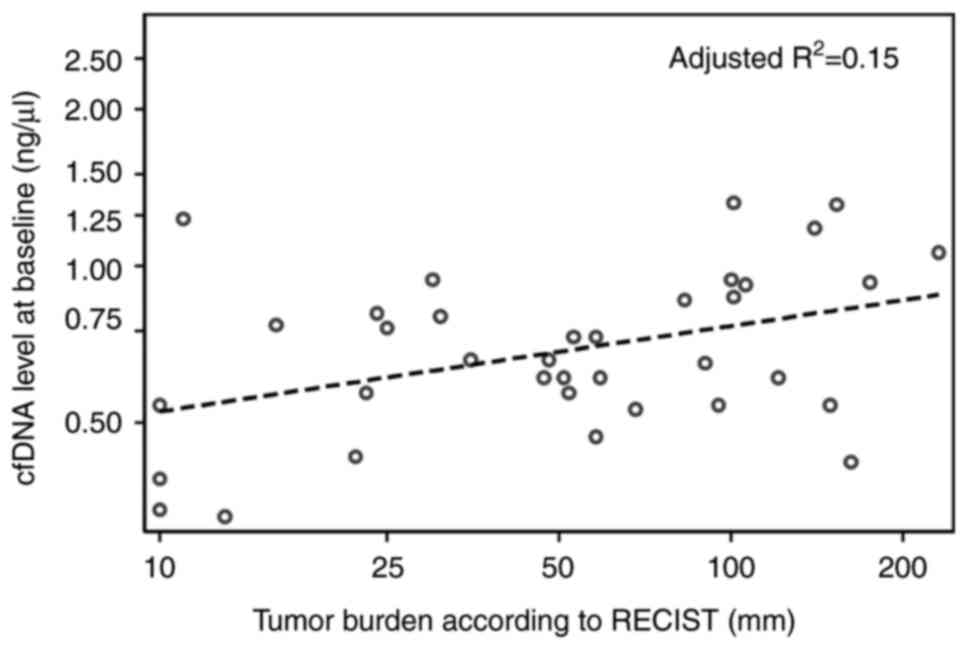
A low positive correlation was determined between
tumor burden measured as the sum of diameters (mm) of target
lesions according to RECIST version 1.1(19) and cfDNA levels at baseline
(R2=0.17, adjusted R2=0.15, P=0.01, n=36;
Fig. 2). LDH and cfDNA levels at
baseline had a moderate positive correlation (R2=0.45,
adjusted R2=0.43, P<0.01, n=40; Fig. S1).
Prognostic value of baseline cfDNA
levels
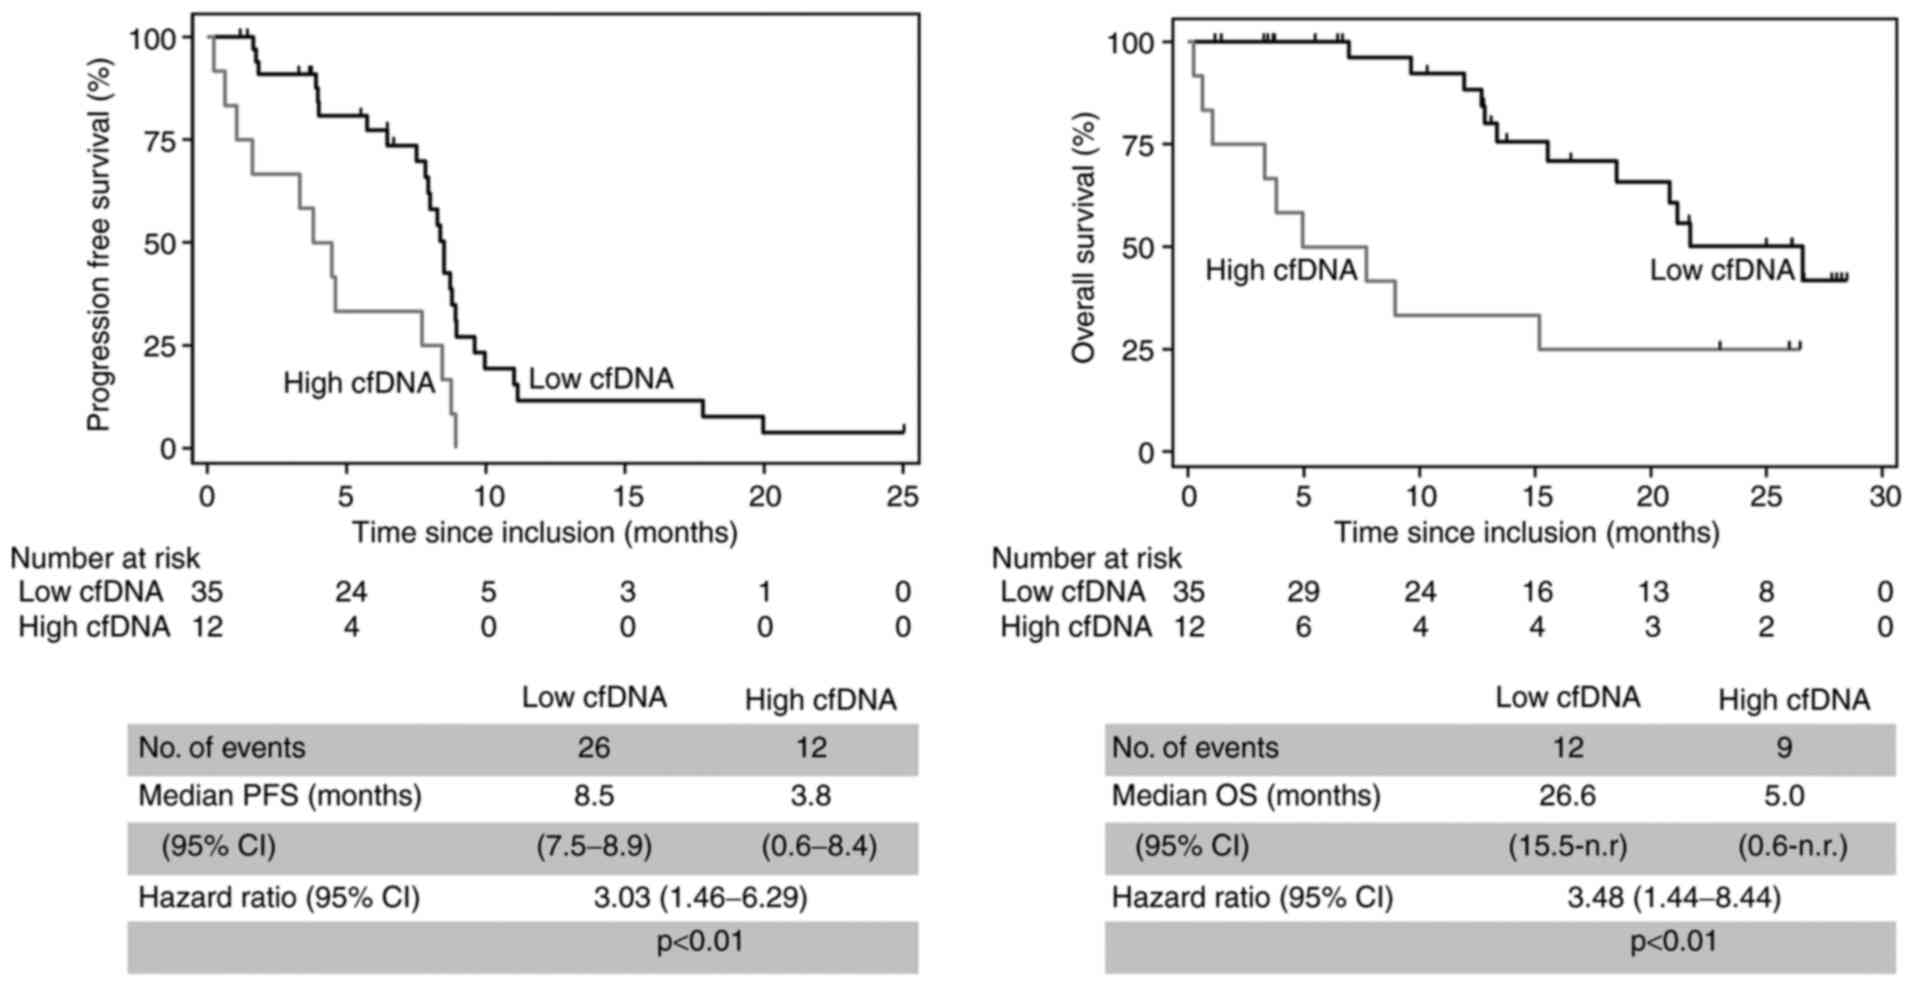
To determine the most appropriate cutoff, the study
population was divided into four groups according to internal
cohort quartiles of cfDNA levels at baseline. This exploratory
approach revealed that patients with the highest level (the upper
quartile group) had shorter median PFS and OS compared to the other
quartile groups (data not shown). Consequently, the study
population was dichotomized according to the 75th
percentile of cfDNA levels at baseline. High cfDNA levels were
associated with unfavorable outcome. The median PFS was 3.8 months
in patients with high cfDNA levels compared to 8.5 months in those
with lower cfDNA levels (hazard ratio=3.03, 95% CI 1.46-6.29,
P<0.01, n=47). The Median OS was 5.0 months in patients with
high cfDNA levels and 26.6 months in patients with low cfDNA levels
(hazard ratio=3.48, 95% CI 1.44-8.44, P<0.01, n=47; Fig. 3).
According to the univariate analysis, baseline cfDNA
levels, number of lines of previous anticancer therapy and liver
involvement were associated with PFS. Baseline cfDNA levels, WHO
performance status, number of lines of previous anticancer therapy
and LDH levels were associated with OS. On multivariate analysis,
the baseline cfDNA levels remained a significant predictor of PFS
and OS (Table SI).
Baseline cfDNA levels and correlation
with tumor response
In patients with PR, SD and progressive disease as
the best response, the baseline cfDNA levels were 0.73, 0.70 and
1.05 ng/µl, respectively. The median baseline cfDNA level was
significantly lower in patients who achieved DC (0.73 ng/µl)
compared to those who progressed early (1.05 ng/µl, P=0.04)
(Table SII). When dichotomizing
the total cohort according to the 75th percentile of cfDNA levels
at baseline, the DC rate was significantly higher in the group with
low cfDNA levels (91%) compared to the group with high cfDNA levels
(42%, P<0.001; Table II).
| Table IIBaseline cfDNA levels and tumor
response according to RECIST version 1.1. |
Table II
Baseline cfDNA levels and tumor
response according to RECIST version 1.1.
| Best response | Total
(n=45)a | <75th percentile
(n=33) | ≥75th percentile
(n=12) |
|---|
| DC (PR+SD) | 35(78) | 30(91) | 5 (42%) |
| PD | 10(22) | 3(9) | 7 (58%) |
Prognostic value of cfDNA dynamics
during treatment
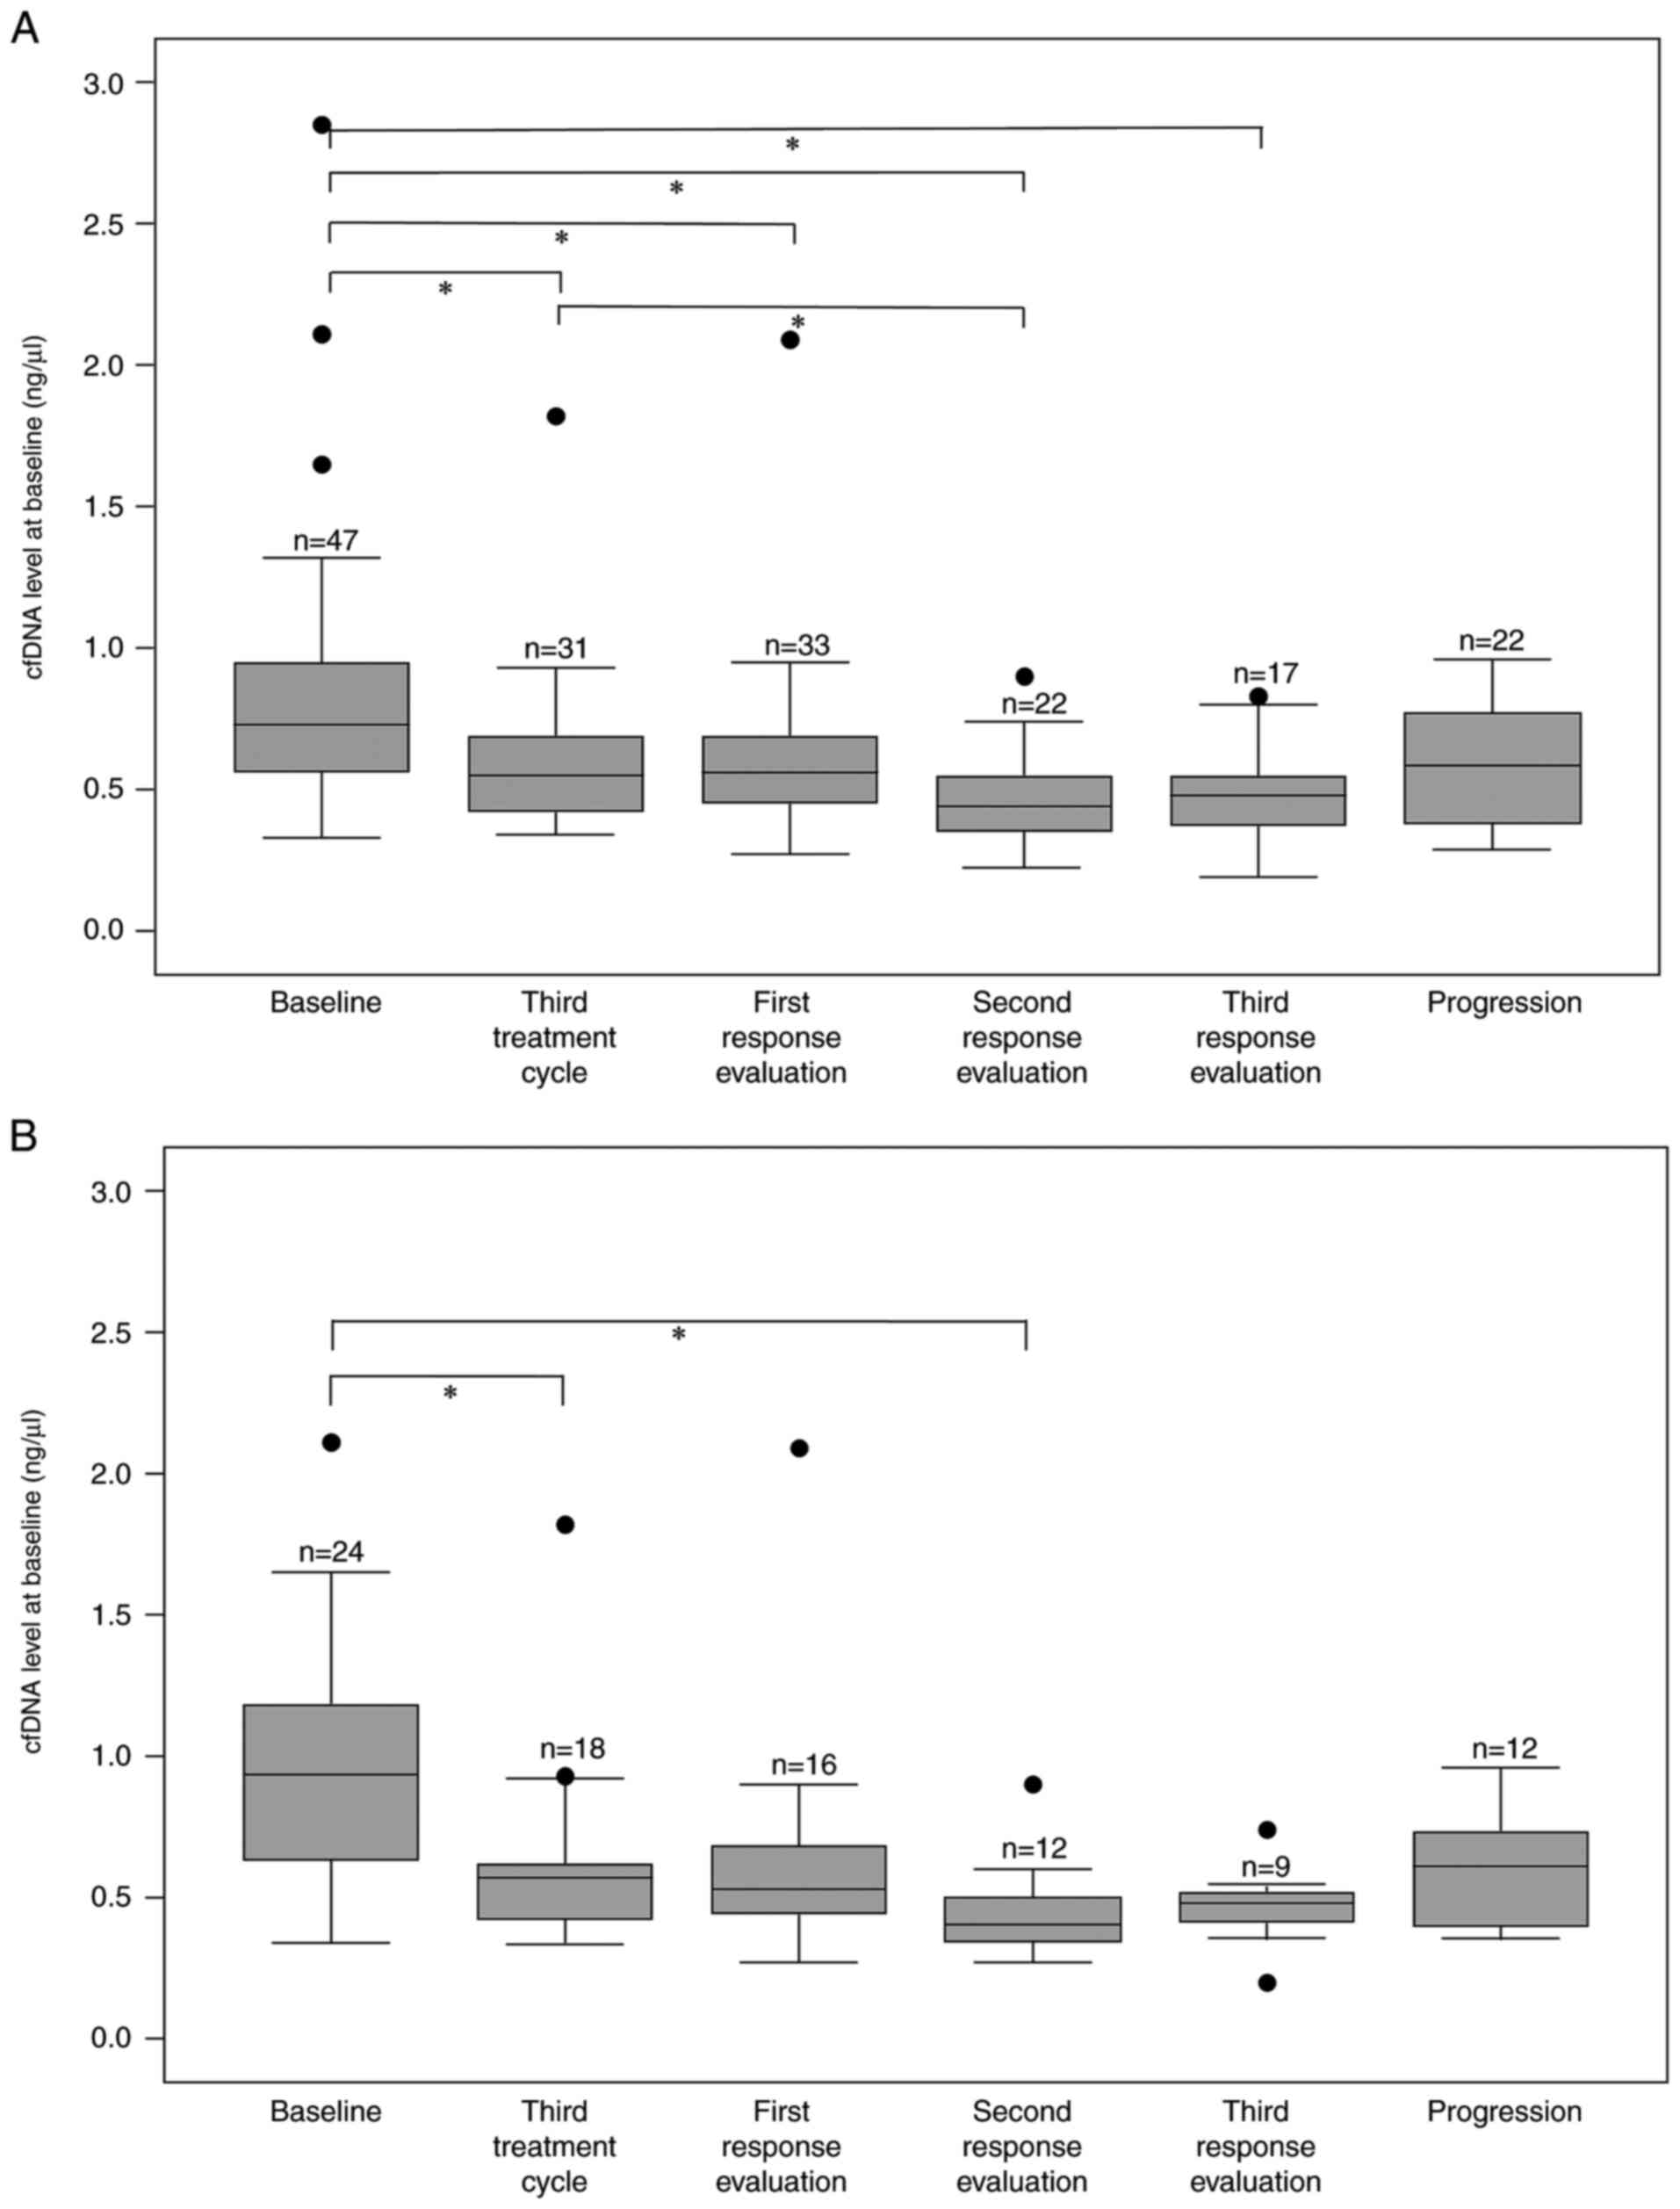
Blood samples were available from patients at
baseline (n=47); prior to the third treatment cycle (n=31); the
first (n=33), second (n=22) and third response evaluation during
treatment (n=17); and at progression (n=22). At baseline
(pretreatment), the median cfDNA level of 0.73 ng/µl was
significantly higher compared to the median levels during treatment
of 0.55, 0.56, 0.44 and 0.48 ng/µl at the third treatment cycle and
first, second and third response evaluation during treatment,
respectively (Fig. 4A).
In the normal reference cohort, the mean cfDNA level
was 0.54 ng/µl as measured by DFA. In brief, it may be hypothesized
that levels >0.54 ng/µl are caused by the tumor's contribution
to total cfDNA levels. It was further hypothesized that ctDNA is
eliminated when cfDNA levels decrease to ≤0.54 ng/µl during
treatment. Thus, using 0.54 ng/µl as a cut-off, it was evaluated
whether a change in cfDNA during treatment is predictive of
outcomes.
Patients with cfDNA levels ≤0.54 ng/µl at both
baseline and at the first response evaluation demonstrated the
longest median PFS (10.0 months) and patients with cfDNA levels
≤0.54 ng/µl at baseline with an increase to >0.54 ng/µl at the
first response evaluation had the shortest median PFS (4.0 months).
The remaining patients with high levels at baseline (>0.54
ng/µl), which either remained high or fell below the cut-off, had a
median PFS of 8.4 months (P=0.03, comparing PFS in the four groups
described above by log-rank test). No significant association
between the change in cfDNA levels and OS (P=0.09) or DC rate
(P=0.66) was obtained. Of note, only 33 patients were included in
these analyses.
Enhanced effect of total cfDNA in
patients with liver involvement
A total of 24 patients had liver involvement at
inclusion. This subgroup of patients had significantly higher cfDNA
levels at baseline (0.94 ng/µl) compared to the study population as
a whole. In addition, there appeared to be a larger decrease in the
cfDNA level after initiation of treatment in the group of patients
with liver involvement (Fig. 4A
and B); however, this was not
significant due to the small number of patients (data not shown)
and no conclusion may be drawn from the current dataset. During
treatment, cfDNA levels in the subgroup with liver involvement were
comparable to the cfDNA levels in the whole study population
(Fig. 4A and B).
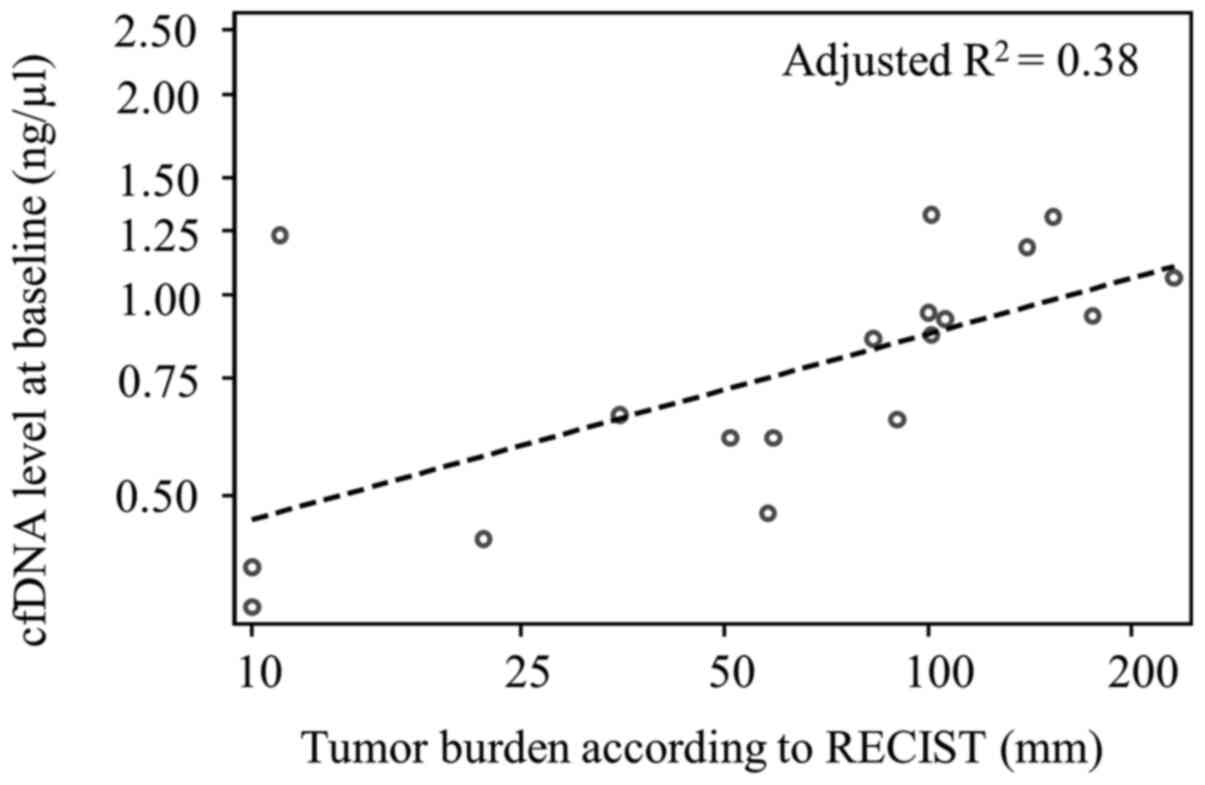
In the subgroup of patients with liver involvement,
there was a moderate correlation between the tumor burden measured
as the sum of diameters (mm) of target lesions according to RECIST
version 1.1(18) and cfDNA levels
at baseline (R2=0.42, adjusted R2=0.38,
P=0.01, n=18; Fig. 5).
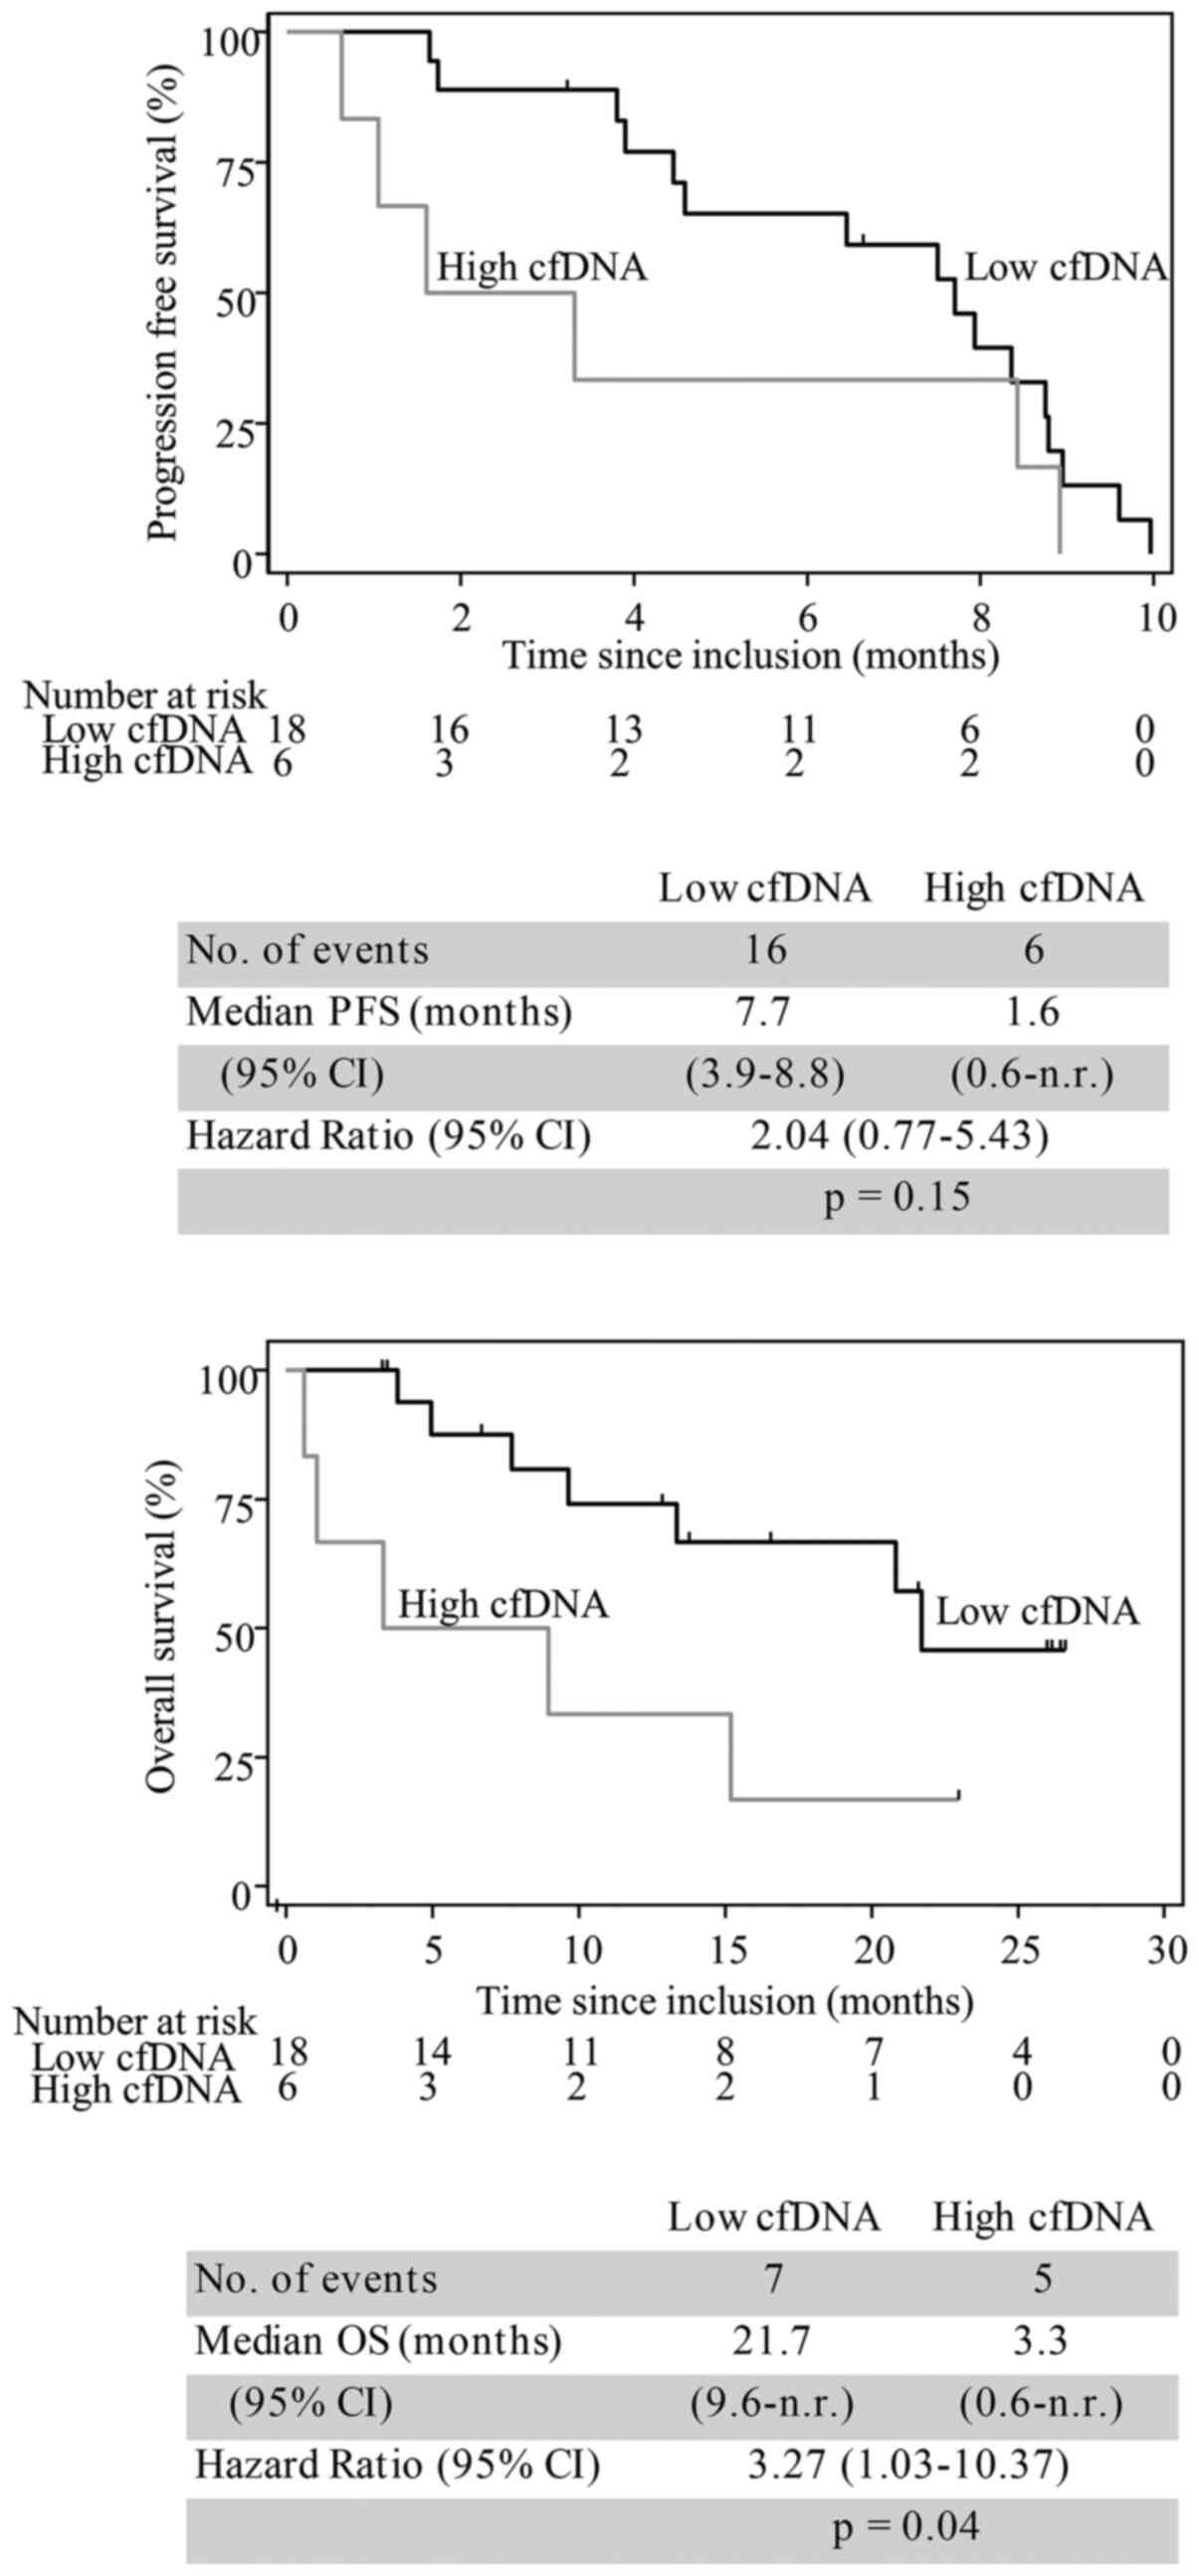
When this subgroup was dichotomized according to the
75th percentile of cfDNA levels at baseline, it was confirmed that
high cfDNA levels were associated with unfavorable outcome. The
median PFS was 1.6 months in patients with high cfDNA levels
compared to 7.7 months in those with lower cfDNA levels (hazard
ratio=2.04, 95% CI 0.77-5.43, P=0.15, n=24). The median OS was 3.3
months in patients with high cfDNA levels and 21.7 months in
patients with low cfDNA levels (hazard ratio=3.27, 95% CI
1.03-10.37, P=0.04, n=24; Fig.
6).
Discussion
In the present study, a potential clinical utility
of cfDNA was demonstrated, quantified by an assay applied directly
to the biological sample (plasma), for patients with mCRC receiving
standard of care systemic treatment. The present study was
performed for the purpose of testing the clinical utility of cfDNA
levels monitored by DFA during palliative systemic treatment for
mCRC. When analyzing the total level of cfDNA, the analysis is not
limited to patients with detectable mutations in the blood (e.g.,
RAS or BRAF mutations). Quantification of cfDNA levels may be
performed for all patients regardless of geno- or phenotype, thus
being a potential biomarker for the majority of cancer patients.
Previously, cfDNA measurements by DFA have proven valuable as a
prognostic and predictive marker in patients with liver metastasis
of CRC treated with hepatic arterial infusion (16) and chemoembolization (15). To the best of our knowledge, the
present study was the first to examine cfDNA levels by DFA during
palliative systemic treatment for mCRC. The method proved feasible
and the major findings were in agreement with the existing
literature concerning cfDNA levels and mCRC.
In the present study, RECIST was used as a
simplified pseudo-marker for tumor burden. A more precise marker of
the full tumor burden may be tumor volume defined by positron
emission tomography (PET)-CT. Nygaard et al (20) evaluated the correlation of the
disease volume determined by PET-CT and the cfDNA level. In
accordance with the present results, Nygaard et al (20) obtained a weak correlation
supporting the assumption that cfDNA levels reflect both tumor
burden and biological mechanisms, giving a complex picture of the
disease.
In the present study, the baseline level of cfDNA
was related to outcomes in terms of response, PFS and OS. High
cfDNA levels at baseline correlated with shorter PFS, OS and lower
DC rate, which is in line with previous studies (7-11).
In both uni- and multivariate analysis, high cfDNA levels
demonstrated sustained prognostic value. The results of the
multivariate analyses should be interpreted with caution due to the
low numbers of participants and events and should be confirmed in
larger-scale studies.
Not only baseline cfDNA levels had a prognostic
value. Also compared measurements of cfDNA levels at baseline and
at the first response evaluation had a correlation with PFS.
Patients who maintained a cfDNA level equal to those in healthy
individuals had the longest median PFS. Patients with an increasing
cfDNA level from baseline to first response evaluation had the
shortest median PFS. This should be interpreted with caution. The
small sample size and variations of cfDNA do not allow for any
solid conclusions to the utility of dynamics during therapy, but
merely a hypothesis description, since the present study was the
first report of this marker in this setting. In general, an
externally and pre-defined cut-off based on healthy individuals
increases the clinical utility, by allowing for reproducibility and
comparison with other cohorts. The results indicated that early
changes in cfDNA levels during systemic therapy may contribute to
the early identification of treatment effects. Similarly, Thomsen
et al (21) reported a
potential correlation between the initial dynamics in methylated
ctDNA and early prediction of treatment benefit during first-line
systemic treatment for mCRC.
In accordance with the present results, several
previous studies have demonstrated higher cfDNA levels in patients
with liver involvement compared to those without (7,22,23).
Hence, the subgroup of patients with liver involvement appears to
have a different biology when it comes to cfDNA and therefore, this
subgroup was evaluated independently. In addition to higher
baseline cfDNA levels, a tendency to a steeper decrease in cfDNA
was observed when initiating treatment. Otherwise, the subgroup was
comparable to the study group as a whole. Baseline cfDNA levels and
early changes in cfDNA levels were correlated with outcome. These
results should be interpreted with caution due to the low number of
patients. In future studies, it would be relevant to further
investigate patients with liver involvement in comparison to
patients without any liver involvement.
Carcinoembryonic antigen (CEA) is a well-known and
widely used prognostic marker in mCRC. CEA measurements are not
available in the present study. The correlation between CEA and
cfDNA was previously analyzed by our group using ddPCR methods,
suggesting that cfDNA appeared to provide a much stronger
prognostic value than CEA on multivariate analysis (22,24).
It was previously reported that LDH levels correlate with cfDNA
levels (12,22) and the results of the present study
were similar. In accordance with the present study, a previous
study by our group (22) reported
that the LDH level is not an independent prognosticator of
survival.
The major limitation of the present study was the
relatively low sample size, and naturally, the present data call
for validation in external cohorts. Furthermore, measurements of
cfDNA levels by DFA may be slightly influenced by comorbidity, as
previously reported (7), and are
hence not absolutely cancer-specific. Finally, with the current
method, it is not possible to adjust for contamination by DNA from
lymphocytes as described in relation to PCR-based techniques
(25). It would have been relevant
to perform an age-matched comparison to the normal cohort, but this
was not possible, since no information regarding age was available
for the healthy control group. These factors are important to
acknowledge, particularly in early-stage disease, where the
contribution from normal cells weighs higher.
Although the current focus of research on liquid
biopsies is on the more time- and resource-demanding ctDNA
analyses, it is of utmost importance not to overlook potential
clinically relevant information of cfDNA, which may be obtained
from the feasible and simple approach of the present study.
In conclusion, quantification of cfDNA is a
promising prognostic tool when personalizing the treatment of mCRC
and the current study presented a simple, rapid and inexpensive
method to determine cfDNA levels. Future research should evaluate
the value of cfDNA determined by DFA, e.g., in a randomized
clinical trial evaluating treatment guided by cfDNA levels against
standard of care in mCRC or other cancer types.
Supplementary Material
Relation between LDH levels (U/l) and
baseline plasma cfDNA levels (ng/μl) evaluated using a linear
regression model (n=40). cfDNA, cell-free DNA; LDH, lactate
dehydrogenase.
Cox proportional hazards regression
for PFS and OS.
Best treatment response according to
RECIST v. 1.1 and association with cfDNA levels at baseline.
Acknowledgements
The content of the present study was presented at
the Danish Society for Clinical Oncology meeting (online event) on
April 22, 2021 (abstract no. 1).
Funding
Funding: This project was funded by grants from The Danish
Cancer Society (Kræftens Bekæmpelse; grant nos. R99-A6323-14-S25
and R269-A15652), Novo Nordisk Foundation (grant no. 9297), Health
Research Foundation of Central Denmark Region (grant no. A1602) and
Aase and Ejner Danielsen Foundation (grant no. 10-002001). The
funding sources had no influence on the study design, data
collection, analysis and interpretation of data and neither took
part in the writing of the report nor in the decision to submit the
article for publication.
Availability of data and materials
The datasets used and/or analyzed during the current
study are available from the corresponding author upon reasonable
request.
Authors' contributions
KLGS designed the outline of the study. LBC, IGL,
KLGS, AKB, NP and BSS collaborated in the acquisition of data. KLGS
and LC analyzed and interpreted the data. BSS, NP and AKB
participated in analyzing and interpreting of the data. LBC wrote
the manuscript. KLGS, AKB, NP, BSS and IGL revised the manuscript
critically for important intellectual content. KLGS, NP and LBC
confirm the authenticity of all raw data. All authors have read and
agreed to the published version of the manuscript.
Ethics approval and consent to
participate
The study was approved by Regional Committees on
Health Research Ethics for Central Denmark Region (June 12, 2017;
no. 1-10-72-111-17) and Danish Data Protection Agency (May 2, 2017;
no. 1-16-02-153-17). Both oral and written informed consent was
obtained from all participants for inclusion in the study, also
specifically for the collection of blood samples prior to, during
and after therapy (as described in the methods section) and for the
use of the samples in scientific research.
Patient consent for publication
Not applicable.
Competing interests
The authors declare that they have no competing
interests.
References
|
1
|
Bray F, Ferlay J, Soerjomataram I, Siegel
RL, Torre LA and Jemal A: Global cancer statistics 2018: GLOBOCAN
estimates of incidence and mortality worldwide for 36 cancers in
185 countries. CA Cancer J Clin. 68:394–424. 2018.PubMed/NCBI View Article : Google Scholar
|
|
2
|
van der Geest LG, Lam-Boer J, Koopman M,
Verhoef C, Elferink MA and de Wilt JH: Nationwide trends in
incidence, treatment and survival of colorectal cancer patients
with synchronous metastases. Clin Exp Metastasis. 32:457–465.
2015.PubMed/NCBI View Article : Google Scholar
|
|
3
|
Van Cutsem E, Cervantes A, Nordlinger B
and Arnold D: ESMO Guidelines Working Group. Metastatic colorectal
cancer: ESMO clinical practice guidelines for diagnosis, treatment
and follow-up. Ann Oncol. 25 (Suppl 3):iii1–iii9. 2014.PubMed/NCBI View Article : Google Scholar
|
|
4
|
Mandel P and Metais P: Les acides
nucléiques du plasma sanguin chez l'homme. C R Seances Soc Biol
Fil. 142:241–243. 1948.PubMed/NCBI
|
|
5
|
Leon SA, Shapiro B, Sklaroff DM and Yaros
MJ: Free DNA in the serum of cancer patients and the effect of
therapy. Cancer Res. 37:646–650. 1977.PubMed/NCBI
|
|
6
|
Stroun M, Anker P, Maurice P, Lyautey J,
Lederrey C and Beljanski M: Neoplastic characteristics of the DNA
found in the plasma of cancer patients. Oncology. 46:318–322.
1989.PubMed/NCBI View Article : Google Scholar
|
|
7
|
Spindler KL, Appelt AL, Pallisgaard N,
Andersen RF, Brandslund I and Jakobsen A: Cell-free DNA in healthy
individuals, noncancerous disease and strong prognostic value in
colorectal cancer. Int J Cancer. 135:2984–2991. 2014.PubMed/NCBI View Article : Google Scholar
|
|
8
|
Spindler KL, Pallisgaard N, Andersen RF,
Brandslund I and Jakobsen A: Circulating free DNA as biomarker and
source for mutation detection in metastatic colorectal cancer. PLoS
One. 10(e0108247)2015.PubMed/NCBI View Article : Google Scholar
|
|
9
|
Spindler KL, Pallisgaard N, Vogelius I and
Jakobsen A: Quantitative cell-free DNA, KRAS, and BRAF mutations in
plasma from patients with metastatic colorectal cancer during
treatment with cetuximab and irinotecan. Clin Cancer Res.
18:1177–1185. 2012.PubMed/NCBI View Article : Google Scholar
|
|
10
|
Spindler KL, Pallisgaard N, Andersen RF
and Jakobsen A: Changes in mutational status during third-line
treatment for metastatic colorectal cancer - results of consecutive
measurement of cell free DNA, KRAS and BRAF in the plasma. Int J
Cancer. 135:2215–2222. 2014.PubMed/NCBI View Article : Google Scholar
|
|
11
|
Spindler KG, Boysen AK, Pallisgård N,
Johansen JS, Tabernero J, Sørensen MM, Jensen BV, Hansen TF,
Sefrioui D, Andersen RF, et al: Cell-Free DNA in metastatic
colorectal cancer: A systematic review and meta-analysis.
Oncologist. 22:1049–1055. 2017.PubMed/NCBI View Article : Google Scholar
|
|
12
|
Goldshtein H, Hausmann MJ and Douvdevani
A: A rapid direct fluorescent assay for cell-free DNA
quantification in biological fluids. Ann Clin Biochem. 46(Pt
6):488–494. 2009.PubMed/NCBI View Article : Google Scholar
|
|
13
|
Boysen AK, Sørensen BS, Lefevre AC,
Abrantes R, Johansen JS, Jensen BV, Schou JV, Larsen FO, Nielsen D,
Taflin H, et al: Methodological development and biological
observations of cell free DNA with a simple direct fluorescent
assay in colorectal cancer. Clin Chim Acta. 487:107–111.
2018.PubMed/NCBI View Article : Google Scholar
|
|
14
|
Schou JV, Larsen FO, Sørensen BS, Abrantes
R, Boysen AK, Johansen JS, Jensen BV, Nielsen DL and Spindler KL:
Circulating cell-free DNA as predictor of treatment failure after
neoadjuvant chemo-radiotherapy before surgery in patients with
locally advanced rectal cancer. Ann Oncol. 29:610–615.
2018.PubMed/NCBI View Article : Google Scholar
|
|
15
|
Boysen AK, Jensen M, Nielsen DT, Mortensen
FV, Sørensen BS, Jensen AR and Spindler KL: Cell-free DNA and
chemoembolization in patients with liver metastases from colorectal
cancer. Oncol Lett. 16:2654–2660. 2018.PubMed/NCBI View Article : Google Scholar
|
|
16
|
Boysen AK, Schou JV, Jensen BV, Nielsen D,
Sørensen BS, Johansen JS and Spindler KG: Prognostic and predictive
value of circulating DNA for hepatic arterial infusion of
chemotherapy for patients with colorectal cancer liver metastases.
Mol Clin Oncol. 13(77)2020.PubMed/NCBI View Article : Google Scholar
|
|
17
|
Lefèvre AC, Kronborg C, Sørensen BS, Krag
SRP, Serup-Hansen E and Spindler KG: Measurement of circulating
free DNA in squamous cell carcinoma of the anus and relation to
risk factors and recurrence. Radiother Oncol. 150:211–216.
2020.PubMed/NCBI View Article : Google Scholar
|
|
18
|
Eisenhauer EA, Therasse P, Bogaerts J,
Schwartz LH, Sargent D, Ford R, Dancey J, Arbuck S, Gwyther S,
Mooney M, et al: New response evaluation criteria in solid tumours:
Revised RECIST guideline (version 1.1). Eur J Cancer. 45:228–247.
2009.PubMed/NCBI View Article : Google Scholar
|
|
19
|
McShane LM, Altman DG, Sauerbrei W, Taube
SE, Gion M and Clark GM: Statistics Subcommittee of the NCI-EORTC
Working Group on Cancer Diagnostics. REporting recommendations for
tumour MARKer prognostic studies (REMARK). Eur J Cancer.
41:1690–1696. 2005.PubMed/NCBI View Article : Google Scholar
|
|
20
|
Nygaard AD, Holdgaard PC, Spindler KL,
Pallisgaard N and Jakobsen A: The correlation between cell-free DNA
and tumour burden was estimated by PET/CT in patients with advanced
NSCLC. Br J Cancer. 110:363–368. 2014.PubMed/NCBI View Article : Google Scholar
|
|
21
|
Thomsen CB, Hansen TF, Andersen RF,
Lindebjerg J, Jensen LH and Jakobsen A: Early identification of
treatment benefit by methylated circulating tumor DNA in metastatic
colorectal cancer. Ther Adv Med Oncol.
12(1758835920918472)2020.PubMed/NCBI View Article : Google Scholar
|
|
22
|
Spindler KL, Pallisgaard N, Appelt AL,
Andersen RF, Schou JV, Nielsen D, Pfeiffer P, Yilmaz M, Johansen
JS, Hoegdall EV, et al: Clinical utility of KRAS status in
circulating plasma DNA compared to archival tumour tissue from
patients with metastatic colorectal cancer treated with
anti-epidermal growth factor receptor therapy. Eur J Cancer.
51:2678–2685. 2015.PubMed/NCBI View Article : Google Scholar
|
|
23
|
Hamfjord J, Guren TK, Dajani O, Johansen
JS, Glimelius B, Sorbye H, Pfeiffer P, Lingjærde OC, Tveit KM, Kure
EH, et al: Total circulating cell-free DNA as a prognostic
biomarker in metastatic colorectal cancer before first-line
oxaliplatin-based chemotherapy. Ann Oncol. 30:1088–1095.
2019.PubMed/NCBI View Article : Google Scholar
|
|
24
|
Spindler KG, Demuth C, Sorensen BS,
Johansen JS, Nielsen D, Pallisgaard N, Hoegdall E, Pfeiffer P and
Vittrup Jensen B: Total cell-free DNA, carcinoembryonic antigen,
and C-reactive protein for assessment of prognosis in patients with
metastatic colorectal cancer. Tumour Biol.
40(1010428318811207)2018.PubMed/NCBI View Article : Google Scholar
|
|
25
|
Pallisgaard N, Spindler KL, Andersen RF,
Brandslund I and Jakobsen A: Controls to validate plasma samples
for cell free DNA quantification. Clin Chim Acta. 446:141–146.
2015.PubMed/NCBI View Article : Google Scholar
|