Introduction
Postmenopausal osteoporosis (PMOP) is a bone disease
resulting from low estrogen levels, causing reduced bone mass and
bone microstructure degeneration and increased fragility of bones
and fractures (1). It is a serious,
frequently-occurring disease in older women. As estimated by the
epidemiological survey in 2009, the incidence of the disease was
19.9 and 24% in women aged >40 and >60 years, respectively.
Therefore, PMOP, which has become a serious public health concern,
receives much attention (2).
With the advances in proteomics research, proteomics
techniques show a notably high sensitivity and specificity in
screening for biomarkers of various diseases. Currently, an
increasing number of studies employs such techniques to investigate
the disease-associated whole and differential proteins, in order to
explore the composition and dynamic changes of the disease proteins
at the whole level to gain a better understanding of the various
physiological and pathological processes in individuals, as well as
to search for highly effective diagnostic markers of various
diseases. Matrix-assisted laser desorption/ionization time-of-light
mass spectrometry (MALDI-TOF MS) is a recently emerged proteomics
method, with the potential to detect various clinical samples, such
as serum, urine, pleural effusion, ascites and a number of
secretions (3,4). Therefore, MS technique is a milestone
in clinical detection. The present study employed MALDI-TOF MS
combined with weak cationic exchange (WCX) magnetic beads to
analyze the normal bone mass in postmenopausal women and the serum
protein fingerprint of different degrees of osteoporosis, and
obtain the osteoporosis serum-associated differential protein peak
to provide serum protein fingerprint evidence for early diagnosis
and to explore the pathogenesis of clinical osteoporosis.
Materials and methods
Patients
The osteoporosis cases were postmenopausal women
aged 50–68 years admitted to the Department of Orthopedics, in the
Taizhou Municipal Hospital (Taizhou, China). Bone mineral density
measurement of lumbar vertebrae L1–L4 showed osteopenia in 40 cases
and PMOP in 70 cases [including 40 cases with osteoporosis (OS) and
30 cases with serious osteoporosis (OP)]. The patients who met the
inclusion criteria were included in this study. The inclusion
criteria were based on the bone density measured by dual-energy
X-ray absorptiometry, established by the World Health Organization
(WHO) in 1994: i) patients with reduced bone mass: −1.0≤ T-score
<−2.5; ii) patients with osteoporosis: T-score ≥−2.5; iii)
patients with severe osteoporosis: T-score ≥−2.5, complicated by
one or multiple fractures. T-score was calculated using the
following formula: T-score = (Bone mineral density for the subjects
- mean bone mineral density for patients of the same gender and
ethnicity)/standard deviations of the bone mineral density in
patients of the same gender and ethnicity. The minimum T-score of
the bone mineral density in the lumbar vertebrae L1–L4 was selected
as the judgment standard. Patients who met the following criteria
were excluded from this study: i) treatment history of
anti-osteoporosis drugs, such as calcitonin and bisphosphonate; ii)
secondary osteoporosis induced by endocrine disease, primary or
metastatic bone tumor, blood or kidney disease and orthopaedic
break, which affected bone metabolism and iii) drug administration,
which affected bone metabolism within 3 months, such as estrogen
and steroid hormones. The 70 cases of age-matched postmenopausal
females aged 43–66 years with the normal range of bone mass served
as the controls. The aforementioned cases were divided into the
experimental and validation groups. This study was approved by the
local Ethics Committee of the Taizhou Municipal Hospital. The
patients and volunteers provided written informed consent for their
participation. The patients and serum samples were then grouped
into: the ‘training’ and the blinded ‘test’ groups (Table I). The blood samples were collected
in 5-ml BD Vacutainers® without anticoagulation and
allowed to clot at room temperature for up to 1 h. The samples were
then centrifuged at 4°C for 5 min at 10,000 rpm. The sera were
frozen and stored at −80°C for future analysis.
 | Table I.Clinical characteristics of the study
subjects. |
Table I.
Clinical characteristics of the study
subjects.
| Groups | Training set, n | Blind set, n | Total |
|---|
| PMOP | | | |
| OS | 30 | 10 | 40 |
| OP | 15 | 15 | 30 |
| Control | | | |
| Osteopenia | 30 | 10 | 40 |
| Healthy
subjects | 40 | 30 | 70 |
| Total | 115 | 65 | 180 |
WCX magnetic beads analysis
Frozen serum samples were defrosted on ice and
centrifuged at 20,000 rpm for 10 min at 4°C. Serum samples were
pretreated with WCX magnetic beads. Each serum sample (10 μl) was
denatured by the addition of 20 μl of U9 buffer (9 mol/l urea, 2%
CHAPS) and mixed at 4°C for 30 min. Each sample was then diluted in
100 μl of low stringency buffer (0.1 M sodium acetate, pH 4.0). WCX
magnetic beads were activated. Then, 50 μl of WCX magnetic beads
(50 mg/ml) were transferred to a polymerase chain reaction (PCR)
tube that was placed in a 2×8 well magnetic bead separator for 1
min for magnetic fixation of the WCX particles. The supernatant was
aspirated and the tubes were removed from the separator. Low
stringency buffer (100 μl) was mixed with the magnetic beads. The
magnetic beads were fixed for 1 min in the separator and the
supernatant was aspirated. This washing procedure was repeated
twice. One hundred microliters of each diluted serum sample were
added on the surface of the activated magnetic beads for 60 min at
room temperature, and then washed twice with 100 μl of low
stringency buffer. After the final washing step, bound molecules
were eluted by incubation with 10 μl of 0.5% (v/v) trifluoroacetic
acid (TFA). Elute (5 μl) was diluted with SPA (5 μl; saturated
solution of sinapinic acid in 50% acetonitrile with 0.5% TFA. Two
microliters of the resulting mixture were aspirated and spotted
onto gold-coated ProteinChip® arrays. After air-drying
for ∼5 min at room temperature, protein crystals on the chip were
scanned with the ProteinChip (Model PBS IIc) reader (Ciphergen
Biosystems, Fremont, CA, USA) to determine the masses and
intensities of the peaks over the range mass-to-charge (m/z)
1,000–50,000. The reader was set up as follows: mass range
(1,000–50,000 Da), optimized mass range (1,000–20,000 Da), laser
intensity (190) and sensitivity (8). Mass calibration was performed using an
all-in-one peptide reference standard containing vasopressin
(1084.2 Da), somatostatin (1637.9 Da), bovine insulin β chain
(3495.9 Da), human insulin recombinant (5807.6 Da) and hirudin
(7033.6 Da) (Ciphergen Biosystems). The default background
subtraction was applied, and the peak intensities were normalized
using the total ion current from a mass charge of 1,000 to 50,000
Da. A biomarker detection software package (Ciphergen Biomarker
Wizards; Ciphergen Biosystems) was used to autodetect protein
peaks. Protein peaks were selected based on the first pass of a
signal-noise ratio of 3 and a minimum peak threshold of 20% of the
spectra. This process was completed with a second pass of peak
selection at 0.2% of the mass window, then the estimated peaks were
added. These selected protein peaks were averaged as clusters and
were exported to a commercially available software package
(Biomarker Patterns; Ciphergen Biosystems) for further
classification analysis.
Detection and statistical analysis
The profiling spectra of the serum samples from the
training set were normalized by total ion current normalization
using the Ciphergen ProteinChip Software (version 3.1). Peak
labeling was performed using the Biomarker Wizard software 3.1
(Ciphergen Biosystems). A two-sample t-test was used to compare
mean normalized intensities between the case and control groups.
P<0.01 was considered to indicate a statistically significant
difference. The intensities of the selected peaks were then
transferred to the Biomarker Pattern Software (BPS) to construct
the classification model of PMOP.
The protein peak intensities of the samples in the
test set were evaluated by BPS using the classification model. The
osteoporosis group, and the control samples were then discriminated
based on their proteomic profile characteristics. Sensitivity was
defined as the probability of predicting osteoporosis group cases,
and specificity was defined as the probability of predicting
control samples. A positive predictive value that yielded a
positive result reflected the probability of osteoporosis.
Results
Quality control and reproducibility
The quality control (QC) serum sample including 8
mixed serum samples from healthy control subjects with blood type O
(4 women and 4 men) was used to determine reproducibility and as a
control protein profile for each WCX magnetic beads experiment. The
coefficient of variation (CV) for intensity and m/z were
calculated, based on duplicate sample testing. The intrachip and
interchip CV for intensity were <10%. The intrachip and
interchip CV for m/z were <0.05%. These values showed good
reproducibility of spectra over time.
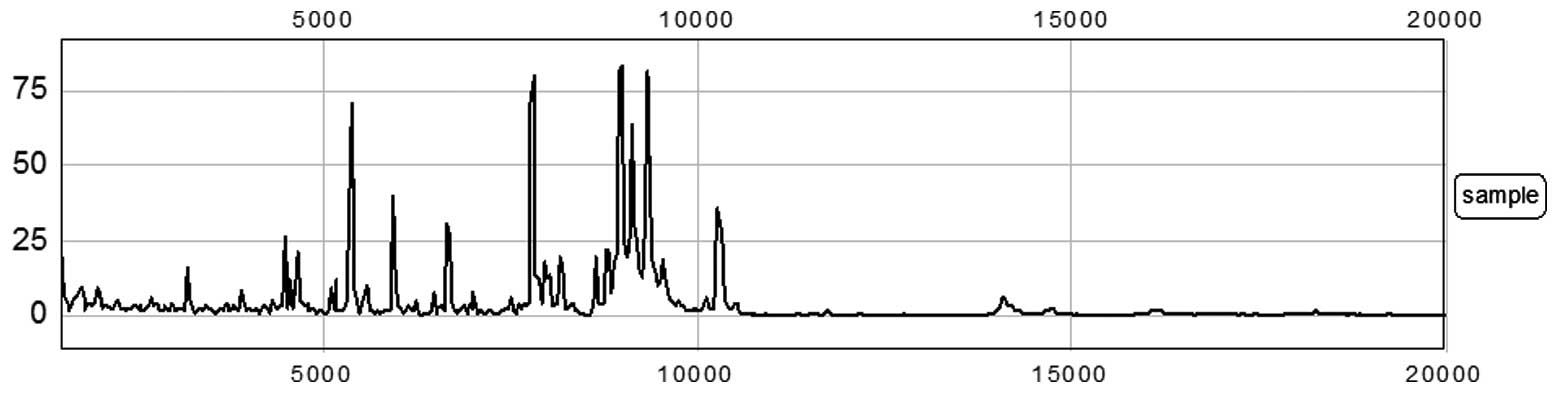
Detection of the protein peaks
Proteomic data from the samples of the training set
(comprising 45 PMOP and 40 healthy subjects) were analyzed using
the Biomarker Wizard software, version 3.1. Up to 138 protein
peaks/spot were detected between m/z 1,000 and 20,000, while the
protein peaks showed the effectiveness of the MALDI technology
separation of low-molecular weight proteins (<20,000) (Fig. 1).
Identification of biomarker pattern and
construction of diagnostic model
The comparison between various samples showed that
the serum profiles from PMOP patients and the control individuals
were highly similar in spite of a few inter-sample variations.
Therefore, the number of variations that consistently
differentiated these two groups could be considered as potential
disease biomarkers. In the present study, we used the Biomarker
Wizard function of the proteinchip software to identify clusters of
peaks differentially presented in PMOP serum samples compared to
healthy controls. We obtained 138 discriminating protein peaks in
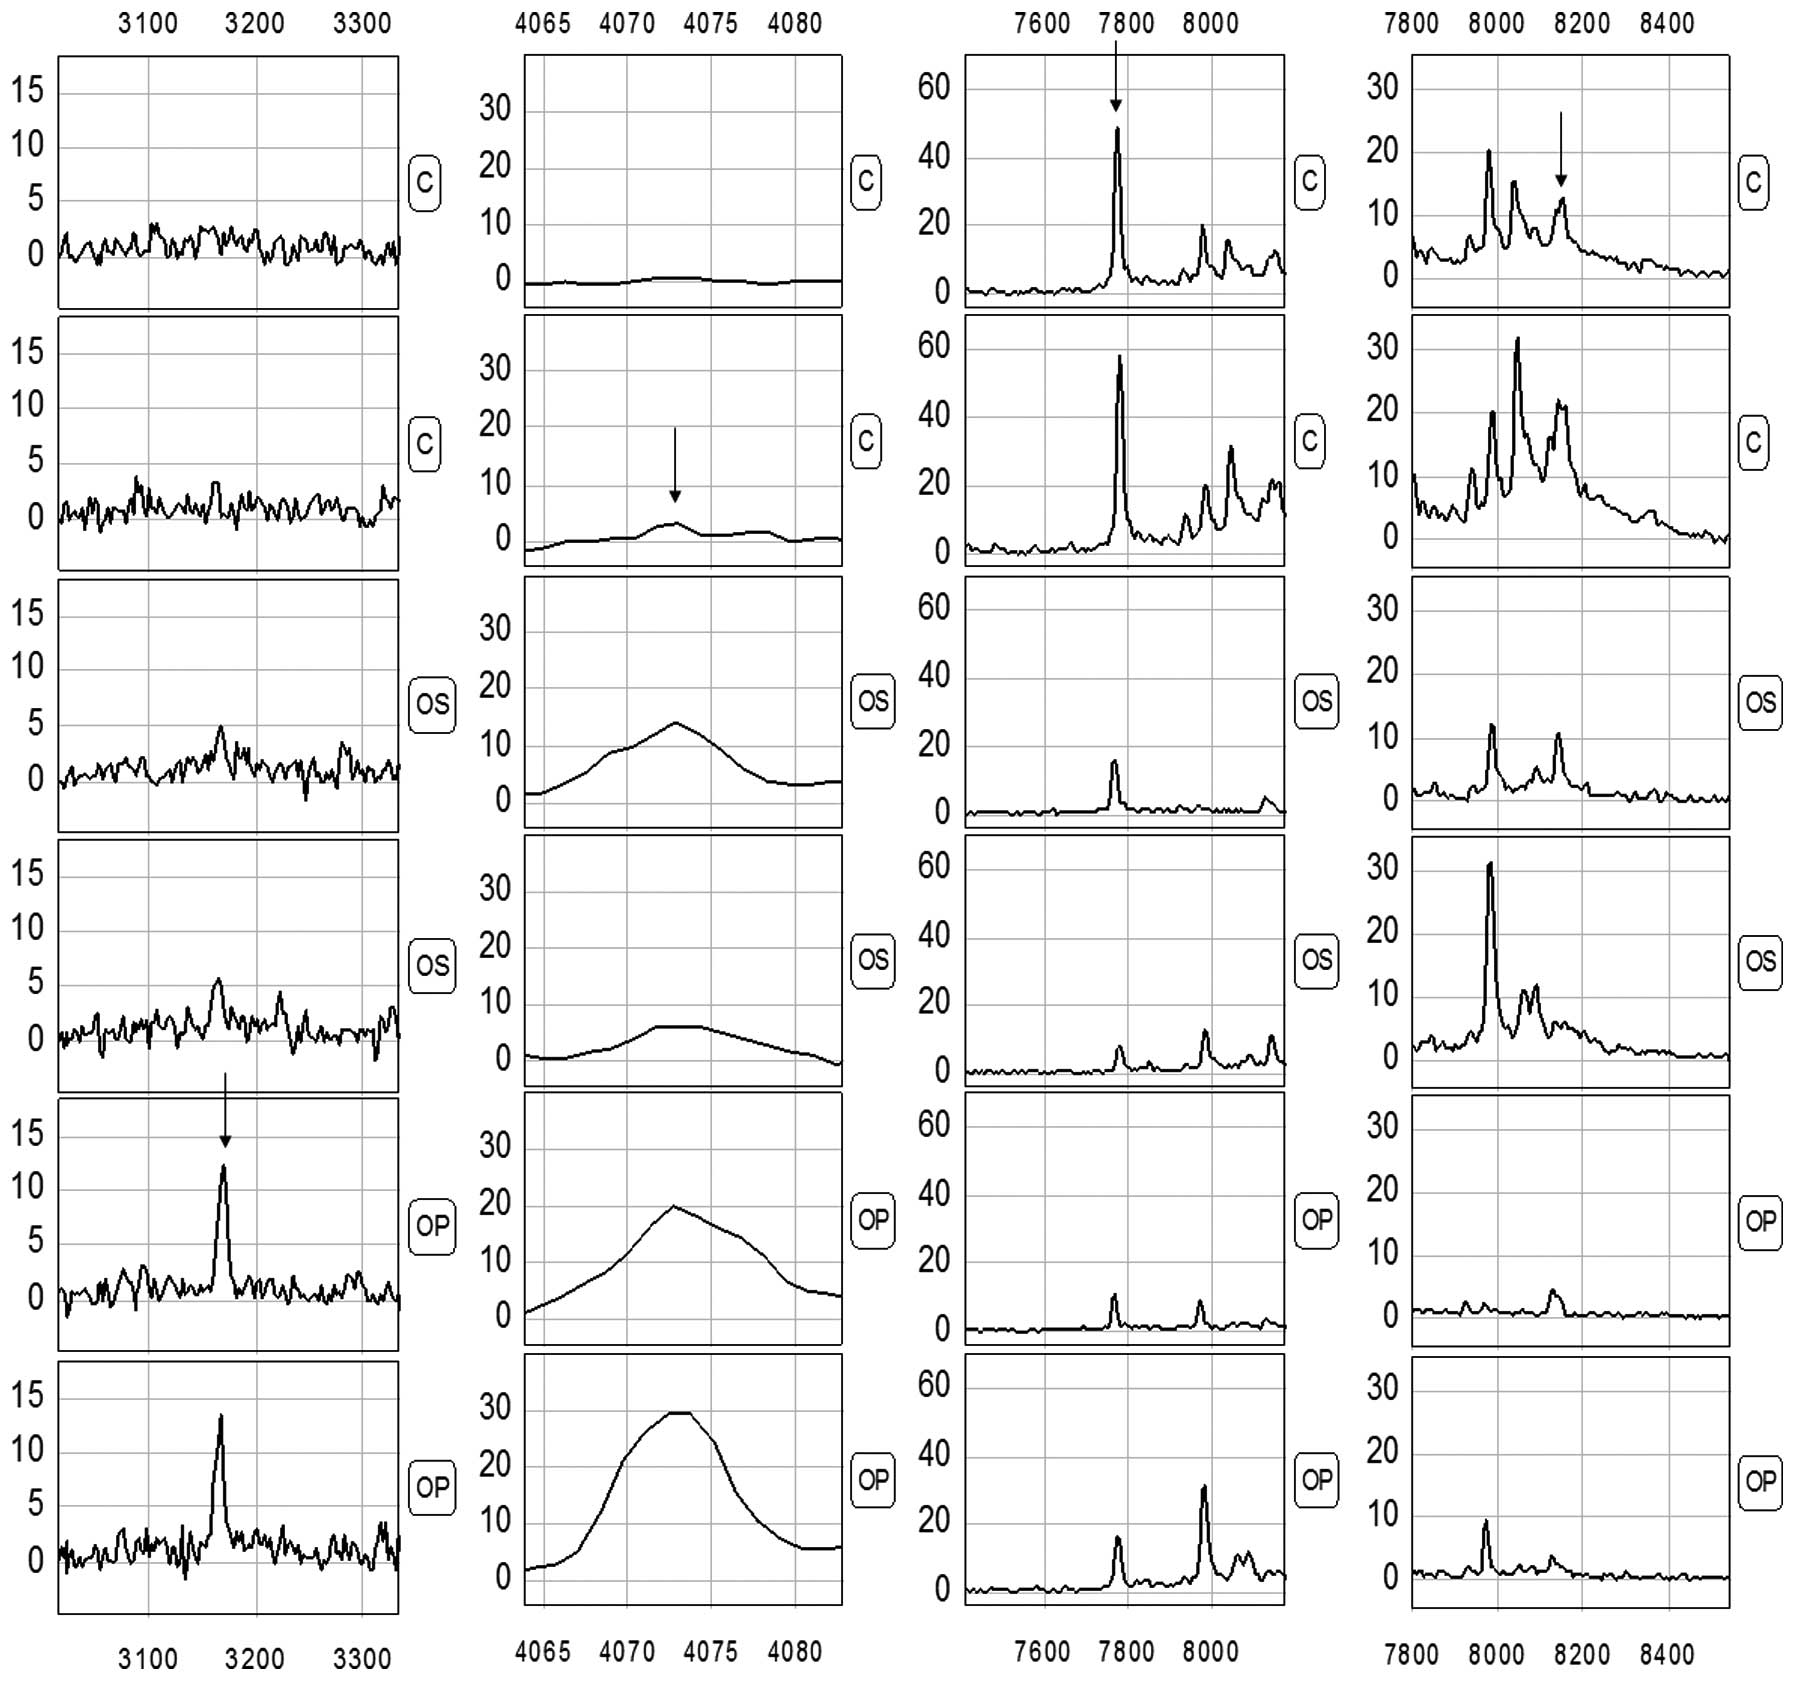
patient sera. To develop biomarker patterns for the diagnosis of
PMOP, the intensities of the protein peaks in the training set were
submitted to BPS. A total of four peaks (3167.4, 4071.1, 7771.7 and
8140.5) with the highest discriminatory power were automatically
selected to construct a classification model (Fig. 2 and Table II). The diagnosis model using the
combination of the four peaks identified 45 PMOP and 70 controls
with a calculated sensitivity of 91.11% (41/45) and a specificity
of 92.86% (65/70). In the blind test group, 36/40 true control
cases were correctly classified, and 21/25 PMOP samples were
correctly classified as malignant. These results yield a
sensitivity of 84% and a specificity of 90% (Table III).
| Table II.Mean signal intensities of various
proteins and peptides comparing OS with the healthy control
group. |
Table II.
Mean signal intensities of various
proteins and peptides comparing OS with the healthy control
group.
| m/z | PMOP group | Control group | P-value |
|---|
| 3167.4 | 4.50±5.16 | 0.37±0.51 |
6.15×10⁻⁷ |
| 7771.7 | 6.08±8.03 | 30.77±24.21 |
2.01×10⁻⁶ |
| 8140.5 | 0.44±0.52 | 3.55±3.83 |
2.55×10⁻⁶ |
| 4071.1 | 5.66±7.12 | 0.75±0.913 |
3.47×10⁻⁵ |
| Table III.Prediction results of the diagnostic
model for the OS group. |
Table III.
Prediction results of the diagnostic
model for the OS group.
| Groups | Sample (group) | No. of cases | Correctly classified
cases | Accuracy (%) |
|---|
| Training set | PMOP | 45 | 41 | 91.11 |
| Control | 70 | 65 | 92.86 |
| Blind set | PMOP | 25 | 21 | 84.0 |
| Control | 40 | 36 | 90.0 |
Evaluation of the diagnostic model for
PMOP in a blind test
We used 25 samples with PMOP (10 OS and 15 OP) and
40 healthy subjects (10 osteopenia and 30 healthy subjects) to
evaluate the PMOP diagnostic model in the blind test. The
classification tree discriminated the PMOP from the control samples
with a calculated sensitivity of 84% (21/25) and a specificity of
90% (36/40) (Table III). The varied
importance scores of the three masses as well as the corresponding
diagnosis sensitivity and specificity of each mass were summarized
in Table IV. m/z 3167.4 had the
highest importance score.
| Table IV.Node variable importance scores of
three protein biomarkers. |
Table IV.
Node variable importance scores of
three protein biomarkers.
| Node | m/z | Sensitivity (%) | Specificity (%) | Variable importance
scores |
|---|
| 1 | 3167.4 | 66.7 | 69.3 | 100 |
| 2 | 4071.1 | 55.6 | 62.7 | 85 |
| 3 | 7771.7 | 48.9 | 50.7 | 68 |
| 4 | 8140.5 | 44.4 | 42.7 | 55 |
Discussion
PMOP is a common disease that seriously damages the
quality of life of older women. This disease usually occurs in
women after 5–10 years of menopause, with an estimated incidence of
30–50% in women aged >60 years that increases with age.
Osteoporosis-induced fracture has become the major cause of
life-shortening disability and teratogenesis in older persons
(5,6).
Osteoporosis is a systemic bone disease
characterized by reduction in bone mass and tissue microstructure
damage, thereby causing reduced bone strength, increased bone
fragility and fractures. In adult bones, bone remodeling only
emerges in sites with bone resorption, including activation,
resorption, formation and quiescence phases. Osteoblasts are
responsible for bone formation and osteoclasts for its resorption,
and the balance of bone metabolism is maintained by the
coordination of those two. Osteoporosis may develop through the
following pathways: i) Estrogen promotes calcitonin secretion and
inhibits the activity of osteoclasts. Due to the reduction in
estrogen secretion in postmenopausal women, calcitonin exhibits a
weakening inhibition on osteoclasts, while the increased activity
of osteoclasts leads to an increased bone resorption. If bone
resorption is greater than bone formation, osteoporosis develops.
ii) Lack of estrogen inhibits the secretion of parathyroid hormone.
Parathyroid hormone is a catalytic agent that transforms the
inactive vitamin D to active form. Lack of parathyroid hormone
secretion leads to a reduction in the production of active vitamin
D, causing reduced calcium absorption in intestines; thus, a
shortage of raw materials for bone formation leads to
osteoporosis.
Currently, the diagnosis of osteoporosis relies on
bone density measured by dual-energy X-ray absorptiometry
established by WHO in 1994 (7).
Such a diagnostic method only reflects the bone mass/unit, and
therefore has a number of shortages. The major technical indices
are only used for the comparison between healthy adults with the
same gender and ethnicity. Due to the limitations of equipments and
determination methods, it is impossible to perform large-scale
screening of osteoporosis. Currently, the commonly used serum bone
markers, such as total procollagen type 1 amino-terminal
propeptide, the carboxy-terminal cross-linking telopeptide of type
I collagen (β-CrossLaps), N-terminal osteocalcin and
25-hydroxyvitamin D3 reflects the changes of bone metabolism
(8,9). However, these indicators have a low
sensitivity and specificity in the early diagnosis of osteoporosis
that does not meet requirements of non-invasive and specific early
diagnosis of osteoporosis in the clinical practice. While patients
with symptoms visit a doctor, the majority of patients presenting
have developed late-stage osteoporosis, in whom relief of pain
together with prevention of additional reductions in bone mineral
density is conducted. However, such treatment has no significant
therapeutic effect on severe osteoporosis. Therefore, prevention,
early diagnosis, pathogenesis and treatment of osteoporosis have
been considered to be high priorities (10).
The present study screened four protein markers with
m/z of 3167.4, 4071.1, 7771.7 and 8140.5, in which the peaks of the
proteins with m/z of 3167.4 and 4071.1 were markedly greater in the
osteoporosis group compared to the control group, while a
significantly higher expression of the proteins with m/z of 7771.7
and 8140.5 was detected in the control group. The sensitivity and
specificity were 91.11 (41/45) and 92.86% (65/70) in the detection
of PMOP using the diagnostic model of the combination of these four
markers, suggesting that the four protein markers may be used as
indicators for the serological diagnosis of osteoporosis. The
established diagnostic model for osteoporosis was validated using
the protein fingerprint profiles from 25 osteoporosis cases and 40
controls, and the results showed that the sensitivity and
specificity were 84 (21/25) and 90% (36/40), respectively, for the
detection of PMOP.
In conclusion, we have shown that using proteomics
approaches, such as magnetic beads and MALDI-TOF-MS in combination
with bioinformatics tools, facilitates the establishment of new
biomarkers and provide a rapid and mass-accurate mode of analysis
for the detection of multiple disease-related proteins in a
simultaneous, reproducible and high-throughput manner (11,12).
Using the panel of four selected biomarkers, high sensitivity and
specificity for the detection of PMOP was achieved. However, in
this study, each m/z value may represent a number of peptides of
similar molecular weight, thus the proteins in the body fluid could
not be detected. Therefore, to delineate the structures and
functions of the proteins, additional studies are required.
References
|
1.
|
Mazzuoli G, Acca M, Pisani D, et al:
Annual skeletal balance and metabolic bone marker changes in
healthy early postmenopausal women. Bone. 26:381–386. 2000.
View Article : Google Scholar : PubMed/NCBI
|
|
2.
|
Wark JD: Osteoporotic fractures:
background and prevention strategies. Maturitas. 23:193–207. 1996.
View Article : Google Scholar : PubMed/NCBI
|
|
3.
|
Li YZ, Hu CJ, Leng XM, et al: Promising
diagnostic biomarkers for primary biliary cirrhosis identified with
magnetic beads and MALDI-TOF-MS. Anat Rec (Hoboken). 292:455–460.
2009. View
Article : Google Scholar : PubMed/NCBI
|
|
4.
|
Liu C, Shen J, Pan C, et al: MALDI-TOF MS
combined with magnetic beads for detecting serum protein biomarkers
and establishment of boosting decision tree model for diagnosis of
hepatocellular carcinoma. Am J Clin Pathol. 134:235–241. 2000.
View Article : Google Scholar
|
|
5.
|
European Foundation for Osteoporosis and
Bone Disease, National Osteoporosis Foundation: Who are candidates
for prevention and treatment for osteoporosis? Osteoporos Int.
7:1–6. 1997. View Article : Google Scholar
|
|
6.
|
Melton LJ III, Chrischilles EA, Cooper C,
et al: Perspective. How many women have osteoporosis? J Bone Miner
Res. 7:1005–1010. 1992. View Article : Google Scholar : PubMed/NCBI
|
|
7.
|
Nelson HD, Helfand M, Woolf SH and Allan
JD: Screening for postmenopausal osteoporosis: A review of the
evidence for the U.S. Preventive Services task force. Ann Intern
Med. 137:529–541. 2002. View Article : Google Scholar : PubMed/NCBI
|
|
8.
|
Lappe J, Kunz I, Bendik I, et al: Effect
of a combination of genistein, polyunsaturated fatty acids and
vitamins D3 and K1 on bone mineral density in postmenopausal women:
a randomized, placebo-controlled, double-blind pilot study. Eur J
Nutr. Feb 3–2012.(Epub ahead of print). View Article : Google Scholar
|
|
9.
|
Papierska L, Rabijewski M,
Kasperlik-Załuska A and Zgliczyński W: Effect of DHEA
supplementation on serum IGF-1, osteocalcin, and bone mineral
density in postmenopausal, glucocorticoid-treated women. Adv Med
Sci. 57:51–57. 2012. View Article : Google Scholar : PubMed/NCBI
|
|
10.
|
Voelker R: Osteoporosis screening may be
needed less often than previously believed. JAMA. 307:6542012.
View Article : Google Scholar : PubMed/NCBI
|
|
11.
|
Wang QT, Li YZ, Liang YF, et al:
Construction of a multiple myeloma diagnostic model by magnetic
bead-based MALDI-TOF mass spectrometry of serum and pattern
recognition software. Anat Rec (Hoboken). 292:604–610. 2009.
View Article : Google Scholar : PubMed/NCBI
|
|
12.
|
Liu CB, Liang Y, Pan CQ, et al: Proteome
study of differential protein expression in HBV-related primary
hepatic carcinoma. Chem J Chin Univ. 30:1763–1766. 2009.
|