Introduction
The effect of gut microbiota on human health is
recognized as a mutually beneficial interaction between human and
indigenous microorganisms that contributes to normal physiology and
immune homeostasis (1). De Filippo
et al (2) recently
demonstrated a difference in gut microbiota between European and
African children, indicating that environmental factors such as
diet, ethnicity, sanitation and hygiene are important for shaping
the gut microbiota (3).
Subsequently, it is likely that there are geographical differences
in the gut microbiota within the Japanese population, since there
are different lifestyles in different districts of the country.
However, geographical differences in gut microbiota have not been
previously investigated in Japan. Therefore, terminal-restriction
fragment length polymorphism (T-RFLP) analyses of fecal samples
from healthy individuals residing in different districts in Japan
were performed, and data mining analysis was used to identify the
geographical differences in gut microbiota.
Materials and methods
Healthy individuals
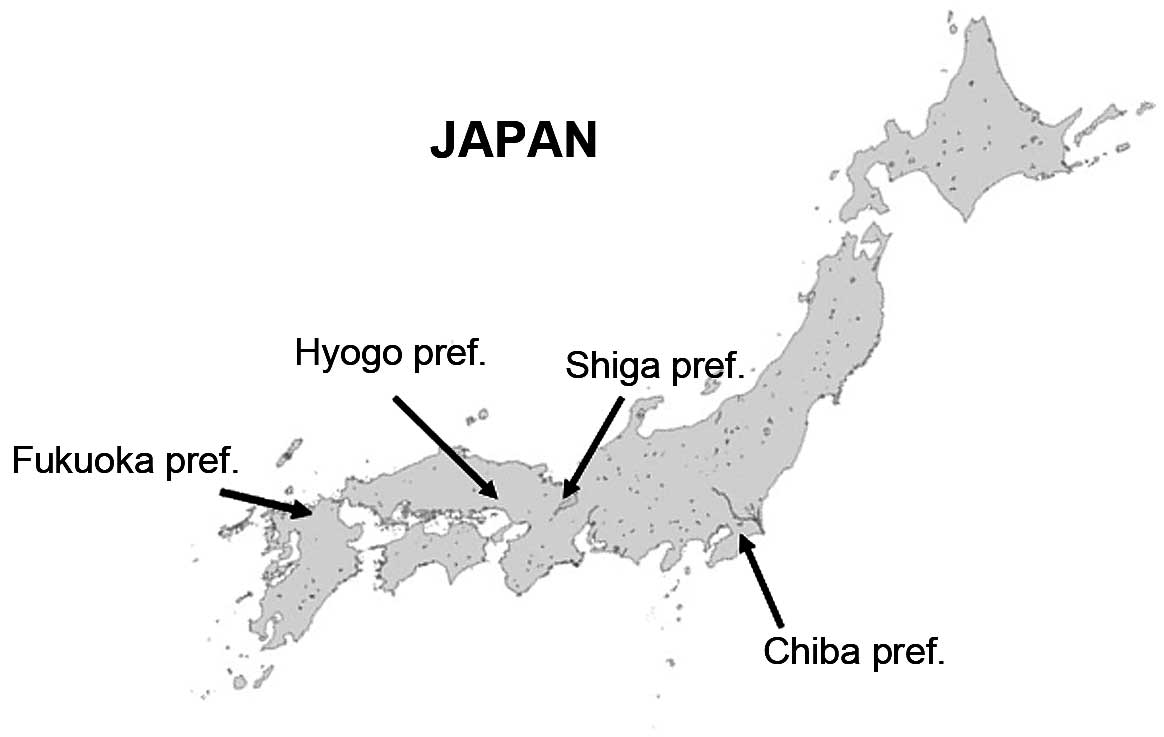
A total of 121 healthy individuals residing in four
different districts in Japan [16 individuals from the Shiga
Prefecture, 45 individuals from the Hyogo (and Osaka) Prefecture,
30 patients from the Fukuoka Prefecture and 40 individuals from the
Chiba Prefecture] were enrolled in the present study (female/male,
52/69; mean age, 32.1 years of age). The location of each
Prefecture in Japan is shown in Fig.
1. The Institutional Review Boards approved the study and
written informed consent was obtained from each participant prior
to enrolment.
DNA extraction
The fecal samples were suspended in the buffer
containing 4 M guanidium thiocyanate, 100 mM Tris-HCl (pH 9.0) and
40 mM EDTA and then beaten in the presence of zirconia beads using
the FastPrep FP100A Instrument (MP Biomedicals, Irvine, CA, USA).
The DNA was then extracted from the beads-treated suspension using
the Magtration System 12GC and GC series Magtration-MagaZorb DNA
Common kit 200N (Precision System Science, Chiba, Japan). The final
concentration of the DNA sample was adjusted to 10
ng/μl.
PCR amplification and T-RFLP
analysis
The 16S rRNA gene was amplified from human fecal DNA
using the 27 forward primer (5′-AGAGTTTGATCCTGGCTCAG-3′) and the
1,492 reverse primer (5′-GGTTACCTTGTTACGACTT-3′) (4,5). The
5′-ends of the forward primers were labeled with
6′-carboxyfluorescein (6-FAM), which was purchased from Applied
Biosystems Japan (Tokyo, Japan). The PCR amplifications of the DNA
samples (10 ng of each DNA) were performed according to a protocol
previously described (4,5). The amplified 16S rDNA genes were
purified using MultiScreen PCR micro96 Plate (Merck Millipore,
Tokyo, Japan) and dissolved in 40 μl of distilled water.
The restriction enzymes were selected according to
Matsumoto et al (4). The
purified PCR products (2 μl) were digested with 10 units of
HhaI and MspI at 37°C for 3 h. The length of the T-RF
fragments was determined using an ABI PRISM 310 Genetic Analyzer
(Applied Biosystems, Tokyo, Japan) in GeneScan mode. Standard size
markers, such as GS 2500 ROX (Applied Biosystems) were used. The
fragment sizes were estimated using the local Southern method in
the GeneScan 3.1 software (Applied Biosystems). Since the apparent
size of identical T-RFs can vary over a range of 1–3 bp among
different gels and/or lanes of the same gel, major T-RFs with a
similar size of 1–3 bp were summarized as operational taxonomic
units (OTUs). Hha1 and Msp1 digestion yielded 42 and
58 OTUs, respectively. The major T-RFs were identified by computer
simulation, which was performed using a T-RFLP analysis program
(6), a phylogenetic assignment
database for the T-RFLP analysis of human colonic microbiota
(4) and Microbiota Profiler
(Infocom T-RFLP Database & Analysis Software; Infocom Co.,
Tokyo, Japan).
Data mining
Data mining analysis was performed using SPSS
Clementine 14 software (IBM Japan, Tokyo, Japan). A dividing system
using the Classification and Regression Tree (C&RT) approach,
which is the most typical method for constructing decision trees,
using the Gini coefficient (7)
between geographic districts and operational taxonomic unit (OTU)
data, was applied. The records were divided into two subsets in
order that the records within each subset were more homogeneous
than in the previous subset. The C&RT is flexible and allows
unequal misclassification costs to be considered, unlike the other
growing systems of data mining.
Results and Discussion
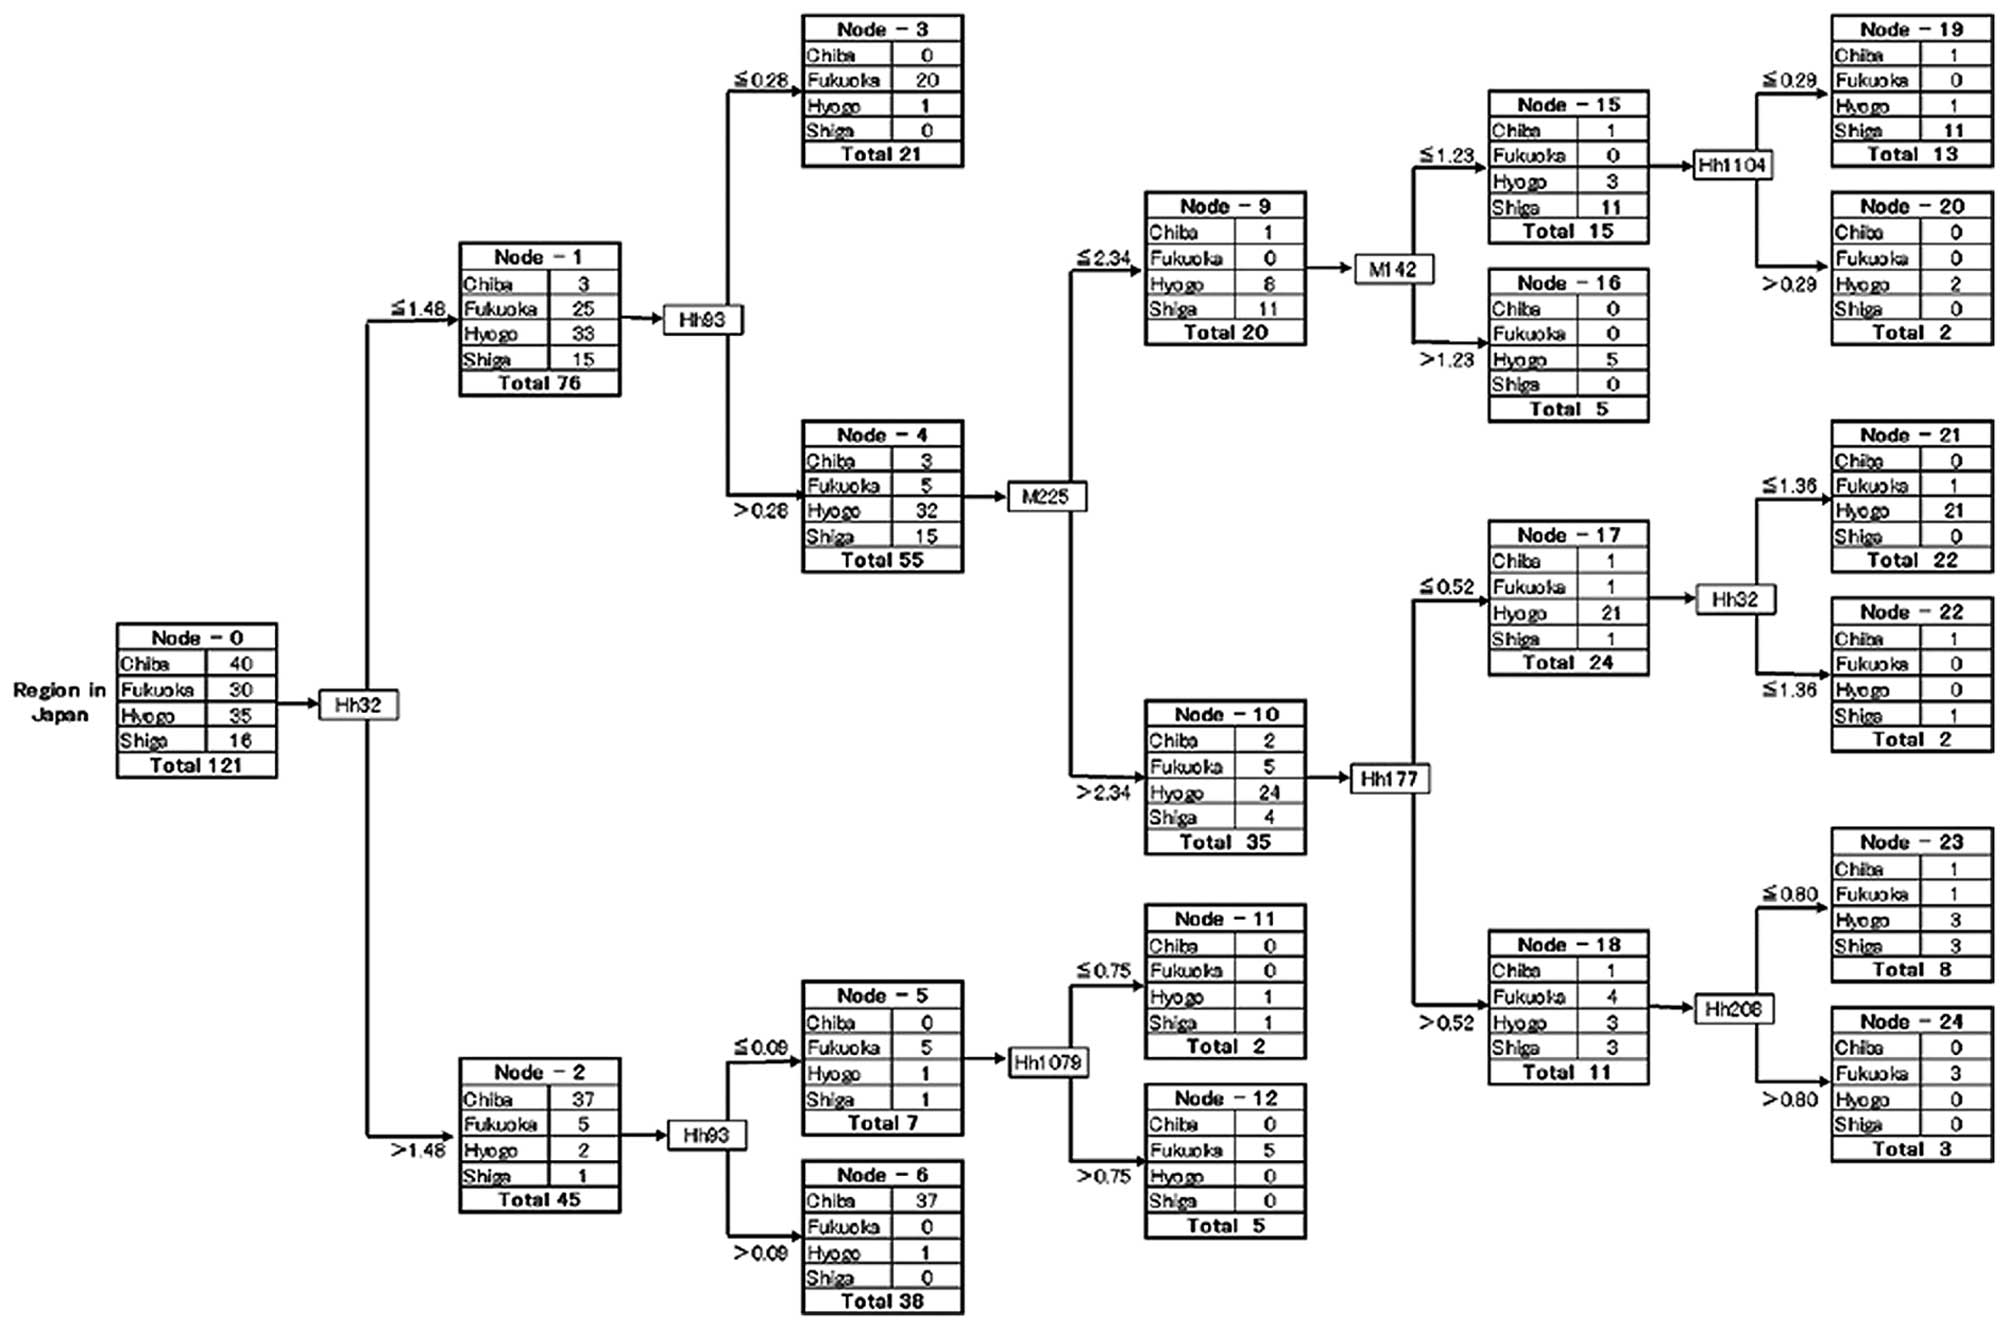
Data mining provided a decision tree (Fig. 2), which clearly identified the
various groups of subjects (nodes). A decision tree is a
decision-supporting pathway that forms a tree-like graph. Each OTU
was expressed as a restriction enzyme and RF length (base pair),
e.g., HhaI 32 bp OTU was abbreviated as Hh32, and
MspI 225 bp OTU was abbreviated as M225. Node-0, the left
end of the decision tree, is known as the root node, which is the
starting point for tree construction, while the nodes on the right
indicate division of the various subject groups. As shown in
Fig. 2, Node-0 was divided into
Node-1 and -2 by Hh32 with a cut-off value of 1.48. This cut-off
value of 1.48 of Hh32 was calculated from Hh32 data of all the
subjects using the Gini coefficient with the C&RT method.
Similar steps were repeated for construction of the decision tree.
The terminal node means the node that cannot be further divided as
it has an impurity of 0. The details of the decision tree and the
pathway required to reach the terminal node clearly indicated the
species and quantities of OTUs, which contributed to the division
of the various subject groups.
Various nodes characterized the subjects from the
four geographically distinct regions (Fig. 1). The subjects from the Hyogo
Prefecture were mainly characterized by Node 21, comprising 21 of
the 35 Hyogo subjects (60%), and the subjects from the Shiga
Prefecture were mainly characterized by Node 19, comprising 11 of
the 16 Shiga subjects (69%). Similarly, the subjects from the Chiba
Prefecture were characterized by Node 6, comprising 37 of the 40
Chiba subjects (93%), and the subjects from the Fukuoka Prefecture
were characterized by Nodes 3 (67%), 12 and 24, which included 28
of the 30 Fukuoka subjects (total 93%). These findings indicate the
presence of geographical differences in the gut microbiota of
healthy individuals in Japan.
A notable characteristic of data mining analysis is
the use of a single selected OTU for each step of decision tree
construction. In Fig. 2, only 8 of
a total of 100 OTUs were used, with 2 OTUs (Hh32 and Hh93) being
applied twice, meaning that the other 92 were not used to construct
the tree shape. Thus, only 8 OTUs contribute to the
characterization of gut microbiota of four geographically distinct
districts in Japan.
We have previously reported the results of cluster
analysis of the gut microbiota profiles of the same samples used in
this study (8). However, we did not
identify geographical differences using cluster analysis possibly
due to two limitations of cluster analysis. The first is that the
cluster analysis shows only some classified groups, but does not
include obvious reasons for creating the groups. The second is that
the obtained cluster lacks flexibility, thus a slight modification
of the data affects cluster formation. On the other hand, data
mining constructs a decision tree, which is a set rule that
predicts target variables and creates the classification trees by
repeatedly dividing the data. During this process, a tree branch is
created, and each branch determines the classification criteria for
the dividing data. Therefore, it explores the set of data and
determines the variable that is predicted as the most significant
of the predictor variables. Moreover, once the structure of the
decision tree is constructed, as long as the basic concepts of the
data were active, all of the subsequent new records can be run
using the same data mining. The main difference between data mining
and cluster analyses is the ability to handle data noise. Data
mining skips characteristic noise and selects a series of related
fields, but cluster processing respects all data without
consideration of any numerical noise. Thus, using data mining
analysis it was possible to demonstrate geographical differences in
human gut microbiota in Japan.
In conclusion, to the best of our knowledge, this is
the first report identifying geographical differences in human gut
microbiota in Japan via construction of a decision tree and
identification of 8 from a total of 100 OTUs. Given these results,
the data mining method is considered to be one of the optimal tools
for characterizing the human gut microbiota.
Acknowledgements
The authors appreciate the technical
support of TechnoSuruga Laboratory Co., Ltd. (Sizuoka, Japan) and
would like to express thanks.
References
|
1
|
Rautava S, Luoto R, Salminen S and
Isolauri E: Microbial contact during pregnancy, intestinal
colonization and human disease. Nat Rev Gastroenterol Hepatol.
9:565–576. 2012. View Article : Google Scholar : PubMed/NCBI
|
|
2
|
De Filippo C, Cavalieri D, Di Paola M, et
al: Impact of diet in shaping gut microbiota revealed by a
comparative study in children from Europe and rural Africa. Proc
Natl Acad Sci USA. 107:14691–14696. 2010.PubMed/NCBI
|
|
3
|
Kurokawa K, Itoh T, Kuwahara T, et al:
Comparative metagenomics revealed commonly enriched gene sets in
human gut microbiomes. DNA Res. 14:169–181. 2007. View Article : Google Scholar : PubMed/NCBI
|
|
4
|
Matsumoto M, Sakamoto M, Hayashi H and
Benno Y: Novel phylogenetic assignment database for
terminal-restriction fragment length polymorphism analysis of human
colonic microbiota. J Microbiol Methods. 61:305–319. 2005.
View Article : Google Scholar
|
|
5
|
Sakamoto M, Takeuchi Y, Umeda M, Ishikawa
I and Benno Y: Application of terminal RFLP analysis to
characterize oral bacterial flora in saliva of healthy subjects and
patients with periodontitis. J Med Microbiol. 52:79–89. 2003.
View Article : Google Scholar : PubMed/NCBI
|
|
6
|
Marsh TL, Saxman P, Cole J and Tiedje J:
Terminal restriction fragment length polymorphism analysis program,
a web-based research tool for microbial community analysis. Appl
Environ Microbiol. 66:3616–3620. 2000. View Article : Google Scholar
|
|
7
|
Blair YI, McMahon AD and Macpherson LM:
Comparison and relative utility of inequality measurements: as
applied to Scotland’s child dental health. PloS One.
8:e585932013.PubMed/NCBI
|
|
8
|
Andoh A, Kuzuoka H, Tsujikawa T, et al:
Multicenter analysis of fecal microbiota profiles in Japanese
patients with Crohn’s disease. J Gastroenterol. 47:1298–1307.
2012.PubMed/NCBI
|