Introduction
Gestational diabetes mellitus (GDM) is associated
with an increased risk for adverse obstetrical outcomes, such as
macrosomia, shoulder dystocia and birth injury, primary cesarean
delivery, preeclampsia, preterm delivery and fetal and neonatal
mortality (1–5). Hyperglycemia results from an
inadequate compensatory secretion of insulin from the maternal
pancreas (6,7). Increased fetal weight in the infants
of diabetic mothers was previously considered to be the result of
maternal hyperglycemia. However, the control of fetal growth in
pregnancies with or without underlying diabetes is significantly
more complicated (8).
Asian individuals are classified as genetically
highly susceptible to glucose intolerance [i.e., GDM, type 2
diabetes and impaired glucose tolerance (IGT)] (9–12). In
the present study, we assessed glucose challenge test (GCT) and
75-g oral glucose tolerance test (OGTT) glucose values, homeostasis
model assessment of insulin resistance (HOMA-IR) and several
adverse maternal and perinatal outcomes in pregnant Chinese women
with a positive GCT. Additionally, we evaluated whether β-cell
function and glucose tolerance status are associated with obstetric
outcomes.
Materials and methods
Subjects
This is a cohort observational study involving
prospective enrollment of all consecutive low-risk pregnant women
who presented to the antenatal outpatient unit of the First
Affiliated Hospital of Nanjing Medical University between April,
2010 and December, 2012. The standard obstetrical practice at our
institution includes universal screening for GDM in women between
the 24th and 28th week of pregnancy with a 50-g oral GCT. A
prenatal 75-g OGTT was subsequently performed with the
administration of a standard 75-g glucose load in GCT-positive
patients. Exclusion criteria for all subjects included high blood
pressure, multiple pregnancies, congenital anomalies or the use of
medications known to affect glucose metabolism. Following
exclusion, a total of 345 women were recruited.
This study was approved by the Institutional Review
Board of the First Affiliated Hospital of Nanjing Medical
University. Informed consent was obtained from all the
participants.
GDM screening and glucose tolerance
status
Demographic data including age, parity, height,
pre-pregnancy weight, pre-pregnancy body mass index (BMI) and
family history of diabetes or hypertension were documented for all
the subjects. The body weight was stable (±2 kg) for at least 3
months prior to enrollment. The height was measured by a
stadiometer and the weight with a digital scale. The BMI was
calculated as weight (kg)/height2 (m2).
Preceding the diagnostic OGTT, each subject underwent a standard
50-g GCT between the 24th and 28th week of gestation, as part of a
universal screening procedure for GDM. Maternal venous blood
samples were drawn and plasma was prepared following standard
procedures for the measurement of glucose and insulin at fasting
and at 1-, 2- and 3-h intervals following glucose administration.
Plasma glucose was measured with the glucose oxidase method and
insulin concentrations were measured via radioimmunoassay. Based on
the results of the OGTT assay according to criteria applying to the
Chinese population (13), GDM was
diagnosed if two or more glucose values reached or exceeded the
following thresholds: fasting, 5.6 mmol/l; 1 h, 10.3 mmol/l; 2 h,
8.6 mmol/l; and 3 h, 6.7 mmol/l. IGT was diagnosed if one value
reached or exceeded these thresholds. The normal glucose tolerance
(NGT) group comprised GCT-positive women with normal OGTT
values.
Daily glucose profile and management of
GDM
Pregnant women diagnosed with GDM were hospitalized
in order to undergo dietary management as follows: restriction of
carbohydrates to 40% of the daily calorie intake, which was 25–30
kcal/kg of ideal body weight for obese and overweight patients and
30–35 kcal/kg for normal-weight subjects. Insulin therapy was
initiated when dietary treatment did not consistently maintain
fasting and preprandial capillary glucose ≤100 mg/dl and 2-h
postprandial capillary glucose ≤120 mg/dl. Regular and neutral
protamine Hagedorn (NPH) insulin were used to achieve the glycemic
goal and the insulin dose was adjusted according to an insulin
algorithm based on bedside glucose monitoring or self-monitoring of
capillary glucose values. The patients were discharged after
titrating the dosage, with the total insulin dosage at discharge
being used for analyzing its correlation with β-cell function.
Insulin sensitivity and β-cell
function
Insulin sensitivity and insulin secretion were
evaluated using measurements from the diagnostic OGTT. The areas
under the glucose curve (AUC gluc) and insulin curve (AUC ins)
during the OGTT were calculated using the trapezoidal rule. As a
measure of insulin secretion, basal insulin and glucose
concentrations were used for the estimation of β-cell secretion
according to the homeostasis model assessment (14): HOMA-βCFI = [(20 ×
insulin)/(glucose-3.5)]%; (HOMA-IR) = (glucose × insulin)/22.5,
where the levels of insulin and glucose are expressed in mU/l and
mmol/l, respectively (15). The
HOMA-IR index was calculated (14)
to reflect insulin action in a manner independent of OGTT
responses.
Obstetric outcomes
All the pregnant women received routine antenatal
examination and the frequency of antenatal visits was increased for
those with pregnancy abnormalities. Preterm delivery was defined as
any delivery prior to 37 weeks of gestation. Macrosomia was defined
as birth weight ≥4,000 g. Delivery data and outcomes, including
gestational age at delivery, Apgar scores, gender, birth weight,
delivery mode, third or fourth degree perineal tears, fetal
respiratory distress syndrome, neonatal hyperbilirubinemia and
macrosomia, were recorded and analyzed.
Statistical analysis
Data are presented as means ± standard error of the
mean (SEM), unless otherwise noted. One-way analysis of variance
(ANOVA) was used to assess the differences of means between groups.
Repeated ANOVA variance analysis was used for the comparison of
continuous variables between groups. P<0.05 was considered to
indicate a statistically significant difference.
Results
Baseline characteristics of the study
groups
From a total of 345 pregnant women who agreed to
participate in the study between April, 2010 and December, 2012,
complete data from 295 women were obtained for analysis. Fifty
women were excluded due to the absence of key data as they had
undergone glucose and/or insulin testing or delivery in other
hospitals. Of the remaining 295 pregnant women, 55 were diagnosed
with GDM and 95 were diagnosed with IGT. Table I summarizes the characteristics of
the participants. No significant difference was observed in BMI
(pre-delivery and pre-pregnancy BMI), HOMA-IR and homeostasis model
assessment of insulin sensitivity (HOMA-IS) among the three groups
(P>0.05). However, the average age of the GDM group was higher
compared to that of the IGT and NGT groups (P<0.05).
 | Table ICharacteristics of the
participants. |
Table I
Characteristics of the
participants.
| Variables | NGT | IGT | GDM | P-value |
|---|
| Age (years) | 28.7±2.2 | 30.1±2.7 | 32.5±4.5 | 0.002 |
| Height (m) | 1.60±0.03 | 1.62±0.04 | 1.61±0.04 | 0.482 |
| Pre-pregnancy weight
(kg) | 55.71±7.24 | 56.29±10.63 | 56.00±7.64 | 0.973 |
| Pre-pregnancy
BMI | 21.5±2.75 | 22.6±3.71 | 22.0±3.58 | 0.986 |
| Pre-delivery weight
(kg) | 69.6±7.0 | 69.5±11.4 | 68.8±9.9 | 0.969 |
| Pre-delivery BMI | 27.1±2.6 | 26.5±3.9 | 26.5±4.4 | 0.835 |
| HOMA-IR | 1.73±0.87 | 2.09±1.55 | 2.27±0.89 | 0.334 |
| HOMA-βCFI | 191.55±108.09 | 174.94±93.66 | 147.65±71.68 | 0.447 |
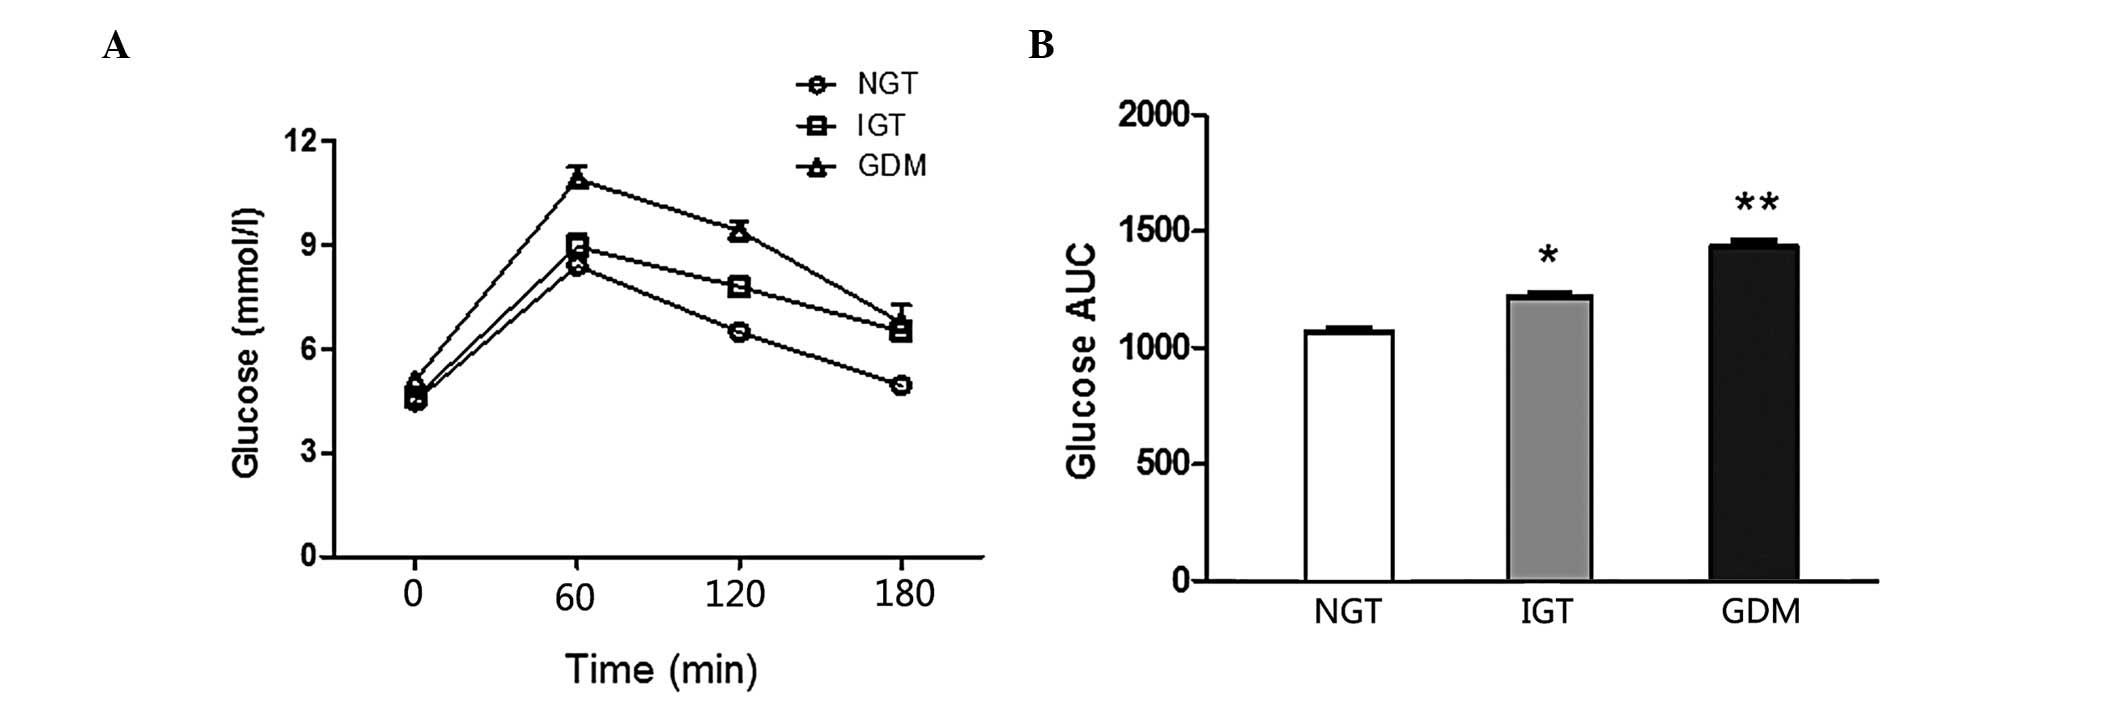
Changes of glucose and insulin values and
β-cell function in pregnant women with IGT or GDM
Comparisons of the glucose curve of OGTT among
different groups are presented in Fig.
1. There was a statistically significant difference in the IGT
vs. the NGT group (P<0.001) and the GDM vs. the IGT and NGT
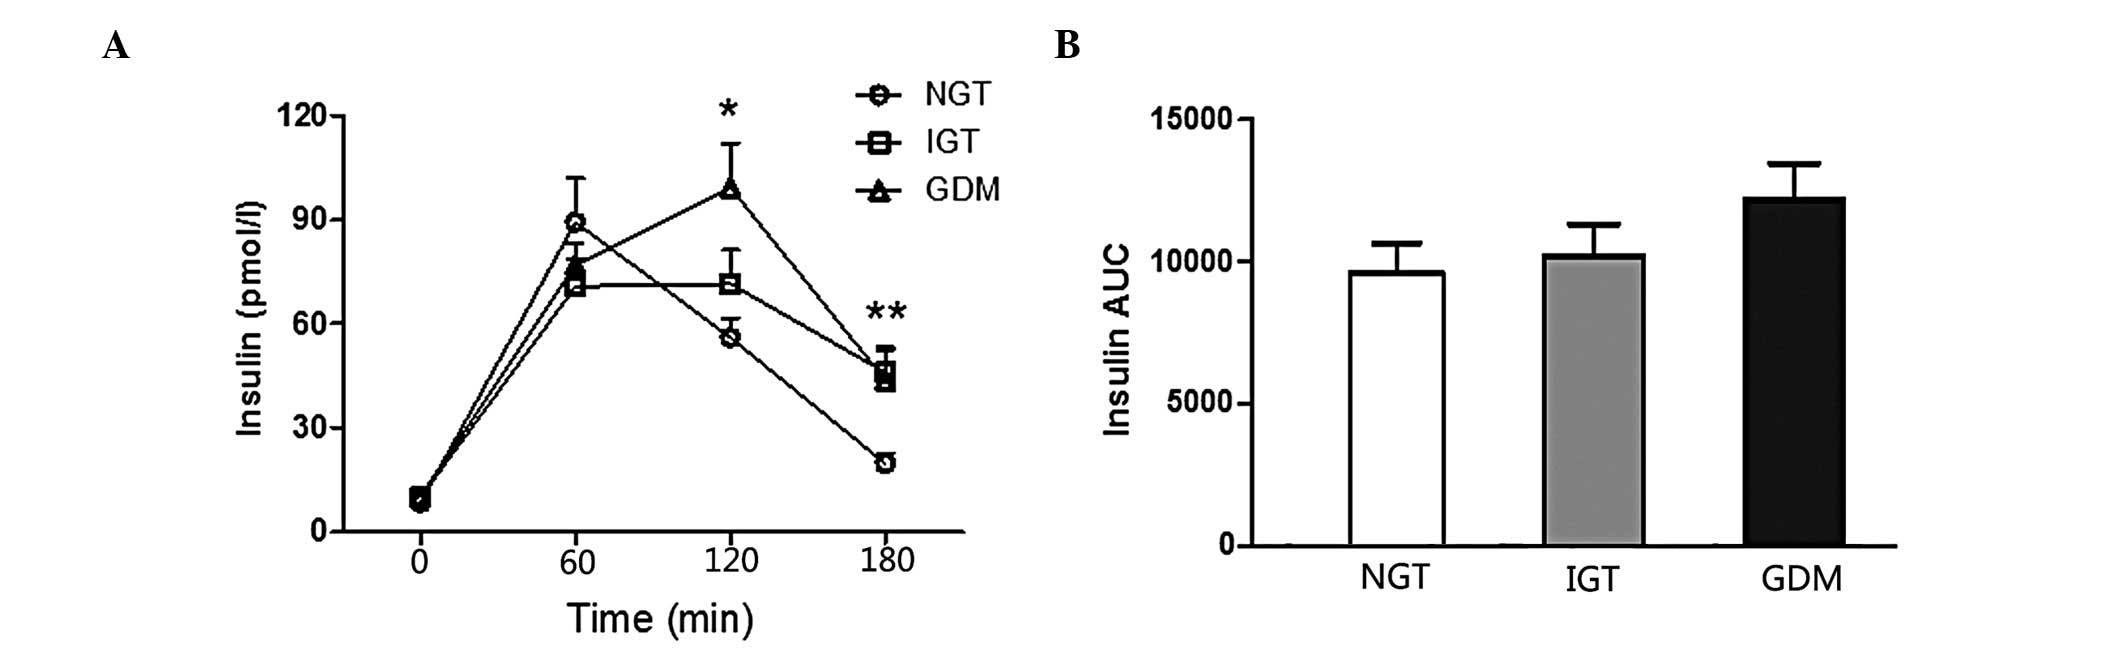
groups (P<0.001). Comparisons of the insulin curve of OGTT among
different groups are presented in Fig.
2, which reveals that there was no difference in the AUC
insulin of OGTT between the groups. The GDM group exhibited
significantly higher fasting and 1-h blood glucose levels compared
to the NGT and IGT groups (P<0.01). The 2-h insulin values of
the GDM group were higher compared to those of the NGT and IGT
groups (P<0.05). The 3-h insulin values of the NGT group were
significantly lower compared to those of the IGT and GDM groups
(P<0.05).
Obstetrical outcomes of the study
groups
Obstetrical outcomes were compared among the three
study groups (Table II). No
fourth-degree perineal tears occurred. No shoulder dystocia,
perineal tears or postpartum hemorrhage (PPH) were reported among
women with diagnosed impaired glucose metabolism. The rate of
pregnancy-induced hypertension (PIH), fetal distress, neonatal
hyperbilirubinemia, preterm delivery, macrosomia and cesarean
delivery exhibited a tendency to increase from the NGT to the IGT
to the GDM group (Table II).
However, these differences were not statistically significant.
| Table IIComparison of adverse maternal and
neonatal outcomes between NGT, IGT and GDM. |
Table II
Comparison of adverse maternal and
neonatal outcomes between NGT, IGT and GDM.
| Perinatal
results | NGT | IGT | GDM |
|---|
| PIH (%) | 10.34% (15/145) | 10.53% (10/95) | 18.18% (10/55) |
| Fetal distress
(%) | 10.34% (15/145) | 21.05% (20/95) | 36.36% (20/55) |
| Neonatal
hyperbilirubinemia (%) | 6.89% (10/145) | 15.79% (15/95) | 18.18% (10/55) |
| Preterm delivery
(%) | 10.34% (15/145) | 10.53% (10/95) | 18.18% (10/55) |
| Birth weight
(kg) | 3.335±0.529 | 3.476±0.434 | 3.613±0.658 |
| Macrosomia (%) | 10.34% (15/145) | 15.79% (15/95) | 18.18% (10/55) |
| Cesarean delivery
(%) | 51.72% (75/145) | 57.89% (55/95) | 81.82% (45/55) |
Discussion
The results of our study indicated a tendency for
progressively decreased β-cell function and progressively increased
HOMA-IR values from the NGT to the IGT to the GDM group. Our
findings are similar to those previously reported by Su et
al(16). Furthermore, in
accordance with the results of previous studies, we also observed
an association between increased birth weight and increasing
maternal levels of plasma glucose (17,18).
Our findings were also similar to those reported by
Das et al(15), which
demonstrated that the subset of pregnant women who presented with
GDM had significantly higher HOMA-IR values and similar HOMA-βCFI
values compared to pregnant women with NGT. Indeed, high IR is
considered a leading risk factor for GDM (19). Our results were in accordance with
those of previous studies (20,21) on
average HOMA-IS and HOMA-IR values of IGT, indicating that IGT
represents an intermediate phenotype between NGT and GDM.
In the present study, a 50-g oral GCT was conducted
as part of a standard screening for GDM, as GCT is feasible, easy,
user-friendly, cost-effective and convenient for screening purposes
(22).
The patients exhibited a delayed insulin peak, which
suggested that pregnant women with abnormal glucose metabolism
during pregnancy have a decreased IS (Fig. 2). However, there were no differences
in IR and IS among the groups. One possible explanation for this
observation is that HOMA-IR and HOMA-IS are not the most sensitive
evaluation methods. Although HOMA-IR is considered to be a measure
of overall IR in pregnancy, it may better reflect liver function
rather than peripheral IR (23).
In accordance with the results of a previous study
(24), our results demonstrated
that women with GDM may be at increased risk for cesarean delivery.
The cesarean section rates of the GDM, IGT and NGT groups indicated
an inverse association between decreasing cesarean section rates
and increasing HOMA-βCFI values. The high rate of cesarean section
in the GDM group may be due to the fact that women with GDM were at
higher risk of birth trauma, PPH and fetal distress, whereas
cesarean section was less likely to be considered in NGT. Another
reason may be the increased neonatal birth weight in women with
GDM. The mean birth weight in the GDM, IGT and NGT groups was
3.613±0.658, 3.476±0.434 and 3.335±0.529 kg, respectively. In our
study, the differences among the groups were not statistically
significant, similar to previously published data demonstrating
that the high glucose levels in the maternal circulation are
associated with increased birth weight (25,26).
The absence of significant differences in the incidence of adverse
obstetric outcomes among the groups may be partly attributed to
intervention for GDM, as the results of a previous study which
demonstrated that timely intervention for GDM significantly reduced
the rate of certain adverse obstetrical outcomes (27).
Fetal growth is a complex process affected by
genetics, maternal factors, uterine environment and maternal and
fetal hormones. The interference procedures including dietary
advice and blood glucose monitoring applied to the GDM group in our
study may explain the lack of significant differences in birth
weight among the groups. In addition, since the NGT group comprised
GCT-positive women with normal OGTT values, there was lack of a
GCT-negative screening for GDM to serve as the control group. Women
with GDM exhibit a higher risk of subsequent development of type 2
diabetes; therefore, lifestyle modification is encouraged, along
with regular screening for diabetes (28).
The exclusion of pregnant women with risk factors
affecting glucose metabolism prior to and during pregnancy may
represent an advantage of this study, since it reduced the possible
interference by factors not directly associated with pregnancy.
This prospective study investigated pre-pregnancy and pre-delivery
BMI in the GDM, IGT and NGT groups. The use of HOMA-IR is unlikely
to lead to erroneous conclusions, since the HOMA-IR value has been
found to correlate well with an IS test derived from the
insulin-assisted intravenous glucose tolerance test (29).
There were several limitations to the present study
that require consideration. This study, by design, was limited to
an Asian/Chinese population. The findings may not be extrapolated
to non-Asian populations, due to the well-recognized divergence in
genetic background and socioeconomic differences. Further studies
including other populations are required to investigate whether
these findings have a general implication. Furthermore, since the
women with NGT in this study exhibited abnormal GCT values, the
difference between women with NGT and those with GDM may have been
underestimated, since a recent study reported that women without
GDM and elevated 50-g GCT values exhibited a higher risk of
perinatal morbidity (30).
In conclusion, the prevalence of GDM in our cohort
attending a medical centre in China was relatively high (18.6%).
Furthermore, we observed that β-cell function exhibited a tendency
for progressive decrease and HOMA-IR a tendency for progressive
increase from the NGT and IGT groups to the GDM group. As regards
adverse pregnancy outcomes, the rates of PIH, fetal distress,
neonatal hyperbilirubinemia, preterm delivery, macrosomia and
cesarean delivery appear to be more closely associated with the
glucose and insulin levels of OGTT. Further investigations are
required to elucidate the association between impaired β-cell
function and its clinical significance in women with GDM.
Acknowledgements
This study was supported by a grant from the Jiangsu
Provincial Department of Education (09kjb320004) and the Jiangsu
Provincial Department of Health (JSH-2010-0004).
References
|
1
|
Casey BM, Lucas MJ, McIntire DD and Leveno
KJ: Pregnancy outcomes in women with gestational diabetes compared
with the general obstetric population. Obstet Gynecol. 90:869–873.
1997. View Article : Google Scholar : PubMed/NCBI
|
|
2
|
Gokcel A, Bagis T, Killicadag EB, Tarim E
and Guvener N: Comparison of the criteria for gestational diabetes
mellitus by NDDG and Carpenter and Coustan, and the outcomes of
pregnancy. J Endocrinol Invest. 25:357–361. 2002. View Article : Google Scholar : PubMed/NCBI
|
|
3
|
Yogev Y and Visser GH: Obesity,
gestational diabetes and pregnancy outcome. Semin Fetal Neonatal
Med. 14:77–84. 2009. View Article : Google Scholar : PubMed/NCBI
|
|
4
|
Kjos SL and Buchanan TA: Gestational
diabetes mellitus. N Engl J Med. 341:1749–1756. 1999. View Article : Google Scholar : PubMed/NCBI
|
|
5
|
Thompson DM, Dansereau J, Creed M and
Ridell L: Tight glucose control results in normal perinatal outcome
in 150 patients with gestational diabetes. Obstet Gynecol.
83:362–366. 1994.PubMed/NCBI
|
|
6
|
Homko C, Sivan E, Chen X, Reece EA and
Boden G: Insulin secretion during and after pregnancy in patients
with gestational diabetes mellitus. J Clin Endocrinol Metab.
86:568–573. 2001.PubMed/NCBI
|
|
7
|
Kautzky-Willer A, Prager R, Waldhausl W,
Pacini G, Thomaseth K, Wagner OF, Ulm M, Streli C and Ludvik B:
Pronounced insulin resistance and inadequate beta-cell secretion
characterize lean gestational diabetes during and after pregnancy.
Diabetes Care. 20:1717–1723. 1997. View Article : Google Scholar : PubMed/NCBI
|
|
8
|
Higgins M and Mc Auliffe F: A review of
maternal and fetal growth factors in diabetic pregnancy. Curr
Diabetes Rev. 6:116–125. 2010. View Article : Google Scholar : PubMed/NCBI
|
|
9
|
Berkowitz GS, Lapinski RH, Wein R and Lee
D: Race/ethnicity and other risk factors for gestational diabetes.
Am J Epidemiol. 135:965–973. 1992.PubMed/NCBI
|
|
10
|
Dabelea D, Snell-Bergeon JK, Hartsfield
CL, Bischoff KJ, Hamman RF and McDuffie RS: Increasing prevalence
of gestational diabetes mellitus (GDM) over time and by birth
cohort: Kaiser Permanente of Colorado GDM Screening Program.
Diabetes Care. 28:579–584. 2005. View Article : Google Scholar : PubMed/NCBI
|
|
11
|
Lawrence JM, Contreras R, Chen W and Sacks
DA: Trends in the prevalence of preexisting diabetes and
gestational diabetes mellitus among a racially/ethnically diverse
population of pregnant women, 1999–2005. Diabetes Care. 31:899–904.
2008.PubMed/NCBI
|
|
12
|
Araneta MR, Wingard DL and Barrett-Connor
E: Type 2 diabetes and metabolic syndrome in Filipina-American
women: a high-risk nonobese population. Diabetes Care. 25:494–499.
2002. View Article : Google Scholar : PubMed/NCBI
|
|
13
|
Yue J, Xie X, Lin ZQ, Gou WL and Di W:
Gestational diabetes mellitus. Obstetrics and Gynecology. Yue J:
7th edition. People's Medical Publishing House; Beijing: pp.
150–154. 2007
|
|
14
|
Matthews DR, Hosker JP, Rudenski AS,
Naylor BA, Treacher DF and Turner RC: Homeostasis model assessment:
insulin resistance and beta-cell function from fasting plasma
glucose and insulin concentrations in man. Diabetologia.
28:412–419. 1985. View Article : Google Scholar : PubMed/NCBI
|
|
15
|
Das S, Behera MK, Misra S and Baliarsihna
AK: Beta-cell function and insulin resistance in pregnancy and
their relation to fetal development. Metab Syndr Relat Disord.
8:25–32. 2009. View Article : Google Scholar : PubMed/NCBI
|
|
16
|
Su JB, Wang XQ, Chen JF, Wu G, Jin Y, Xu
F, Wang XH and Liu YT: Glycemic variability in gestational diabetes
mellitus and its association with β cell function. Endocrine.
43:370–375. 2013.
|
|
17
|
Metzger BE, Lowe LP, Dyer AR, et al; HAPO
Study Cooperative Research Group. Hyperglycemia and adverse
pregnancy outcomes. N Engl J Med. 358:1991–2002. 2008. View Article : Google Scholar
|
|
18
|
Sermer M, Naylor CD, Farine D, Kenshole
AB, Ritchie JW, Gare DJ, Cohen HR, McArthur K, Holzapfel S and
Biringer A: The Toronto Tri-Hospital Gestational Diabetes Project.
A preliminary review. Diabetes Care. 21(Suppl 2): B33–B42.
1998.PubMed/NCBI
|
|
19
|
Leinonen A, Hiilesmaa V, Andersen H,
Teramo K and Kaaja R: Diurnal blood glucose profiles in women with
gestational diabetes with or without hypertension. Diabet Med.
21:1181–1184. 2004. View Article : Google Scholar : PubMed/NCBI
|
|
20
|
Ergin T, Lembet A, Duran H, Kuscu E, Bagis
T, Saygili E and Batioglu S: Does insulin secretion in patients
with one abnormal glucose tolerance test value mimic gestational
diabetes mellitus? Am J Obstet Gynecol. 186:204–209. 2002.
View Article : Google Scholar : PubMed/NCBI
|
|
21
|
Di Cianni G, Seghieri G, Lencioni C,
Cuccuru I, Anichini R, De Bellis A, Ghio A, Tesi F, Volpe L and Del
Prato S: Normal glucose tolerance and gestational diabetes
mellitus: what is in between? Diabetes Care. 30:1783–1788.
2007.PubMed/NCBI
|
|
22
|
Shrestha A and Chawla CD: The glucose
challenge test for screening of gestational diabetes. Kathmandu
Univ Med J (KUMJ). 9:22–25. 2011.PubMed/NCBI
|
|
23
|
Kim HS, Chang KH, Yang JI, Yang SC, Lee HJ
and Ryu HS: Clinical outcomes of pregnancy with one elevated
glucose tolerance test value. Int J Gynaecol Obstet. 78:131–138.
2002. View Article : Google Scholar : PubMed/NCBI
|
|
24
|
Gorgal R, Goncalves E, Barros M, Namora G,
Magalhaes A, Rodrigues T and Montenegro N: Gestational diabetes
mellitus: a risk factor for non-elective cesarean section. J Obstet
Gynaecol Res. 38:154–159. 2012. View Article : Google Scholar : PubMed/NCBI
|
|
25
|
Segregur J, Bukovic D, Milinovic D,
Oreskovic S, Pavelic J, Zupic T, Persec J and Pavic M: Fetal
macrosomia in pregnant women with gestational diabetes. Coll
Antropol. 33:1121–1127. 2009.PubMed/NCBI
|
|
26
|
Lindsay RS, Westgate JA, Beattie J,
Pattison NS, Gamble G, Mildenhall LF, Breier BH and Johnstone FD:
Inverse changes in fetal insulin-like growth factor (IGF)-1 and IGF
binding protein-1 in association with higher birth weight in
maternal diabetes. Clin Endocrinol (Oxf). 66:322–328. 2007.
View Article : Google Scholar : PubMed/NCBI
|
|
27
|
Karakash SD and Einstein FH: Diabetes in
pregnancy: glycemia control guidelines and rationale. Curr Opin
Endocrinol Diabetes Obes. 18:99–103. 2011. View Article : Google Scholar : PubMed/NCBI
|
|
28
|
Thanasuan S and Borriboonhirunsarn D:
Incidence of gestational diabetes mellitus among pregnant women
with one abnormal value of oral glucose tolerance test. J Med Assoc
Thai. 89:1109–1114. 2006.PubMed/NCBI
|
|
29
|
Serlin DC and Lash RW: Diagnosis and
management of gestational diabetes mellitus. Am Fam Physician.
80:57–62. 2009.
|
|
30
|
Yee LM, Cheng YW, Liddell J,
Block-Kurbisch I and Caughey AB: 50-gram glucose challenge test: is
it indicative of outcomes in women without gestational diabetes
mellitus? J Matern Fetal Neonatal Med. 24:1102–1106. 2011.
View Article : Google Scholar : PubMed/NCBI
|