Introduction
Retinoblastoma (RB) is the most common childhood
malignancy, with a relative incidence of 1/15,000–20,000 live
births annually. The inactivation of the RB gene is
considered as the initiating event in this disease (1). Delayed diagnosis and treatment
contribute to the exacerbation and migration of RB (2). Thus, a timely and accurate diagnosis
is required for earlier treatment, which may increase the cure and
survival rates.
Imaging techniques are widely used for the diagnosis
of RB and images of the tumor tissue may confirm the diagnosis of
RB via ophthalmoscopy, ultrasonography, computed tomography and
magnetic resonance imaging (2). As
a diagnostic marker for small-cell lung cancer and neuroblastoma,
neuron-specific enolase (NSE) was found to be significantly
elevated in the serum of RB patients and is considered to be a
clinical diagnostic indicator (3–6).
MicroRNAs (miRNAs) are a class of mature non-coding
single-strand RNAs with a length of 22 nucleotides, which play
significant roles in multiple physiological and pathological
processes, particularly in tumor development and exacerbation
(7,8). An increasing number of studies
demonstrate that miRNA expression profiles may be specific to
certain types of cancer and tumor-derived miRNAs may be stably
detected in the plasma or serum. These findings highlight the
potential of circulating miRNAs as biomarkers for the diagnosis of
cancer (9–12).
miRNA (miR)-let-7e, a member of the let-7 family,
was found to be highly associated with the development and
progression of RB. A low level of miR-let-7e contributes to the
overexpression of the high-mobility group A1 (HMG A1) and
high-mobility group A2 (HMG A2) proteins in RB cells, which are
considered as promoters of RB (13). The downregulation of the tumor
suppressor miR-let-7e was identified as a biomarker in lung and
gastric cancers, uterine leiomyoma and pituitary adenomas (14–17).
miR-21 was the first miRNA identified as a diagnostic biomarker,
due to its elevated levels in diffuse large B-cell lymphoma
(18). miR-320 was suggested to act
as a tumor suppressor by inhibiting β-catenin expression via
binding to the 3′-untranslated region of β-catenin mRNA in prostate
cancer (19). However, it was
previously demonstrated that the levels of miR-320 and miR-let-7e
were significantly higher in RB compared to those in the normal
human retina, according to the results of a miRNA microarray assay
(20). Taking into consideration
the results of that microarray assay and the fact that miR-21 has
been investigated in several types of cancer as a biomarker
(21–24), we hypothesized that miR-let-7e,
miR-21 and miR-320 may serve as non-invasive circulating biomarkers
for the diagnosis of RB. The expression of these 3 plasma miRNAs
and the serum NSE levels were measured in RB patients and control
subjects matched to the patients by age and gender.
Materials and methods
Patients and samples
Blood samples were collected from consenting
individuals according to protocols approved by the Institutional
Review Board of the General Hospital of the Chinese People’s Armed
Police Forces (Beijing, China). Between March, 2012 and June, 2013,
a total of 65 patients with RB who had not received any prior
treatment and 65 healthy age- and gender-matched controls were
enrolled in this study. All the samples were collected once
informed consent was obtained from the patients or the legal
guardian.
Sample processing and total RNA
extraction
Cell-free plasma was isolated via a two-step
protocol (2,500 rpm at room temperature for 10 min and 14,000 × g
at 4°C for 10 min) within 2 h after collection to prevent the
contamination of cellular nucleic acids. The resulting plasma was
transferred to new tubes and stored at −80°C. Total RNA was
extracted from 300 μl plasma with the mirVana™ PARIS™ kit (Ambion,
Inc., Foster City, CA, USA) according to the manufacturer’s
instructions and eluted with 50 μl elution solution pre-heated at
95°C. The RNA quality and concentration was assessed with a K5500
spectrophotometer (Beijing Kaiao Technology Development Co., Ltd.,
Beijing, China). The concentration of the RNA extracted from plasma
was 3.9–18.3 ng/μl.
Quantitative reverse
transcription-polymerase chain reaction (qRT-PCR)
Total RNA was polyadenylated by poly(A) polymerase
(New England BioLabs, Inc., Ipswich, MA, USA) and
reverse-transcribed to cDNA with the Promega reverse transcription
kit (Promega, Madison, WI, USA) according to the manufacturer’s
instructions. The reaction mixture for reverse transcription
contained 8 μl RNA extract, 2 μl reverse transcription primer (1
μg/μl), 8 μl Improm-II™ 5X reaction buffer, 4.8 μl MgCl2
(25 mmol/l), 2 μl dNTPs (10 and 2.5 mmol/l each), 1 μl Recombinant
RNasin® Ribonuclease inhibitor (40 U/μl), 2 μl
ImProm-II™ Reverse Transcriptase (15 U/μl) and 12.2 μl
nuclease-free water to a final volume of 40 μl. The reaction
mixtures were incubated at 70°C for 15 min, at 42°C for 60 sec and
at 25°C for 5 min and the products were stored at −20°C.
qRT-PCR was performed in a 20-μl reaction containing
10 μl 2X QuantiTect SYBR-Green PCR Master mix (Qiagen, Hilden,
Germany), 1 μl gene-specific primers (20 mmol/l), 1 μl cDNA
solution and 8 μl nuclease-free water. The reaction mixtures were
incubated at 95°C for 15 min, followed by 40 cycles at 95°C for 10
sec, at 60°C for 30 sec and at 72°C for 30 sec, running on a
Mx3000P™ thermocycler (Agilent Technologies, Inc., Santa Clara, CA,
USA). The primer sequences are presented in Table I.
 | Table IPrimers used for qRT-PCR. |
Table I
Primers used for qRT-PCR.
| Primers | Sequences
(5′-3′) |
|---|
| RT |
GCGAGCACAGAATTAATACGACTC
ACTATAGG(T)18VN |
| U6 |
| Forward |
CGCTTCGGCAGCACATATACTA |
| Reverse |
CGCTTCACGAATTTGCGTGTCA |
| miR-320 |
AAAAGCTGGGTTGAGAGGGCGA |
| miR-let-7e |
TGAGGTAGGAGGTTGTATAGTT |
| miR-21 |
TAGCTTATCAGACTGATGTTGA |
| 3′ universal |
GCGAGCACAGAATTAATACGAC |
Statistical analysis
The qRT-PCR data were analyzed by MxPro software
(Agilent Technologies, Inc.) and the normalization was performed
with U6 small nuclear RNA. The of miRNA contents were calculated
using the formula ΔCtmiRNA = CtmiRNA -
CtU6. A two-sided χ2 test and independent
t-tests were used to compare the differences by gender, age,
laterality and NSE levels between RB patients and healthy controls.
The Mann-Whitney U test was used for the analyses of the expression
of different miRNAs. Receiver operating characteristic (ROC) curves
were drawn and the areas under the ROC curves (AUCs) were measured
to assess the specificity and sensitivity of circulating miRNAs as
diagnostic biomarkers for RB. P<0.05 was considered to indicate
a statistically significant difference. Statistical analyses were
performed with SPSS 17.0 software (SPSS, Inc., Chicago, IL, USA),
the ROC curves were generated by MedCalc 12.7.0.0 (http://www.medcale.org; accessed July 10, 2013) and
Adobe® Photoshop® CS6 (http://www.adobe.com, accessed February 02, 2013) and
the graphs were generated by GraphPad 5.0 software (GraphPad
software Inc., La Jolla, CA, USA).
Results
Patient characteristics
The clinical characteristics of 65 patients
diagnosed with RB were recorded and 65 healthy subjects were
recruited as controls. The individual characteristics, including
gender, age, laterality and clinical stage are summarized in
Table II. The NSE levels were
significantly higher in the patient group (27.4±7.0 ng/mL) compared
to those in the control group (10.6±3.5 ng/mL). There were no
significant differences between the individual characteristics of
the patients and those of the control subjects.
| Table IIClinical characteristics of the
retinoblastoma patients and healthy control subjects. |
Table II
Clinical characteristics of the
retinoblastoma patients and healthy control subjects.
| Characteristics | Cases (n=65) | Controls (n=65) | P-value |
|---|
| Average age, months
(mean ± SD) | 24.6±16.5 | 27.92±12.03 | 0.196a |
| Gender, n (%) | | | 1.000b |
| Male | 39 (60.0) | 31 (47.7) | |
| Female | 26 (40.0) | 34 (52.3) | |
| Laterality, n
(%) | | | |
| Unilateral | 45 (69.2) | N/A | |
| Bilateral | 20 (30.8) | N/A | |
| IIRC clinical stage,
n | | | |
| Group A-C | 12 | N/A | |
| Group D-E | 53 | N/A | |
| NSE level, ng/mL
(mean ± SD) | 27.4±7.0 | 10.6±3.5 | <0.0001a |
Initiatory screening of plasma miRNAs for
the detection of RB
We measured the different miRNA contents in 30
plasma samples (15 patients and 15 healthy controls). The ΔCt of
miR-320 in patient plasma was higher compared to that in the
control samples. Similar results were found for miR-let-7e and
miR-21 (Fig. 1).
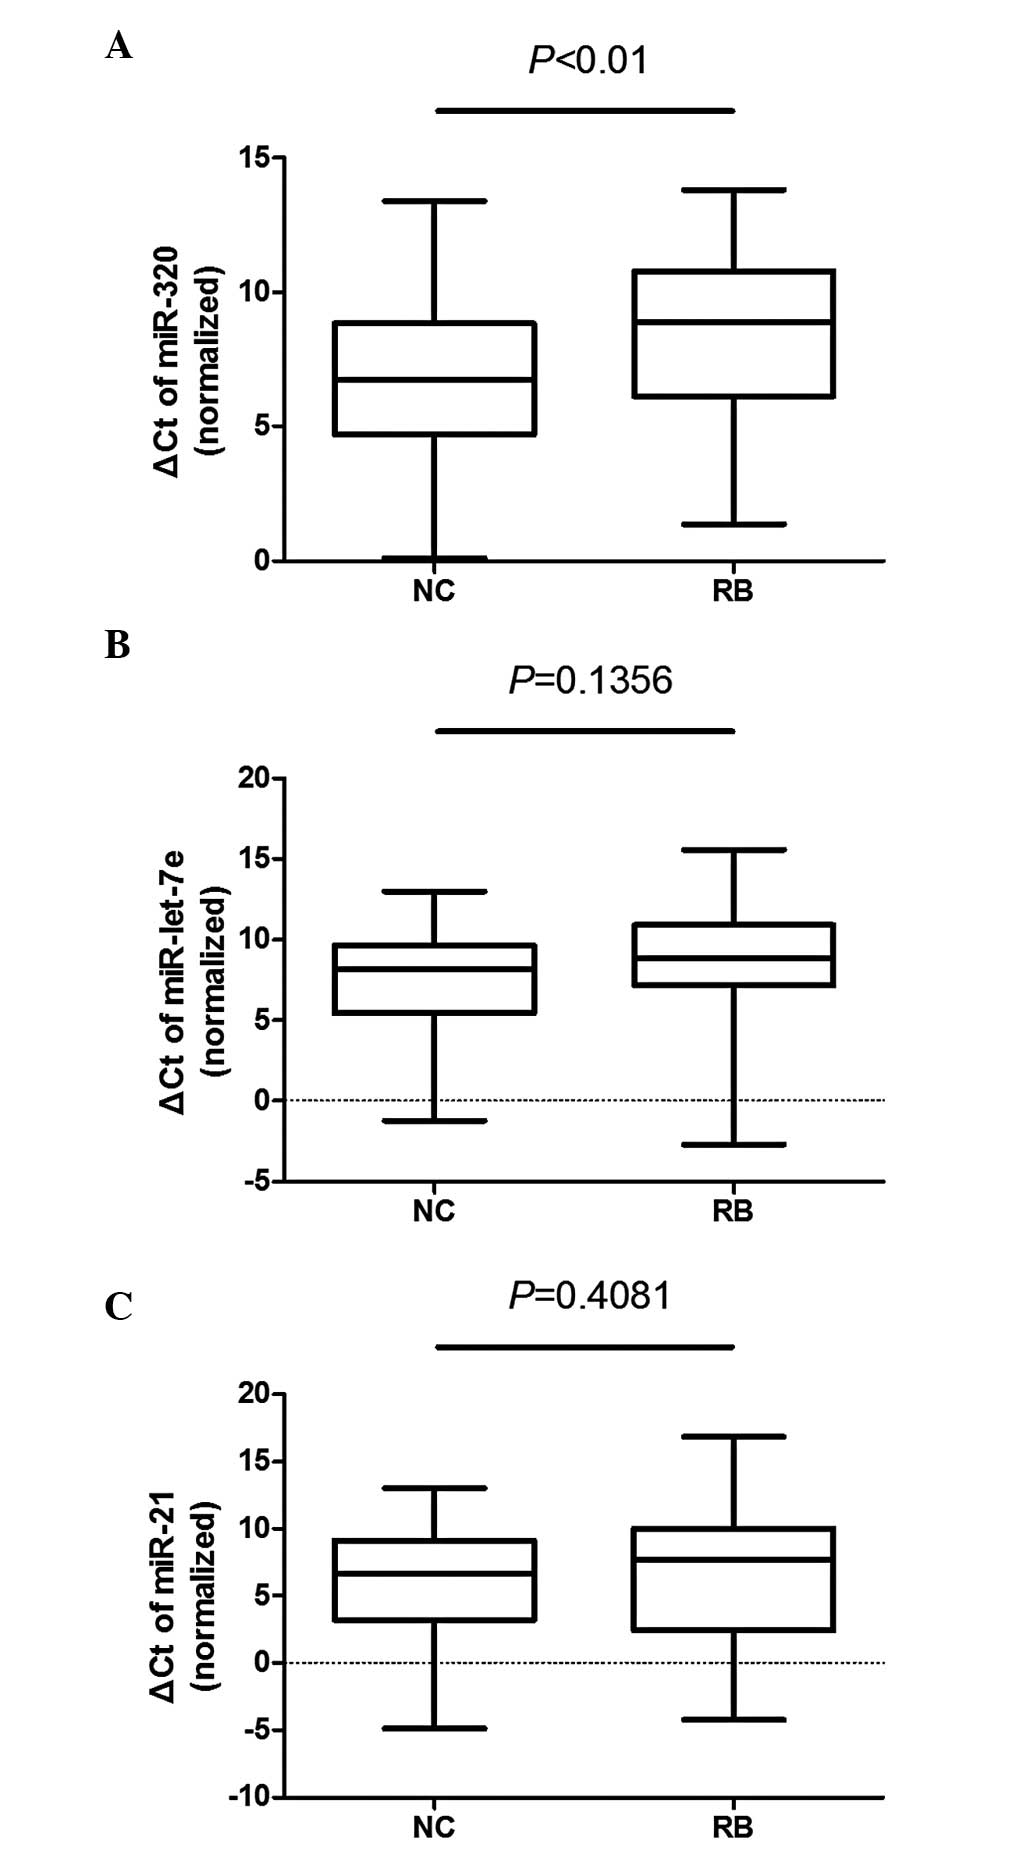
Validation of miR-320, miR-let-7e and
miR-21 in a larger sample size
The content of miR-320, miR-let-7e and miR-21 was
measured in 100 plasma samples (50 patients and 50 healthy
controls). The ΔCt of miR-320 was significantly different between
the plasma samples of patients and controls (P<0.01), whereas
the differences in miR-let-7e (P=0.1356) and miR-21 (P=0.4081) were
not as significant (Fig. 2).
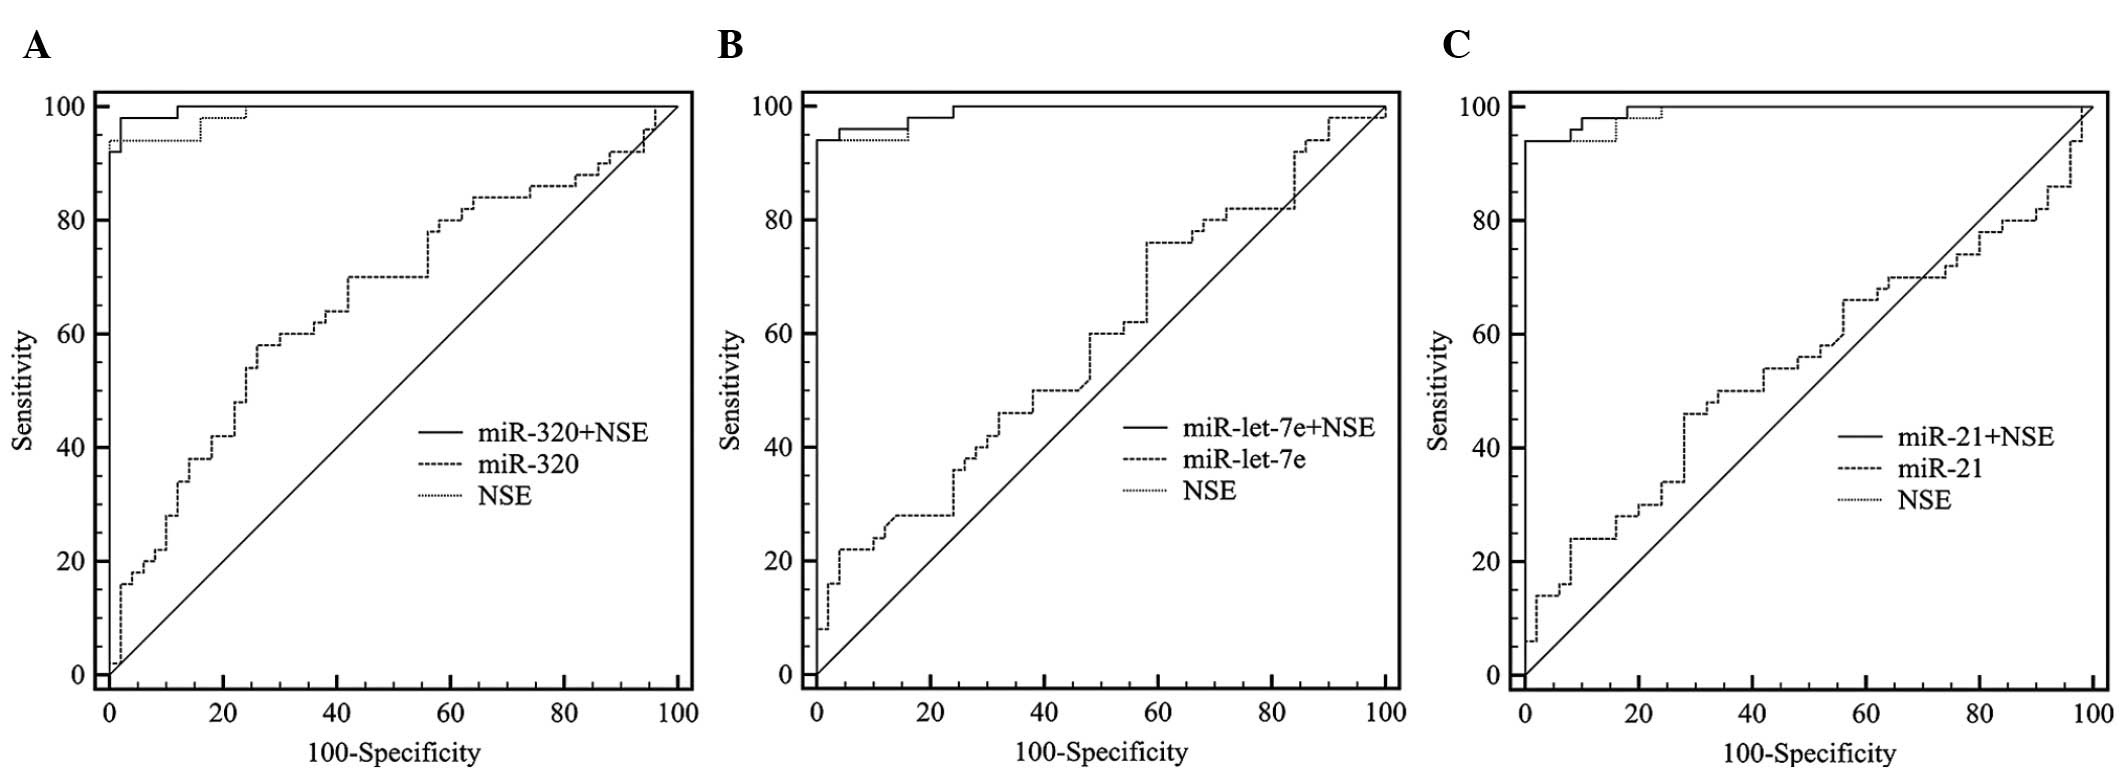
Diagnostic potential of plasma miRNA and
NSE in RB patients
ROC curves were used to assess the diagnostic
potential of miR-320, miR-let-7e and miR-21 and AUCs indicated its
accuracy and reliability. The AUC of NSE reached 0.989 with a
cut-off of 15.9. The AUCs of the 3 miRNAs did not reach 70%
(Table III) and the ROC curves
for the combined classifiers (NSE and miRNAs) were significantly
improved compared to those for miRNAs alone. However, the
performance of the combined classifier was not significantly
improved compared to NSE alone (Fig.
3).
| Table IIIReceiver operating characteristic
curve are shown for the 3 miRNAs detected in the plasma samples and
their combinations with NSE. |
Table III
Receiver operating characteristic
curve are shown for the 3 miRNAs detected in the plasma samples and
their combinations with NSE.
| miRNAs, NSE and
combinations | AUC | 95% CI | Sensitivity (%) | Specificity (%) | P-value |
|---|
| miR-320 | 0.660 | 0.558–0.752 | 58 | 74 | 0.0036 |
| miR-let-7e | 0.587 | 0.484–0.684 | 76 | 42 | 0.1280 |
| miR-21 | 0.548 | 0.446–0.648 | 46 | 72 | 0.4100 |
| NSE | 0.989 | 0.944–1.000 | 94 | 100 | <0.0001 |
| miR-320 and NSE | 0.996 | 0.957–1.000 | 98 | 98 | <0.0001 |
| miR-let-7e and
NSE | 0.991 | 0.948–1.000 | 94 | 100 | <0.0001 |
| miR-21 and NSE | 0.993 | 0.950–1.000 | 94 | 100 | <0.0001 |
Discussion
NSE is one of the main diagnostic indicators in the
earlier stages of RB. In order to test its accuracy and
sensitivity, several clinical characteristics were compared between
the patients and healthy controls. Only NSE levels presented a
significant difference between cases and controls, whereas
individual characteristics, such as age and gender, were similar.
Of the 65 patients, >80% were at IIRC clinical stage D-E via NSE
level measurement, which indicated that the NSE level was not
superior of RB detection at a very early stage (Table II).
miR-320, miR-let-7e and miR-21 were found to be
downregulated in the patient group (Fig. 1) and the plasma levels of these 3
miRNAs were also found to be low when the sample size was expanded
to 100 subjects (Fig. 2), with the
miR-320 level being significantly lower compared to that in normal
subjects. The ROC curves for the miRNAs revealed a weaker
diagnostic performance for each miRNA alone, although the P-value
was of some value for the diagnosis of RB. The combined classifiers
also demonstrated the unreliability. However, an elevation of
0.2–0.7% significantly lowers the inaccuracy and possibility of
misdiagnosis, with a diagnostic value of 98.9%. The plasma miR-320
exhibited the highest diagnostic value among the 3 investigated
miRNAs (P<0.0001: AUC for combined classifier with NSE, 99.6%)
and may be considered as a novel plasma biomarker for the diagnosis
of RB.
It was reported that a delayed diagnosis of 6 months
of RB may increase the mortality by 70% (25); therefore, a biomarker for RB
detection at an earlier stage may enable treatment prior to
exacerbation, with a lower risk and a higher cure rate. The
stability and accuracy of tissue biomarkers are highly associated
with the mechanisms underlying tumor development and growth;
however, the chances of obtaining a tissue sample when there is no
evidence of cancer are limited. Therefore, biomarkers in body
fluids are crucial for the early diagnosis of cancer and biomarkers
in the serum and plasma are increasingly investigated as diagnostic
markers. The NSE level was found to be higher in the serum of RB
patients compared to those in control subjects and has become one
of the most widely used diagnostic tools for the early diagnosis of
RB. The accuracy, sensitivity and reliability of NSE have been
extensively investigated based on clinical data (26–28).
Serum and plasma miRNAs are considered as potential
biomarkers in several types of cancer; however, their performance
is not as satisfactory as that of traditional markers, such as NSE,
for RB. In the present study, the plasma miR-320, miR-let-7e and
miR-21 levels were found to be lower in RB patients compared to
those in healthy control subjects (Fig.
2), whereas their expression in RB tissue was reported to be
significantly higher (29). AUC,
sensitivity and specificity were not found to be adequate for an
accurate prediction on their own. However, combined classifiers
with NSE may improve the diagnostic sensitivity and specificity of
individual biomarkers to a certain extent, provided that the plasma
miRNA levels are of value for the diagnosis of RB. However, further
studies are required to assess the reliability and accuracy of
miR-320, miR-let-7e and miR-21 as plasma biomarkers of RB.
Acknowledgements
This study was supported by the General Hospital of
the Chinese People’s Armed Police Forces (grant no. WZ2010008).
References
|
1
|
Kivelä T: The epidemiological challenge of
the most frequent eye cancer: retinoblastoma, an issue of birth and
death. Br J Ophthalmol. 93:1129–1131. 2009.PubMed/NCBI
|
|
2
|
Mehta M, Sethi S, Pushker N, Kashyap S,
Sen S, Bajaj MS and Ghose S: Retinoblastoma. Singapore Med J.
53:128–135. 2012.
|
|
3
|
Oremek GM, Sauer-Eppel H and Bruzdziak TH:
Value of tumour and inflammatory markers in lung cancer. Anticancer
Res. 27:1911–1915. 2007.PubMed/NCBI
|
|
4
|
Hervás Benito I, Rivas Sánchez A, Bello
Arques P, et al: Value of 123I-MIBG scanning, neuron-specific
enolase and serum ferritin in the diagnosis and follow-up of
patients with neuroblastoma. Rev Esp Med Nucl. 20:369–376. 2001.(In
Spanish).
|
|
5
|
Wu Z, Mao Y, Yang H, Pan S and Chen Z: The
determination of neuron-specific enolase of serum in the diagnosis
and supervision of retinoblastoma. Chin J Ophthalmol. 34:117–120.
1998.(In Chinese).
|
|
6
|
Wu Z, Yang H, Pan S and Chen Z:
Electrophoretic determination of aqueous and serum neuron-specific
enolase in the diagnosis of retinoblastoma. Eye science. 13:12–16.
1997.PubMed/NCBI
|
|
7
|
Kloosterman WP and Plasterk RH: The
diverse functions of microRNAs in animal development and disease.
Dev Cell. 11:441–450. 2006. View Article : Google Scholar : PubMed/NCBI
|
|
8
|
Stefani G and Slack FJ: Small non-coding
RNAs in animal development. Nat Rev Mol Cell Biol. 9:219–230. 2008.
View Article : Google Scholar : PubMed/NCBI
|
|
9
|
Jiang J, Lee EJ, Gusev Y and Schmittgen
TD: Real-time expression profiling of microRNA precursors in human
cancer cell lines. Nucleic Acids Res. 33:5394–5403. 2005.
View Article : Google Scholar : PubMed/NCBI
|
|
10
|
Chen X, Ba Y, Ma L, et al:
Characterization of microRNAs in serum: a novel class of biomarkers
for diagnosis of cancer and other diseases. Cell Res. 18:997–1006.
2008. View Article : Google Scholar : PubMed/NCBI
|
|
11
|
Calin GA and Croce CM: MicroRNA signatures
in human cancers. Nat Rev Cancer. 6:857–866. 2006. View Article : Google Scholar : PubMed/NCBI
|
|
12
|
Gilad S, Meiri E, Yogev Y, et al: Serum
microRNAs are promising novel biomarkers. PLoS One. 3:e31482008.
View Article : Google Scholar : PubMed/NCBI
|
|
13
|
Mu G, Liu H, Zhou F, Xu X, Jiang H, Wang Y
and Qu Y: Correlation of overexpression of HMGA1 and HMGA2 with
poor tumor differentiation, invasion, and proliferation associated
with let-7 down-regulation in retinoblastomas. Hum Pathol.
41:493–502. 2010. View Article : Google Scholar : PubMed/NCBI
|
|
14
|
Motoyama K, Inoue H, Nakamura Y, Uetake H,
Sugihara K and Mori M: Clinical significance of high mobility group
A2 in human gastric cancer and its relationship to let-7 microRNA
family. Clin Cancer Res. 14:2334–2340. 2008. View Article : Google Scholar : PubMed/NCBI
|
|
15
|
Qian ZR, Asa SL, Siomi H, et al:
Overexpression of HMGA2 relates to reduction of the let-7 and its
relationship to clinicopathological features in pituitary adenomas.
Mod Pathol. 22:431–441. 2009. View Article : Google Scholar : PubMed/NCBI
|
|
16
|
Rahman MM, Qian ZR, Wang EL, et al:
Frequent overexpression of HMGA1 and 2 in gastroenteropancreatic
neuroendocrine tumours and its relationship to let-7
downregulation. Br J Cancer. 100:501–510. 2009. View Article : Google Scholar : PubMed/NCBI
|
|
17
|
Takamizawa J, Konishi H, Yanagisawa K, et
al: Reduced expression of the let-7 microRNAs in human lung cancers
in association with shortened postoperative survival. Cancer Res.
64:3753–3756. 2004. View Article : Google Scholar : PubMed/NCBI
|
|
18
|
Lawrie CH, Gal S, Dunlop HM, et al:
Detection of elevated levels of tumour-associated microRNAs in
serum of patients with diffuse large B-cell lymphoma. Br J
Haematol. 141:672–675. 2008. View Article : Google Scholar : PubMed/NCBI
|
|
19
|
Hsieh IS, Chang KC, Tsai YT, et al:
MicroRNA-320 suppresses the stem cell-like characteristics of
prostate cancer cells by downregulating the Wnt/beat-catenin
signaling pathway. Carcinogenesis. 34:530–538. 2013. View Article : Google Scholar : PubMed/NCBI
|
|
20
|
Zhao JJ, Yang J, Lin J, et al:
Identification of miRNAs associated with tumorigenesis of
retinoblastoma by miRNA microarray analysis. Childs Nerv Syst.
25:13–20. 2009. View Article : Google Scholar : PubMed/NCBI
|
|
21
|
Chan SH, Wu CW, Li AF, Chi CW and Lin WC:
miR-21 microRNA expression in human gastric carcinomas and its
clinical association. Anticancer Res. 28:907–911. 2008.PubMed/NCBI
|
|
22
|
Kumar S, Keerthana R, Pazhanimuthu A and
Perumal P: Overexpression of circulating miRNA-21 and miRNA-146a in
plasma samples of breast cancer patients. Indian J Biochem Biophys.
50:210–214. 2013.PubMed/NCBI
|
|
23
|
Toiyama Y, Takahashi M, Hur K, et al:
Serum miR-21 as a diagnostic and prognostic biomarker in colorectal
cancer. J Natl Cancer Inst. 105:849–859. 2013. View Article : Google Scholar : PubMed/NCBI
|
|
24
|
Li Y, Li W, Ouyang Q, Hu S and Tang J:
Detection of lung cancer with blood microRNA-21 expression levels
in Chinese population. Oncol Lett. 2:991–994. 2011.PubMed/NCBI
|
|
25
|
Dimaras H, Kimani K, Dimba EA, Gronsdahl
P, White A, Chan HS and Gallie BL: Retinoblastoma. Lancet.
379:1436–1446. 2012. View Article : Google Scholar
|
|
26
|
Kivelä T: Neuron-specific enolase in
retinoblastoma: An immunohistochemical study. Acta Ophthalmol
(Copenh). 64:19–25. 1986.PubMed/NCBI
|
|
27
|
Nakajima T, Kato K, Kaneko A, et al: High
concentrations of enolase, alpha- and gamma-subunits, in the
aqueous humor in cases of retinoblastoma. Am J Ophthalmol.
101:102–106. 1986. View Article : Google Scholar : PubMed/NCBI
|
|
28
|
Nucci P, Tredici G, Manitto MP, et al:
Neuron-specific enolase in ophthalmology. Arch Ital Anat Embriol.
96:73–76. 1991.(In Italian).
|
|
29
|
Beta M, Venkatesan N, Vasudevan M,
Vetrivel U, Khetan V and Krishnakumar S: Identification and in
silico analysis of retinoblastoma serum microRNA profile and gene
targets towards prediction of novel serum biomarkers. Bioinform
Biol Insights. 7:21–34. 2013.PubMed/NCBI
|