Introduction
Inflammatory bowel disease (IBD), comprising
ulcerative colitis (UC) and Crohn’s disease (CD), is a chronic
intestinal disorder of unknown etiology (1–4). The
pathogenesis of IBD involves an aberrant response by the mucosal
immune system toward luminal antigens, such as dietary factors
and/or commensal microbiota in genetically susceptible individuals
(2,5–8). In
particular, the commensal microbiota is regarded as the major
environmental factor associated with IBD (5,7,9–12).
IBD is mainly localized to those intestinal areas in which the
majority of the bacteria are congregated, namely, the distal small
intestine and the colon. The commensal microbiota is essential for
the development of experimental colitis in various animal models of
IBD (6,9).
The global composition of the gut microbiota, rather
than the presence of certain pathogens, is most relevant to the
etiology and pathogenesis of IBD (dysbiosis hypothesis) (5,13–16).
Molecular approaches targeting the 16S ribosomal (r)DNA have been
used to define significant changes in the diversity and composition
of the gut microbiota in IBD (17).
For example, a marked decrease in the relative abundance of members
of the phylum Firmicutes, particularly Clostridium clusters
IV and XIV, has been reported in IBD (5,17,18).
The etiological significance of this finding is supported by a
recent study by Atarashi et al (19), which demonstrated that the genus
Clostridium plays a significant role in the induction of
colonic regulatory T cells, which play a central role in
maintaining immune homeostasis. Other reports indicated that
Faecalibacterium prausnitzii, a member of Clostridium
cluster IV, is also clinically significant (20–22).
It was previously demonstrated, using terminal
restriction fragment length polymorphism (T-RFLP) analysis, that
the fecal microbiota profile of CD patients differs from that of
healthy individuals (14,18). This difference was observed even in
patients with inactive disease (18). However, no differences associated
with the activity of the disease were detected in the fecal
microbiota profiles of CD patients with active and inactive
disease. To further investigate the fecal microbiota of CD
patients, we performed a data-mining analysis on the T-RFLP results
from the analysis of fecal samples collected at three clinical time
points (prior to induction therapy, immediately after the
achievement of remission and ≥6 weeks later, while under continuous
remission).
Materials and methods
Patients and samples
The patients and fecal samples used in this study
were the same as those used in our previous study (14). In total, 66 patients with active CD
[CD activity index (CDAI)>150 as reported by Best et al
(23)] were recruited. The
diagnosis of CD was based on clinical, endoscopic and pathological
criteria. A total of 121 healthy individuals residing close to each
center were also enrolled.
Fecal samples were collected from each patient at
three different clinical phases: i) active disease at entry (active
phase), ii) immediately after achievement of remission
(CDAI<150; remission-achieved phase) and iii) maintained
remission for ≥6 weeks (remission-maintained phase). The average
period of remission between ii) and iii) was 15.7±10.8 weeks (mean
± SD). Samples from patients with ileostomy, patients who received
surgical treatment or those who failed to achieve remission during
the course of the study were excluded.
This study was approved by the Institutional Review
Boards and the patients provided written informed consent prior to
enrolment.
DNA extraction
Each fecal sample (0.5 g) was suspended in 5 ml of
Tris-EDTA buffer (pH 7.5) and centrifuged. This washing step was
repeated 4 times. The sample was then resuspended in 5 ml of the
same buffer containing lysozyme (5 mg/ml; Sigma, St. Louis, MO,
USA), N-acetylmuramidase (0.5 mg/ml; Sigma) and
achromopeptidase (0.5 mg/ml; Sigma). The following manipulations of
DNA extraction were performed as previously described (24) and the final concentration of the DNA
sample was adjusted to 20 ng/μl.
Polymerase chain reaction (PCR)
amplification and T-RFLP analysis
The 16S rRNA gene was amplified from human fecal DNA
using the 27 forward 5′-AGAGTTTGATCCTGGCTCAG-3′ and 1492 reverse
5′-GGTTACCTTGTTACGACTT-3′ primers (25,26).
The 5′-ends of the forward primers were labeled with
6′-carboxyfluorescein, which was synthesized by Applied Biosystems
(Tokyo, Japan). The PCR amplifications of the DNA samples (10 ng of
each DNA) were performed as previously described (25,26).
The amplified 16S rDNA genes were purified using polyethylene
glycol (PEG 6000) and redissolved in 20 μl distilled water.
The restriction enzymes were selected according to
Matsumoto et al (25). The
purified PCR products (2 μl) were digested with 20 U HhaI
and MspI at 55°C for 1 h. The length of the T-RF fragments
was determined with an ABI PRISM® 3100 or ABI 3130×l
genetic analyzer (Applied Biosystems) in GeneScan mode. Standard
size markers, such as GS500 ROX and GS1000 ROX (Applied
Biosystems), were used. The fragment sizes were estimated using the
local Southern method in GeneScan 3.1 software (Applied
Biosystems). As the apparent size of identical T-RFs may vary by
1–2 bp among different gels and/or lanes of the same gel, major
T-RFs similar in size by 1–2 bp were summarized to operational
taxonomic units (OTUs). The major T-RFs were identified by computer
simulation, which was performed using a T-RFLP analysis program
(27), a phylogenetic assignment
database for T-RFLP analysis of human colonic microbiota (25) and Microbiota Profiler (InfoCom
T-RFLP Database & Analysis Software, Infocom Co., Tokyo,
Japan). T-RFs with a peak height <25 fluorescence units were
excluded from the analysis. Cluster analyses were performed using
BioNumerics software (Applied Maths, Kortrijk, Belgium) based on
the HhaI or MspI T-RFLP patterns. The distances were
calculated to determine any similarity among the samples and were
graphically represented by constructing a dendrogram. Pearson’s
similarity coefficient analysis and the unweighted pair-group
methods with arithmetic means were used to establish the type of
dendrogram.
Data mining
Data mining analysis was performed using SPSS
Clementine 14 software (IBM, Tokyo, Japan). A dividing system using
the Classification and Regression Tree (C&RT) approach, which
is the most typical method for constructing decision trees, using
the Gini coefficient (28) between
geographic districts and OTU data was applied. The records were
divided into two subsets, so that the records within each subset
were more homogeneous compared to the previous subset. C&RT is
quite flexible and allows unequal misclassification costs to be
considered, unlike other growing systems of data mining.
Results and Discussion
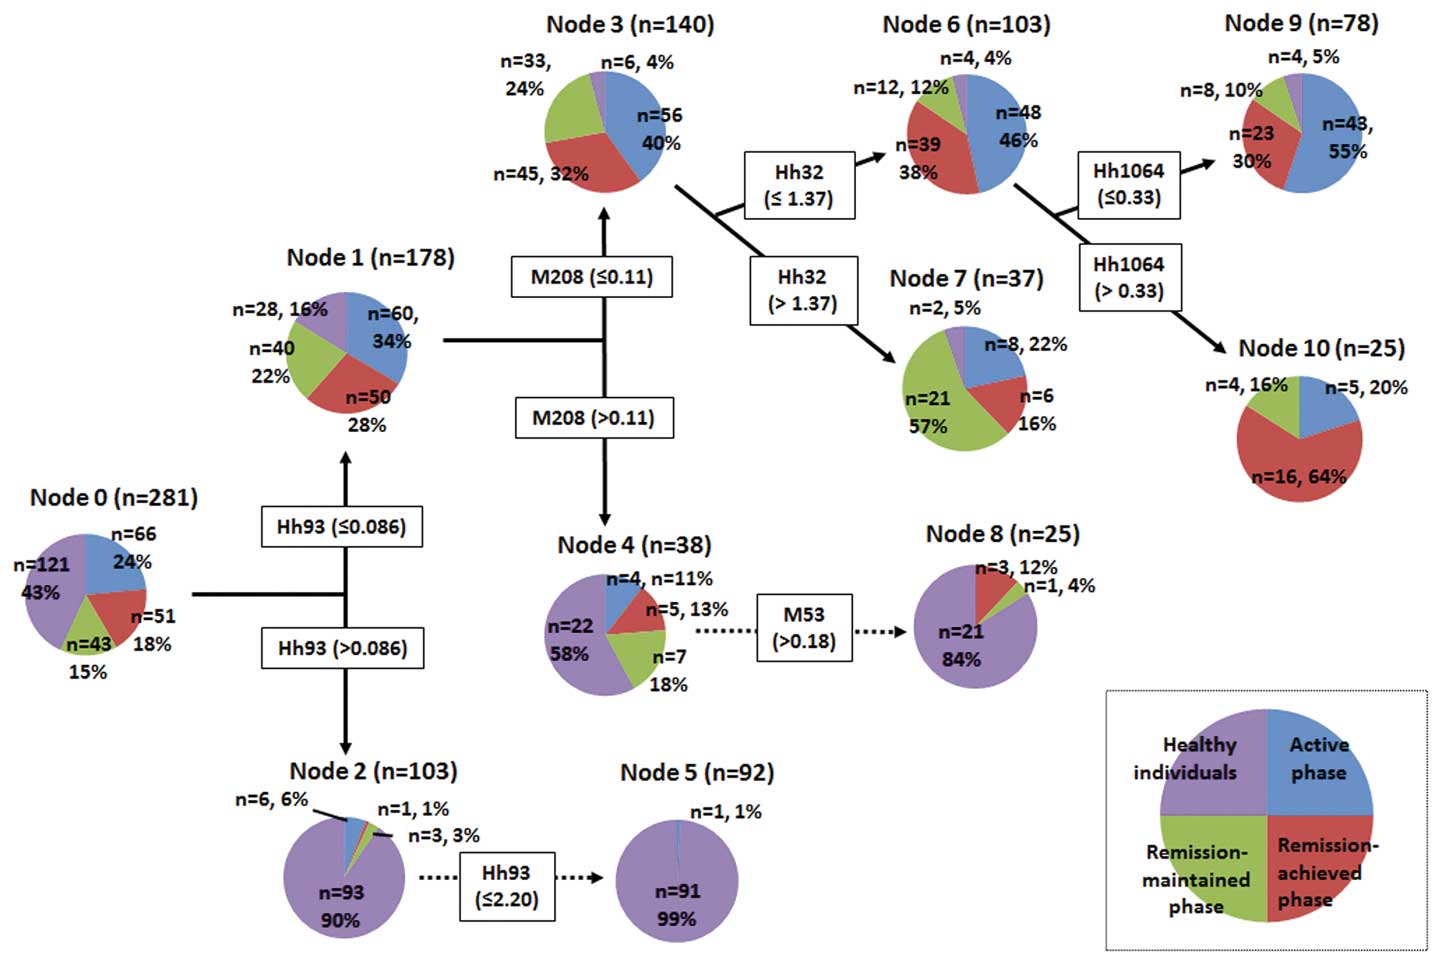
Data mining provided a decision tree as shown in
Fig. 1, which clearly identified
the various subject groups (nodes). A decision tree is a
decision-supporting pathway that forms a tree-like graph. Each OTU
was expressed as a restriction enzyme and RF length (bp), e.g., the
HhaI 32-bp OTU was abbreviated as Hh32 and the MspI
225-bp OTU was abbreviated as M225. Node-0 (the left end of the
decision tree) is referred to as the root node, which is the
starting point for tree construction and the decision tree grew
toward the right to divide the subjects. As shown in Fig. 1, Node-0 was divided into Node-1 and
Node-2 by Hh93, with a cut-off value of 0.086. This cut-off value
was calculated from Hh93 data for all the subjects using the Gini
coefficient and the C&RT method. Similar steps were repeated to
fully construct the decision tree. The details of the decision tree
and the pathway to the next node clearly indicated the species and
quantities of OTUs, which contributed to the division of the
various subject groups.
Node-1 included almost all the CD subjects and a
small number of healthy subjects. By contrast, Node-2 consisted
primarily of healthy subjects. These data indicate that Hh93 plays
a significant role in the discrimination of healthy individuals
from those with CD. Hh93 also played a role in the discrimination
of the healthy individuals of Node-2 into Node-5. The database
assignment of Hh93 included Desulfovibrio (a genus of
sulfate-reducing bacteria) and Lawsonia; however, the
pathological roles of these bacteria in human disease have not been
clearly determined.
Node-1 was divided into Node-3 and Node-4 by M208,
with a cut-off value of 0.11. Node-3 was characterized by CD
patients in all phases; however, Node-4 consisted of 22 healthy
individuals (58%) and 16 subjects with CD (42%), indicating that
the gut microbiota profile of certain CD patients resembles that of
healthy individuals. The database assignment of M208 included
Coprococcus, Roseburia, Dorea and
Blautia; however, the role of these bacteria has not been
fully elucidated. M53 (Faecalibacterium), which had a
cut-off value >0.18, led to further segregation of healthy
individuals from Node-4 into Node-8.
As shown in Fig. 1,
Node-3 included 56 CD subjects in the active, 45 in the
remission-achieved and 33 in the remission-maintained phase. Node-3
was divided into Node-6 and Node-7 based on Hh32
(Faecalibacterium, Bacteroides), with a cut-off of
1.37. Node-6 included 48 subjects in the active phase (46%) and 39
subjects in the remission-achieved phase (38%), indicating that
there are no significant differences in fecal microbiota profiles
between CD patients in the active and remission-achieved phases. By
contrast, Node-7 was characterized by 21 subjects in the
remission-maintained phase (57%), indicating that the gut
microbiota profile tends to change according to the duration of
remission maintenance. Hh32 is assigned to Faecalibacterium
and remission maintenance may stimulate the growth of this
bacterium, which exhibits strong anti-inflammatory activity
(20–22).
We previously reported the results of cluster
analyses of the gut microbiota profiles of the same samples used in
the present study (14). However,
disease-associated differences were not identified, possibly due to
the several limitations of the cluster analysis. For example, the
cluster analysis only shows some classified groups and it does not
produce clearly defined reasons for the creation of these groups.
In addition, the obtained clusters lack flexibility, meaning that a
slight modification of the data affects cluster formation.
Furthermore, data mining constructs a decision tree, which is a set
rule that predicts target variables and enables the creation of
classification trees by repeated data division. During this
process, a tree branch is formed and every branch determines the
classification criteria for the dividing data. Therefore,
exploration of a dataset by data mining enables the researcher to
predict the most significant predictor variable. Additionally, once
the decision tree is constructed, all the subsequent new records
may be run with the same data mining tree, as long as the basic
concepts of the data remain active. The main difference between
data mining and cluster analysis is the capacity for handling data
noise. Data mining skips characteristic noise and selects a series
of related fields; however, cluster processing respects all data,
without consideration of any numerical noise. Thus, in the present
study it was possible to demonstrate geographical differences in
the human gut microbiota in Japan.
In conclusion, to the best of our knowledge, this
study is the first to identify disease activity and associated
differences in the gut microbiota profiles of CD patients, which
differ from those of healthy individuals. Among the CD patients,
the gut microbiota profiles may differ according to disease
activity. These results indicate that data mining is an ideal tool
for characterizing human gut microbiota. Further investigations of
the gut microbiota profiles associated with CD may lead to improved
diagnostics and the development of novel therapeutic agents.
Acknowledgements
The authors would like to thank TechnoSuruga
Laboratory Co., Ltd., (Sizuoka, Japan) for their technical
support.
References
|
1
|
Mayer L: Evolving paradigms in the
pathogenesis of IBD. J Gastroenterol. 45:9–16. 2010. View Article : Google Scholar
|
|
2
|
Podolsky DK: Inflammatory bowel disease. N
Engl J Med. 347:417–429. 2002. View Article : Google Scholar
|
|
3
|
Ueno F, Matsui T, Matsumoto T, Matsuoka K,
Watanabe M and Hibi T; Guidelines Project Group of the Research
Group of Intractable Inflammatory Bowel Disease subsidized by the
Ministry of Health, Labour and Welfare of Japan and the Guidelines
Committee of the Japanese Society of Gastroenterology.
Evidence-based clinical practice guidelines for Crohn’s disease,
integrated with formal consensus of experts in Japan. J
Gastroenterol. 48:31–72. 2013.
|
|
4
|
Imaeda H, Andoh A and Fujiyama Y:
Development of a new immunoassay for the accurate determination of
anti-infliximab antibodies in inflammatory bowel disease. J
Gastroenterol. 47:136–143. 2012. View Article : Google Scholar : PubMed/NCBI
|
|
5
|
Sartor RB: Microbial influences in
inflammatory bowel diseases. Gastroenterology. 134:577–594. 2008.
View Article : Google Scholar : PubMed/NCBI
|
|
6
|
Mizoguchi A and Mizoguchi E: Inflammatory
bowel disease, past, present and future: lessons from animal
models. J Gastroenterol. 43:1–17. 2008. View Article : Google Scholar : PubMed/NCBI
|
|
7
|
Sartor RB: Mechanisms of disease:
pathogenesis of Crohn’s disease and ulcerative colitis. Nat Clin
Pract Gastroenterol Hepatol. 3:390–407. 2006.
|
|
8
|
Hamilton MJ, Snapper SB and Blumberg RS:
Update on biologic pathways in inflammatory bowel disease and their
therapeutic relevance. J Gastroenterol. 47:1–8. 2012. View Article : Google Scholar : PubMed/NCBI
|
|
9
|
Wirtz S and Neurath MF: Mouse models of
inflammatory bowel disease. Adv Drug Deliv Rev. 59:1073–1083. 2007.
View Article : Google Scholar : PubMed/NCBI
|
|
10
|
Braun J and Wei B: Body traffic: ecology,
genetics, and immunity in inflammatory bowel disease. Annu Rev
Pathol. 2:401–429. 2007. View Article : Google Scholar : PubMed/NCBI
|
|
11
|
Seksik P, Sokol H, Lepage P, et al: Review
article: the role of bacteria in onset and perpetuation of
inflammatory bowel disease. Aliment Pharmacol Ther. 24(Suppl 3):
11–18. 2006. View Article : Google Scholar : PubMed/NCBI
|
|
12
|
Elson CO, Cong Y, McCracken VJ, Dimmitt
RA, Lorenz RG and Weaver CT: Experimental models of inflammatory
bowel disease reveal innate, adaptive, and regulatory mechanisms of
host dialogue with the microbiota. Immunol Rev. 206:260–276. 2005.
View Article : Google Scholar : PubMed/NCBI
|
|
13
|
Frank DN, St Amand AL, Feldman RA,
Boedeker EC, Harpaz N and Pace NR: Molecular-phylogenetic
characterization of microbial community imbalances in human
inflammatory bowel diseases. Proc Natl Acad Sci USA.
104:13780–13785. 2007. View Article : Google Scholar
|
|
14
|
Andoh A, Kuzuoka H, Tsujikawa T, et al:
Multicenter analysis of fecal microbiota profiles in Japanese
patients with Crohn’s disease. J Gastroenterol. 47:1298–1307.
2012.PubMed/NCBI
|
|
15
|
Kuwahara E, Asakura K, Nishiwaki Y, et al:
Effects of family history on inflammatory bowel disease
characteristics in Japanese patients. J Gastroenterol. 47:961–968.
2012. View Article : Google Scholar : PubMed/NCBI
|
|
16
|
Imaeda H, Bamba S, Takahashi K, et al:
Relationship between serum infliximab trough levels and endoscopic
activities in patients with Crohn’s disease under scheduled
maintenance treatment. J Gastroenterol. May 11–2013.(Epub ahead of
print).
|
|
17
|
Nagalingam NA and Lynch SV: Role of the
microbiota in inflammatory bowel diseases. Inflamm Bowel Dis.
18:968–984. 2012. View Article : Google Scholar : PubMed/NCBI
|
|
18
|
Andoh A, Imaeda H, Aomatsu T, et al:
Comparison of the fecal microbiota profiles between ulcerative
colitis and Crohn’s disease using terminal restriction fragment
length polymorphism analysis. J Gastroenterol. 46:479–486.
2011.
|
|
19
|
Atarashi K, Tanoue T, Shima T, et al:
Induction of colonic regulatory T cells by indigenous
Clostridium species. Science. 331:337–341. 2011. View Article : Google Scholar : PubMed/NCBI
|
|
20
|
Sokol H, Pigneur B, Watterlot L, et al:
Faecalibacterium prausnitzii is an anti-inflammatory
commensal bacterium identified by gut microbiota analysis of Crohn
disease patients. Proc Natl Acad Sci USA. 105:16731–16736. 2008.
View Article : Google Scholar
|
|
21
|
Sokol H, Seksik P, Furet JP, et al: Low
counts of Faecalibacterium prausnitzii in colitis
microbiota. Inflamm Bowel Dis. 15:1183–1189. 2009.
|
|
22
|
Fujimoto T, Imaeda H, Takahashi K, et al:
Decreased abundance of Faecalibacterium prausnitzii in the
gut microbiota of Crohn’s disease. J Gastroenterol Hepatol.
28:613–619. 2013.
|
|
23
|
Best WR, Becktel JM, Singleton JW and Kern
F Jr: Development of a Crohn’s disease activity index. National
Cooperative Crohn’s Disease Study. Gastroenterology. 70:439–444.
1976.
|
|
24
|
Hayashi H, Sakamoto M, Kitahara M and
Benno Y: Diversity of the Clostridium coccoides group in
human fecal microbiota as determined by 16S rRNA gene library. FEMS
Microbiol Lett. 257:202–207. 2006.
|
|
25
|
Matsumoto M, Sakamoto M, Hayashi H and
Benno Y: Novel phylogenetic assignment database for
terminal-restriction fragment length polymorphism analysis of human
colonic microbiota. J Microbiol Methods. 61:305–319. 2005.
View Article : Google Scholar
|
|
26
|
Sakamoto M, Takeuchi Y, Umeda M, Ishikawa
I and Benno Y: Application of terminal RFLP analysis to
characterize oral bacterial flora in saliva of healthy subjects and
patients with periodontitis. J Med Microbiol. 52:79–89. 2003.
View Article : Google Scholar : PubMed/NCBI
|
|
27
|
Marsh TL, Saxman P, Cole J and Tiedje J:
Terminal restriction fragment length polymorphism analysis program,
a web-based research tool for microbial community analysis. Appl
Environ Microbiol. 66:3616–3620. 2000. View Article : Google Scholar : PubMed/NCBI
|
|
28
|
Blair YI, McMahon AD and Macpherson LM:
Comparison and relative utility of inequality measurements: as
applied to Scotland’s child dental health. PLoS One.
8:e585932013.PubMed/NCBI
|