Introduction
Osteocytes are the most abundant cells in the bone,
and are distributed in an interconnected network through which they
sense and respond to systemic or local stimuli to regulate bone
remodeling, exerting their effects via cell-cell interactions and
soluble mediators (1,2). It has been demonstrated that osteocytes
release various soluble signaling molecules, such as receptor
activator of nuclear factor-κB ligand, insulin like growth
factor-1, sclerostin, NO and ATP, which affect the osteoblastic and
osteoclastic activities (2,3). In addition to the regional mediators,
molecules released from osteocytes, including fibroblast growth
factor (FGF)23, dentin matrix protein (DMP)-1 and sclerostin have
been detected in the serum of all healthy human subjects (3), indicating that these secreted proteins
enter the circulation and are transported to distant organs. In
fact, the main target organ of FGF23 is the kidney, where it
suppresses phosphate reabsorption on tubular cells, implying that
osteocytes regulate not only regional but also systemic processes
by circulating soluble mediators (3,4). Recently,
Sato et al reported that ablation of osteocytes in mice
leads to lymphopenia and loss of white adipose tissues (5). However, it remains unclear how osteocytes
regulate distinct organs. Therefore, the regulatory mechanisms by
which osteocytes function on distinct organs remains to be
elucidated.
Extracellular vesicles are released by cells from
multivesicular bodies (also known as exosomes) or from the plasma
membrane (microvesicles) (6). Exosomes
are released into the extracellular environment by a wide variety
of cell types and are detected in the majority of biological
fluids, including the plasma, breast milk, urine and saliva
(7,8).
They contain lipids, proteins and nucleic acids consisting of DNA,
as well as protein-coding and non-coding RNAs, including microRNAs
(miRNAs or miRs) (6) Exosomes have
been proposed to transfer these components to the recipient cell by
binding to the cell surface through adhesion molecules, or by
fusion and internalization by the recipient cell (9). Previous studies have indicated that
nucleic acids, including miRNA and mRNA, are delivered to recipient
cells in exosomes along with proteins and lipids, and that they
trigger downstream signaling events in the recipient cells
(6,10).
miRNAs are small non-coding RNAs that are ~22
nucleotides (nt) in length. To date, >2,000 miRNAs have been
discovered in mammals, with certain of these expressed in a
tissue-specific manner, which suggests that they serve specific
roles in the determination of tissues during biological processes,
such as cell differentiation, cell growth, apoptosis and
carcinogenesis, and in various diseases (11,12). There
is accumulating evidence to suggest that regulation of cellular
functions by miRNAs is a notable component of the regulatory system
(13,14). miRNAs are not only isolated inside
cells, but are also transported in exosomes and/or microvesicles,
apoptotic bodies and other microparticles. Export of intracellular
miRNAs occurs partially through exosome-mediated mechanisms, and
miRNAs in exosomes repress resident mRNA translation after entering
recipient cells, thus regulating biological events, including
angiogenesis, immune response and tumor cell invasion (10,15,16).
The present study focuses on investigating the miRNA
expression of osteocyte-derived exosomes. It was hypothesized that
osteocytes may secrete exosomes containing characterized miRNAs;
therefore the possibility that these exosomes may be present in the
circulation was examined. Altered expression levels of miRNAs in
plasma exosomes derived from osteocyte-less (OL) mice were
observed, when compared with those in wild-type (WT) mice.
According to miRNA profiling studies using exosomes prepared from
mouse osteocyte MLO-Y4 cells and bone marrow stromal ST2 cells,
osteocyte-derived exosomes were found to contain characterized
miRNAs, and certain of those miRNAs were diminished in the exosomes
obtained from the plasma of OL mice. These findings suggest that
osteocytes in the bone tissue produce exosomes containing specific
miRNAs, which circulate in the peripheral blood, from where they
may be transferred to other organs.
Materials and methods
Mice and isolation of plasma
The study utilized a transgenic (Tg) mouse (DMP-1
DTR Tg) with targeted expression of diphtheria toxin receptor (DTR)
under the promoter of DMP-1 (17). The
DMP-1 DTR Tg mouse was backcrossed for more than nine generations
onto a C57BL/6 background prior to use. The WT and Tg littermate
mice (age, 15 weeks, body weight, ~30 g) were injected with a
single dose of diphtheria toxin (DT; 20 µg/kg, intraperitoneally;
Sigma-Aldrich, St. Louis, MO, USA), and then plasma was harvested 3
weeks later (at 18 weeks). Mice were housed under a 12-h light/dark
cycle at a temperature of 23–25°C, humidity between 50–70% and were
fed a normal diet. All animal experiments were approved by the
Animal Care and Use Committee of Kobe University (Kobe, Japan), and
were conducted according to the Kobe University Animal
Experimentation Regulations.
Exosome isolation from plasma
Exosomes were isolated from the plasma using the
Total Exosome Isolation kit (from plasma) (Invitrogen; Thermo
Fisher Scientific, Inc., Waltham, MA, USA) according to the
manufacturer's instructions. Briefly, 0.2 volume of the total
exosome isolation reagent was added to the plasma and vortexed to
mix. Samples were incubated overnight at 4°C, and subsequently
centrifuged at 15,000 × g for 1 h at 4°C. The supernatants were
discarded and the exosome pellets were resuspended in 100 µl
phosphate-buffered saline (PBS).
Isolation of RNA
Total RNA containing the small RNA fraction was
extracted using a mirVana miRNA isolation kit (Ambion; Thermo
Fisher Scientific, Inc.) according to the manufacturer's
instructions. This protocol effectively recovers both mRNA and
miRNA. Subsequently, the concentration of the total RNA samples was
evaluated using a NanoDrop ND-1000 spectrophotometer (Thermo Fisher
Scientific, Inc.). The integrity of the total RNA samples was also
analyzed using the Agilent 2100 Bioanalyzer Lab-on-a-Chip
instrument system (Agilent Technologies, Santa Clara, CA, USA) with
the RNA 6000 Nano Chip (Applied Biosystems; Thermo Fisher
Scientific, Inc.).
miRNA microarray and data
analysis
Microarray analyses were performed using the 3D-Gene
miRNA microarray platform (Toray Industries, Inc., Kamakura,
Japan). Briefly, total RNA containing the small RNA fraction was
labeled with a 3D-Gene miRNA labeling kit (Toray Industries, Inc.),
and hybridized at 32°C for 16 h on the 3D-Gene chip. The microarray
was then scanned, and the obtained images were numerated using a
3D-Gene scanner 3000 (Toray Industries, Inc.). The microarray
images obtained were analyzed using Genepix Pro 4.0 software
(Molecular Devices, Sunnyvale, CA, USA). Differences in the total
fluorescence intensity between arrays were adjusted by global
normalization. The mean values for duplicate microarrays were
calculated and used for comparison between the groups. When the
difference in relative miRNA expression between the two groups was
>2.0-fold, this was defined as a change in the expression.
Subsequently, the expression level of each miRNA was globally
normalized using the background-subtracted signal intensity of the
entire miRNAs in each microarray. The mean values from duplicate
microarrays were calculated and used for comparison between the
groups.
Cell culture
The immortalized mouse osteocytic MLO-Y4 cell line
was provided by Dr Lynda Bonewald (University of Missouri-Kansas
City, School of Dentistry, Kansas City, MO, USA) (18). MLO-Y4 cells were cultured in α-modified
minimum essential medium (Sigma-Aldrich) containing 10% fetal
bovine serum (SAFC Bioscience, Inc., Lenexa, KS, USA) with 100
µg/ml kanamycin (Meiji, Ltd., Tokyo, Japan) and maintained in
plates or flasks coated with 0.15 mg/ml rat tail collagen type I
(BD Biosciences, Bedford, MA, USA) at 37°C in a humidified
atmosphere of 5% CO2 in air. In addition, the mouse
stromal ST2 cell line was obtained from the RIKEN Cell Bank
(Tsukuba, Japan), and cells were cultured as described previously
(19).
Exosome isolation from cultured
cells
At 3 days after reaching 100% confluence, culture
medium was harvested and exosomes were isolated using the Total
Exosome Isolation Reagent (from cell culture media) (Invitrogen;
Thermo Fisher Scientific, Inc.) according to the manufacturer's
instructions. Briefly, in order to remove cellular debris, the cell
culture medium was centrifuged at 2,000 × g for 20 min, and the
supernatant was transferred to a new microfuge tube. Subsequently,
0.5 volumes of reagent were added to the supernatant and vortexed
to mix. Samples were incubated overnight at 4°C, and then
centrifuged at 15,000 × g for 1 h at 4°C. The supernatants were
discarded and each pellet was resuspended in 100 µl PBS.
Small RNA library preparation and deep
sequencing
RNA (1 µg) was converted into a cDNA library using a
TruSeq Small RNA Library Preparation kit (cat. no. RS-200-0012;
Illumina, Inc., San Diego, CA, USA) according the manufacturer's
protocol. Briefly, 5′ and 3′ adaptors were ligated, followed by
reverse transcription using SuperScript II reverse transcriptase
(Invitrogen; cat. no. 18064014) and library enrichment by PCR
amplification. The PCR conditions were as follows: Initial
denaturation at 98°C for 30 sec, followed by 13 cycles of 98°C for
10 sec, 60°C for 30 sec, 72°C for 15 sec, and a final extension
step at 72°C for 10 min. Following enrichment, the cDNA library was
purified and run on a 6% polyacrylamide gel, and then the
appropriate band (18–30 nt in size) was excised and eluted. The
purified cDNA library was run on a HiSeq 2500 ultra-high-throughput
sequencing system (Illumina, Inc.) with read length of 101 nt, and
the resulting reads were analyzed.
Analysis of small RNA sequence
data
In order to perform real-time image analysis and
base calling, the HiSeq Control Software (Illumina, Inc.) were used
on HiSeq 2500 (Illumina, Inc.). Raw readings, passed through a
chastity filter, were initially extracted from the FASTQ files. and
the Cutadapt application (https://cutadapt.readthedocs.io/en/stable/) was used
to remove the adaptor sequences from each sequence read. Any
sequences with <10 nt after trimming were not used. The prepared
sequences were aligned using the BLAST+ tool (version 2.2.29+)
downloaded via FTP from ftp://ftp.ncbi.nlm.nih.gov/blast/db/against
mouse miRNA sequences miRBase (Release 21; http://www.mirbase.org/).
Results
Altered miRNA expression levels in
exosomes derived from the plasma of OL mice
To elucidate whether exosomes from osteocytes
circulate in the peripheral blood, a Tg mouse model with targeted
expression of DTR under the control of the DMP-1 promoter was used
(17). WT and Tg littermate mice
(15-week-old) were injected with DT. After 3 weeks, the DT-injected
mice showed a comparable lacuno-canalicular interstitial fluid
space to that of WT mice; however, there was a marked reduction in
the osteocyte network, and thuse these mice were denoted as OL
(5,20).
In the initial attempt to identify differentially expressed miRNAs
between the plasma exosomes of OL and WT mice, exosomes were
isolated from plasma samples, and then total RNA was extracted from
the exosome preparations. The quality and quantity of these RNA
isolates were determined using a bioanalyzer. In exosomal RNA
derived from the OL and WT plasma samples, bioanalyzer profiles
indicated that these RNAs lack detectable quantities of 18S and 28S
ribosomal RNA, indicating that significant amounts of RNA are
present (data not shown).
In order to investigate the miRNA content of these
exosomes, the expression of miRNA was profiled using a 3D-Gene
miRNA microarray platform that can detect ~1,300 known miRNAs. The
normalized data were globally normalized per array, such that the
median of the signal intensity was adjusted to 25. The number of
expressed (detected) miRNAs present at significant levels (global
normalization value of >100) was determined. Among the expressed
miRNAs in the plasma exosomes, the expression level of 30 miRNAs
was downregulated (log2 value; fold-change <0.5) and
that of another 30 miRNAs was upregulated (log2 value
>1.5) in OL mice compared with the expression in WT mice
(Table I). Among the downregulated
miRNAs in OL mouse plasma, the relative expression levels of
miR-3473a, miR-3473b, miR-3473e, miR-5128, miR-6244, miR-6239,
miR-5132-5p, miR-705, miR-208a-5p miR-3104-5p, miR-1224-5p and
miR-5621-5p were −1.0 or lower (log2 value) compared
with the WT mice (Table I). These
results indicated that the expression levels of certain miRNAs were
altered in exosomes derived from the plasma of OL mice.
 | Table I.Alterations in the plasma exosomal
miRNA expression levels from OL mice. |
Table I.
Alterations in the plasma exosomal
miRNA expression levels from OL mice.
| A, Downregulated
miRNAs |
|---|
|
|---|
| miR ID | Relative miRNA
expressiona |
|---|
| mmu-miR-3473a | −1.90 |
| mmu-miR-3473b | −1.52 |
| mmu-miR-3473e | −1.51 |
| mmu-miR-5128 | −1.43 |
| mmu-miR-6244 | −1.27 |
| mmu-miR-6239 | −1.24 |
| mmu-miR-5132-5p | −1.13 |
| mmu-miR-705 | −1.10 |
| mmu-miR-208a-5p | −1.09 |
| mmu-miR-3104-5p | −1.07 |
| mmu-miR-1224-5p | −1.05 |
| mmu-miR-5621-5p | −1.03 |
| mmu-miR-328-5p | −0.87 |
| mmu-miR-5130 | −0.87 |
| mmu-miR-652-5p | −0.84 |
| mmu-miR-5112 | −0.76 |
| mmu-miR-149-3p | −0.73 |
| mmu-miR-346-3p | −0.71 |
| mmu-miR-5109 | −0.69 |
|
mmu-miR-3102-5p | −0.68 |
| mmu-miR-6370 | −0.64 |
| mmu-miR-6240 | −0.63 |
| mmu-miR-486-3p | −0.62 |
| mmu-miR-326-5p | −0.61 |
| mmu-miR-6385 | −0.60 |
| mmu-miR-5105 | −0.59 |
| mmu-miR-615-5p | −0.59 |
| mmu-miR-6405 | −0.58 |
| mmu-miR-5126 | −0.56 |
| mmu-miR-5119 | −0.52 |
|
| B, Upregulated
miRNAs |
|
| miR ID | Relative miRNA
expressiona |
|
| mmu-miR-122-5p | 3.65 |
|
mmu-miR-133b-3p | 2.67 |
|
mmu-miR-133a-3p | 2.51 |
| mmu-miR-25-3p | 2.31 |
| mmu-miR-92b-3p | 2.19 |
| mmu-miR-19a-3p | 2.19 |
| mmu-miR-92a-3p | 2.08 |
| mmu-miR-144-3p | 2.06 |
| mmu-miR-15b-5p | 2.03 |
| mmu-miR-29c-3p | 2.00 |
| mmu-miR-486-5p | 1.99 |
| mmu-miR-93-5p | 1.93 |
| mmu-miR-15a-5p | 1.80 |
| mmu-miR-221-3p | 1.77 |
| mmu-miR-192-5p | 1.76 |
| mmu-miR-19b-3p | 1.74 |
| mmu-let-7j | 1.71 |
| mmu-miR-451a | 1.71 |
| mmu-let-7i-5p | 1.70 |
| mmu-miR-103-3p | 1.69 |
| mmu-miR-107-3p | 1.66 |
| mmu-miR-18a-5p | 1.63 |
|
mmu-miR-195a-5p | 1.60 |
| mmu-miR-484 | 1.59 |
| mmu-miR-16-5p | 1.58 |
| mmu-miR-18b-5p | 1.58 |
| mmu-miR-30a-5p | 1.54 |
| mmu-miR-425-5p | 1.52 |
|
mmu-miR-301a-3p | 1.51 |
| mmu-miR-29a-3p | 1.51 |
MLO-Y4 cells released from exosomes
contain miRNAs
In the present study, the MLO-Y4 osteocyte-like cell
line was used as the osteocyte model for several reasons: i) These
cells are isolated from weight-bearing bone and are a
well-characterized osteocyte model that has been intensively
studied since 1997 (18); and ii)
MLO-Y4 cells express early osteocyte markers in vivo, such
as E11, CD44 and low levels of the mature osteocyte marker
sclerostin (3). By contrast, the ST2
cell line is a bone marrow-derived stromal cell line (21). ST2 cells cultured with ascorbic acid
exhibit characteristics typical of osteoblasts, including the
formation of mineralized nodules, indicating that ST2 cells are
pre-osteoblastic stromal cells (22).
Therefore, ST2 cells were used as control non-osteocytic cells in
the present study.
In order to identify differentially-expressed miRNAs
in exosomes obtained from MLO-Y4 and ST2 cells, exosomes were
isolated from culture supernatants, and the RNA was isolated.
Bioanalyzer profiles indicated that these exosomal RNAs lacked
detectable amounts of ribosomal RNA, whereas total cellular RNAs
contained ribosomal 18s and 28s RNAs and mRNAs as major components,
indicating that significant amounts of small RNAs were present
(data not shown). Using miRNA microarray analysis, the number of
miRNAs expressed at significant levels in the exosomes prepared
from MLO-Y4 and ST2 cells was detected. Analysis of these miRNA
profiles revealed that 53 miRNAs were enriched at significantly
higher levels (log2 value >2.5) in MLO-Y4 cells
compared with their levels in ST2 cells (Table II). Furthermore, the miRNA expression
profile between the exosomal and cellular fractions of MLO-Y4 cells
was compared (Table II). Taken
together, these data demonstrated that characterized miRNAs were
present in the MLO-Y4 exosomes, and 71.7% (38/53) of these miRNAs
were enriched in the exosomes compared with their expression in
host cells.
| Table II.Enriched expression of miRNAs in
exosomes from MLO-Y4 cells compared with ST2 cells. |
Table II.
Enriched expression of miRNAs in
exosomes from MLO-Y4 cells compared with ST2 cells.
|
| Relative miRNA
expressiona |
|---|
|
|
|
|---|
| miR ID | MLO-Y4/ST2
exosomes | MLO-Y4
exosomes/MLO-Y4 cells |
|---|
| mmu-miR-3473e | 5.66 | 3.77 |
|
mmu-miR-1224-5p | 5.34 | 5.80 |
| mmu-miR-1940 | 5.07 | 5.20 |
| mmu-miR-5128 | 4.8 | 4.51 |
| mmu-miR-3473b | 4.64 | 3.79 |
| mmu-miR-3473a | 4.58 | 3.02 |
| mmu-miR-29a-3p | 4.45 | 0.67 |
|
mmu-miR-1964-5p | 4.29 | 6.06 |
| mmu-miR-140-3p | 4.06 | 1.79 |
| mmu-miR-6240 | 4.03 | 3.24 |
| mmu-miR-5099 | 3.92 | 3.06 |
|
mmu-miR-5129-5p | 3.82 | n.d. |
| mmu-miR-23a-3p | 3.77 | 1.43 |
| mmu-miR-690 | 3.65 | 0.53 |
| mmu-miR-23b-3p | 3.48 | 1.63 |
|
mmu-miR-365-1-5p | 3.46 | n.d. |
|
mmu-miR-1930-3p | 3.36 | n.d. |
|
mmu-miR-130a-3p | 3.28 | 1.71 |
| mmu-miR-491-5p | 3.17 | n.d. |
|
mmu-miR-193b-5p | 3.15 | n.d. |
| mmu-miR-6236 | 3.11 | 3.35 |
| mmu-miR-214-3p | 3.08 | 2.47 |
| mmu-miR-5121 | 3.06 | n.d. |
|
mmu-miR-5627-5p | 3.05 | 1.33 |
|
mmu-miR-1247-3p | 2.95 | 3.16 |
| mmu-miR-16-5p | 2.96 | −0.78 |
| mmu-miR-705 | 2.94 | 4.05 |
| mmu-miR-22-3p | 2.91 | 3.35 |
| mmu-miR-92a-3p | 2.91 | 2.27 |
| mmu-miR-27a-3p | 2.91 | 0.30 |
| mmu-miR-1965 | 2.85 | 2.54 |
| mmu-miR-24-3p | 2.85 | 1.82 |
|
mmu-miR-3072-5p | 2.83 | 3.50 |
| mmu-miR-221-3p | 2.84 | 1.43 |
|
mmu-miR-3090-5p | 2.83 | −0.10 |
|
mmu-miR-125b-5p | 2.84 | −0.27 |
| mmu-miR-671-5p | 2.82 | 2.81 |
| mmu-miR-6244 | 2.8 | 2.20 |
|
mmu-miR-5620-5p | 2.8 | n.d. |
| mmu-miR-6349 | 2.72 | n.d. |
|
mmu-miR-3104-5p | 2.71 | 3.19 |
| mmu-miR-326-5p | 2.7 | 2.47 |
| mmu-miR-5131 | 2.67 | 2.45 |
|
mmu-miR-125a-3p | 2.68 | 0.73 |
| mmu-miR-762 | 2.64 | 2.10 |
| mmu-miR-2136 | 2.65 | n.d. |
| mmu-miR-744-5p | 2.59 | 2.77 |
| mmu-miR-17-5p | 2.58 | −0.88 |
| mmu-miR-680 | 2.57 | 3.66 |
|
mmu-miR-5622-3p | 2.55 | 1.62 |
| mmu-miR-6406 | 2.54 | n.d. |
| mmu-miR-19b-3p | 2.51 | 0.49 |
| mmu-miR-665-3p | 2.51 | n.d. |
Comparison of miRNA expression between
plasma exosomes from OL mice and MLO-Y4-derived exosomes
To determine whether exosomes derived from
osteocytes are circulating in the blood, the miRNA expression
levels of exosomes were analyzed and compared between OL mouse
plasma and MLO-Y4 cells. Downregulated and upregulated miRNAs in OL
mice, and relative miRNAs expression levels (MLO-Y4 exosomes/ST2
exosomes and MLO-Y4 exosomes/MLO-Y4 cells) are shown in Tables III and IV, respectively. With the exception of
miR-208a-5p, a total of 12 miRNAs downregulated (log2
value <-1) in the OL mouse plasma were expressed at higher
levels in the MLO-Y4 exosomes compared with the levels in ST2
exosomes (Table III). By contrast,
10 upregulated (log2 value >2) enriched miRNAs were
undetectable in both exosomal and cellular fractions of MLO-Y4
cells with the exception of miR-92a-3p (Table IV). These results suggest that these
exosomal miRNAs downregulated in OL mouse plasma may be derived
from exosomes secreted by osteocytes.
| Table III.Downregulated miRNAs in exosomes from
osteocyte-less mouse plasma and MLO-Y4 cellular and exosomal
enriched miRNA. |
Table III.
Downregulated miRNAs in exosomes from
osteocyte-less mouse plasma and MLO-Y4 cellular and exosomal
enriched miRNA.
|
| Relative miRNA
expression |
|---|
|
|
|
|---|
| miR ID | OL plasma
exosome/WT plasma exosome | MLO-Y4 exosomes/ST2
exosomes | MLO-Y4
exosomes/MLO-Y4 cells |
|---|
| mmu-miR-3473a | −1.90 | 4.58 | 3.02 |
| mmu-miR-3473b | −1.52 | 4.64 | 3.79 |
| mmu-miR-3473e | −1.51 | 5.66 | 3.77 |
| mmu-miR-5128 | −1.43 | 4.8 | 4.51 |
| mmu-miR-6244 | −1.27 | 2.8 | 2.20 |
| mmu-miR-6239 | −1.24 | 2.15 | n.d. |
|
mmu-miR-5132-5p | −1.13 | 2.42 | 2.63 |
| mmu-miR-705 | −1.10 | 2.94 | 4.05 |
|
mmu-miR-208a-5p | −1.09 | n.d. | n.d. |
|
mmu-miR-3104-5p | −1.07 | 2.71 | 3.19 |
|
mmu-miR-1224-5p | −1.05 | 5.34 | 5.80 |
|
mmu-miR-5621-5p | −1.03 | 2.26 | 2.29 |
| mmu-miR-328-5p | −0.87 | 2.25 | 3.97 |
| mmu-miR-5130 | −0.87 | 1.5 | 3.58 |
| mmu-miR-652-5p | −0.84 | n.d. | n.d. |
| mmu-miR-5112 | −0.76 | n.d. | n.d. |
| mmu-miR-149-3p | −0.73 | 2.13 | 3.62 |
| mmu-miR-346-3p | −0.71 | 1.72 | 2.51 |
| mmu-miR-5109 | −0.69 | 2.49 | 1.99 |
|
mmu-miR-3102-5p.2-5p | −0.68 | 1.18 | 2.66 |
| mmu-miR-6370 | −0.64 | 2.25 | n.d. |
| mmu-miR-6240 | −0.63 | 4.03 | 3.24 |
| mmu-miR-486-3p | −0.62 | 2.2 | 0.94 |
| mmu-miR-326-5p | −0.61 | 2.7 | 2.47 |
| mmu-miR-6385 | −0.60 | n.d. | n.d. |
| mmu-miR-5105 | −0.59 | 2.24 | 3.26 |
| mmu-miR-615-5p | −0.59 | 1.12 | n.d. |
| mmu-miR-6405 | −0.58 | n.d. | n.d. |
| mmu-miR-5126 | −0.56 | 1.76 | 2.34 |
| mmu-miR-5119 | −0.52 | n.d. | n.d. |
| Table IV.Upregulated miRNAs in exosomes from
osteocyte-less mouse plasma and MLO-Y4 cellular and exosomal
miRNA. |
Table IV.
Upregulated miRNAs in exosomes from
osteocyte-less mouse plasma and MLO-Y4 cellular and exosomal
miRNA.
|
| Relative miRNA
expression |
|---|
|
|
|
|---|
| miR ID | OL plasma
exosome/WT plasma exosome | MLO-Y4 exosomes/ST2
exosomes | MLO-Y4
exosomes/MLO-Y4 cells |
|---|
|
mmu-miR-133b-3p | 2.67 | n.d. | n.d. |
|
mmu-miR-133a-3p | 2.51 | n.d. | n.d. |
| mmu-miR-25-3p | 2.31 | n.d. | n.d. |
| mmu-miR-92b-3p | 2.19 | n.d. | n.d. |
| mmu-miR-19a-3p | 2.19 | n.d. | n.d. |
| mmu-miR-92a-3p | 2.08 | 2.91 | 2.27 |
| mmu-miR-144-3p | 2.06 | n.d. | n.d. |
| mmu-miR-15b-5p | 2.03 | n.d. | n.d. |
| mmu-miR-29c-3p | 2.00 | n.d. | n.d. |
| mmu-miR-486-5p | 1.99 | n.d. | n.d. |
| mmu-miR-93-5p | 1.93 | n.d. | n.d. |
| mmu-miR-15a-5p | 1.80 | n.d. | n.d. |
| mmu-miR-221-3p | 1.77 | 2.84 | 1.43 |
| mmu-miR-192-5p | 1.76 | n.d. | n.d. |
| mmu-miR-19b-3p | 1.74 | 2.51 | 0.49 |
| mmu-let-7j | 1.71 | n.d. | n.d. |
| mmu-miR-451a | 1.71 | 1.04 | n.d. |
| mmu-let-7i-5p | 1.70 | n.d. | n.d. |
| mmu-miR-103-3p | 1.69 | n.d. | n.d. |
| mmu-miR-107-3p | 1.66 | n.d. | n.d. |
| mmu-miR-18a-5p | 1.63 | n.d. | n.d. |
|
mmu-miR-195a-5p | 1.60 | n.d. | n.d. |
| mmu-miR-484 | 1.59 | 2.3 | 2.66 |
| mmu-miR-16-5p | 1.58 | 2.96 | −0.78 |
| mmu-miR-18b-5p | 1.58 | n.d. | n.d. |
| mmu-miR-30a-5p | 1.54 | n.d. | n.d. |
| mmu-miR-425-5p | 1.52 | n.d. | n.d. |
|
mmu-miR-301a-3p | 1.51 | n.d. | n.d. |
| mmu-miR-29a-3p | 1.51 | 4.45 | 0.67 |
Small RNA deep sequencing of exosomes
derived from MLO-Y4 cells
The microarray method, relying on sequence
hybridization to appropriately-designed annealing probes, can only
detect annotated miRNAs, as well as immature miRNAs, such as pre-
or pri-miRNAs, which include the same sequences that would be
detected in mature miRNAs. Sequencing-based technology reveals the
entire repertoire of expressed small RNAs (23). In order to analyze the abundance of
miRNAs and to identify the miRNA sequences that detect only mature
miRNAs from the MLO-Y4 exosomes, a small RNA cDNA library was
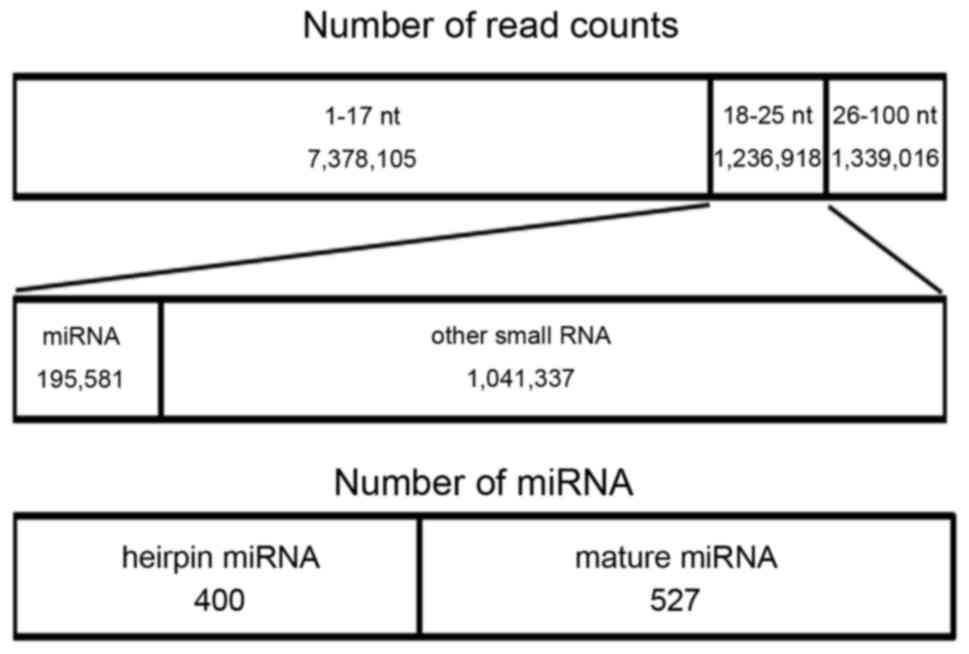
generated and deep sequencing was performed. A total of ~20,000,000
raw reads were obtained from the sample. Subsequent to removing
adapter sequences and selecting by size differences (1–17, 18–25
and >26 nt), 9,954,039 clean reads with sizes within the ranges
of 1–17, 18–25 and >26 nt were generated (Fig. 1). In the 18–25 nt size range of small
RNA sequences, small RNA characterization analysis focused on
searching release 21 of miRBase. Fig.
1 demonstrates a summary of the different types of small RNAs
detected in the samples, according to current miRNA annotations. Of
the total reads, 195,581 were annotated to mouse miRNA sequences
(Fig. 1). In addition, 527 known mouse
mature miRNAs were detected, as well as 400 stem-loop structures of
full-length and truncated pre-miRNAs (Fig.
1). Among these detected miRNAs, 32 miRNAs were found that were
enriched in exosomes derived from MLO-Y4 cells, as shown in
Table II, and the read counts were up
to 30 (Table V). Furthermore, among
these 32 miRNAs, miR3473b and miR3473e were reduced in exosomes
from OL mouse plasma (Table VI).
These results indicated that MLO-Y4 exosomes contain varying
expression levels of characterized miRNAs.
| Table V.Summary of miRNA read counts from
exosomes of MLO-Y4 cells. |
Table V.
Summary of miRNA read counts from
exosomes of MLO-Y4 cells.
| No. of read
counts | miRNA |
|---|
| 30–49 | miR-3473b |
|
| miR-6240 |
|
| miR-145a-5p |
|
| miR-1195 |
|
| miR-6538 |
| 50–99 | miR-690 |
|
| miR-5121 |
|
| miR-24-3p |
|
| miR-709 |
|
| miR-125a-3p |
|
| miR-3102-5p |
|
| miR-20a-5p |
| Up to 100 | miR-23b-3p |
|
| miR-130a-3p |
|
| miR-140-3p |
|
| miR-23a-3p |
|
| miR-29a-3p |
|
| miR-214-3p |
|
| miR-3473e |
|
| miR-125b-5p |
|
| miR-16-5p |
|
| miR-22-3p |
|
| miR-27a-3p |
|
| miR-92a-3p |
|
| miR-17-5p |
|
| miR-221-3p |
|
| miR-484 |
|
| miR-671-5p |
|
| miR-125b-1-3p |
|
| miR-191-5p |
|
| miR-451a |
|
| miR-615-5p |
| Table VI.Summary of read counts (>30) of
upregulated or downregulated miRNAs in osteocyte-less mouse plasma
exosomes. |
Table VI.
Summary of read counts (>30) of
upregulated or downregulated miRNAs in osteocyte-less mouse plasma
exosomes.
| Regulation | miR ID | Read counts | Relative miRNA
expressiona |
|---|
| Upregulated | miR-29a-3p |
832 |
1.51 |
|
| miR-16-5p |
1050 |
1.58 |
|
| miR-92a-3p | 13672 |
2.08 |
|
| miR-221-3p |
5998 |
1.77 |
|
| miR-484 |
1745 |
1.59 |
|
| miR-451a |
385 |
1.71 |
| Downregulated | miR-3473b | 48 | −1.52 |
|
| miR-3473e |
116 | −1.51 |
Discussion
To the best of our knowledge, the present study is
the first to describe the effect of the lack of osteocytes on the
miRNA levels of circulating plasma exosomes. There are several
possible explanations for the alteration of miRNA expression levels
in circulating exosomes in the blood of OL mice: i) Low production
of osteocyte-derived exosomes influences the miRNA expression level
of circulating exosomes in the OL mice; ii) damaged osteocytes
secrete numerous apoptotic bodies or other microparticles, which
then influence the miRNA expression level of circulating exosomes
in the OL mice; and iii) there is no change in the level of the
secretion of exosomes and/or microvesicles, apoptotic bodies and
other microparticles, and only alteration of the miRNA expression
level in exosomes occurs from bone and other tissues.
In the present study, miRNA microarray analysis
identified 12 miRNAs (miR-3473a, miR-3473b, miR-3473e, miR-5128,
miR-6244, miR-6239, miR-5132-5p, miR-705, miR-208a-5p miR-3104-5p,
miR-1224-5p and miR-5621-5p) that were downregulated
(log2 value <1.0) in OL mouse plasma exosomes
compared with WT plasma exosomes. These 12 miRNAs were expressed at
higher levels in MLO-Y4 exosomes than in ST2 exosomes, with the
exception of miR-208a-5p. A possible explanation of these findings
could be that the decrease of miRNAs in plasma exosomes of OL mice
is caused by a decrease in leakage or secretion of exosomes from
osteocytes, as described earlier in the first hypothesis,
suggesting that osteocytes secrete exosomes which then circulate in
the blood.
Since osteocytes release apoptotic bodies during
apoptosis (24), it is possible that
damaged osteocytes may secrete a large number of exosomes. However,
this second possibility may be excluded since the top 10
upregulated miRNAs (miR-122-5p, miR-133b-3p, miR-133a-3p,
miR-25-3p, miR-92b-3p, miR-19a-3p, miR-92a-3p, miR-144-3p,
miR-15b-5p and miR-29c-3p) were not detected in the exosomal or
cellular fraction of MLO-Y4 cells, with the exception of
miR-92a-3p. In addition, among the top 10 downregulated miRNAs,
miR-3473b and miR-3473e were also detected in MLO-Y4 exosomes by
small RNA deep sequencing. Previously, Sato et al (5,20)
demonstrated that ablation of osteocytes in mice (OL mice) leads to
severe lymphopenia, due to the lack of a lymphoid-supporting stroma
in the bone marrow and thymus, and to the complete loss of white
adipose tissues. We cannot exclude the possibility that these
miRNAs are secreted by cells of other organs or tissues as a result
of the ablation of osteocytes. In fact, downregulation of miR-3473
has been reported as one of the miRNAs that may involve brain
dysfunction following acute liver failure (25). Consequently, certain upregulated miRNAs
(miR-29, miR-484 and miR-221) are reported to be involved in energy
metabolism through the regulation of liver function, glucose
response of β-cells, adipogenesis and obesity (26–28).
In the present study, cultured MLO-Y4 cells were
found to release exosomes. Histologically, it has been reported
that, during apoptosis, osteocytes release protein-containing 20 nm
to 1 µm microvesicles known as osteocyte apoptotic bodies, which
stimulate osteoclastogenesis (23).
The results of confocal laser scanning microscopy analysis reveal
that osteocytic processes extend to the vascular-facing surface of
osteoblasts in vivo (29). This
suggests that osteocyte-derived exosomes may be released not only
into the local bone microenvironment, but also into nearby blood
vessels. Exosomes contain several groups of proteins, lipids and
genetic material, including miRNAs (6). The deep sequencing results of the present
study revealed that MLO-Y4 exosomes contain both mature miRNAs and
hairpin pre-miRNAs. Although the role of pre-miRNAs in exosomes
remains unclear, previous studies also showed that exosomes contain
predominantly pre-miRNAs (30–32). The current study suggests the
possibility that osteocyte-produced exosomes circulate throughout
the body, and then transfer their component signaling molecules,
including miRNA and pre-miRNA, by binding to a cell surface,
followed by fusion and internalization by recipient cells in other
organs and/or tissues, as previously described (33).
In conclusion, the current study has demonstrated
that ablation of osteocytes in mice alters the miRNA levels of
plasma exosomes, and that MLO-Y4 cells secrete exosomes containing
miRNAs. In addition, the present findings suggest that osteocytes
secrete exosomes which then circulate in the blood. This is the
first study linking osteocyte exosomes to circulating exosomes. As
such, these findings may provide important new information
pertaining to the molecular basis of the regulation of remote
organs by bone-derived osteocytes.
Acknowledgements
The present study was supported in part by the JSPS
Grants-in-Aid for Scientific Research [grant no. 15K20830
(SM)].
References
|
1
|
Bonewald LF: The amazing osteocyte. J Bone
Miner Res. 26:229–238. 2011. View
Article : Google Scholar : PubMed/NCBI
|
|
2
|
Schaffler MB, Cheung WY, Majeska R and
Kennedy O: Osteocytes: Master orchestrators of bone. Calcif Tissue
Int. 94:5–24. 2014. View Article : Google Scholar : PubMed/NCBI
|
|
3
|
Dallas SL, Prideaux M and Bonewald LF: The
osteocyte: An endocrine cell and more. Endocr Rev. 34:658–690.
2013. View Article : Google Scholar : PubMed/NCBI
|
|
4
|
Quarles LD: Skeletal secretion of FGF-23
regulates phosphate and vitamin D metabolism. Nat Rev Endocrinol.
8:276–286. 2012. View Article : Google Scholar : PubMed/NCBI
|
|
5
|
Sato M, Asada N, Kawano Y, Wakahashi K,
Minagawa K, Kawano H, Sada A, Ikeda K, Matsui T and Katayama Y:
Osteocytes regulate primary lymphoid organs and fat metabolism.
Cell Metab. 18:749–758. 2013. View Article : Google Scholar : PubMed/NCBI
|
|
6
|
Colombo M, Raposo G and Théry C:
Biogenesis, secretion, and intercellular interactions of exosomes
and other extracellular vesicles. Annu Rev Cell Dev Biol.
30:255–289. 2014. View Article : Google Scholar : PubMed/NCBI
|
|
7
|
Vlassov AV, Magdaleno S, Setterquist R and
Conrad R: Exosomes: Current knowledge of their composition,
biological functions, and diagnostic and therapeutic potentials.
Biochim Biophys Acta. 1820:940–948. 2012. View Article : Google Scholar : PubMed/NCBI
|
|
8
|
Salido-Guadarrama I, Romero-Cordoba S,
Peralta-Zaragoza O, Hidalgo-Miranda A and Rodríguez-Dorantes M:
MicroRNAs transported by exosomes in body fluids as mediators of
intercellular communication in cancer. Onco Targets Ther.
7:1327–1338. 2014.PubMed/NCBI
|
|
9
|
Simons M and Raposo G: Exosomes -
vesicular carriers for intercellular communication. Curr Opin Cell
Biol. 21:575–581. 2009. View Article : Google Scholar : PubMed/NCBI
|
|
10
|
Stoorvogel W: Functional transfer of
microRNA by exosomes. Blood. 119:646–648. 2012. View Article : Google Scholar : PubMed/NCBI
|
|
11
|
Williams AE: Functional aspects of animal
microRNAs. Cell Mol Life Sci. 65:545–562. 2008. View Article : Google Scholar : PubMed/NCBI
|
|
12
|
Sayed D and Abdellatif M: MicroRNAs in
development and disease. Physiol Rev. 91:827–887. 2011. View Article : Google Scholar : PubMed/NCBI
|
|
13
|
Bushati N and Cohen SM: microRNA
functions. Annu Rev Cell Dev Biol. 23:175–205. 2007. View Article : Google Scholar : PubMed/NCBI
|
|
14
|
Huntzinger E and Izaurralde E: Gene
silencing by microRNAs: Contributions of translational repression
and mRNA decay. Nat Rev Genet. 12:99–110. 2011. View Article : Google Scholar : PubMed/NCBI
|
|
15
|
Montecalvo A, Larregina AT, Shufesky WJ,
Stolz DB, Sullivan ML, Karlsson JM, Baty CJ, Gibson GA, Erdos G,
Wang Z, et al: Mechanism of transfer of functional microRNAs
between mouse dendritic cells via exosomes. Blood. 119:756–766.
2012. View Article : Google Scholar : PubMed/NCBI
|
|
16
|
van Balkom BW, de Jong OG, Smits M,
Brummelman J, den Ouden K, de Bree PM, van Eijndhoven MA, Pegtel
DM, Stoorvogel W, Würdinger T and Verhaar MC: Endothelial cells
require miR-214 to secrete exosomes that suppress senescence and
induce angiogenesis in human and mouse endothelial cells. Blood.
121:3997–4006, S1-S15. 2013. View Article : Google Scholar : PubMed/NCBI
|
|
17
|
Tatsumi S, Ishii K, Amizuka N, Li M,
Kobayashi T, Kohno K, Ito M, Takeshita S and Ikeda K: Targeted
ablation of osteocytes induces osteoporosis with defective
mechanotransduction. Cell Metab. 5:464–475. 2007. View Article : Google Scholar : PubMed/NCBI
|
|
18
|
Kato Y, Windle JJ, Koop BA, Mundy GR and
Bonewald LF: Establishment of an osteocyte-like cell line, MLO-Y4.
J Bone Miner Res. 12:2014–2023. 1997. View Article : Google Scholar : PubMed/NCBI
|
|
19
|
Tamura M, Sato MM and Nashimoto M:
Regulation of CXCL12 expression by canonical Wnt signaling in bone
marrow stromal cells. Int J Biochem Cell Biol. 43:760–767. 2011.
View Article : Google Scholar : PubMed/NCBI
|
|
20
|
Sato M and Katayama Y: Osteocytes and
Homeostasis of Remote Organs: Bone-Buried Osteocytes Talk to Remote
Organs. Curr Osteoporos Rep. 13:193–197. 2015. View Article : Google Scholar : PubMed/NCBI
|
|
21
|
Ogawa M and Nishikawa S, Ikuta K, Yamamura
F, Naito M, Takahashi K and Nishikawa S: B cell ontogeny in murine
embryo studied by a culture system with the monolayer of a stromal
cell clone, ST2: B cell progenitor develops first in the embryonal
body rather than in the yolk sac. EMBO J. 7:1337–1343.
1988.PubMed/NCBI
|
|
22
|
Otsuka E, Yamaguchi A, Hirose S and
Hagiwara H: Characterization of osteoblastic differentiation of
stromal cell line ST2 that is induced by ascorbic acid. Am J
Physiol. 277:C132–C138. 1999.PubMed/NCBI
|
|
23
|
Liu CG, Calin GA, Meloon B, Gamliel N,
Sevignani C, Ferracin M, Dumitru CD, Shimizu M, Zupo S, Dono M, et
al: An oligonucleotide microchip for genome-wide microRNA profiling
in human and mouse tissues. Proc Natl Acad Sci USA. 101:9740–9744.
2004. View Article : Google Scholar : PubMed/NCBI
|
|
24
|
Kogianni G, Mann V and Noble BS: Apoptotic
bodies convey activity capable of initiating osteoclastogenesis and
localized bone destruction. J Bone Miner Res. 23:915–927. 2008.
View Article : Google Scholar : PubMed/NCBI
|
|
25
|
Vemuganti R, Silva VR, Mehta SL and Hazell
AS: Acute liver failure-induced hepatic encephalopathy s associated
with changes in microRNA expression rofiles in cerebral cortex of
the mouse [corrected]. Metab Brain Dis. 29:891–899. 2014.
View Article : Google Scholar : PubMed/NCBI
|
|
26
|
Tang X, Muniappan L, Tang G and Ozcan S:
Identification of glucose-regulated miRNAs from pancreatic {beta}
cells reveals a role for miR-30d in insulin transcription. RNA.
15:287–293. 2009. View Article : Google Scholar : PubMed/NCBI
|
|
27
|
Xie H, Lim B and Lodish HF: MicroRNAs
induced during adipogenesis that accelerate fat cell development
are downregulated in obesity. Diabetes. 58:1050–1057. 2009.
View Article : Google Scholar : PubMed/NCBI
|
|
28
|
Williams MD and Mitchell GM: MicroRNAs in
insulin resistance and obesity. Exp Diabetes Res. 2012:4846962012.
View Article : Google Scholar : PubMed/NCBI
|
|
29
|
Kamioka H, Honjo T and Takano-Yamamoto T:
A three-dimensional distribution of osteocyte processes revealed by
the combination of confocal laser scanning microscopy and
differential interference contrast microscopy. Bone. 28:145–149.
2001. View Article : Google Scholar : PubMed/NCBI
|
|
30
|
Chen TS and Lim SK: Measurement of
precursor miRNA in exosomes from human ESC-derived mesenchymal stem
cells. Methods Mol Biol. 1024:69–86. 2013. View Article : Google Scholar : PubMed/NCBI
|
|
31
|
Melo SA, Sugimoto H, O'Connell JT, Kato N,
Villanueva A, Vidal A, Qiu L, Vitkin E, Perelman LT, Melo CA, et
al: Cancer exosomes perform cell-independent microRNA biogenesis
and promote tumorigenesis. Cancer Cell. 26:707–721. 2014.
View Article : Google Scholar : PubMed/NCBI
|
|
32
|
Lee HK, Finniss S, Cazacu S, Xiang C and
Brodie C: Mesenchymal stem cells deliver exogenous miRNAs to neural
cells and induce their differentiation and glutamate transporter
expression. Stem Cells Dev. 23:2851–2861. 2014. View Article : Google Scholar : PubMed/NCBI
|
|
33
|
Mittelbrunn M and Sánchez-Madrid F:
Intercellular communication: Diverse structures for exchange of
genetic information. Nat Rev Mol Cell Biol. 13:328–335.
2012.PubMed/NCBI
|