Introduction
Colorectal cancer (CRC) is one of the most commonly
diagnosed types of cancer and is closely linked to aspects of the
Western lifestyle (1,2). Early detection and surgical resection is
the most effective measure to improve CRC-associated mortality
(3). Despite recent advances in CRC
treatment, such as chemotherapy and molecular targeted therapy, the
prognosis remains poor in advanced CRC cases (1,2). Recurrence
and metastasis are the main obstacles for improving the prognosis
of postoperative CRC patients (2,4). In Japan,
~15% of patients with stage II and 30% of patients with stage III
will develop recurrence within 5 years of surgical resection of CRC
(5). The treatment of advanced CRC
remains essentially palliative currently; therefore, it is
necessary to understand the processes that contribute to tumor
progression, particularly those that facilitate invasion and
metastasis, to prevent CRC recurrence.
Cancer metastasis is a complex process in which
malignant cancer cells disseminate from the primary tumor site to a
secondary tumor at a distant site. During this multistep process,
transition between epithelial and mesenchymal states occurs in
cancer cells (6,7). Initially, metastasis is triggered by the
epithelial to mesenchymal transition (EMT), which enhances cancer
cell motility and intravasation into blood vessels (8). Notably, the reversible process of EMT,
mesenchymal to epithelial transition (MET), is also observed at the
metastatic site, and is involved in the metastatic process
(6). EMT and MET are controlled by
multiple molecular mechanisms, such as transcription factors,
epigenetic modifications, alternative splicing, and miRNA networks,
resulting in the modification of epithelial or mesenchymal gene
expression levels (6,7). Among the molecular mechanisms, the
downregulation and re-expression of epithelial (E-) cadherin are
reportedly associated with EMT and MET, respectively (9). Accumulating evidence has revealed the
important roles of EMT and MET in cancer metastasis; however, this
modulation is complicated and further research is required.
Dipeptidase 1 (DPEP1), located on chromosome
16q24.3, is a zinc-dependent metalloproteinase, which is
fundamental in glutathione and leukotriene metabolism (10). Leukotrienes are pro-inflammatory
mediators that are associated with cancer development (11,12) and, as
such, the dysregulation of DPEP1 potentially leads to the
development of malignant tumors. Initially, loss of DPEP1
expression is associated with Wilms' tumor (13). Consistent with this, DPEP1 is
considered to be a tumor suppressor gene in breast cancer and
pancreatic ductal adenocarcinoma (14,15).
However, DPEP1 is upregulated in CRC and its high expression level
is associated with poorer patient survival (16). Furthermore, a recent report
demonstrated that DPEP1 is highly expressed in CRC and promotes
metastasis via regulation of E-cadherin expression levels (17). Therefore, further investigations are
required to evaluate the expression of DPEP1 in an additional
independent CRC cohort and the role of DPEP1 in CRC metastasis.
In the present study, DPEP1 expression levels were
investigated using comprehensive gene expression analyses, reverse
transcription-quantitative polymerase chain reaction (RT-qPCR) and
immunohistochemical (IHC) staining in surgically resected CRC
cases. In addition, the biological significance of DPEP1 was
examined by comparing the expression levels of EMT markers to
clarify the function of DPEP1 in CRC metastasis.
Materials and methods
Clinical samples of patients
A total of 78 surgical specimens were obtained from
CRC patients who had undergone surgical resection at Fukushima
Medical University Hospital (Fukushima, Japan) between January 2008
and December 2010. Specimens from all 78 cases were used for
comprehensive gene expression analysis, specimens from five cases
were used for protein expression analysis by western blotting, and
specimens from 55 cases were used for IHC staining. Information
regarding age, gender, TNM stage and pathological diagnosis,
including lymphatic and venous invasion were retrospectively
collected. The carcinomas at the time of primary tumor resection
were staged according to the Union for International Cancer Control
(UICC) TNM classification (the 7th classification) (18,19). Written
informed consent was obtained from all patients and the current
study was approved by the ethics committee of Fukushima Medical
University.
Comprehensive gene expression
analysis
DPEP1 expression data were obtained using custom
microarray analysis, as previously described (20). Briefly, the surgical specimen was
homogenized and mixed with ISOGEN® reagent (Nippon Gene
Co., Ltd., Tokyo, Japan). Total RNA was subjected to purification
of polyA(A)+ RNA using a MicroPoly(A)Purist kit (Thermo
Fisher Scientific, Inc., Waltham, MA, USA). Human reference RNA was
prepared by mixing equal quantities of poly(A)+ RNA
extracted from 22 human cancer cell lines (A431, A549, AKI,
HBL-100, HeLa, HepG2, HL60, IMR-32, Jurkat, K562, KP4, MKN7, NK-92,
Raji, RD, Saos-2, SK-N-MC, SW-13, T24, U251, U937 and Y79).
Synthetic polynucleotides (80-mers) representing
31,797 human transcripts (MicroDiagnostic, Inc., Tokyo, Japan) were
arrayed on aminosilane-coated glass slides with a custom-made
arrayer. RNA (2 µg) was subjected to reverse transcription using
SuperScript II (Thermo Fisher Scientific, Inc.). Sample RNA was
labeled using Cyanine 5-dUTP (PerkinElmer, Inc., Waltham, MA, USA)
and the reference RNA was labeled using Cyanine 3-dUTP.
Hybridization was performed with a Labeling and Hybridization kit
(MicroDiagnostic, Inc.). Signals were measured with a GenePix 4000B
scanner (Axon Instruments Inc., Union City, CA, USA) and processed
into primary expression ratios. The primary expression ratios were
then converted into log2 values and compiled into a
matrix. An expression ratio of 1 (log ratio of 0) was assigned for
spots that exhibited fluorescence intensities under the detection
limits, and these were included in the signal calculation of the
mean averages. Data were processed using MDI gene expression
analysis software package (MicroDiagnostic, Inc.).
RT-qPCR
Total RNA was extracted from cells using TRIzol
reagent (Thermo Fisher Scientific, Inc.) according to the
manufacturer's instructions. Complementary DNA (cDNA) was
synthesized from 5 µg of total RNA with a random hexamer using the
SuperScript III First-Strand Synthesis System (Thermo Fisher
Scientific, Inc.). These cDNAs were used for the measurement of
gene expression with a 7500 Real-time PCR system (Thermo Fisher
Scientific, Inc.) using TaqMan probes. The assessors were blinded
to the patient information and performed the experiments in
triplicate. Taqman expression assays, DPEP1 (Hs01116752_m1) and
β-actin (Hs99999903_m1) were purchased from Thermo Fisher
Scientific, Inc. and β-actin served as an internal control.
Relative DPEP1 gene expression was calculated using the
2−ΔΔCq method, according to the supplier's protocol
(Thermo Fisher Scientific, Inc.) (21).
Western blotting
Surgical specimens were homogenized in a 100-mM
Tris-HCl (pH 7.6) buffer containing 0.15 M NaCl, 5 mM EDTA, 1%
Triton X-100, and 5% glycerol using a Polytron PT3100 homogenizer
(Kinematica AG, Luzern, Switzerland). After centrifugation at
17,400 × g for 15 min at 4°C, the supernatants were
collected. Next, 20 µg of each protein sample was run on
SDS-polyacrylamide gels (5–15% gradient; Thermo Fisher Scientific,
Inc.) and blotted onto Immun-Blot PVDF membranes (Bio-Rad
Laboratories, Inc., Hercules, CA, USA). The blotted membranes were
incubated with the following primary antibodies overnight at 4°C:
Rabbit polyclonal anti-DPEP1 [(cat. no. HPA012783) Sigma-Aldrich;
Merck KGaA, Darmstadt, Germany] at a dilution of 1:100, and mouse
monoclonal anti-β-actin antibody (cat. no. sc-69879; Santa Cruz
Biotechnology, Inc., Dallas, TX, USA) served as a loading control
at a dilution of 1:2,500. The blotted membranes were subsequently
incubated with the appropriate horseradish peroxidase
(HRP)-conjugated goat-anti-mouse IgG secondary antibody (cat. no.
sc-2005; Santa Cruz Biotechnology, Inc.) at a dilution of 1:5,000.
Signals were detected using ImageQuant LAS4000 (GE Healthcare
Bio-Sciences, Pittsburgh, PA, USA) using SuperSignal West Pico
Chemiluminescent Substrate (Thermo Fisher Scientific, Inc.).
IHC staining and evaluation
IHC staining was performed on paraffin-embedded
histological sections (4-µm thick) using a polymer peroxidase
method. Briefly, after deparaffinization and rehydration, the
sections were treated with 0.3% hydrogen peroxide in methanol for
30 min to block endogenous peroxidase activity. Following rinsing
in phosphate-buffered saline (PBS) (Thermo Fisher Scientific,
Inc.), the sections were incubated with anti-DPEP1 antibody [cat.
no. HPA012783 (dilution, 1:2,000); Sigma-Aldrich; Merck KGaA], Dako
anti-E-cadherin antibody [cat. no. NCH-38 (dilution, 1:200);
Agilent Technologies GmbH, Waldbronn, Germany], and anti-Vimentin
antibody [cat. no. SP20 (dilution, 1:400); Nichirei Biosciences
Inc., Tokyo, Japan] at 4°C overnight. Three further washes (5 min
per wash) in PBS was followed by treatment with a
peroxidase-labeled polymer, conjugated to goat anti-rabbit
immunoglobulins [Dako EnVision+ System-HRP Labelled Polymer;
ready-to-use (cat. no. K4003) Dako; Agilent Technologies] as the
secondary antibody for 30 min at room temperature. The staining was
visualized with diaminobenzidine, followed by counterstaining with
hematoxylin. Expression of these proteins was evaluated as positive
when the nucleus of the cancerous tissue and the total field of
view were observed at a magnification of ×400. Blinded to the
origination of the features and clinical outcomes, the staining of
each specimen was evaluated. Stained cancer cells were counted per
1,000 cancer cells in the maximum field of cancer tissue by two
investigators. The rate of positively stained cells was classified
as follows: 0%, 0; 1–10%, 1; and 11–100%, 2, and the staining
intensity was scored as 0 (negative), 1 (weak) and 2 (strong). The
evaluation was expressed as a product of the score of positive rate
and staining intensity. Positive staining was defined by a score of
2, while negative staining was scored at 0 or 1.
Statistical analysis
Statistical analyses were performed using GraphPad
Prism 6 software (GraphPad Software, Inc., La Jolla, CA, USA).
Fisher's extract test or χ2 test were performed to
analze the contingency tables. In addition, the Mann-Whitney U test
was conducted for comparison of the means of the two groups. The
Kruskal-Wallis and one-way analysis of variance tests were used for
comparisons between more than two groups. P<0.05 was considered
to indicate a statistically significant difference and data are
presented as the mean ± standard deviation.
Results
DPEP1 expression levels in CRC
The expression level of DPEP1 mRNA in the current
cohort was determined using comprehensive gene expression analysis
data. The expression ratios of DPEP1 were compared between 78
tumorous tissue samples and 50 non-tumorous tissue samples. A
significantly higher DPEP1 expression level was identified in
tumorous tissue samples when compared with non-tumorous tissue
samples (Fig. 1A; P<0.0001). DPEP1
expression levels and clinicopathological factors were then
analyzed in the CRC specimens (Table
I). Cases with poorly differentiated histological types
(P=0.0001) and positive lymph node metastasis (P=0.024) showed
significantly higher DPEP1 expression levels. However, the DPEP1
expression level was not associated with gender, age, tumor size,
distant metastasis or stage. When the DPEP1 expression levels of
the stage 1, 2 and 3 cases were compared, DPEP1 expression was
observed to be significantly elevated in more advanced stage
tumors, which is consistent with a role for DPEP1 in cancer
progression (Fig. 1B; P=0.016).
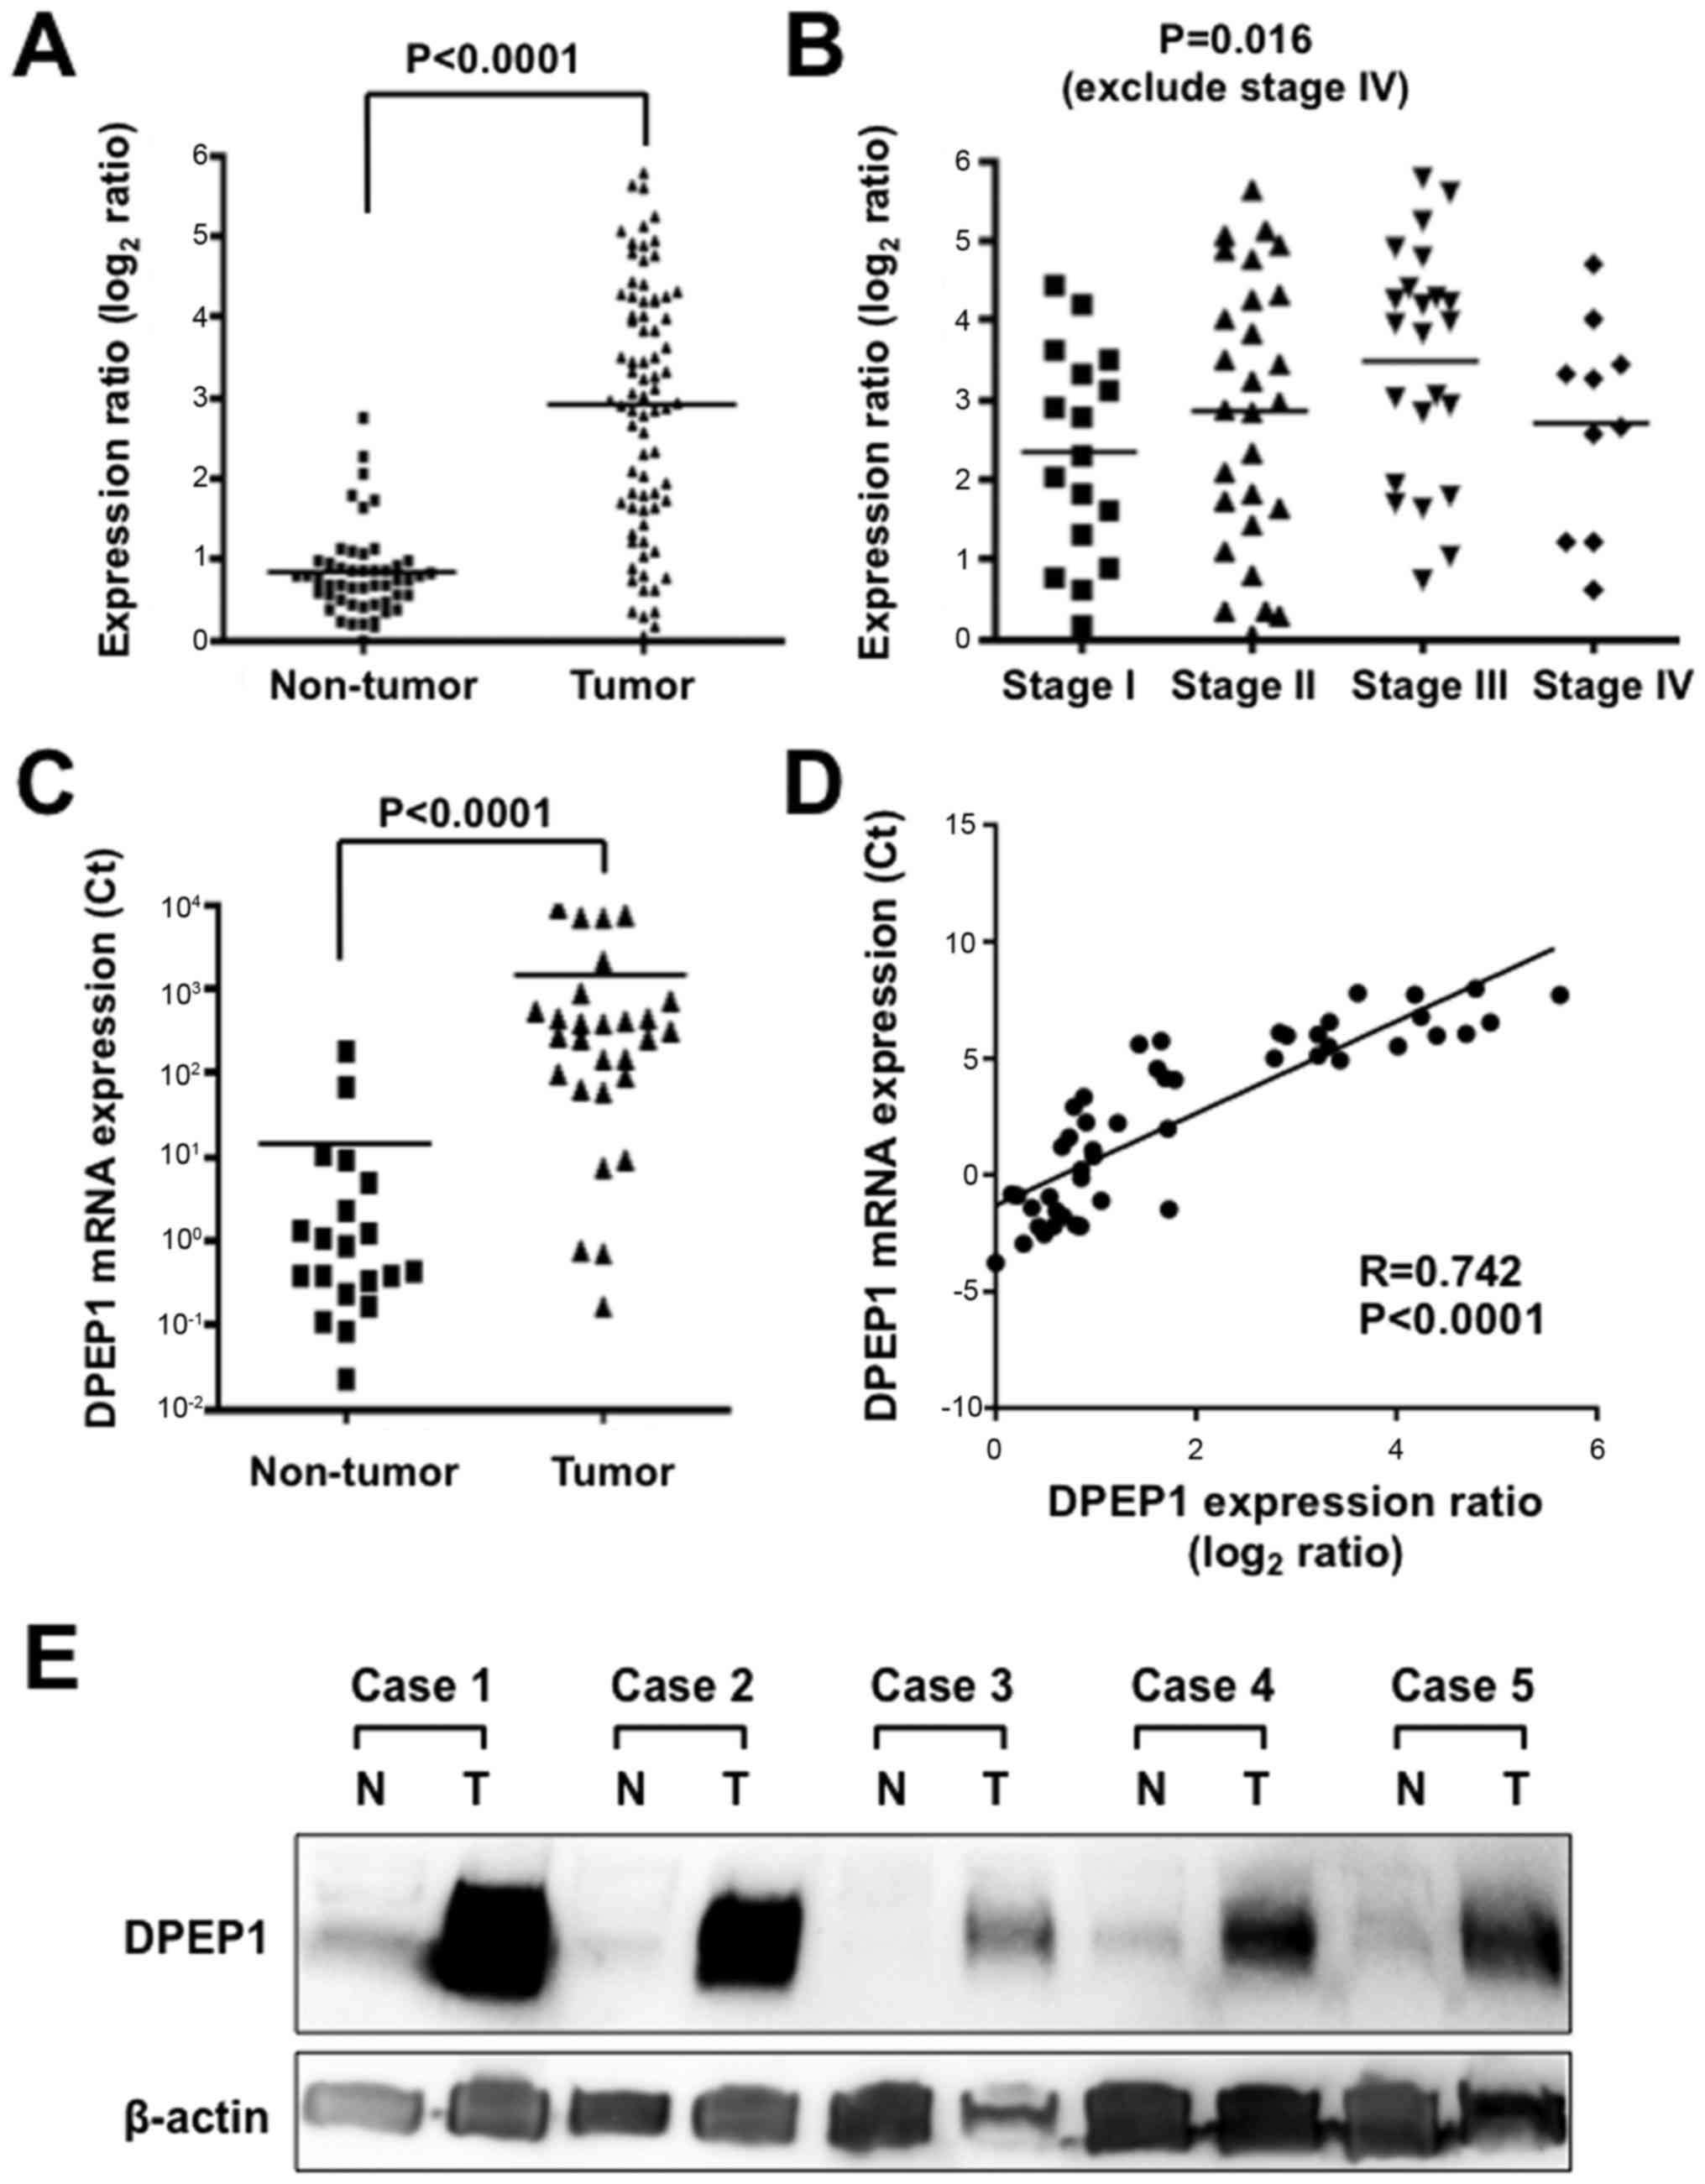 | Figure 1.Expression levels of DPEP1 in CRC
specimens. (A) Expression differences of DPEP1 between 78 tumorous
and 50 non-tumorous tissue samples from the CRC cohort. The dot
plot represents DPEP1 expression levels from microarray analysis,
and a log2 scale of expression levels is presented.
Horizontal bars indicate the mean expression values. P<0.0001,
Mann-Whitney U-test. (B) Expression differences of DPEP1 between
stage 1 (n=17), stage 2 (n=28) and stage 3 (n=23) (according to the
7th TNM classification) tumorous tissue samples from the CRC
cohort. The dot plot represents DPEP1 expression levels from
microarray analysis, and a log2 scale of the expression
levels is presented. Horizontal bars indicate mean expression
values. P=0.016, one-way analysis of variance test. (C) Expression
differences of DPEP1 between 28 tumorous and 20 non-tumorous tissue
samples from the CRC cohort. The dot plot represents DPEP1
expression levels from RT-qPCR analysis and the horizontal bars
indicate the mean expression values. P<0.0001, Mann-Whitney
U-test. (D) Correlation of DPEP1 mRNA expression between microarray
(x-axis) and RT-qPCR (y-axis) analyses in the CRC patients. (E)
Western blot analysis of DPEP1 in five representative paired
samples of non-tumorous and tumorous tissue from CRC cases. β-actin
served as a loading control. N, non-tumorous tissue; T, tumorous
tissue; DPEP1, dipeptidase 1; CRC, colorectal cancer; RT-qPCR,
reverse transcription-quantitative polymerase chain reaction. |
 | Table I.Clinicopathological factors and DPEP1
mRNA expression levels (n=78). |
Table I.
Clinicopathological factors and DPEP1
mRNA expression levels (n=78).
| Characteristic | n | DPEP1 mRNA expression
ratio | P-value |
|---|
| Age, years |
|
| 0.188 |
|
<65 | 31 | 3.2±1.4 |
|
| ≥65 | 47 | 2.7±1.6 |
|
| Gender |
|
| 0.346 |
| Male | 53 | 3.0±1.6 |
|
|
Female | 25 | 2.7±1.5 |
|
| TNM
classificationa |
|
| 0.117 |
| I | 17 | 2.3±1.3 |
|
| II | 28 | 2.8±1.7 |
|
| III | 23 | 3.5±1.5 |
|
| IV | 10 | 2.7±1.3 |
|
| Histology |
|
| <0.0001 (tub1 vs.
tub2) |
|
Tub1b | 33 | 2.3±1.3 |
|
|
Tub2c | 37 | 3.7±1.4 |
|
|
Otherd | 8 | 1.6±1.3 |
|
| Lymph node
metastasis |
|
| 0.024 |
|
Absent | 49 | 2.6±1.5 |
|
|
Present | 29 | 3.4±1.4 |
|
| Distant
metastasis |
|
| 0.435 |
|
Absent | 74 | 2.9±1.5 |
|
|
Present | 4 | 2.3±1.6 |
|
To further confirm the DPEP1 expression levels in
CRC, RT-qPCR was performed for 28 randomly-selected samples of
tumorous tissue and 20 samples of non-tumorous tissue from the
cases used in Fig. 1A. DPEP1 mRNA
expression was confirmed to be upregulated in tumorous tissue
samples compared with non-tumorous tissue samples (Fig. 1C; P<0.0001). In addition, this DPEP1
mRNA expression data was positively correlated with the data from
comprehensive gene expression analysis (R=0.742, P<0.0001),
confirming the reliability of the microarray data (Fig. 1D).
In addition, DPEP1 protein expression was analyzed
by western blotting in five representative non-tumorous/tumorous
CRC tissue samples that showed high levels of DPEP1 mRNA expression
(Fig. 1E). Consistent with the RT-qPCR
results, DPEP1 protein was highly expressed in the tumorous tissue
samples when compared with non-tumorous tissue samples. These
results demonstrate the upregulation of DPEP1 mRNA, which resulted
in the upregulation of DPEP1 protein expression.
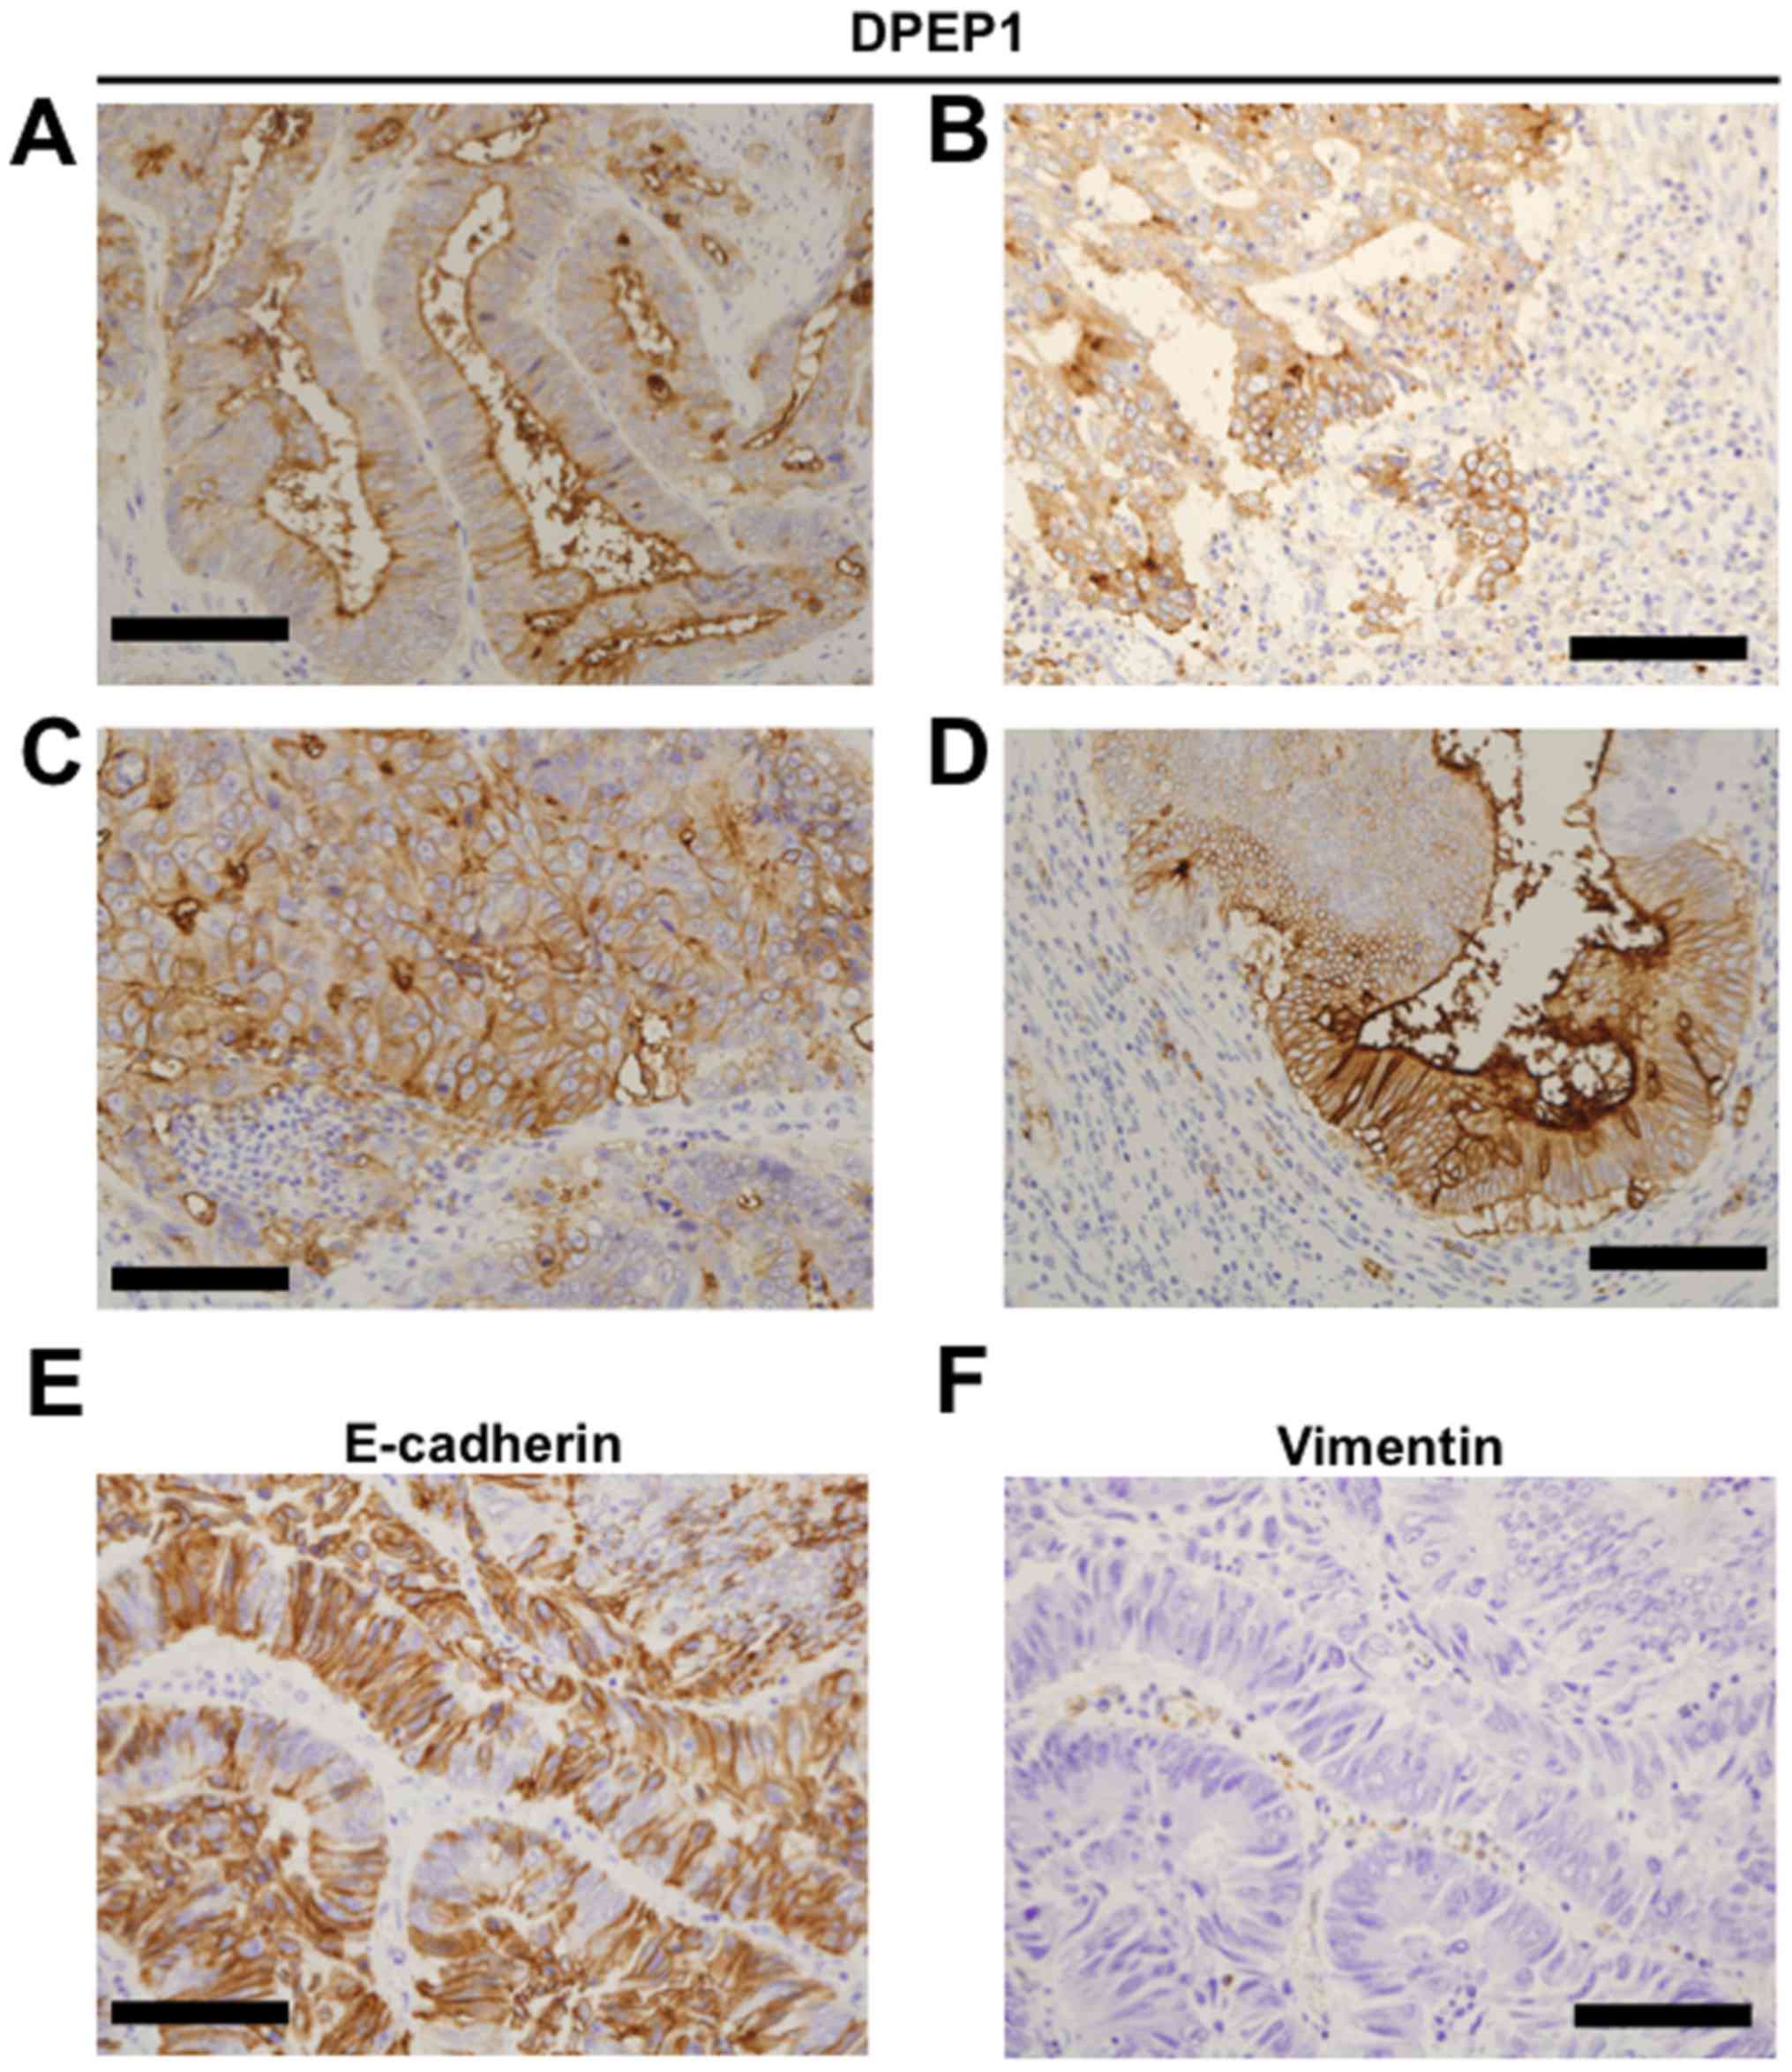
IHC staining for DPEP1 and EMT
markers
To investigate DPEP1 protein expression, IHC
staining for DPEP1 was performed in 55 CRC specimens. Positive
staining for DPEP1 at the apical cell surface (Fig. 2A), cytoplasm (Fig. 2B) or circumference of malignant cells
(Fig. 2C) was observed in each of the
CRC specimens. In addition, mixed patterns of the above
localizations were observed in the specimens (Fig. 2D). As a result, the DPEP1 expression
was observed to be positive in 45 cases (82%) and negative in 10
cases (18%). Based on the DPEP1 IHC staining intensity, the
association between DPEP1 expression levels and clinicopathological
factors was analyzed in the CRC patients (Table II). Consistent with the DPEP1 mRNA
analysis, the positive expression rate of DPEP1 was significantly
correlated with a poorer histology (P=0.021). However, DPEP1
expression was not associated with gender, age, lymph node
metastasis, distant metastasis, or TNM stage classification.
| Table II.Clinicopathological factors and DPEP1
expression levels (n=55) observed by IHC staining. |
Table II.
Clinicopathological factors and DPEP1
expression levels (n=55) observed by IHC staining.
|
|
| DPEP1 IHC
staining |
|
|---|
|
|
|
|
|
|---|
| Characteristic | n | Positive, n=45
(%) | Negative, n=10
(%) | P-value |
|---|
| Age, years |
|
|
| 0.056 |
|
<65 | 23 | 22 (48.9) | 1 (10.0) |
|
|
≥65 | 32 | 23 (51.1) | 9 (90.0) |
|
| Gender |
|
|
| 0.780 |
|
Male | 35 | 29 (64.4) | 6 (60.0) |
|
|
Female | 19 | 16 (35.6) | 4 (40.0) |
|
| TNM
classificationa |
|
|
| 0.086 |
| I | 14 | 10 (22.2) | 4 (40.0) |
|
| II | 18 | 14 (31.1) | 4 (40.0) |
|
|
III | 16 | 15 (33.3) | 1 (10.0) |
|
| IV | 7 | 6
(13.3) | 1 (10.0) |
|
| Histology |
|
|
| 0.021 (tub1 vs.
tub2) |
|
Tub1b | 24 | 17 (37.8) | 7 (70.0) |
|
|
Tub2c | 26 | 25 (55.6) | 1 (10.0) |
|
|
Otherd | 5 | 3 (6.7) | 2 (20.0) |
|
| Lymph node
metastasis |
|
|
| 0.231 |
|
Absent | 33 | 25 (55.6) | 8 (80.0) |
|
|
Present | 22 | 20 (44.4) | 2 (20.0) |
|
| Distant
metastasis |
|
|
| 1.000 |
|
Absent | 48 | 39 (86.7) | 9 (90.0) |
|
|
Present | 7 | 6
(13.3) | 1 (10.0) |
|
The expression levels of EMT markers, E-cadherin and
Vimentin were observed in patients with CRC (Fig. 2E and F) and the impact of DPEP1
expression on EMT markers (Table
III) was evaluated. However, EMT status was not identified to
be associated with DPEP1 expression levels in the present
study.
| Table III.Epithelial to mesenchymal transition
status and DPEP1 mRNA expression levels in colorectal cancer
patients (n=51). |
Table III.
Epithelial to mesenchymal transition
status and DPEP1 mRNA expression levels in colorectal cancer
patients (n=51).
| Immunohistochemical
staining |
|
|
|---|
|
|
|
|---|
| E-cadherin | Vimentin | n | DPEP1 mRNA
expression ratio (means ± standard deviation) |
| Positive | Positive | 0 | - |
| Positive | Negative | 45 | 2.9±2.0 |
| Negative | Positive | 0 | - |
| Negative | Negative | 6 | 3.1±1.4 |
Discussion
In the present study, the tumor expression of DPEP1
was identified to be upregulated at the mRNA and protein levels in
CRC. Increased DPEP1 mRNA expression levels were identified to be
associated with positive lymph node metastasis and poorer tumor
histology in CRC patients. Furthermore, in the IHC staining
analysis, upregulated DPEP1 expression was associated with poorer
tumor histology. These findings were consistent with previous
studies demonstrating that DPEP1 is highly expressed in CRC
compared with matched normal mucosa, indicating a significant role
of DPEP1 in CRC development (16,17). While
the current results indicate the oncogenic role of DPEP1 in CRC, no
significant associations between DPEP1 expression levels and
patient prognosis, as well as EMT status, were observed in the
current cohort.
The associations between EMT status and DPEP1 levels
were investigated in a CRC in the present study. The results are
inconsistent with those of a recent study, indicating that DPEP1
promotes CRC metastasis through regulation of E-cadherin expression
(17). E-cadherin is a transmembrane
protein and acts as an anchor between neighboring cells to form
adherens junctions (7,22). Therefore, it is reasonable that loss of
E-cadherin promotes cancer metastasis. In addition to E-cadherin,
Vimentin and neural (N-) cadherin serve as classical EMT markers
for diagnosing whether tumor cells are an epithelial phenotype or
mesenchymal phenotype. It is well known that downregulation of
E-cadherin, and upregulation of Vimentin and N-cadherin are key
markers for EMT, and that re-upregulation of E-cadherin is a key
marker for MET and is also a necessary process of metastasis
(6).
EMT and MET are regulated by multiple modulators,
such as transcription factors, epigenetic modifications,
alternative splicing, and miRNA networks (6,7).
Transcription factors, such as snail family transcriptional
repressor 1, snail family transcriptional repressor 2, twist family
bHLH transcription factor 1, zinc finger E-box binding homeobox 1
and zinc finger E-box binding homeobox 2, have previously been
investigated (7). Furthermore, there
are continued efforts to identify a novel EMT regulator to further
understand cancer progression and metastasis via an EMT process
(23). However, as the EMT process may
be a ‘druggable’ target by specific inhibitors, candidate
therapeutic targets are being developed. Sorafenib is one example
of a drug that inhibits EMT via histone modifications that occur
during EMT in lung adenocarcinoma cell lines (24). Currently, sorafenib is used for cases
with an activating mutation of A-Raf proto-oncogene,
serine/threonine kinase (25); with
further research, sorafenib may be administered to CRC patients. In
addition, an activating mutation in fibroblast growth factor
receptor 4, which enhances EMT in colon cancer cells, is also
hypothesized to be a therapeutic target of specific inhibitors for
CRC (26,27). Further experimental studies or mice
studies investigating the functional role of DPEP1 are required to
reveal whether DPEP1 may be a candidate therapeutic target for
CRC.
In conclusion, the current study revealed that the
level of DPEP1 expression was significantly increased in tumorous
cells, and no positive correlation was observed between DPEP1 and
EMT markers. The present results prompt further investigations into
the efficacy of DPEP1 as a biomarker or therapeutic target in
CRC.
Acknowledgements
The present study was partially supported by grants
for translational research programs from the New Energy and
Industrial Technology Development Organization (Tokyo, Japan).
References
|
1
|
Siegel RL, Miller KD and Jemal A: Cancer
statistics, 2016. CA Cancer J Clin. 66:7–30. 2016. View Article : Google Scholar : PubMed/NCBI
|
|
2
|
Brenner H, Kloor M and Pox CP: Colorectal
cancer. Lancet. 383:1490–1502. 2014. View Article : Google Scholar : PubMed/NCBI
|
|
3
|
Mayer RJ, Venook AP and Schilsky RL:
Progress against GI cancer during the American Society of Clinical
Oncology's first 50 years. J Clin Oncol. 32:1521–1530. 2014.
View Article : Google Scholar : PubMed/NCBI
|
|
4
|
Venook AP, Weiser MR and Tepper JE:
Colorectal cancer: All hands on deck. Am Soc Clin Oncol Educ Book.
34:83–89. 2014. View Article : Google Scholar
|
|
5
|
Watanabe T, Itabashi M, Shimada Y, Tanaka
S, Ito Y, Ajioka Y, Hamaguchi T, Hyodo I, Igarashi M, Ishida H, et
al: Japanese Society for Cancer of the Colon and Rectum: Japanese
Society for Cancer of the Colon and Rectum (JSCCR) Guidelines 2014
for treatment of colorectal cancer. Int J Clin Oncol. 20:207–239.
2015. View Article : Google Scholar : PubMed/NCBI
|
|
6
|
Nieto MA, Huang RY, Jackson RA and Thiery
JP: Emt: 2016. Cell. 166:21–45. 2016. View Article : Google Scholar : PubMed/NCBI
|
|
7
|
Lamouille S, Xu J and Derynck R: Molecular
mechanisms of epithelial-mesenchymal transition. Nat Rev Mol Cell
Biol. 15:178–196. 2014. View
Article : Google Scholar : PubMed/NCBI
|
|
8
|
Heerboth S, Housman G, Leary M, Longacre
M, Byler S, Lapinska K, Willbanks A and Sarkar S: EMT and tumor
metastasis. Clin Transl Med. 4:62015. View Article : Google Scholar : PubMed/NCBI
|
|
9
|
Bae KM, Parker NN, Dai Y, Vieweg J and
Siemann DW: E-cadherin plasticity in prostate cancer stem cell
invasion. Am J Cancer Res. 1:71–84. 2011.PubMed/NCBI
|
|
10
|
Nakagawa H, Inazawa J, Inoue K, Misawa S,
Kashima K, Adachi H, Nakazato H and Abe T: Assignment of the human
renal dipeptidase gene (DPEP1) to band q24 of chromosome 16.
Cytogenet Cell Genet. 59:258–260. 1992. View Article : Google Scholar : PubMed/NCBI
|
|
11
|
Jeong CH, Bode AM, Pugliese A, Cho YY, Kim
HG, Shim JH, Jeon YJ, Li H, Jiang H and Dong Z: [6]-Gingerol
suppresses colon cancer growth by targeting leukotriene A4
hydrolase. Cancer Res. 69:5584–5591. 2009. View Article : Google Scholar : PubMed/NCBI
|
|
12
|
Bellamkonda K, Chandrashekar NK, Osman J,
Selvanesan BC, Savari S and Sjölander A: The eicosanoids
leukotriene D4 and prostaglandin E2 promote the tumorigenicity of
colon cancer-initiating cells in a xenograft mouse model. BMC
Cancer. 16:4252016. View Article : Google Scholar : PubMed/NCBI
|
|
13
|
Austruy E, Cohen-Salmon M, Antignac C,
Béroud C, Henry I, Nguyen VC, Brugières L, Junien C and Jeanpierre
C: Isolation of kidney complementary DNAs down-expressed in Wilms'
tumor by a subtractive hybridization approach. Cancer Res.
53:2888–2894. 1993.PubMed/NCBI
|
|
14
|
Zhang G, Schetter A, He P, Funamizu N,
Gaedcke J, Ghadimi BM, Ried T, Hassan R, Yfantis HG, Lee DH, et al:
DPEP1 inhibits tumor cell invasiveness, enhances chemosensitivity
and predicts clinical outcome in pancreatic ductal adenocarcinoma.
PLoS One. 7:e315072012. View Article : Google Scholar : PubMed/NCBI
|
|
15
|
Green AR, Krivinskas S, Young P, Rakha EA,
Paish EC, Powe DG and Ellis IO: Loss of expression of chromosome
16q genes DPEP1 and CTCF in lobular carcinoma in situ of the
breast. Breast Cancer Res Treat. 113:59–66. 2009. View Article : Google Scholar : PubMed/NCBI
|
|
16
|
Eisenach PA, Soeth E, Röder C, Klöppel G,
Tepel J, Kalthoff H and Sipos B: Dipeptidase 1 (DPEP1) is a marker
for the transition from low-grade to high-grade intraepithelial
neoplasia and an adverse prognostic factor in colorectal cancer. Br
J Cancer. 109:694–703. 2013. View Article : Google Scholar : PubMed/NCBI
|
|
17
|
Park SY, Lee SJ, Cho HJ, Kim TW, Kim JT,
Kim JW, Lee CH, Kim BY, Yeom YI, Lim JS, et al: Dehydropeptidase 1
promotes metastasis through regulation of E-cadherin expression in
colon cancer. Oncotarget. 7:9501–9512. 2016.PubMed/NCBI
|
|
18
|
Sobin LH and Compton CC: TNM seventh
edition: what's new, what's changed: communication from the
International Union Against Cancer and the American Joint Committee
on Cancer. Cancer. 116:5336–5339. 2010. View Article : Google Scholar : PubMed/NCBI
|
|
19
|
International Union Against Cancer (UICC),
. TNM Classification of Malignant Tumors. Sobin LH, Gospodarowicz
MK and Wittekind C: 7th edition. Wiley-Blackwell; Oxford, UK:
2009
|
|
20
|
Okabe N, Ezaki J, Yamaura T, Muto S, Osugi
J, Tamura H, Imai J, Ito E, Yanagisawa Y, Honma R, et al: FAM83B is
a novel biomarker for diagnosis and prognosis of lung squamous cell
carcinoma. Int J Oncol. 46:999–1006. 2015.PubMed/NCBI
|
|
21
|
Livak KJ and Schmittgen TD: Analysis of
relative gene expression data using real-time quantitative PCR and
the 2(−Delta Delta C(T)) Method. Methods. 25:402–408. 2001.
View Article : Google Scholar : PubMed/NCBI
|
|
22
|
Thiery JP, Acloque H, Huang RY and Nieto
MA: Epithelial-mesenchymal transitions in development and disease.
Cell. 139:871–890. 2009. View Article : Google Scholar : PubMed/NCBI
|
|
23
|
Shao DD, Xue W, Krall EB, Bhutkar A,
Piccioni F, Wang X, Schinzel AC, Sood S, Rosenbluh J, Kim JW, et
al: KRAS and YAP1 converge to regulate EMT and tumor survival.
Cell. 158:171–184. 2014. View Article : Google Scholar : PubMed/NCBI
|
|
24
|
Zhang J, Chen YL, Ji G, Fang W, Gao Z, Liu
Y, Wang J, Ding X and Gao F: Sorafenib inhibits
epithelial-mesenchymal transition through an epigenetic-based
mechanism in human lung epithelial cells. PLoS One. 8:e649542013.
View Article : Google Scholar : PubMed/NCBI
|
|
25
|
Imielinski M, Greulich H, Kaplan B, Araujo
L, Amann J, Horn L, Schiller J, Villalona-Calero MA, Meyerson M and
Carbone DP: Oncogenic and sorafenib-sensitive ARAF mutations in
lung adenocarcinoma. J Clin Invest. 124:1582–1586. 2014. View Article : Google Scholar : PubMed/NCBI
|
|
26
|
Liu R, Li J, Xie K, Zhang T, Lei Y, Chen
Y, Zhang L, Huang K, Wang K, Wu H, et al: FGFR4 promotes
stroma-induced epithelial-to-mesenchymal transition in colorectal
cancer. Cancer Res. 73:5926–5935. 2013. View Article : Google Scholar : PubMed/NCBI
|
|
27
|
Hagel M, Miduturu C, Sheets M, Rubin N,
Weng W, Stransky N, Bifulco N, Kim JL, Hodous B, Brooijmans N, et
al: First Selective Small Molecule Inhibitor of FGFR4 for the
Treatment of Hepatocellular Carcinomas with an Activated FGFR4
Signaling Pathway. Cancer Discov. 5:424–437. 2015. View Article : Google Scholar : PubMed/NCBI
|