Introduction
The budding yeast, Saccharomyces cerevisiae,
has been used to make bread and beer for thousands of years. As a
single-cell organism, budding yeast has been extensively
investigated in genetics and physiology as a model system for
eukaryotes, due to its well-annotated genome and short life cycle
(1). Completion of the budding yeast
genome sequencing project helped to determine a total of 6,275
genes on 16 chromosomes (12 million base pairs). Yeast possesses
23% homologous genes to humans; therefore, it is considered as a
useful model for gene function studies (2). Although yeast and human diverged from a
common ancestor ~1 billion years ago, lines of evidence demonstrate
the strong conservation of gene function between yeast and humans
(3).
The advancement of cDNA array technology and its low
cost make genome-wide gene expression analysis possible. There are
many transcriptome data of budding yeast in public databases,
including gene expression data from different nutritional
conditions, growth stages and gene knock-out models (4). A task for bioinformaticians is to
reanalyze these large-scale microarray data and next-generation
sequencing data, and identifying the hidden information within
these databases. Systems biology studies use high-throughput data
and mathematical models to construct yeast transcriptional, gene
regulation and protein interaction networks (5,6). The current
study used the Google Scholar search engine (https://scholar.google.com/) and, to the best of our
knowledge, weighted gene co-expression network analysis (WGCNA) has
not been applied to budding yeast. Using WGCNA to construct a yeast
gene co-expression network has many advantages. Firstly, individual
experiments may lose meaningful biological information due to
relatively small sample sizes and different statistical methods.
Pooling datasets from studies helps to strengthen statistical
power. Secondly, the gene co-expression analysis reduces
high-dimensional genome-wide gene expression to only tens of
modules, which simplifies the depiction of yeast biology functions.
Thirdly, functionally unknown genes are inferred from co-expressed
gene modules by the principle of guilt by association (7). Finally, the current analysis may provide
a paradigm for single-cell microorganism.
The aim of the present study was to construct a
budding yeast gene co-expression network and identify functional
modules that may represent different aspects of yeast biological
function. It is hypothesized that certain highly connected genes
may be involved in module function. The conservation of these
modules is further validated in human tumor cells, some of which
may differentiate the survival times of separate patients into long
and short.
Materials and methods
Microarray data processing
Yeast microarray data were downloaded from Gene
Expression Omnibus (GEO) (http://ncbi.nlm.nih.gov/gds) (8). Detailed information of the 218 gene
expression datasets used in the current study are available at
Online Resource 1 (http://bioinformatics.fafu.edu.cn/Downloads.html).
To simplify the data analysis procedure and to enhance
reproducibility, only 2,814 budding samples from experiments run on
Affymetrix Yeast Genome 2.0 Array (Thermo Fisher Scientific, Inc.,
Waltham, MA, USA) were included. Datasets from fission yeast was
excluded. Expression Console (version 1.2) (Affymetrix, Inc., Santa
Clara, CA, USA) was used to process raw data. Probe level
expression data were extracted using the MAS5.0 method and
normalized using the DNAMR package (http://www.rci.rutgers.edu/~cabrera/DNAMR).
Weighted gene co-expression network
construction and module detection
Signed network was constructed according to WGCNA
protocols (9–11). The WGCNA R function was implemented
using the following parameters: power=12, minModuleSize=30,
deepSplit=4, networkType=‘signed’. Briefly, Pearson correlation
coefficients were calculated for all pair-wise comparisons of the
probes across all samples. The resulting correlation matrix was
converted into a matrix of connection strengths (that is, an
adjacency matrix) using the power function αij =
[0.5+0.5 × cor(xi,
xj)]β where xi and
xj are the i th and j th probe
expression, which resulted in a weighted network. Then topological
overlap measure (TOM) was calculated as follows:
TOM=Σu≠i,jaiuauj+aijmin(k.totali,k.totalj)+1–aij
Calculation of 1-TOM was performed as a biologically
meaningful measure of node similarity, representing how close the
neighbors of probe 1 were to the neighbors of probe 2. Probes were
hierarchically clustered using 1-TOM as the distance and modules
were determined by choosing a height cutoff of 0.995 for the
resulting dendrogram. Highly similar modules were identified by
clustering and merged together using a dynamic tree-cutting
algorithm (7). The module eigengene
(ME) corresponds to the first principal component of a given module
and is calculated as follows: ME =
princomp(xil(q)), where i corresponds
to module probes and l represents microarray samples in module q.
This may be considered as the most representative probe expression
in a module. Module membership (MM or kME) for each
probe in each module refers to the Pearson correlation between the
expression level of the probe and ME (7). MM was calculated by
Kcor,i(q) =
cor(xi,E(q)), where
xi is the profile of node i and
E(q) is the ME of module q. Hub genes were
defined as corresponding probes that have high module membership
values within a module (11). The
stability of each module was evaluated by sampling 1,407 samples
from all 2,814 samples 1,000 times. Correlation between
connectivity calculated from the sampled samples and the original
samples was represented as the mean ± standard deviation.
Gene ontology (GO) and pathway
enrichment analysis
GO enrichment and Kyoto Encyclopedia of Genes and
Genomes pathway analysis for network modules were performed using
the Database for Annotation, Visualization and Integrated Discovery
(DAVID 6.7, https://david-d.ncifcrf.gov) with the background list
of all genes on the array (12–14). In
DAVID, the overrepresentation of a term is defined as a modified
Fisher's exact P-value with an adjustment for multiple tests using
the Benjamini-Hochberg method (15).
Survival analysis
A human breast cancer dataset, GSE31448, colorectal
cancer dataset, GSE17536, and sarcoma dataset, GSE21050 were
downloaded from the NCBI GEO database. Raw files were processed
using the Affymetrix Expression Console. The yeast module genes
were mapped to human genes using the NCBI HomoloGene system
(https://www.ncbi.nlm.nih.gov/homologene). To obtain
the module expression value MEs, the three disease gene expression
datasets were projected to yeast modules according to homologous
genes. Patients were then separated into two groups with high and
low MEs. Survival analysis was conducted to compare the survival
time difference in R using the survival package. P-values for
survival curves were determined from the Kaplan-Meier survival
curves by use of the log-rank test.
Results
WGCNA
A large budding yeast gene co-expression network was
constructed in the present study, to the best of our knowledge, for
the first time. WGCNA identified 17 modules, which contained genes
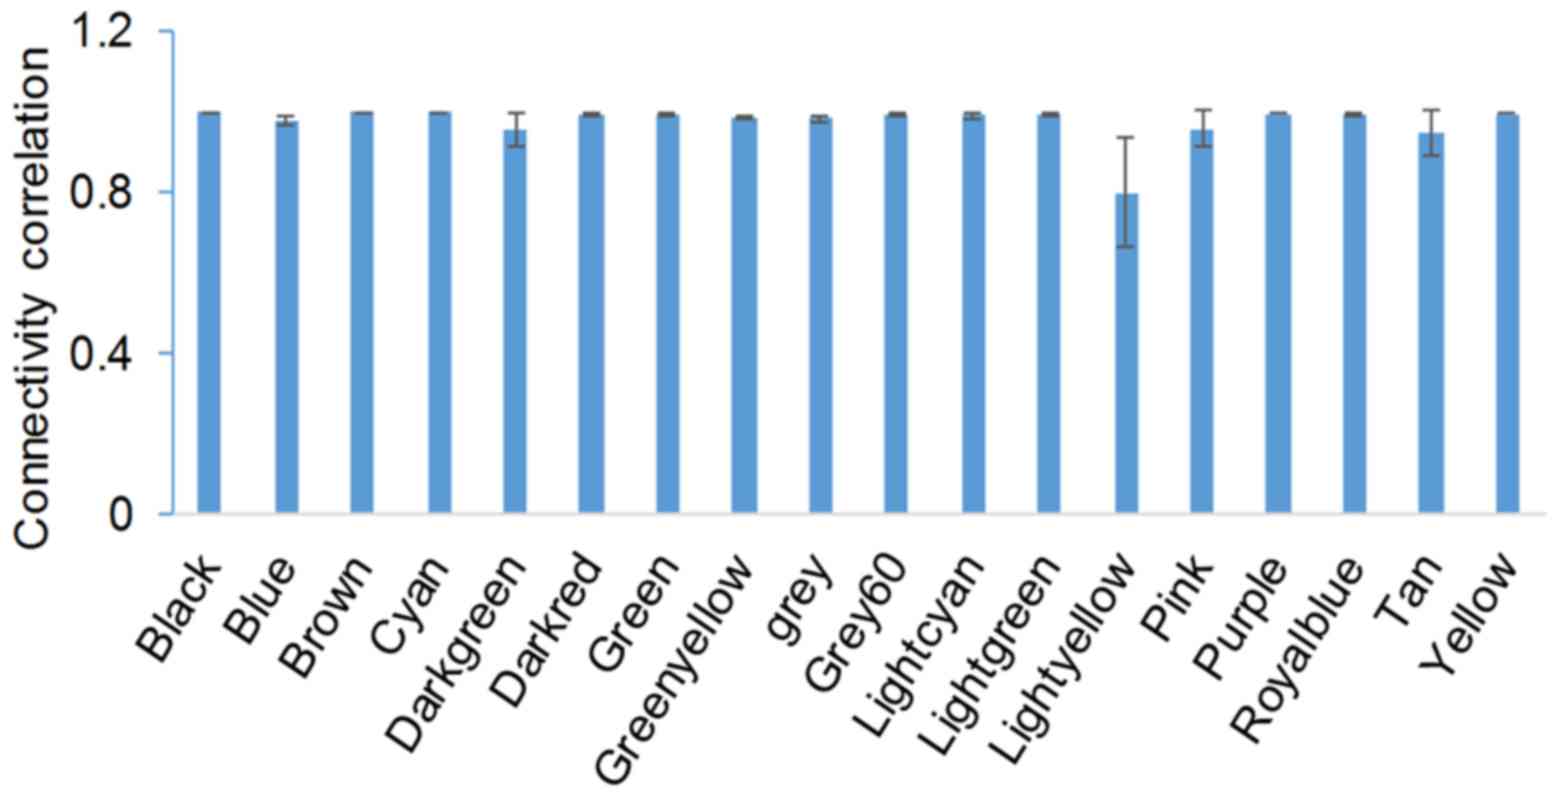
with similar expression patterns. To evaluate the stability of
modules, gene connectivity was correlated before and after sampling
(Fig. 1). Module stability was
expressed as the correlation of intramodule connectivity between
the original and sampled module. The average correlation was
>0.8. Module Cyan was the most stable module, and module
Lightyellow was the least stable (Fig.
1). All gene modules and corresponding connectivity data are
provided in Online Resource 2 (http://bioinformatics.fafu.edu.cn/Downloads.html).
Modules are involved in different
functions
To identify modular features, DAVID was used to
characterize module genes (Table I).
All the modules were associated with distinct biological functions,
representing aspects of yeast cell function. Module yellow is
enriched with genes associated with ncRNA processing, which
predominantly localize in the nucleolus. Both modules cyan and
green-yellow were associated with mitochondria, while module cyan
encodes proteins involved with oxidative phosphorylation on
mitochondrial membranes, and module green-yellow encodes
mitochondrial ribosome proteins.
 | Table I.GO and KEGG annotation of the
identified 17 gene co-expression modules in Saccharomyces
cerevisiae. |
Table I.
GO and KEGG annotation of the
identified 17 gene co-expression modules in Saccharomyces
cerevisiae.
|
| GO term
(Benjamini-Hochberg adjusted P-value) |
|
|---|
|
|
|
|
|---|
| Module (no.
genes) | Biological
process | Cellular
component | Molecule
function | KEGG
(Benjamini-Hochberg adjusted P-value) |
|---|
| Black (277) | Response to heat
(1E-45) | Plasma membrane
(6E-11) | Aldehyde reductase
activity (9E-4) | Sucrose metabolism
(7E-7) |
| Blue (935) | Cell cycle phase
(8E-10) | Chromosome
(1E-8) | Protein kinase
activity (5E-2) | Cell cycle
(4E-12) |
| Brown (796) | Regulation of
translation (4E-27) | Cytosolic ribosome
(1E-80) | Structural
constituent of ribosome (5E-39) | Ribosome (5E-66) |
| Cyan (111) | Oxidative
phosphorylation (2E-38) | Mitochondrial
(4E-41) | Hydrogen ion
transmembrane transporter activity(4E-29) | Oxidative
phosphorylation (4E-31) |
| Dark green (37) | M phase of meiotic
cell cycle (2E-22) | Condensed nuclear
chromosome (3E-10) | Structure-specific
DNA binding (1E-04) | Meiosis (7E-7) |
| Dark red (49) | Amino acid
biosynthesis (2E-23) | Glycine cleavage
complex (7E-3) | Oxidoreductase
activity, acting on the CH-NH2 group of donors, disulfide as
acceptor (3E-2) | Arginine and proline
metabolism (3E-3) |
| Green (736) | Autophagy
(1E-19) | Vacuole (5E-4) | Transcription
regulator activity (9E-4) |
|
| Green yellow
(135) | Mitochondrial
translation (7E-98) | Mitochondrial
ribosome (7-E101) | Structural
constituent of ribosome (8E-69) | Aminoacyl-tRNA
biosynthesis (8E-7) |
| Grey 60 (84) | Steroid metabolism
(1E-5) | Intrinsic to
membrane (5E-7) | O-acyltransferase
activity (1E-3) |
|
| Light cyan
(85) | Ubiquitin-dependent
protein metabolism (1E-38) | Proteasome
(2E-58) | Threonine-type
endopeptidase activity (3E-21) | Proteasome
(2E-50) |
| Light green
(187) | Protein amino acid
glycosylation (2E-13) | Intrinsic to
membrane (4E-34) | Mannosyltransferase
activity(1E-3) | N-Glycan
biosynthesis (5E-9) |
| Light yellow
(57) | Oligosaccharide
metabolic process (3E-4) |
|
|
|
| Pink (194) | Sporulation
(5E-4) |
|
|
|
| Purple (143) | Organic acid
catabolic process (4E-11) | Microbody
(3E-17) | Ligase activity,
forming carbon-sulfur bonds (2E-2) | Glyoxylate and
dicarboxylate metabolism (5E-6) |
| Royal blue
(52) | Sulfur metabolism
(2E-25) |
| Sulfur amino acid
transmembrane transporter activity (6E-5) | Sulfur metabolism
(5E-10) |
| Tan (1851) | Monosaccharide
catabolic process (3E-2) | Cytosolic ribosome
(2E-10) | Structural
constituent of ribosome (9E-5) | Ribosome
(3E-10) |
| Yellow (666) | ncRNA processing
(1E-100) | Nucleolus
(2E-128) | DNA-directed RNA
polymerase activity (2E-14) | Pyrimidine
metabolism (9E-16) |
Functions of module hub genes
In a network biology, genes do not contribute
equally to a module. Those genes with higher connectivity may exert
more significant roles in a module. To establish the functional
annotation of those genes, the top hub genes were screened to
examine their functions (16). For
example, module blue was enriched in cell cycle-associated genes.
The top hub gene of the module was YDR506C, which contributes to
nuclear division and genome integrity (17,18). The
results are presented in Table
II.
| Table II.Hub genes and their encoding proteins
of the gene co-expression modules in Saccharomyces
cerevisiae. |
Table II.
Hub genes and their encoding proteins
of the gene co-expression modules in Saccharomyces
cerevisiae.
| Module | Gene | Encoding
protein |
|---|
| Black | DCS2 | Protein DCS2 |
| Blue | YDR506C | Putative
multicopper oxidase YDR506C |
| Brown | RPL22A | 60S ribosomal
protein L22-A |
| Cyan | SDH2 | Succinate
dehydrogenase [ubiquinone] iron-sulfur subunit, mitochondrial |
| Dark green | IME2 | Meiosis induction
protein kinase IME2/SME1 |
| Dark red | ARG7 | Arginine
biosynthesis bifunctional protein ARG7, mitochondrial |
| Green | GPX1 | Glutathione
peroxidase 1 |
| Green yellow | MRPL49 | 54S ribosomal
protein L49, mitochondrial |
| Grey 60 | PAU5 | Seripauperin-5;
Seripauperin-7 |
| Light cyan | RPT4 | 26S protease
subunit RPT4 |
| Light green | ALG8 | Dolichyl
pyrophosphate Glc1Man9GlcNAc2 alpha-1,3-glucosyltransferase |
| Light yellow | PRP39 | Pre-mRNA-processing
factor 39 |
| Pink | MER1 | Meiotic
recombination 1 protein |
| Purple | FOX2 | Peroxisomal
hydratase-dehydrogenase-epimerase |
| Royal blue | MET16 |
Phosphoadenosinephosphosulfate
reductase |
| Tan | SPBC947.09 | Uncharacterized
protein C947.09 |
| Yellow | RPF2 | Ribosome biogenesis
protein RPF2 |
Module conservation in human cancer
cell lines
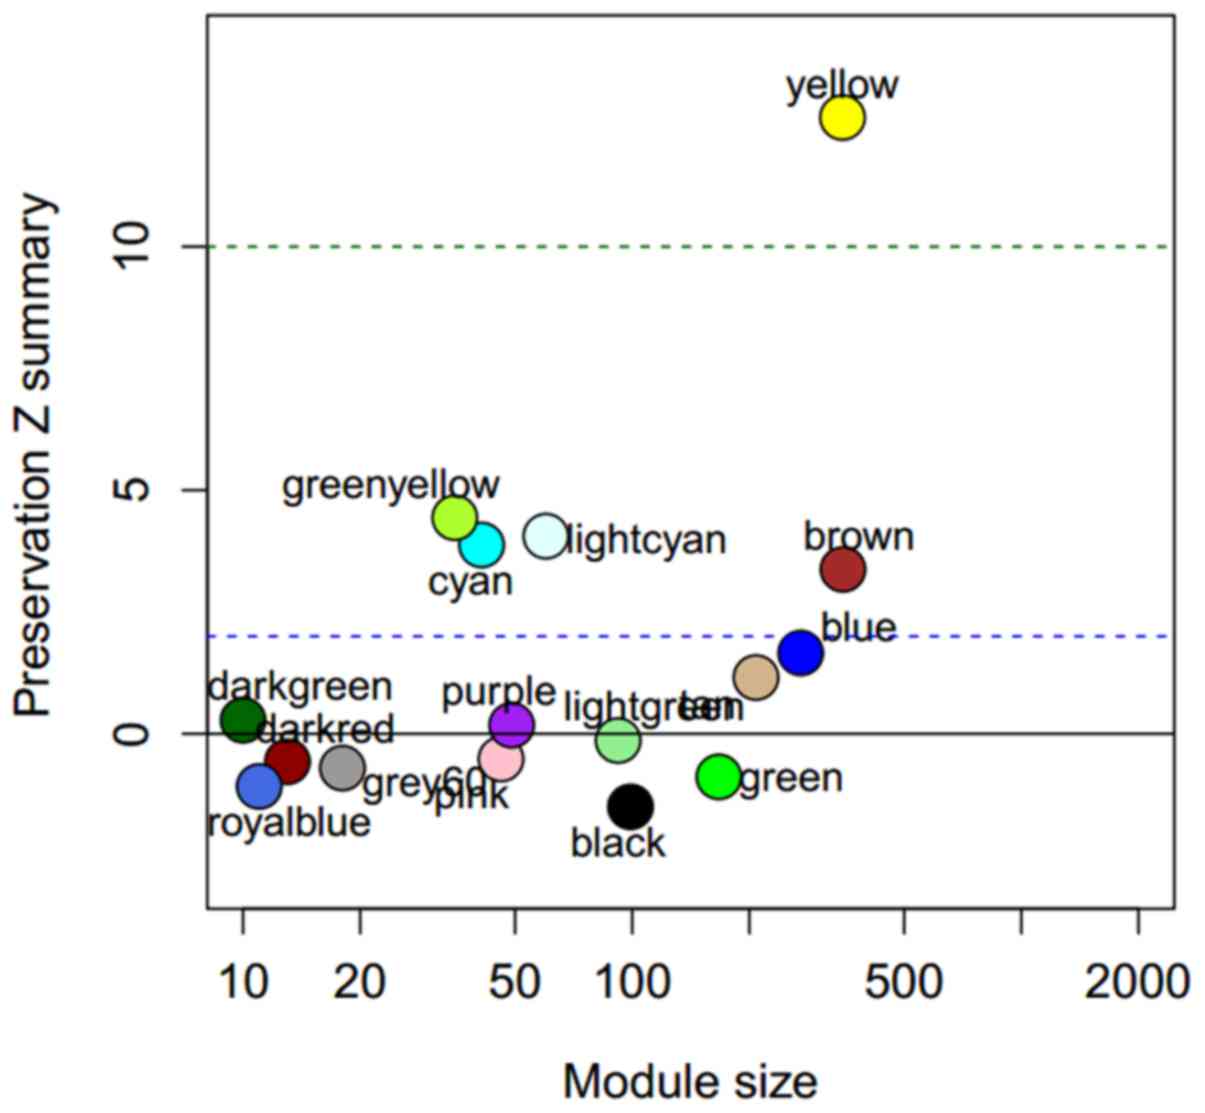
WGCNA ModulePreservation function was used to
evaluate the preservation of the 17 yeast modules in the human
cancer cell lines dataset, GSE36133 (Fig.
2). Five modules, yellow, green-yellow, light cyan, cyan and
brown were identified to be well preserved from high to low in
human cancer cell lines. They are associated with ncRNA processing,
mitochondrial translation, ubiquitin-dependent protein metabolism,
oxidative phosphorylation and regulation of translation.
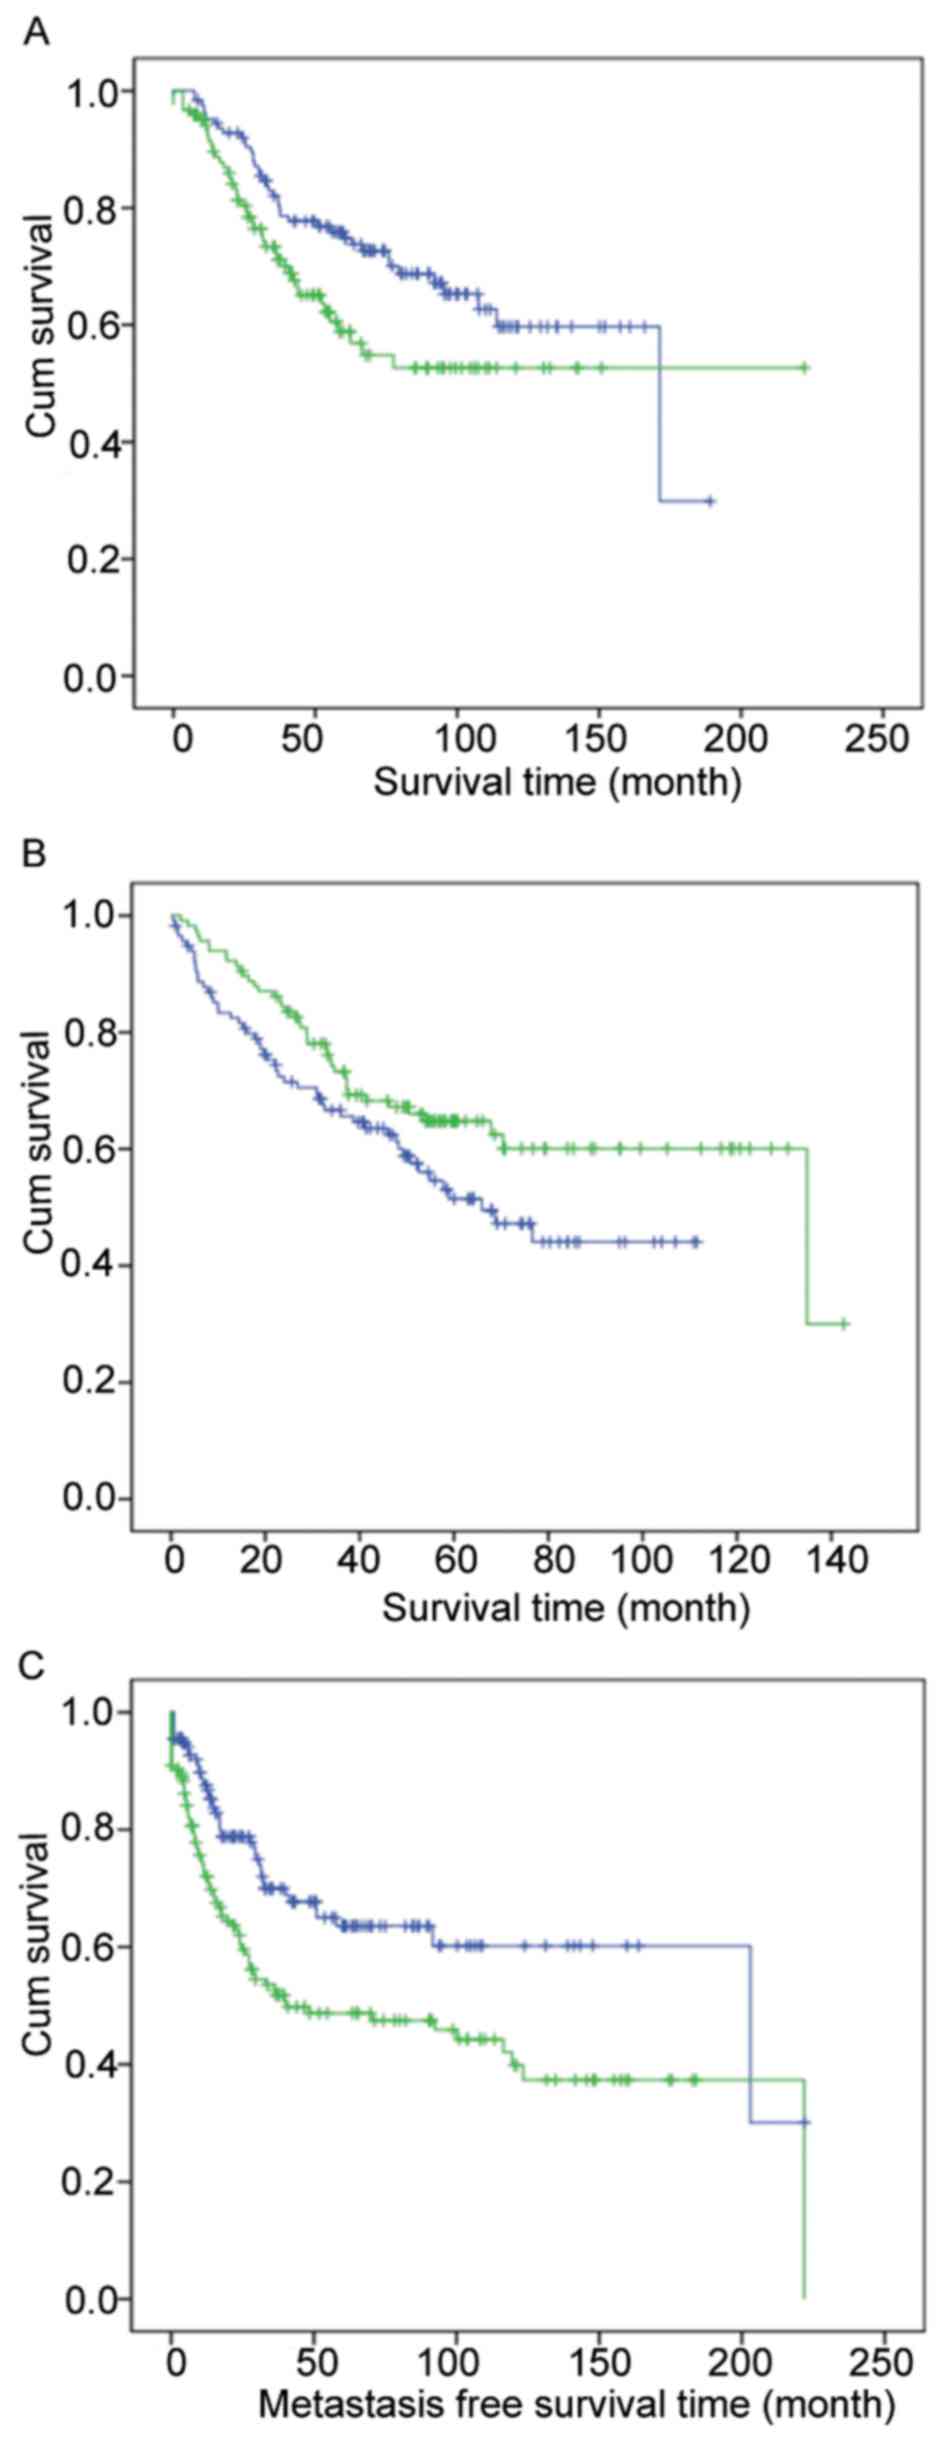
Co-expression modules differentiate
between patients with different survival times
To further validate the importance of these modules,
human breast cancer, colorectal cancer and sarcoma microarray
datasets were used to plot survival curves. For example, module
blue differentiates between breast cancer patients (Fig. 3A); module royal blue separates
colorectal cancer patients (Fig. 3B);
and module light green distinguishes sarcoma patients (Fig. 3C).
Discussion
WGCNA has been extensively applied to gene
co-expression network construction and analysis in various species.
For example, in human brain transcriptome analysis, Oldham et
al (10) identified the gene
co-expression corresponding to different brain regions. In plants,
Zhan et al (19) identified
cell-type specific gene co-expression modules, and observed
regulatory modules that were associated with endosperm cell
differentiation. WGCNA was previously used to depict functional
gene co-expression modules in mouse liver and human cancer cell
lines (20,21). In the present study, a gene network of
budding yeast was successfully constructed using WGCNA analysis.
All of the identified 17 modules were associated with specific
functional categories. As a single cell organism, the results are
easier to interpret. Therefore, WGCNA has an advantage over
differential gene expression analysis or ANOVA, which compare two
or more experimental groups. When there are many different
biological groups, it is more complicated to analyze these data.
WGCNA surmount these disadvantages, as it simplifies thousands of
genes into tens of functional modules. Finally, the method does not
require prior knowledge, so novel gene functions may be identified.
WGCNA has previously been used as a gene annotation method
(22).
The 17 identified modules represent different
aspects of budding yeast functions, including substance and energy
metabolism, cell proliferation and stimulus response (Table I). Module black contains genes
associated with heat response, which is an important trait of yeast
function (23). Recent studies
indicate that yeast has an adaptation for environmental stress,
such as high temperature (24).
Substance metabolism modules, include amino acid metabolism (dark
red), steroid metabolism (grey 60), organic acid metabolism
(purple) and sulfur metabolism (royal blue). Each module has a
distinct function, indicating the robustness of WGCNA.
Only 1,944 module genes were projected to human
homologous genes due to the limited number of yeast genes on
microarray. Thus, there is no definitive conclusion that modules
with a low preservation Z summary value are not preserved within
humans as a result of fewer genes in these modules (Fig. 2). However, the five preserved modules
identified in the present study are consistent with a previous
study that demonstrated that genes within these modules are
replaceable (3).
The significance of cancer cell line gene
co-expression modules in tumors has previously been reported
(21). In the current study, yeast
modules were observed in various human cancer datasets. For
example, certain modules differentiate between patients with long
and short survival times, indicating their importance from yeast to
humans. Those modules may be crucial in cancer biology and provide
information for human tumor research within yeast cells.
Acknowledgements
The present study was supported in part by the
National Natural Science Foundation of China (grant nos. 31270454
and 81502091), and of Zhejiang Provincial Natural Science
Foundation (grant no. LQ14H030001) and a Ningbo Natural Science
Foundation Grant (grant no. 2013A610232).
References
|
1
|
Botstein D, Chervitz SA and Cherry JM:
Yeast as a model organism. Science. 277:1259–1260. 1997. View Article : Google Scholar : PubMed/NCBI
|
|
2
|
Jiang Q, Lin L and Wang T: A new model for
apoptosis research: Yeast. Prog Biochem Biophys. 35:3612008.
|
|
3
|
Kachroo AH, Laurent JM, Yellman CM, Meyer
AG, Wilke CO and Marcotte EM: Evolution. Systematic humanization of
yeast genes reveals conserved functions and genetic modularity.
Science. 348:921–925. 2015. View Article : Google Scholar : PubMed/NCBI
|
|
4
|
Barrett T, Troup DB, Wilhite SE, Ledoux P,
Rudnev D, Evangelista C, Kim IF, Soboleva A, Tomashevsky M and
Edgar R: NCBI GEO: Mining tens of millions of expression profiles -
database and tools update. Nucleic Acids Res. 35(Database):
D760–D765. 2007. View Article : Google Scholar : PubMed/NCBI
|
|
5
|
Zhu J, Zhang B, Smith EN, Drees B, Brem
RB, Kruglyak L, Bumgarner RE and Schadt EE: Integrating large-scale
functional genomic data to dissect the complexity of yeast
regulatory networks. Nat Genet. 40:854–861. 2008. View Article : Google Scholar : PubMed/NCBI
|
|
6
|
Guelzim N, Bottani S, Bourgine P and Képès
F: Topological and causal structure of the yeast transcriptional
regulatory network. Nat Genet. 31:60–63. 2002. View Article : Google Scholar : PubMed/NCBI
|
|
7
|
Zhang B and Horvath S: A general framework
for weighted gene co-expression network analysis. Stat Appl Genet
Mol Biol. 4:: 2005. View Article : Google Scholar : PubMed/NCBI
|
|
8
|
Barrett T, Troup DB, Wilhite SE, Ledoux P,
Evangelista C, Kim IF, Tomashevsky M, Marshall KA, Phillippy KH,
Sherman PM, et al: NCBI GEO: Archive for functional genomics data
sets − 10 years on. Nucleic Acids Res. 39(Database): D1005–D1010.
2011. View Article : Google Scholar : PubMed/NCBI
|
|
9
|
Miller JA, Horvath S and Geschwind DH:
Divergence of human and mouse brain transcriptome highlights
Alzheimer disease pathways. Proc Natl Acad Sci USA.
107:12698–12703. 2010. View Article : Google Scholar : PubMed/NCBI
|
|
10
|
Oldham MC, Konopka G, Iwamoto K,
Langfelder P, Kato T, Horvath S and Geschwind DH: Functional
organization of the transcriptome in human brain. Nat Neurosci.
11:1271–1282. 2008. View
Article : Google Scholar : PubMed/NCBI
|
|
11
|
Langfelder P and Horvath S: WGCNA: An R
package for weighted correlation network analysis. BMC
Bioinformatics. 9:5592008. View Article : Google Scholar : PubMed/NCBI
|
|
12
|
Huang W, Sherman BT and Lempicki RA:
Systematic and integrative analysis of large gene lists using DAVID
bioinformatics resources. Nat Protoc. 4:44–57. 2009. View Article : Google Scholar : PubMed/NCBI
|
|
13
|
Huang W, Sherman BT and Lempicki RA:
Bioinformatics enrichment tools: Paths toward the comprehensive
functional analysis of large gene lists. Nucleic Acids Res.
37:1–13. 2009. View Article : Google Scholar : PubMed/NCBI
|
|
14
|
Ashburner M, Ball CA, Blake JA, Botstein
D, Butler H, Cherry JM, Davis AP, Dolinski K, Dwight SS, Eppig JT,
et al: The Gene Ontology Consortium: Gene ontology: Tool for the
unification of biology. Nat Genet. 25:25–29. 2000. View Article : Google Scholar : PubMed/NCBI
|
|
15
|
Benjamini Y and Hochberg Y: Controlling
the false discovery rate: A practical and powerful approach to
multiple testing. J R Stat Soc B. 57:289–300. 1995.
|
|
16
|
Langfelder P, Mischel PS and Horvath S:
When is hub gene selection better than standard meta-analysis? PLoS
One. 8:e615052013. View Article : Google Scholar : PubMed/NCBI
|
|
17
|
Gallina I, Colding C, Henriksen P, Beli P,
Nakamura K, Offman J, Mathiasen DP, Silva S, Hoffmann E, Groth A,
et al: Cmr1/WDR76 defines a nuclear genotoxic stress body linking
genome integrity and protein quality control. Nat Commun.
6:65332015. View Article : Google Scholar : PubMed/NCBI
|
|
18
|
Brar GA, Yassour M, Friedman N, Regev A,
Ingolia NT and Weissman JS: High-resolution view of the yeast
meiotic program revealed by ribosome profiling. Science.
335:552–557. 2012. View Article : Google Scholar : PubMed/NCBI
|
|
19
|
Zhan J, Thakare D, Ma C, Lloyd A, Nixon
NM, Arakaki AM, Burnett WJ, Logan KO, Wang D, Wang X, et al: RNA
sequencing of laser-capture microdissected compartments of the
maize kernel identifies regulatory modules associated with
endosperm cell differentiation. Plant Cell. 27:513–531. 2015.
View Article : Google Scholar : PubMed/NCBI
|
|
20
|
Liu W and Ye H: Co-expression network
analysis identifies transcriptional modules in the mouse liver. Mol
Genet Genomics. 289:847–853. 2014. View Article : Google Scholar : PubMed/NCBI
|
|
21
|
Liu W, Li L and Li W: Gene co-expression
analysis identifies common modules related to prognosis and drug
resistance in cancer cell lines. Int J Cancer. 135:2795–2803. 2014.
View Article : Google Scholar : PubMed/NCBI
|
|
22
|
Childs KL, Davidson RM and Buell CR: Gene
coexpression network analysis as a source of functional annotation
for rice genes. PLoS One. 6:e221962011. View Article : Google Scholar : PubMed/NCBI
|
|
23
|
Novick P and Botstein D: Phenotypic
analysis of temperature-sensitive yeast actin mutants. Cell.
40:405–416. 1985. View Article : Google Scholar : PubMed/NCBI
|
|
24
|
Li C, Qian W, Maclean CJ and Zhang J: The
fitness landscape of a tRNA gene. Science. 352:837–840. 2016.
View Article : Google Scholar : PubMed/NCBI
|