Introduction
Magnetic resonance imaging (MRI) provides precise
anatomical, volumetric and qualitative information, making it a
reliable method for distinguishing between multiple system atrophy
with Parkinsonism (MSA-P) and other Parkinsonism symptoms (1–3). Atrophy
of the putamen, middle cerebellar peduncle, pons and/or cerebellum
may be observed in the MRI scans of patients with MSA-P according
MSA criteria (4). In addition,
hyperintense putaminal rim (HPR) and hyperintense pons (hot cross
bun sign, HCB) are often present in patients with MSA-P (1,5).
Previous studies have reported that
123I-labeled
2β-carbomethoxy-3β-(4-iodophenyl)-N-(3-fluoropropyl) nortropane
single photon emission computed tomography (123I-FP-CIT
SPECT) is useful for evaluating striatal dopamine transporter
deficiency, which can cause Parkinsonism as well as MSA-P (6,7). Reduced
striatal uptake (SU) is typically observed in the posterior putamen
of patients with MSA-P and is similar to observations in other
nigrastriatal degenerative diseases, including idiopathic
Parkinson's disease (8,9). Dopaminergic neurologic deficiency may be
quantified using the specific binding ratio (SBR), which uses the
region-of-interest approach derived from the total count in the
striatum (10).
The prognoses of patients with MSA, including those
with MSA-P, is poor; mortality has been reported to occur within
2–21 years (median, 9.5 years) of the first appearance of symptoms
(11,12). Increasing our understanding of disease
progression is essential for predicting patient prognoses and
developing effective treatment strategies for the future. However,
patients with MSA-P present with various symptoms, including
Parkinsonism, cerebellar symptoms and autonomic symptoms (4), which makes diagnosis clinically
challenging. The International Cooperative Ataxia Rating Scale was
previously used to assess cerebellar syndrome, while the Unified
Parkinson's Disease Rating Scale was used to evaluate Parkinsonism;
however, these scales evaluate only a subset of clinical
manifestations (13,14). In 2004, the Unified Multiple System
Atrophy Rating Scale (UMSARS) was proposed as a novel clinical
severity scale for MSA - UMSARS is now widely used to evaluate the
severity of MSA (15). UMSARS
comprises four parts: I, historical review; II, motor examination
scale; III, autonomic examination; and IV, global disability scale.
Of these parts, part IV is considered to be associated with
clinical severity (15).
A literature review was performed by our group and,
to the best of our knowledge, no previous studies have used MRI and
123I-FP-CIT SPECT to evaluate the severity of MSA-P.
Furthermore, although it has been reported that the severity of
Parkinsonism is correlated with imaging results (16), few studies have focused on the
correlation between global disability and image findings. In the
present study, the efficacy of MRI and 123I-FP-CIT SPECT
for detecting imaging features that indicate the clinical severity
of MSA-P based on UMSARS IV score were compared.
Materials and methods
Ethics statement
The present study was approved by the Ethical Review
Board of Kochi Medical School (Nankoku, Japan). Due to the
retrospective nature of the present study, written informed consent
was waived.
Patients
A total of 17 patients (6 men, 11 women; mean age,
70 years; range, 54–74 years; mean disease duration, 36 months;
range, 4–96 months) were diagnosed with MSA-P by a neurologist at
the Department of Neurology at Kochi Medical School between October
2010 and March 2017 (4). Brain MRI
was performed for all patients and 123I-FP-CIT SPECT was
performed for 12 patients. All patients had been treated using
levodopa (100–600 mg/day depending on disease severity and drug
efficacy) for 1 to 22 months prior to imaging examinations. The
interval between MRI and 123I-FP-CIT SPECT imaging was
<6 months, during which time the clinical severity did not
change in any of the patients.
Imaging protocol
Brain MRI was performed using a 1.5-T system (Signa
HDx; GE Healthcare, Chicago, IL, USA) using an 8-channel coil.
Images were recorded in the transverse plane using T1-weighted spin
echo [repetition time (TR), 400–600 msec; echo time (TE), 300 msec;
flip angle (FA), 90°; matrix, 320×224; number of excitations (NEX),
1], T2-weighted fast spin echo (TR, 3,000–4,000 msec; TE, 120 msec;
FA, 90°; matrix, 384×256; NEX, 2) and fluid-attenuated inversion
recovery (TR, 10,000 msec; TE, 142 msec; FA, 90°; matrix, 256×192;
NEX, 1). The slice thickness was 5 mm (gap, 5 mm) and the field of
view was 24 cm. All 123I-FP-CIT SPECT data were acquired
using a SPECT CT system (Symbia T2 TruePoint SPECT CT; Siemens AG,
Munich, Germany) equipped with a low-energy, high-resolution
collimator. Attenuation correction used low-dose CT (17) and scatter correction was performed
using the triple energy window method (18). SPECT images were obtained 3 h
following injection of 123I-FP-CIT (167 MBq; Nihon
Medi-Physics Co., Ltd., Tokyo, Japan).
Assessment of the patients'
severity
Clinical severity (score 1–5) was assessed by an
experienced neurologist based on UMSARS part IV (15).
Image analysis
All images were retrospectively evaluated by two
diagnostic radiologists who were blinded to the clinical data. The
following features were assessed: i) Putaminal atrophy
[posterolateral linearization of the putaminal margin (19): PA]; ii) Hyperintense putaminal rim
(HPR) on T2-weighted imaging (T2WI); iii) Hyperintense pons (hot
cross bun sign, HCB) on T2WI; iv) Atrophy of the cerebellar vermis
and hemisphere (cerebellar atrophy, CA); and v) other brain
abnormities on T1WI, T2WI or fluid-attenuated inversion recovery
with reference to anatomical landmarks, including the internal and
external capsules. The distribution of SU on 123I-FP-CIT
SPECT images was visually assessed. SU was quantified using SBR
with DaTView software (version 6.1; AZE, Ltd., Tokyo, Japan).
Bilateral SBRs (for the right and left striatum) were individually
divided into higher side (SBR higher) and lower side (SBR lower)
groups with DaTView, regardless of their right or left
positioning.
Statistical analysis
PA, HPR, HCB, CA and SBR were compared according to
sex and age using the Mann-Whitney U test, Cochran-Armitage test
and Fisher's exact test. 123I-FP-ClT SPECT findings and
SBR were compared with UMSARS IV using the Cochran-Armitage and
Jonckheere-Terpstra tests. SBR results are expressed as the mean
(range). All statistical analyses were performed using Easy R
(version 2.7.11; Saitama Medical Center, Jichi Medical University,
Saitama, Japan,), a graphical user interface for R (version 3.3.3;
The R Foundation, Vienna, Austria) (20). P<0.05 was considered to indicate a
statistically significant difference.
Results
Patient characteristics and UMSARSIV
scores
The distribution of UMSARS IV scores was as follows:
Score 1, 1 patient; score 2, 6 patients; score 3, 8 patients; score
4, 2 patients. Patient characteristics and the results of MRI and
123I-FP-CIT SPECT scans are summarized in Table I. The results of MRI and
123I-FP-CIT SPECT were not significantly associated with
age or sex.
 | Table I.Patient characteristics, MRI and
123I-FP-CIT SPECT finding results. |
Table I.
Patient characteristics, MRI and
123I-FP-CIT SPECT finding results.
|
|
|
|
| MRI |
|
123I-FP-CIT |
|---|
|
|
|
|
|
|
|
|
|---|
| Patient | Age (years) | Sex | DD (months) | PA | HPR | HCB | CA | LI | UMSARS IV | SBR (lower) | SBR (higher) |
|---|
| 1 | 84 | M | 60 | − | − | − | − | + | 1 | 3.71 | 3.93 |
| 2 | 68 | F | 11 | + | − | − | + | + | 2 | 3.7 | 4.79 |
| 3 | 67 | F | 84 | − | − | − | + | + | 2 | 2.06 | 3.26 |
| 4 | 81 | M | 60 | + | − | − | + | − | 2 | 1.56 | 1.98 |
| 5 | 64 | M | 7 | − | − | − | − | − | 2 | N/A | N/A |
| 6 | 54 | F | 4 | − | − | − | − | + | 2 | N/A | N/A |
| 7 | 84 | M | 12 | − | − | − | − | − | 2 | N/A | N/A |
| 8 | 64 | F | 30 | − | − | − | + | + | 3 | 4.71 | 6.27 |
| 9 | 58 | M | 25 | + | + | − | + | + | 3 | 4.11 | 5.00 |
| 10 | 66 | F | 18 | + | − | − | − | − | 3 | 3.01 | 3.19 |
| 11 | 59 | F | 36 | + | − | − | + | − | 3 | 2.83 | 5.10 |
| 12 | 79 | F | 60 | − | − | − | − | − | 3 | 2.25 | 3.01 |
| 13 | 78 | F | 96 | + | + | − | − | + | 3 | 1.63 | 2.46 |
| 14 | 75 | F | 35 | + | − | − | − | + | 3 | N/A | N/A |
| 15 | 77 | F | 21 | − | − | − | + | − | 3 | N/A | N/A |
| 16 | 71 | F | 15 | + | + | − | + | + | 4 | 3.07 | 4.99 |
| 17 | 62 | M | 36 | + | − | + | + | − | 4 | 1.63 | 2.24 |
MRI results
Of the 17 patients enrolled in the present study, 12
were demonstrated to have at least one of PA, HPR, HCB or CA based
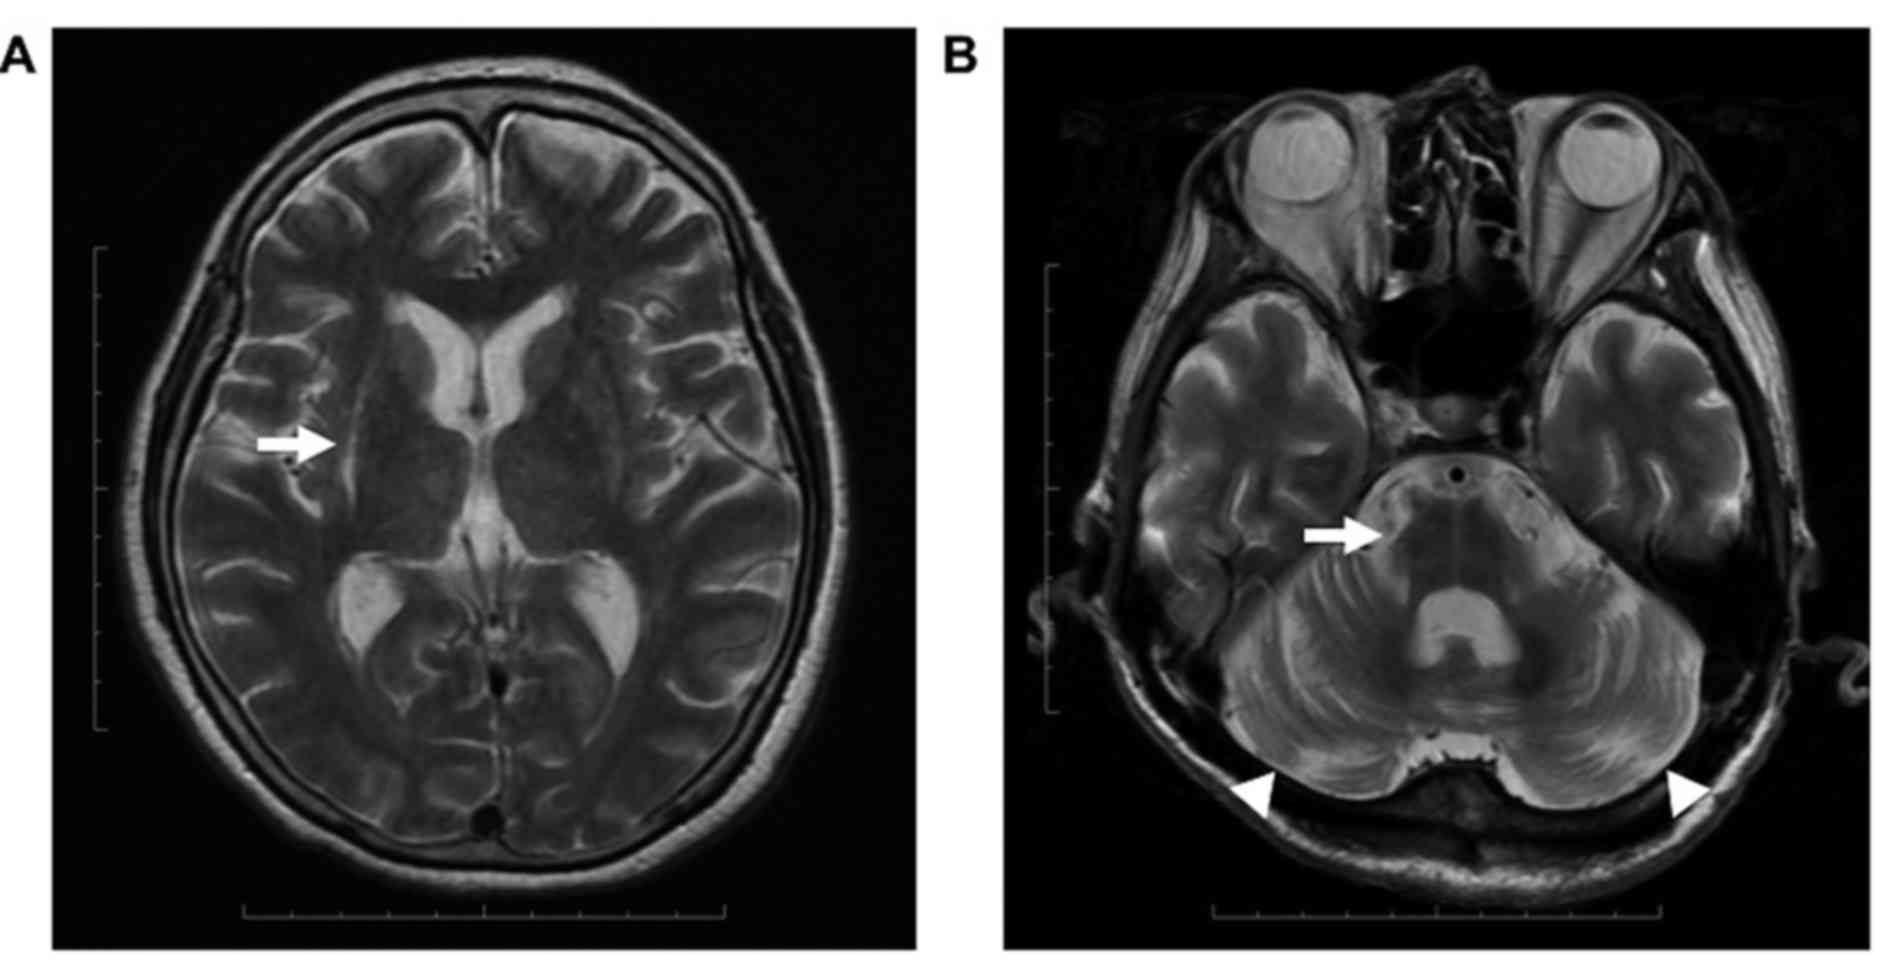
on MRI results. PA was observed in 9/12 patients, including in 3
with HPR. HCB was observed in 1/12 and CA was evident in 9/12
patients. PA and HPR were identified asymmetrically in each
patient, whereas HCB and CA were symmetrical (Fig. 1). A total of 9 patients were
demonstrated to have symmetrical lacunar infarcts in the putamen.
No other significant changes, including trauma or brain tumors,
were identified from MRI results.
123I-FP-CIT SPECT
results
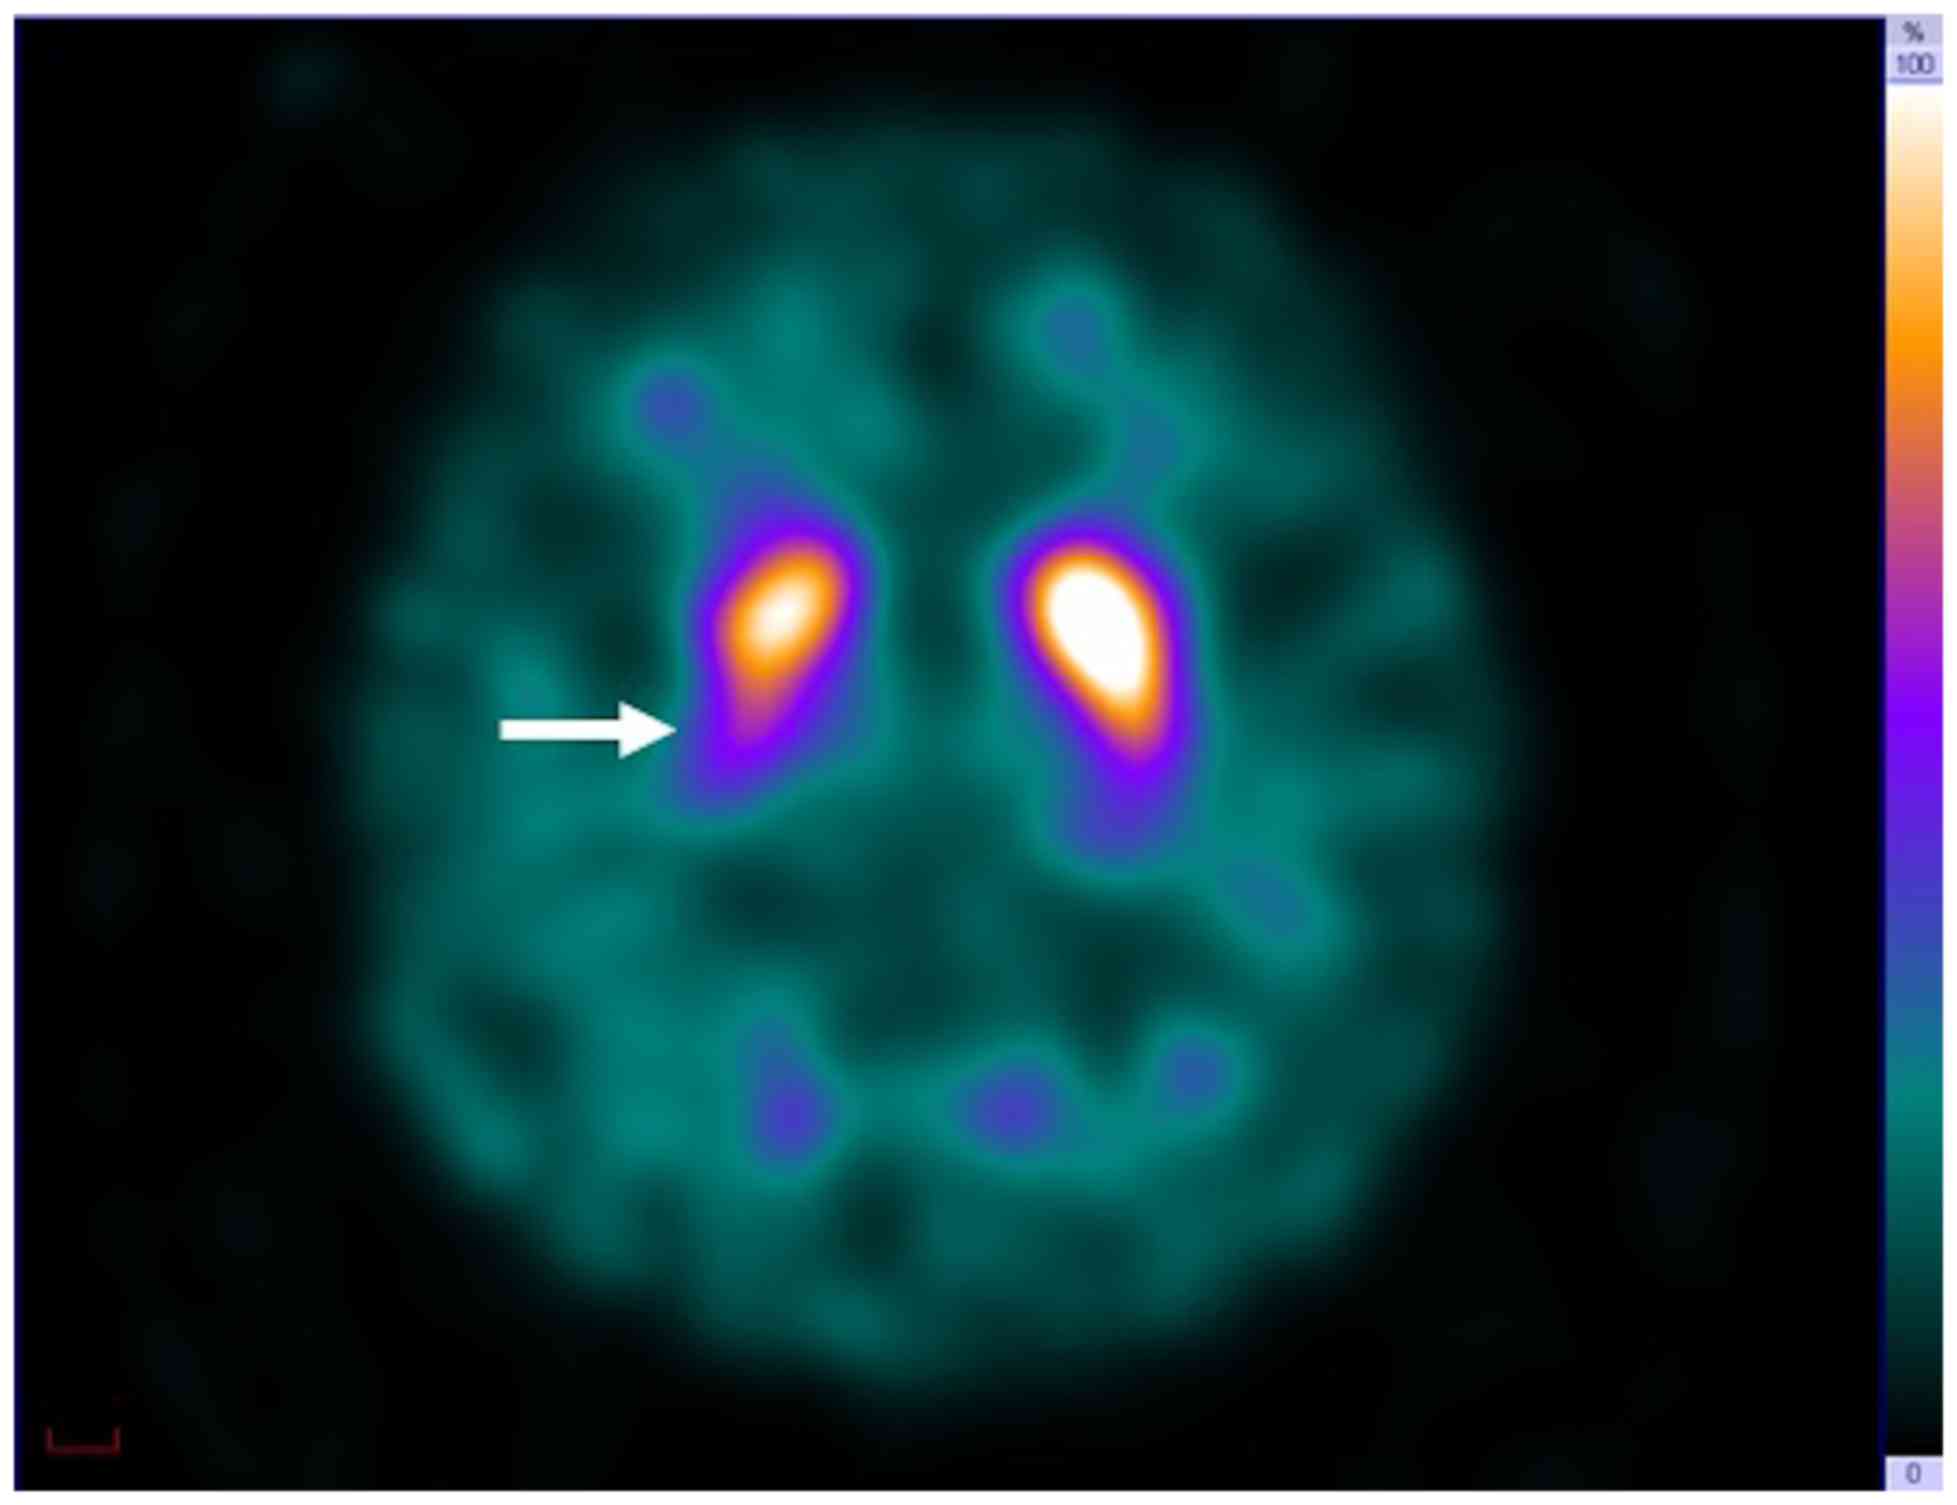
For 123I-FP-CIT SPECT, asymmetric
reduction of SU in the posterior putamen was observed in all 12
patients (Fig. 2). SBR higher had a
range of 1.98–6.27 and SBR lower had a range of 1.56–4.71 (Table I).
Association between imaging results
and UMSARS IV scores
The frequency of PA increased significantly with
increased UMSARS IV score (P<0.05); however, no significant
associations were identified between UMSARS IV scores and HPR, HCB
or CA (Table II). Furthermore, the
results of the present study did not identify a significant
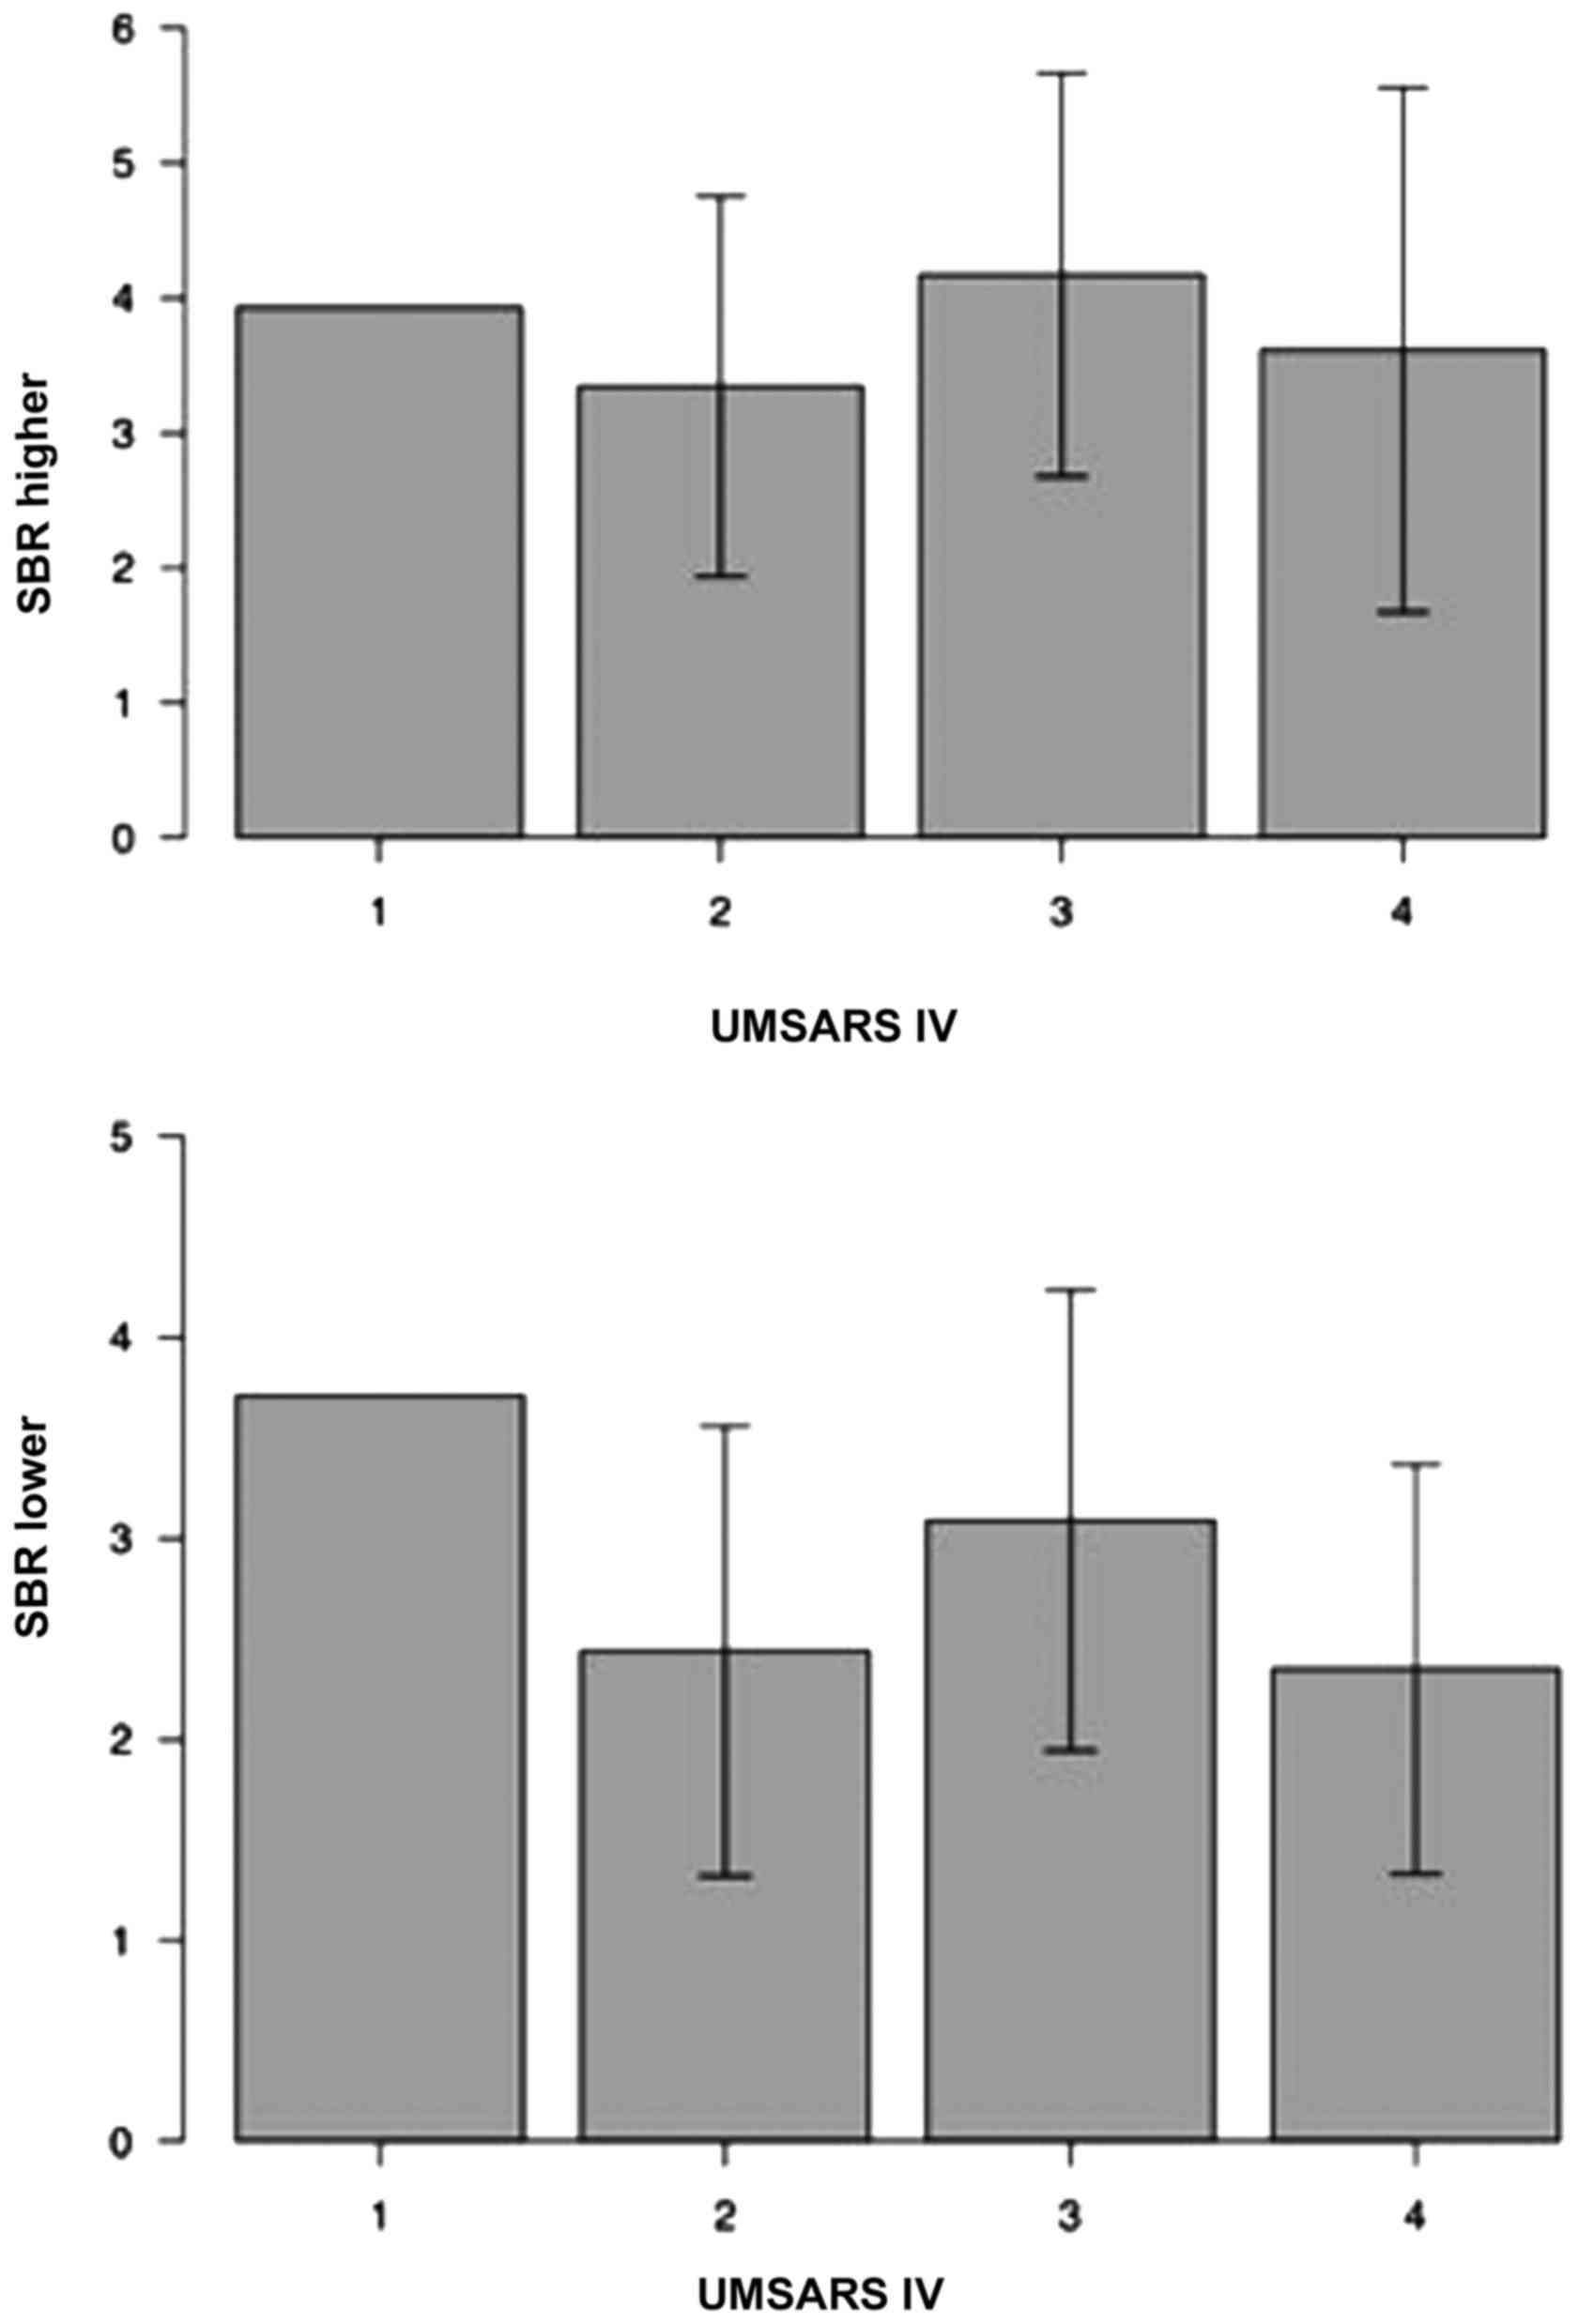
association between UMSARS IV scores and SBR (Fig. 3).
| Table II.Relationship between MRI findings and
UMSARS IV score. |
Table II.
Relationship between MRI findings and
UMSARS IV score.
|
| MRI |
|---|
|
|
|
|---|
| UMSARS IV score
(n) | PA (r)a | HPR (x) | HCB (y) | CA (z) |
|---|
| 1 (1) | 0 (0) | 0 (0) | 0 (0) | 0 (0) |
| 2 (6) | 2 (33) | 0 (0) | 0 (0) | 3 (50) |
| 3 (8) | 5 (63) | 2 (25) | 0 (0) | 4 (50) |
| 4 (2) | 2 (100) | 1 (50) | 1 (50) | 2 (100) |
Discussion
To the best of our knowledge, the present study is
the first report to evaluate whether MRI or 123I-FP-CIT
SPECT is more effective for determining clinical severity in
patients with MSA-P. The results of MRI revealed characteristic
MSA-P features in 12 out of 17 patients. Among these, PA was
observed in 9 patients. PA frequency increased significantly with
increasing UMSARS IV score. For 123I-FP-CIT SPECT,
reduced SU in the posterior putamen was observed in all patients;
however, no significant association was observed between SBR and
UMSARS IV score.
The results of the present study revealed a
significant association between PA (as identified using MRI) and
the clinical severity (based on UMSARS IV) of patients with MSA-P.
It has been reported that PA is associated with
posterolateral-predominant neurologic deficiencies and gliosis
(21). Neurologic deficiencies of the
putamen cause serious defects in the dopamine transport synapse
route, as well as a deficiency of nigral cells, which leads to
Parkinsonism (19,21,22). It
has previously been reported that the severity of Parkinsonism is
correlated with PA and abnormal diffusivity (16,23). The
severity of MSA-P may be associated with Parkinsonism, cerebellar
symptoms and autonomic symptoms. However, no significant
association was identified between CA appearing equivalent to PA
and clinical severity. Based on the results of the present study,
CA does not appear to significantly affect the severity of MSA-P
and, as such, it has been hypothesized that Parkinsonism may be a
factor that affects clinical severity.
The results of 123I-FP-CIT SPECT revealed
reduced SU in the posterior putamen in all 12 patients, which
supports previous reports (8,9). However, no significant association was
identified between SBR and clinical severity. Degeneration in the
striatum, including the putamen, is reportedly associated with
functional reductions in pre- and postsynaptic dopamine transport
in patients with MSA-P (24).
However, the results of 123I-FP-CIT SPECT demonstrate a
reduction in presynaptic function only (8). It is therefore unlikely that the
clinical severity of patients with MSA-P can be accurately assessed
using 123I-FP-CIT SPECT alone. Reduced postsynaptic
function may be correlated with PA; it has previously been reported
that reductions in D2 receptors, as measured by raclopride positron
emission tomography, are correlated with the clinical severity of
MSA-P (25). Based on the present
study and previous reports, it appears that presynaptic and
postsynaptic functions both affect the clinical severity of
patients with MSA-P. As such, evaluation of PA using MRI is
essential for assessing the clinical severity of MSA-P.
The present study is not without limitations. Had a
volume measurement tool been used as part of the MRI assessment in
the present study, an exact, quantitative value for PA could have
been obtained. Quantitative PA evaluation has been reported to
correlate with the severity of Parkinsonism (16). Furthermore, the degree of pathological
modification of the putamen has been reported to be associated with
response to levodopa (21).
Quantitative evaluation of PA may therefore be associated with the
combined pre- and postsynaptic functions. Consequently, if the pre-
and postsynaptic functions in PA (quantified using MRI) and the
reduced presynaptic function (quantified using
123I-FP-CIT SPECT) can be compared, the results may
reveal the overall degree of pre- and postsynaptic function
reduction in individual patients with MSA-P. In addition, the
effects of levodopa may be better predicted.
The present study was retrospective and the sample
size was relatively small. However, this was unavoidable as MSA-P
is a rare condition (26). The
present study also utilizes a 1.5-T system, which is not optimal,
as 3-T systems have been reported to be better for detecting HCB
and HPR (27). Furthermore, no proton
density-weighted imaging (PDWI) was used in conjunction with MRI in
the present study. PDWI has been demonstrated to be useful in
detecting HCB (28). At present, 3-T
systems and PDWI are not included in the standard imaging protocol
at Kochi Medical School. Future studies should aim to utilize a 3-T
system and PDWI in order to better identify HPR and HCB in patients
with MSA-P.
In conclusion, the use of 123I-FP-CIT
SPECT does not appear to be more effective than MRI for evaluating
the clinical severity of patients with MSA-P. Evaluating the
presynaptic and postsynaptic dopamine function is essential in
order to accurately assess the severity of MSA-P. As
123I-FP-CIT SPECT is only able to assess presynaptic
function, this type of imaging alone is insufficient. However, PA,
as identified using MRI, is significantly associated with clinical
severity in patients with MSA-P. The results of the present study
suggest that PA values obtained using MRI are the most useful
parameter for evaluating the clinical severity of patients with
MSA-P.
Acknowledgements
The authors are thankful to Naoki Akagi and Naoya
Hayashi at the Department of Radiology of Kochi Medical School,
Kochi, Japan for their technical assistance.
References
|
1
|
Bhattacharya K, Saadia D, Eisenkraft B,
Yahr M, Olanow W, Drayer B and Kaufmann H: Brain magnetic resonance
imaging in multiple-system atrophy and Parkinson disease: A
diagnostic algorithm. Arch Neurol. 59:835–842. 2002. View Article : Google Scholar : PubMed/NCBI
|
|
2
|
Naka H, Ohshita T, Murata Y, Imon Y,
Mimori Y and Nakamura S: Characteristic MRI findings in multiple
system atrophy: Comparison of the three subtypes. Neuroradiology.
44:204–209. 2002. View Article : Google Scholar : PubMed/NCBI
|
|
3
|
Qiao PF, Shi F, Jiang MF, Gao Y and Niu
GM: Application of high-field magnetic resonance imaging in
Parkinson's disease. Exp Ther Med. 13:1665–1670. 2017. View Article : Google Scholar : PubMed/NCBI
|
|
4
|
Gilman S, Wenning GK, Low PA, Brooks DJ,
Mathias CJ, Trojanowski JQ, Wood NW, Colosimo C, Dürr A, Fowler CJ,
et al: Second consensus statement on the diagnosis of multiple
system atrophy. Neurology. 71:670–676. 2008. View Article : Google Scholar : PubMed/NCBI
|
|
5
|
Watanabe H, Saito Y, Terao S, Ando T,
Kachi T, Mukai E, Aiba I, Abe Y, Tamakoshi A, Doyu M, et al:
Progression and prognosis in multiple system atrophy: An analysis
of 230 Japanese patients. Brain. 125:1070–1083. 2002. View Article : Google Scholar : PubMed/NCBI
|
|
6
|
Kraemmer J, Kovacs GG, Perju-Dumbrava L,
Pirker S, Traub-Weidinger T and Pirker W: Correlation of striatal
dopamine transporter imaging with post mortem substantia nigra cell
counts. Mov Disord. 29:1767–1773. 2014. View Article : Google Scholar : PubMed/NCBI
|
|
7
|
Piggott MA, Perry EK, Marshall EF, McKeith
IG, Johnson M, Melrose HL, Court JA, Lloyd S, Fairbairn A, Brown A,
et al: Nigrostriatal dopaminergic activities in dementia with Lewy
bodies in relation to neuroleptic sensitivity: Comparisons with
Parkinson's disease. Biol Psychiatry. 44:765–774. 1998. View Article : Google Scholar : PubMed/NCBI
|
|
8
|
Kägi G, Bhatia KP and Tolosa E: The role
of DAT-SPECT in movement disorders. J Neurol Neurosurg Psychiatry.
81:5–12. 2010. View Article : Google Scholar : PubMed/NCBI
|
|
9
|
Booth TCNM, Nathan M, Waldman AD, Quigley
AM, Schapira AH and Buscombe J: The role of functional
dopamine-transporter SPECT imaging in parkinsonian syndromes, part
2. AJNR Am J Neuroradiol. 36:236–244. 2015. View Article : Google Scholar : PubMed/NCBI
|
|
10
|
Tossici-Bolt L, Hoffmann SM, Kemp PM,
Mehta RL and Fleming JS: Quantification of [123I]FP-CIT SPECT brain
images: An accurate technique for measurement of the specific
binding ratio. Eur J Nucl Med Mol Imaging. 33:1491–1499. 2006.
View Article : Google Scholar : PubMed/NCBI
|
|
11
|
Wenning GK, Ben Shlomo Y, Magalhães M,
Daniel SE and Quinn NP: Clinical features and natural history of
multiple system atrophy. An analysis of 100 cases. Brain.
117:835–845. 1994. View Article : Google Scholar : PubMed/NCBI
|
|
12
|
O'Sullivan SS, Massey LA, Williams DR,
Silveira-Moriyama L, Kempster PA, Holton JL, Revesz T and Lees AJ:
Clinical outcomes of progressive supranuclear palsy and multiple
system atrophy. Brain. 131:1362–1372. 2008. View Article : Google Scholar : PubMed/NCBI
|
|
13
|
Trouillas P, Takayanagi T, Hallett M,
Currier RD, Subramony SH, Wessel K, Bryer A, Diener HC, Massaquoi
S, Gomez CM, et al: The Ataxia Neuropharmacology Committee of the
World Federation of Neurology: International Cooperative Ataxia
Rating Scale for pharmacological assessment of the cerebellar
syndrome. J Neurol Sci. 145:205–211. 1997. View Article : Google Scholar : PubMed/NCBI
|
|
14
|
Fahn S and Elton R: Members of the UPDRS
Development Committee (1987) The Unified Parkinson's Disease Rating
ScaleFahn S, Marsden CD, Calne DB and Goldstein M: Recent
Developments in Parkinson's Disease. 2. McMellam Health Care
Information; Florham Park: pp. 153–163. 1987
|
|
15
|
Wenning GK, Tison F, Seppi K, Sampaio C,
Diem A, Yekhlef F, Ghorayeb I, Ory F, Galitzky M, Scaravilli T, et
al: Multiple System Atrophy Study Group: Development and validation
of the Unified Multiple System Atrophy Rating Scale (UMSARS). Mov
Disord. 19:1391–1402. 2004. View Article : Google Scholar : PubMed/NCBI
|
|
16
|
Wakai M, Kume A, Takahashi A, Ando T and
Hashizume Y: A study of parkinsonism in multiple system atrophy:
Clinical and MRI correlation. Acta Neurol Scand. 90:225–231. 1994.
View Article : Google Scholar : PubMed/NCBI
|
|
17
|
Shimosegawa E, Fujino K, Kato H and
Hatazawa J: Quantitative CBF measurement using an integrated
SPECT/CT system: Validation of three-dimensional ordered-subset
expectation maximization and CT-based attenuation correction by
comparing with O-15 water PET. Ann Nucl Med. 27:822–833. 2013.
View Article : Google Scholar : PubMed/NCBI
|
|
18
|
Ichihara T, Ogawa K, Motomura N, Kubo A
and Hashimoto S: Compton scatter compensation using the
triple-energy window method for single- and dual-isotope SPECT. J
Nucl Med. 34:2216–2221. 1993.PubMed/NCBI
|
|
19
|
Ito S, Shirai W and Hattori T: Evaluating
posterolateral linearization of the putaminal margin with magnetic
resonance imaging to diagnose the Parkinson variant of multiple
system atrophy. Mov Disord. 22:578–581. 2007. View Article : Google Scholar : PubMed/NCBI
|
|
20
|
Kanda Y: Investigation of the freely
available easy-to-use software ‘EZR’ for medical statistics. Bone
Marrow Transplant. 48:452–458. 2013. View Article : Google Scholar : PubMed/NCBI
|
|
21
|
Ozawa T, Paviour D, Quinn NP, Josephs KA,
Sangha H, Kilford L, Healy DG, Wood NW, Lees AJ, Holton JL, et al:
The spectrum of pathological involvement of the striatonigral and
olivopontocerebellar systems in multiple system atrophy:
Clinicopathological correlations. Brain. 127:2657–2671. 2004.
View Article : Google Scholar : PubMed/NCBI
|
|
22
|
Papp MI, Kahn JE and Lantos PL: Glial
cytoplasmic inclusions in the CNS of patients with multiple system
atrophy (striatonigral degeneration, olivopontocerebellar atrophy
and Shy-Drager syndrome). J Neurol Sci. 94:79–100. 1989. View Article : Google Scholar : PubMed/NCBI
|
|
23
|
Seppi K, Schocke MF, Mair KJ, Esterhammer
R, Scherfler C, Geser F, Kremser C, Boesch S, Jaschke W, Poewe W,
et al: Progression of putaminal degeneration in multiple system
atrophy: A serial diffusion MR study. Neuroimage. 31:240–245. 2006.
View Article : Google Scholar : PubMed/NCBI
|
|
24
|
Hashimoto M, Kawasaki K, Suzuki M, Mitani
K, Murayama S, Mishina M, Oda K, Kimura Y, Ishiwata K, Ishii K, et
al: Presynaptic and postsynaptic nigrostriatal dopaminergic
functions in multiple system atrophy. Neuroreport. 19:145–150.
2008. View Article : Google Scholar : PubMed/NCBI
|
|
25
|
Antonini A, Leenders KL, Vontobel P,
Maguire RP, Missimer J, Psylla M and Günther I: Complementary PET
studies of striatal neuronal function in the differential diagnosis
between multiple system atrophy and Parkinson's disease. Brain.
120:2187–2195. 1997. View Article : Google Scholar : PubMed/NCBI
|
|
26
|
Schrag A, Ben-Shlomo Y and Quinn NP:
Prevalence of progressive supranuclear palsy and multiple system
atrophy: A cross-sectional study. Lancet. 354:1771–1775. 1999.
View Article : Google Scholar : PubMed/NCBI
|
|
27
|
Baronica KB, Ivkić G, Ozretić D and
Milicević G: Differential diagnostic relevance of high resolution
magnetic resonance in patients with possible multiple system
atrophy (MSA) - A case report. Coll Antropol. 35 Suppl 1:287–292.
2011.PubMed/NCBI
|
|
28
|
Kasahara S, Miki Y, Kanagaki M, Kondo T,
Yamamoto A, Morimoto E, Okada T, Ito H, Takahashi R and Togashi K:
“Hot cross bun” sign in multiple system atrophy with predominant
cerebellar ataxia: A comparison between proton density-weighted
imaging and T2-weighted imaging. Eur J Radiol. 81:2848–2852. 2012.
View Article : Google Scholar : PubMed/NCBI
|