Introduction
The number of patients with diabetes mellitus
constantly increases. Vascular complications, including diabetic
nephropathy are major reasons for increased morbidity and mortality
among patients with diabetes (1).
Chronic hyperglycaemia leads to the formation of advanced
glycosylation end products, activation of protein kinase C, polyol
pathway and glucose autoxidation. These processes are sources of
increased oxidative stress, which leads to damage in vasculature
and tissues (2). Active research is
on-going in the area of other potential mechanisms of diabetic
nephropathy, including nitric oxide (NO) metabolism (3).
NO is a pleiotropic molecule important to a number
of physiological and pathological processes in humans. In
physiological conditions, effects of NO are tissue-dependent and
include vasorelaxant, antithrombotic and antibacterial. However,
high amounts of NO are associated with pro-inflammatory processes
(4). The adverse effects of NO result
mainly from peroxynitrite (ONOO-), a product of the
interaction of NO with the superoxide anion and a potent toxin.
Overproduction of NO and ONOO- is associated with DNA
damage, enzyme dysfunction, inflammation, oxidative stress,
decreased NO bioavailability and endothelial dysfunction (2,5-11).
Experimental data confirm increased NO and
ONOO- production in tissues of animals with diabetes
mellitus (5,7,8,12). Existing studies on changes in NO
metabolism coupled to diabetes and diabetic nephropathy in humans
often demonstrate the opposite findings. Reduced serum nitrite
(NO2-) and nitrate
(NO3-) synthesis was described in patients
with diabetic nephropathy and type 2 diabetes (13), and in patients with type 1 diabetes
(T1D) and glomerular hyperfiltration (14). In contrast, increased serum
NO2-+NO3- has been
reported in patients with T1D and albuminuria (15) and in children with T1D (16). Only a few studies have described
changes of concentration of NO metabolites in both the serum and
urine of T1D patients, despite the importance of both measurements
(14,16). Whereas serum
NO2-+NO3- reflects
mainly endothelial NO production although it might be influenced by
dietary NO2- and NO3-
(17), data on urine
NO2-+NO3- may reflect
the intensity of NO synthesis in the kidney circulation (14) and thus provide information for
research on diabetic nephropathy (3).
NO is an unstable molecule, which is metabolized to
NO2-+NO3- within
seconds. Therefore, the majority of human studies report data on
concentrations of
NO2-+NO3- in serum
and/or urine (13,18). Data on NO production [which can only
be measured by electron paramagnetic resonance (EPR) spectroscopy
or amperometric electrodes (19-21)]
ex vivo in humans with diabetes is lacking, due to technical
difficulties of the above methods.
To summarize, the understanding of derangements of
NO metabolism in the pathogenesis of diabetic nephropathy in T1D is
limited (5,15,16,18).
To reduce the gap in this knowledge, the present
study describes data on simultaneous measurement of concentrations
of NO in whole blood by EPR spectroscopy and its metabolites
NO2-+NO3- in serum and
urine of T1D patients with and without diabetic nephropathy.
Materials and methods
Patients and ethics
The present study was a part of LatDiane: Latvian
prospective diabetic nephropathy study. LatDiane recruits' patients
with T1D (defined as the age of diagnosis <40 years, with
insulin treatment initiated within 1 year of diagnosis and
C-peptide level <0.3 nmol/l). The study is in line with the 1975
Declaration of Helsinki and received the Latvian Central Ethics
Committee's approval no. 01-29.1/3. All participants gave their
written informed consent to participate. Patients recruited between
September and May each year between 2013 and 2016 with a diabetes
duration >1 year were included (N=268) in this study. Patient
characteristics are shown in Table I.
The control group was formed of volunteers (n=69) without
previously diagnosed diabetes or impaired glucose tolerance, who
were invited to participate in this study in 2013-2014. Exclusion
criteria for both groups of patients were pregnancy, acute or
chronic urinary infection, signs of acute inflammation (C-reactive
protein >5 mg/l, fever, increased erythrocyte sedimentation
rate), history of chronic kidney disease apart from diabetic
nephropathy, oncologic or rheumatologic diseases, end-stage renal
disease (ESRD), current usage of antibiotics or history of
immunosuppressive treatment.
 | Table ICharacteristics of subjects. |
Table I
Characteristics of subjects.
|
Characteristics | Healthy subjects
(N=69) | Type 1 diabetes
without nephropathy (N=246) | Type 1 diabetes and
nephropathy (N=22) |
|---|
| Men/women, %
(N) | 38/62 (26/43) | 46/54
(112/134) | 46/54 (10/12) |
| Age, years | 23 (21-26) | 36
(24-47)a | 33
(27.5-47)a,b |
| Diabetes duration,
years | - | 14 (6.2-22) | 22
(15.2-28.8)b |
| Body mass index,
kg/m2 | 22.6 (20.6-26) | 24.4
(21.8-27.8) | 23.5
(21.4-24.6) |
| Systolic blood
pressure, mmHg | 120 (110-125) | 124
(117-135)a | 136
(126-149)a,b |
| Diastolic blood
pressure, mmHg | 75 (70-80) | 80
(71-85)a | 89
(80-91)a,b |
| Hypertension, %
(N) | 1(1) |
41(101)c | 76(19)c,d |
| On ACEI/ARB, %
(N) | 0 (0) | 24(61) | 32(8) |
| HbA1c% | 5.3 (5.1-5.5) | 8.3
(7.4-9.6)a | 10.1
(8.3-11.1)a,b |
| HbA1c,
mmol/mol | 34.4
(32.2-36.6) | 67.2
(57.4-81.4)a | 86.9
(67.2-97.8)a,b |
| Triglycerides,
mmol/l | 0.7 (0.6-1.1) | 1.0
(0.7-1.4)a | 1.2
(1.0-1.9)a,b |
| Total cholesterol,
mmol/l | 4.2 (3.7-4.8) | 4.9
(4.1-5.5)a | 4.8 (4.0-6.0) |
| Low-density
lipoprotein cholesterol, mmol/l | 2.3 (1.8-2.7) | 2.7 (2.1-3.3) | 2.5 (2-3.5) |
| On statins, %
(N) | 0 (0) | 10(26) | 12(3) |
| Smoking, % (N) | 17(12) | 26(64) | 28(7) |
| eGFR, ml/min/1.73
m2 | 108.6
(96.5-121.8) | 110.8
(97.4-123.1) | 85.7
(56-98.6)a,b |
| Albuminuria,
%(N)e: |
|
Normoalbuminuria | 100(69) | 80(197) | 9(2)d |
|
Microalbuminuria | 0 (0) | 17(42) | 9(2) |
|
Macroalbuminuria | 0 (0) | 0 (0) | 81(18)d |
| Urine
albumin/creatinine ratio, mg/mmol | 0.3 (0.2-0.7) | 0.6
(0.3-1.6)a | 72.8
(46.8-152.2)a,b |
| Chronic kidney
disease, % (N) | 0 (0) | 0 (0) | 28(7)d |
| Fundus oculi exam,
% (N): | - | 17(43) | 32(7) |
| No retinopathy | | 59(144) | 18(4)d |
| Non-proliferative
retinopathy | | 24(59) | 50(11)d |
| Proliferative
retinopathy and status post LPC |
| Diabetic
polyneuropathy, % (N) | - | 38(94) | 72(18)c |
| Vascular hard
event, % (N) | 0 (0) | 6(15) | 12(3) |
Definitions
Albuminuria was assessed using two out of three
urine albumin-to-creatinine ratio measurements in morning spot
urine according to the guidelines of the National Kidney foundation
(22).
Estimated glomerular filtration rate (eGFR) was
calculated with the Chronic Kidney Disease Epidemiology
Collaboration equation (23). Chronic
kidney disease was defined as eGFR<60 ml/min/1.73 m2.
ESRD was defined as eGFR <15 ml/min/1.73 m2, dialysis
or kidney transplantation. Diabetic nephropathy was defined as
macroalbuminuria and eGFR <60 ml/min/1.73 m2.
Arterial hypertension was defined as regular usage of
antihypertensive drugs, or systolic blood pressure ≥140 mmHg (18.7
kPa) and diastolic blood pressure ≥90 mmHg (12.0 kPa). Diabetic
retinopathy was defined as proliferative diabetic retinopathy or
status after panretinal-laser photocoagulation, based on conclusion
of the fundus oculi examination performed by an
ophthalmologist. Cardiovascular disease was defined as history of
acute myocardial infarction, coronary bypass/percutaneous
transluminal coronary angioplasty, stroke, amputation, or
peripheral vascular disease. Diabetic polyneuropathy was defined
based on electromyography data (reporting peripheral sensory,
senso-motor or motor neuropathy). Smoking was self-reported,
patients currently smoking at least one cigarette per day were
referred to the ‘smokers’ group. Body mass index (BMI) was
calculated as weight (kg)/[height (m2)].
Biochemical parameters
Total cholesterol, low-density lipoproteins and
triglyceride (enzymatic colour reaction), HbA1c
(high-pressure liquid chromatography), C-reactive protein
(immuno-turbidimethric method) and albumin to creatinine ratio in
urine (immunoturbidimetric test and enzymatic kinetic reaction)
were measured in certified clinical laboratories.
Measurement of NOin whole blood
NO production was measured essentially as described
(24). A total of 20 mg
diethylthiocarbamate (Sigma-Aldrich; Merck KGaA) was added to 1 ml
fresh blood, stirred and incubated for 30 min at room temperature.
Then the mixture was aspirated into an insulin syringe and frozen
in liquid nitrogen, the frozen cylinder was extruded from the
syringe and placed in a quartz finger Dewar flask ER 167 FDS-Q
(Bruker Corporation) filled with liquid nitrogen. NO concentration
was detected measuring the NO component in the spectrum of
Fe-DETC-NO (g=2.031) and compared with the calibration curve. To
build up the calibration curve different quantities of
NaNO2 (final concentrations 0, 10, 20, 30, 40, 60 and
100 µM) were mixed with DETC (33 mg/ml) and
FeSO4. 7H2O (3.3 mM), an excess of
Na2S2O4 (2 M) was added to the
mixture. The EPR spectra were taken as described above. Thus, the
calibration curve contained both negative and positive
controls.
EPR spectra were recorded in liquid nitrogen using
the EPR spectrometer Radiopan SE/X2544. Conditions of EPR
measurements were: 2.5 mW microwave power, 9.24 GHz microwave
frequency, 100 kHz modulation frequency, 0.5 mT modulation
amplitude, and 5x10⁵ receiver gain. Limits of detection
for NO were 5-50 ng/g tissue. The observed deviation between
measurements was 5-10%.
Measurement of
NO2-+NO3- in patients'
serum samples
Serum samples were deproteinised, using Amicon Ultra
filters for centrifugation (cat. no. UFC800324; EMD Millipore).
NO2-+NO3- was measured
with the Cayman's Nitrate/Nitrite Colorimetric assay kit (cat. Nr
780001; Cayman Chemical Company) and Perkin Elmer Lambda 25 UV/VIS
spectrophotometer (PerkinElmer, Inc.) (21).
NO2-+NO3- concentration
was quantitated using the nitrate standard curve (final
concentrations 0, 5, 10, 15, 20, 25, 30 and 35 µM), which was
performed according to the protocol in the kit. The detection limit
of sample was 2.5 µM. Inter-assay and intra-assay coefficients of
variation are 3.4 and 2.7%, respectively.
Statistical analysis
All measurements for NO and
NO2-+NO3- were
performed in triplicate, and the mean values were used for
analysis. NO levels in whole blood was measured in 269 samples,
NO2-+NO3- levels in
serum was measured in 310 samples, and
NO2-+NO3- levels in
urine was measured in 308 samples. At the initial analysis stage,
chi-square test for proportions for categorical variables and the
Wilcoxon signed-rank test for quantitative variables (Table I) were used. As none of the variables
analysed followed normality (tested using the Shapiro test),
nonparametric statistical procedures were used. Data are presented
as medians with the respective interquartile range. The equality of
medians was tested using the and the Kruskal-Wallis test followed
by Wilcoxon sum rank test for pairwise comparisons. For multiple
comparisons P-value correction method by Holm was used. Healthy
subjects differed from both groups of patients with T1D in age and
HbA1c. Therefore, ANCOVA procedure on ranks was used to adjust for
age and other potential confounders (gender, BMI, HbA1c% and
smoking), although it did not lead to any significant P-value
changes.
Other differences between the groups (duration of
diabetes, blood pressure, lipids, eGFR, albuminuria and prevalence
of complications of diabetes) were attributable to diagnosis of T1D
or diabetic nephropathy, therefore adjustment for these parameters
was not performed.
A Spearman correlation coefficient was used to study
association between markers of NO metabolism. Regression analysis
was performed only for data of patients with T1D. A total of three
linear regression models with either whole blood NO, or serum and
urine NO2-+NO3- as
dependent variables were used. Initially, full models adjusted for
age, sex, diabetes duration, systolic and diastolic blood pressure,
body mass index, smoking, HbA1c, lipids, urine albumin/creatinine
ratio, eGFR, diabetic nephropathy status were used. To identify
predictors with major impact on nitric oxide metabolism markers, a
stepwise regression model based on AIC selection was applied. All
statistical tests were using R version 3.6.1(25).
Results
Characteristics of study groups
Study subjects included 268 patients with T1D and 69
healthy subjects. Patients with T1D were stratified according to
the presence of diabetic nephropathy. Anthropometric and clinical
characteristics of three groups (healthy subjects, patients with
T1D without diabetic nephropathy, patients with T1D with diabetic
nephropathy) are summarised in Table
I. Subjects in the control group did not have any chronic
diseases, except hypertension in one case.
Concentration of NO in the whole blood
of patients with T1D and healthy subjects
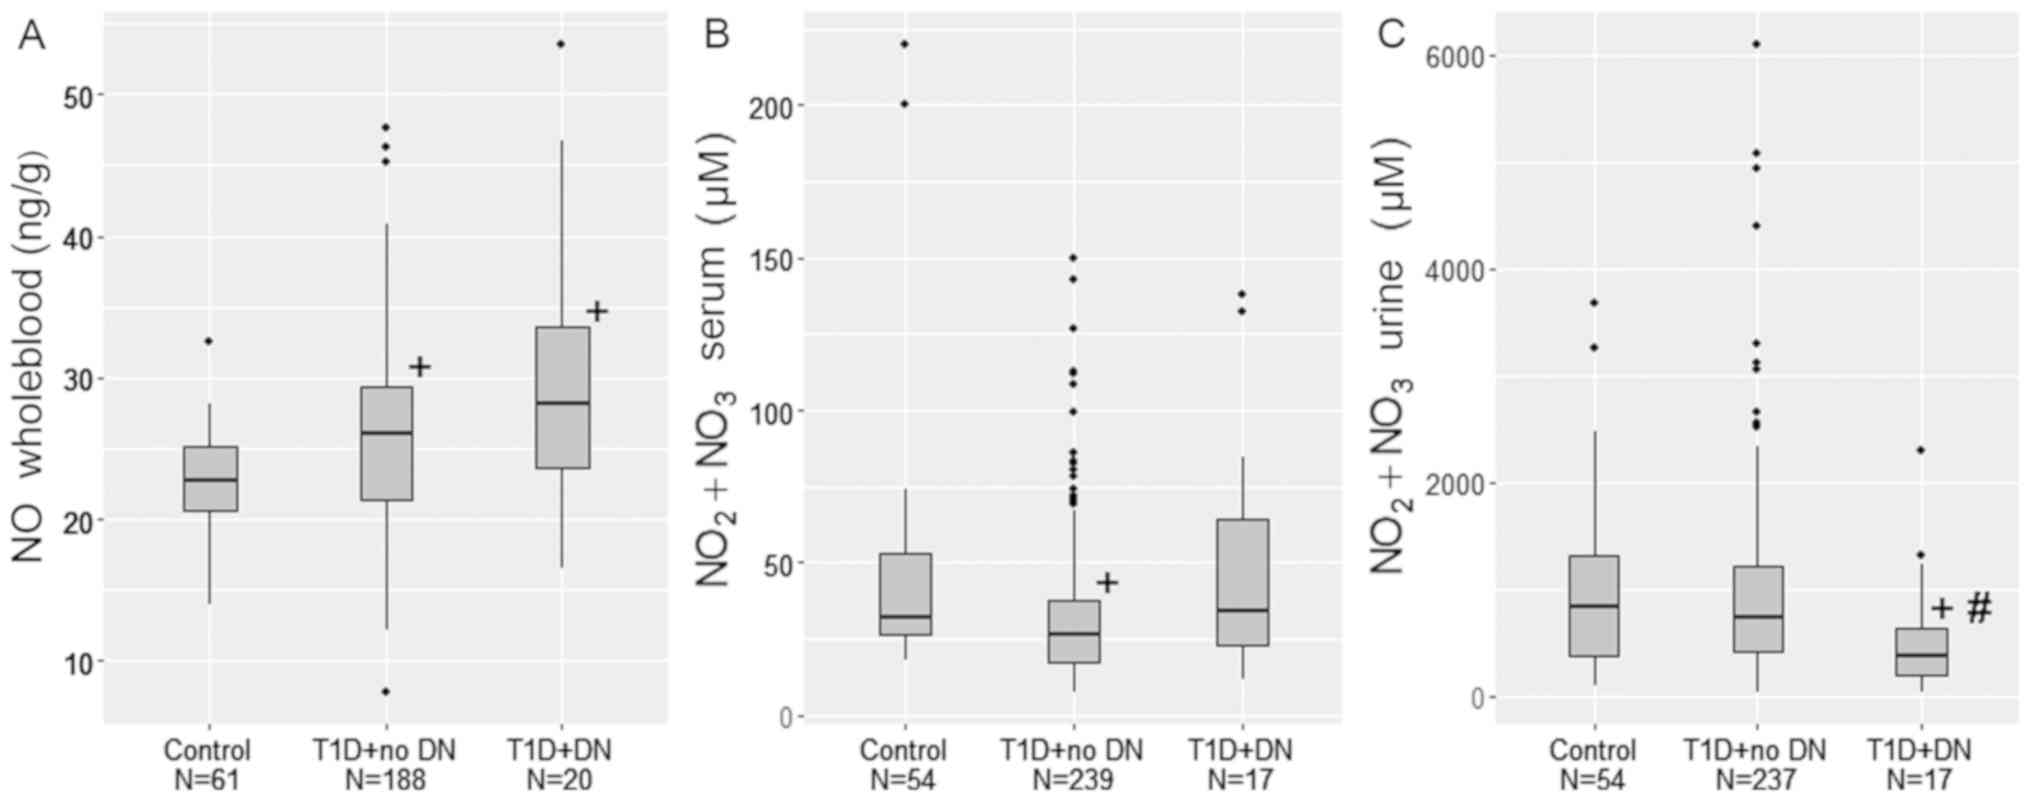
The concentration of whole blood NO was
significantly increased in patients with T1D, compared with
controls (P<0.05). Within T1D patients, the presence of diabetic
nephropathy did not lead to a further increase in NO (Fig. 1A and Table
II).
| Table IIMarkers of nitric oxide metabolism in
healthy subjects and patients with type 1 diabetes with and without
nephropathy. |
Table II
Markers of nitric oxide metabolism in
healthy subjects and patients with type 1 diabetes with and without
nephropathy.
| Groups | NO, ng/g whole
blood |
NO2-+NO3-,
µM, serum |
NO2-+NO3-,
µM, urine |
|---|
| Healthy subjects,
n | 22.8 (20.6-25.1),
69 | 32.1 (26.5-53.3),
39 | 842.7
(370.9-1304.8), 39 |
| Type 1 diabetes
without nephropathy; n | 26.0 (21.3-29.3),
185a | 26.3 (17.6-37.5),
246c | 729.0
(417.9-1215.8), 245 |
| Type 1 diabetes and
nephropathy; n | 28.2 (23.7-33.5),
15b | 34.0 (22.9-64.5),
22f | 365.4
(188.8-626.7), 21d,e |
Concentration of
NO2-+NO3- in the serum
of patients with T1D and healthy subjects
The concentration of
NO2-+NO3- in the serum
was significantly decreased (P=0.003) in patients with T1D and no
nephropathy compared with healthy subjects. However, in patients
with T1D and nephropathy, serum concentration of
NO2-+NO3- did not
differ from the control group (Fig.
1B and Table II).
Concentration of
NO2-+NO3- in the urine
of patients with T1D and healthy subjects
NO2-+NO3- in urine did
not differ between patients with uncomplicated T1D and controls.
Within the T1D group, the concentration of
NO2-+NO3- in urine was
significantly decreased in patients with diabetic nephropathy, when
compared with patients without diabetic nephropathy (P=0.006) and
healthy subjects (P=0.010; Fig. 1C
and Table II).
Correlation between parameters of
nitric oxide metabolism in patients with T1D and healthy
subjects
A strong positive significant correlation was
observed between eGFR and urine
NO2-+NO3- in healthy
subjects (R=0.688; P=0.008). This correlation was also significant,
although weak in patients with type 1 diabetes (R=0.190;
P=0.002).
A medium positive significant correlation was
observed between
NO2-+NO3- in serum and
NO2-+NO3- in urine in
healthy subjects (R=0.492; P=0.002) and T1D patients without
diabetic nephropathy (R=0.559; P<0.001), but not in T1D patients
with diabetic nephropathy (R=0.351; P=0.120).
In patients with diabetes, a weak negative
correlation was observed between diabetes duration and urine
NO2-+NO3- (R=-0.131;
P=0.032) and a weak positive correlation between albuminuria and
serum NO2-+NO3-
(R=0.150; P=0.015).
No correlation was observed between blood NO and
NO2-+NO3- in urine and
serum (Table III).
| Table IIICorrelation of nephropathy-related
parameters with markers of nitric oxide metabolism. |
Table III
Correlation of nephropathy-related
parameters with markers of nitric oxide metabolism.
| Groups | Variable 1 | Variable 2 | Correlation
coefficient (R) | P-value |
|---|
| Healthy
subjects | eGFR |
NO2-+NO3-
urine | 0.688 | 0.008 |
| Type 1
diabetes | eGFR |
NO2-+NO3-
urine | 0.190 | 0.002 |
| Healthy
subjects | eGFR |
NO2-+NO3-
serum | 0.090 | 0.762 |
| Type 1
diabetes | eGFR |
NO2-+NO3-
serum | -0.051 | 0.406 |
| Healthy
subjects | eGFR | NO | -0.215 | 0.222 |
| Type 1
diabetes | eGFR | NO | -0.099 | 0.165 |
| Type 1
diabetes | Diabetes
duration |
NO2-+NO3-
urine | -0.131 | 0.032 |
| Type 1
diabetes | Diabetes
duration |
NO2-+NO3-
serum | 0.049 | 0.425 |
| Type 1
diabetes | Diabetes
duration | NO | -0.029 | 0.684 |
| Type 1
diabetes | Albuminuria |
NO2-+NO3-
urine | -0.064 | 0.304 |
| Type 1
diabetes | Albuminuria |
NO2-+NO3-
serum | 0.150 | 0.015 |
| Type 1
diabetes | Albuminuria | NO | 0.094 | 0.184 |
| Healthy
subjects |
NO2-+NO3-
urine |
NO2-+NO3- serum | 0.492 | 0.002 |
| Type 1 diabetes +
no DN |
NO2-+NO3-
urine |
NO2-+NO3-
serum | 0.559 | <0.001 |
| Type 1 diabetes +
DN |
NO2-+NO3-
urine |
NO2-+NO3-
serum | 0.351 | 0.120 |
| Healthy
subjects | NO |
NO2-+NO3-
serum | -0.253 | 0.120 |
| Type 1 diabetes +
no DN | NO |
NO2-+NO3-
serum | -0.095 | 0.200 |
| Type 1 diabetes +
DN | NO |
NO2-+NO3-
serum | -0.339 | 0.216 |
| Healthy
subjects | NO |
NO2-+NO3-
urine | -0.216 | 0.188 |
| Type 1 diabetes +
no DN | NO |
NO2-+NO3-
urine | -0.042 | 0.570 |
| Type 1 diabetes +
DN | NO |
NO2-+NO3-
urine | -0.332 | 0.246 |
Predictors of markers of NO metabolism
identified by linear regression models in patients with T1D
To identify predictors of NO in whole blood,
NO2-+NO3- in serum and
urine in patients with T1D, three regression models adjusted for
age, sex, diabetes duration, blood pressure, BMI, smoking, HbA1c,
serum lipids, urine albumin/creatinine ratio, eGFR and nephropathy
status were used. After application of a stepwise selection model
based on AIC for a model with NO as a dependent variable,
significant predictors remaining in the model were diabetes
duration, sex, albuminuria and diabetic nephropathy. For
NO2-+NO3- in serum,
significant predictors were only HbA1c and eGFR. For
NO2-+NO3- in urine,
significant predictors were sex, BMI, albuminuria and eGFR
(Table IV).
| Table IVAssociations between concentrations
of NO in whole blood,
NO2-+NO3- in serum and
urine and clinical characteristics. |
Table IV
Associations between concentrations
of NO in whole blood,
NO2-+NO3- in serum and
urine and clinical characteristics.
| Dependent
variables | Predictors | B (95% CI) | P-value | R-squared |
|---|
| NO in whole blood,
ng/g | Intercept | 25.951 (23.938,
27.964) | <0.001 | 0.134 |
| | Diabetes duration,
years | -0.101 (-0.192,
-0.01) | 0.032 | |
| | Sex,
male/female | 2.962 (0.91,
5.014) | 0.005 | |
| | Albumin/creatinine
in urine, mg/mmol | -0.029 (-0.048,
-0.01) | 0.003 | |
| | Diabetic
nephropathy, yes/no | 10.241 (5.271,
15.212) | <0.001 | |
|
NO2-+NO3-
in serum, µM | Intercept | 34.561 (11.73,
57.392) | 0.003 | 0.028 |
| | HbA1c, % | 1.844 (-0.045,
3.733) | 0.057 | |
| | eGFR, ml/min/1.73
cm2 | -0.158 (-0.327,
0.011) | 0.069 | |
|
NO2-+NO3-
in urine, µM | Intercept | 1285.682 (158.895,
2412.469) | 0.026 | 0.106 |
| | Sex,
male/female | -329.72 (-552.273,
-107.166) | 0.004 | |
| | Body mass index,
kg/m2 | -27.377 (-55.448,
0.694) | 0.057 | |
| | Albumin/creatinine
in urine, mg/mmol | -1.707 (-3.345,
-0.069) | 0.042 | |
| | eGFR, ml/min/1.73
cm2 | 4.886 (-1.019,
10.792) | 0.106 | |
Discussion
The present study aimed to assess the impact of T1D
and diabetic nephropathy on the concentrations of NO in whole
blood, and its metabolites
NO2-+NO3- in serum and
urine in patients with T1D.
In the present study, it was demonstrated that T1D
resulted in increased NO production in whole blood and decreased
NO2-+NO3- concentration
in the serum. However, when T1D is complicated by diabetic kidney
disease, urine excretion of
NO2-+NO3- is decreased,
which results in serum
NO2-+NO3- not differing
from the levels of healthy controls.
To the best of our knowledge, the present study is
the first to measure NO concentration in whole blood measured by
EPR in T1D patients. As in human tissues one can measure NO in
ex vivo specimens only; in the present study, blood
specimens were collected and incubated with a spin trap for 30 min.
Therefore, the measured NO should have been produced by blood cells
during the incubation or released from transporting molecules.
Indeed, the ability to produce NO was reported for several types of
blood cells. Previously, increased NO production in aged
erythrocytes of patients with type 2 diabetes was reported
(26). Increased NO production in
whole blood of T1D patients in the present study could result from
several processes. Besides being a NO depot due to the formation of
NO and haemoglobin complexes, erythrocytes can produce NO, as they
contain endothelial NO synthase (27). White blood cells and platelets produce
NO via NO synthases (28-31)
or independently of NO synthases (32). Finally, a nitric oxide synthase
(NOS)-independent NO production from
NO2-+NO3- is possible,
especially in conditions characterised by endothelial dysfunction,
low systemic pH and hypoxia, such as diabetes (10). Despite the fact that the present study
could not demonstrate higher whole blood NO in patients with
diabetic nephropathy, regression analysis indicated positive
association between whole blood NO and diabetic nephropathy status.
Therefore, the present results could be the first indication of
increased NO production in blood cells of T1D patients.
In contrast to data on NO in the whole blood, lower
serum NO2-+NO3-
concentration were observed in patients with T1D and no diabetic
nephropathy, compared with control subjects. Considering the
above-mentioned increase of NO production by blood cells, this
result underlines the differences of NO metabolism in different
tissues. Indeed, in blood serum total
NO2-+NO3- was measured,
which consists of metabolites of NO produced by endothelium, blood
cells and other tissues. To evaluate the contribution of the
measured whole blood NO concentration in the present study (~25
ng/g) to blood serum
NO2-+NO3-, this was
recalculated in micromoles: It gives <1 µM in 30 min, which
should be insignificant, as the measured serum
NO2-+NO3-
concentrations in the present study were on average >25 µM. To
support the lack of direct association between blood NO and serum
NO2-+NO3-, no
correlation was found between these markers. Therefore, it can be
can concluded that T1D leads to a decrease in serum
NO2-+NO3- concentration
and these changes are not dependent on NO production by blood
cells. This decrease might be explained by decreased NO
bioavailability due to diabetes-induced oxidative stress, when NO
is scavenged by reactive oxygen species and ONOO- is
formed (4,33). Data similar to the current findings
have been reported in T1D (14) and
type 2 diabetes (34). However, there
are studies which report no differences in serum
NO2-+NO3-
concentrations in T2D patients compared with control subjects
(35) and increased serum
NO2-+NO3- in early T1D
(16,36).
Although one would expect that in patients with T1D
and diabetic nephropathy the concentration of serum
NO2-+NO3- should
decrease even further, in the present study, it did not differ from
the levels observed in the control group. The reason for this
observation might be the decreased eGFR in diabetic nephropathy
group and thus some accumulation of serum
NO2-+NO3-. Indeed,
although serum and urine
NO2-+NO3- demonstrated
medium positive correlation in healthy subjects and patients with
diabetes and no nephropathy, this correlation was not observed in
patients with nephropathy. Moreover, regression analysis indicated
that in patients with T1D, an increase in serum
NO2-+NO3- is expected
when eGFR decreases. Therefore, it is hypothesized that this
accumulation of
NO2-+NO3- in
circulation might become a source of the NOS-independent NO
synthesis (9,10) and consequent nitrosative stress that
has been observed in diabetes (37).
Thus, the authors hypothesized that the idea of inorganic
nitrate/nitrite supplementation as a tool for prevention and
treatment of complications of diabetes and atherosclerosis is
controversial (4,10,17,18,38,39).
Indeed, other researchers have also reported increased serum
NO2-+NO3- in diabetic
complications (15,34,35,40).
To supplement the present data on
NO2-+NO3- in serum,
decreased urine
NO2-+NO3-
concentrations were reported in patients with diabetic nephropathy.
Moreover, albuminuria was a significant negative predictor of urine
NO2-+NO3- in regression
analysis. Decreased urine
NO2-+NO3- excretion in
diabetic nephropathy might be the consequence of deregulated NO
synthesis in the microvasculature of kidney in diabetes due to
altered expression of NOS isoforms (6,8). It can
also result from a decrease in kidney function characteristic for
diabetic nephropathy and leading to accumulation of NO metabolites
in the blood, as discussed above. Indeed, a positive correlation
was observed between urine
NO2-+NO3- and eGFR in
patients with T1D and healthy subjects, in agreement with the data
of other studies (14,15,41).
The present study has some limitations. Major
concerns are: The cross-sectional design of the study and the low
number of patients with diabetic nephropathy. Subjects in the
control group differ from T1D patients in age; all other
differences between the groups are associated with diabetes and
diabetic nephropathy.
The advantages of this study include previously
unpublished data on NO in whole blood measured by EPR spectroscopy,
a relatively large population of patients with T1D included and
analysis of different markers of NO metabolism in patients with T1D
and diabetic nephropathy.
To conclude, whole blood NO, serum and urine
NO2-+NO3- are affected
differently by T1D and diabetic nephropathy. Uncomplicated T1D is
characterised by increased whole blood NO and decreased serum
NO2-+NO3-. In diabetic
kidney disease, urine excretion of
NO2-+NO3- is decreased,
which results in serum
NO2-+NO3- not differing
from the levels of healthy controls. Thus, kidney function is
associated with NO metabolism in T1D. Studies with larger number of
T1D patients with diabetic nephropathy are needed for an improved
understanding of derangements of NO metabolism in diabetic kidney
disease.
Acknowledgements
The authors of the present study would like to
thank Mrs. Sanita Kalva-Vaivode and Mrs. Mārīte Cirse for patient
recruitment, Dr Rihards Mallons, Dr Zane Dzērve and Dr Sabīne
Skrebinska for their assistance with data management and Dr Carol
Forsblom from the FinnDiane group for her valuable comments
concerning presentation of data. LatDiane acknowledges all
physicians involved in the recruitment of patients.
Funding
The present study was supported by the State Genome
database project, Latvian Association of Endocrinology, a project
of the University of Latvia: ‘Research of biomarkers and natural
substances for acute and chronic diseases’ diagnostics and
personalised treatment’.
Availability of data and materials
The datasets used and/or analysed during the
current study are available from the corresponding author on
reasonable request.
Authors' contributions
JS designed the clinical set up of the study and
wrote the manuscript. LB performed all measurements of nitric oxide
by EPR method. KD performed all measurements of nitrite and
nitrite. AD organized the logistics of the study. LP and JV did the
statistical analysis. VR was responsible for biobanking. VP
contributed to interpretation of the results and edited the
manuscript. NS designed the study as well as wrote and edited the
manuscript. All authors read and approved the final manuscript.
Ethics approval and consent to
participate
This study is in line with the 1975 Declaration of
Helsinki and received the Latvian Central Ethics Committee approval
Nr.01-29.1/3. All subjects gave their written informed consent to
participate.
Patient consent for publication
Not applicable.
Competing interests
The authors declare that they have no competing
interests.
References
|
1
|
Davies MJ, D'Alessio DA, Fradkin J, Kernan
WN, Mathieu C, Mingrone G, Rossing P, Tsapas A, Wexler DJ and Buse
JB: Management of hyperglycaemia in type 2 diabetes, 2018. A
consensus report by the American diabetes association (ADA) and the
European association for the study of diabetes (EASD).
Diabetologia. 61:2461–2498. 2018.PubMed/NCBI View Article : Google Scholar
|
|
2
|
Brownlee M: The pathobiology of diabetic
complications: A unifying mechanism. Diabetes. 54:1615–1625.
2005.PubMed/NCBI View Article : Google Scholar
|
|
3
|
Dellamea BS, Leitão CB, Friedman R and
Canani LH: Nitric oxide system and diabetic nephropathy. Diabetol
Metab Syndr. 6(17)2014.PubMed/NCBI View Article : Google Scholar
|
|
4
|
Yamagishi S and Matsui T: Nitric oxide, a
janus-faced therapeutic target for diabetic microangiopathy-Friend
or foe? Pharmacol Res. 64:187–194. 2011.PubMed/NCBI View Article : Google Scholar
|
|
5
|
Pacher P, Beckman J and Liaudet L: Nitric
oxide and peroxynitrite in health and disease. Physiol Rev.
87:315–424. 2007.PubMed/NCBI View Article : Google Scholar
|
|
6
|
Tessari P: Nitric oxide in the normal
kidney and in patients with diabetic nephropathy. J Nephrol.
28:257–268. 2015.PubMed/NCBI View Article : Google Scholar
|
|
7
|
Ošiņa K, Rostoka E, Sokolovska J,
Paramonova N, Bisenieks E, Duburs G, Sjakste N and Sjakste T:
1,4-Dihydropyridine derivatives without Ca2+-antagonist
activity up-regulate Psma6 mRNA expression in kidneys of intact and
diabetic rats. Cell Biochem Funct. 34:3–6. 2016.PubMed/NCBI View Article : Google Scholar
|
|
8
|
Leonova E, Sokolovska J, Boucher JL,
Isajevs S, Rostoka E, Baumane L, Sjakste T and Sjakste N: New
1,4-Dihydropyridines down-regulate nitric oxide in animals with
streptozotocin-induced diabetes mellitus and protect
deoxyribonucleic acid against peroxynitrite action. Basic Clin
Pharmacol Toxicol. 119:19–31. 2016.PubMed/NCBI View Article : Google Scholar
|
|
9
|
Zweier JL and Talukder MA: The role of
oxidants and free radicals in reperfusion injury. Cardiovasc Res.
70:181–190. 2006.PubMed/NCBI View Article : Google Scholar
|
|
10
|
Alef MJ, Tzeng E and Zuckerbraun BS:
Nitric oxide and nitrite-based therapeutic opportunities in intimal
hyperplasia. Nitric Oxide. 26:285–294. 2012.PubMed/NCBI View Article : Google Scholar
|
|
11
|
Chen JY, Ye ZX, Wang XF, Chang J, Yang MW,
Zhong HH, Hong FF and Yang SL: Nitric oxide bioavailability
dysfunction involves in atherosclerosis. Biomed Pharmacother.
97:423–428. 2018.PubMed/NCBI View Article : Google Scholar
|
|
12
|
Ceriello A and Testa R: Antioxidant
anti-inflammatory treatment in type 2 diabetes. Diabetes Care. 32
(Suppl 2):S232–S236. 2009.PubMed/NCBI View Article : Google Scholar
|
|
13
|
Tessari P, Cecchet D, Cosma A, Vettore M,
Coracina A, Millioni R, Iori E, Puricelli L, Avogaro A and Vedovato
M: Nitric oxide synthesis is reduced in subjects with type 2
diabetes and nephropathy. Diabetes. 59:2152–2159. 2010.PubMed/NCBI View Article : Google Scholar
|
|
14
|
Cherney DZ, Reich HN, Jiang S, Har R,
Nasrallah R, Hébert RL, Lai V, Scholey JW and Sochett EB:
Hyperfiltration and effect of nitric oxide inhibition on renal and
endothelial function in humans with uncomplicated type 1 diabetes
mellitus. Am J Physiol Regul Integr Comp Physiol. 303:R710–R718.
2012.PubMed/NCBI View Article : Google Scholar
|
|
15
|
Chiarelli F, Cipollone F, Romano F, Tumini
S, Costantini F, di Ricco L, Pomilio M, Pierdomenico SD, Marini M,
Cuccurullo F and Mezzetti A: Increased circulating nitric oxide in
young patinets with type 1 diabetes and persistent
microalbuminuria: Relation to glomerular hyperfiltration. Diabetes.
49:1258–1263. 2000.PubMed/NCBI View Article : Google Scholar
|
|
16
|
Savino A, Pelliccia P, Schiavone C,
Primavera A, Tumini S, Mohn A and Chiarelli F: Serum and urinary
nitrites and nitrates and doppler sonography in children with
diabetes. Diabetes Care. 29:2676–2681. 2006.PubMed/NCBI View Article : Google Scholar
|
|
17
|
Ma L, Hu L, Feng X and Wang S: Nitrate and
nitrite in health and disease. Aging Dis. 9:938–945.
2018.PubMed/NCBI View Article : Google Scholar
|
|
18
|
Bahadoran Z, Ghasemi A, Mirmiran P, Azizi
F and Hadaegh F: Beneficial effects of inorganic nitrate/nitrite in
type 2 diabetes and its complications. Nutr Metab (Lond).
12(16)2015.PubMed/NCBI View Article : Google Scholar
|
|
19
|
Vanin AF: Dinitrosyl iron complexes and
S-nitrosothiols are two possible forms for stabilization and
transport of nitric oxide in biological systems. Biochemistry
(Mosc). 63:782–793. 1998.PubMed/NCBI
|
|
20
|
Zhang X: Real time and in vivo monitoring
of nitric oxide by electrocehmical sensors-from dream to reality.
Front Biosci. 9:3434–3446. 2004.PubMed/NCBI View
Article : Google Scholar
|
|
21
|
Sun J, Zhang X, Broderick M and Fein H:
Measurement of nitric oxide production in biological systems by
using griess reaction assay. Sensors. 3:276–284. 2003.
|
|
22
|
National Kidney Foundation: K/DOQI
clinical practice guidelines for chronic kidney disease:
Evaluation, classification, and stratification. Am J Kidney Dis 39
(Suppl 1): S1-S266, 2002.
|
|
23
|
Levey AS, Stevens LA, Schmid CH, Zhang YL,
Castro AF III, Feldman HI, Kusek JW, Eggers P, Van Lente F, Greene
T and Coresh J: CKD-EPI (Chronic Kidney Disease Epidemiology
Collaboration). A new equation to estimate glomerular filtration
rate. Ann Intern Med. 150:604–612. 2009.PubMed/NCBI View Article : Google Scholar
|
|
24
|
Borisovs V, Ļeonova E, Baumane L, Kalniņa
J, Mjagkova N and Sjakste N: Blood levels of nitric oxide and DNA
breaks assayed in whole blood and isolated peripheral blood
mononucleated cells in patients with multiple sclerosis. Mutat Res.
843:90–94. 2018.PubMed/NCBI View Article : Google Scholar
|
|
25
|
R Core Team (2012) R: A language and
environment for statistical computing. R Foundation for Statistical
Computing, Vienna, Austria. ISBN 3-900051-07-0, URL. http://www.R.project.org/.
|
|
26
|
Bizjak DA, Brinkmann C, Bloch W and Grau
M: Increase in red blood cell-nitric oxide synthase dependent
nitric oxide production during red blood cell aging in health and
disease: A study on age dependent changes of rheologic and
enzymatic properties in red blood cells. PLoS One.
10(e0125206)2015.PubMed/NCBI View Article : Google Scholar
|
|
27
|
Cortese-Krott MM and Kelm M: Endothelial
nitric oxide synthase in red blood cells: Key to a new erythrocrine
function? Redox Biol. 2:251–258. 2014.PubMed/NCBI View Article : Google Scholar
|
|
28
|
Garcia-Bonilla L, Moore JM, Racchumi G,
Zhou P, Butler JM, Iadecola C and Anrather J: Inducible nitric
oxide synthase in neutrophils and endothelium contributes to
ischemic brain injury in mice. J Immunol. 193:2531–2537.
2014.PubMed/NCBI View Article : Google Scholar
|
|
29
|
Gambaryan S and Tsikas D: A review and
discussion of platelet nitric oxide and nitric oxide synthase: Do
blood platelets produce nitric oxide from l-arginine or nitrite?
Amino Acids. 7:1779–1793. 2015.PubMed/NCBI View Article : Google Scholar
|
|
30
|
Saluja R, Saini R, Mitra K, Bajpai VK and
Dikshit M: Ultrastructural immunogold localization of nitric oxide
synthase isoforms in rat and human eosinophils. Cell Tissue Res.
340:381–388. 2010.PubMed/NCBI View Article : Google Scholar
|
|
31
|
Bogdan C: Nitric oxide synthase in innate
and adaptive immunity: An update. Trends Immunol. 36:161–178.
2015.PubMed/NCBI View Article : Google Scholar
|
|
32
|
Tse WY, Williams J, Pall A, Wilkes M,
Savage CO and Adu D: Antineutrophil cytoplasm antibody-induced
neutrophil nitric oxide production is nitric oxide synthase
independent. Kidney Int. 59:593–600. 2001.PubMed/NCBI View Article : Google Scholar
|
|
33
|
Tousoulis D, Kampoli AM, Tentolouris C,
Papageorgiou N and Stefanadis C: The role of nitric oxide on
endothelial function. Curr Vasc Pharmacol. 10:4–18. 2012.PubMed/NCBI View Article : Google Scholar
|
|
34
|
Miyata S, Noda A, Hara Y, Ueyama J,
Kitaichi K, Kondo T and Koike Y: Nitric oxide plasma level as a
barometer of endothelial dysfunction in factory workers. Exp Clin
Endocrinol Diabetes. 125:684–689. 2017.PubMed/NCBI View Article : Google Scholar
|
|
35
|
Doganay S, Evereklioglu C, Er H, Türköz Y,
Sevinç A, Mehmet N and Savli H: Comparison of serum NO, TNF-alpha,
IL-1beta, sIL-2R, IL-6 and IL-8 levels with grades of retinopathy
in patients with diabetes mellitus. Eye (Lond). 16:163–170.
2002.PubMed/NCBI View Article : Google Scholar
|
|
36
|
Hoeldtke RD, Bryner KD and Vandyke K:
Oxidative stress and autonomic nerve function in early type 1
diabetes. Clin Auton Res. 21:19–28. 2011.PubMed/NCBI View Article : Google Scholar
|
|
37
|
Ceriello A: Nitrotyrosine: New findings as
a marker of postprandial oxidative stress. Int J Clin Pract Suppl.
51–58. 2002.PubMed/NCBI
|
|
38
|
Stepanova YI, Kolpakov IY, Zyhalo VM and
Boyarsky VG: Correction of endothelial dysfunction in
children-residents of radioactively contaminated areas by nitric
oxide donator. Probl Radiac Med Radiobiol. 21:336–344.
2016.PubMed/NCBI
|
|
39
|
Norouzirad R, González-Muniesa P and
Ghasemi A: Hypoxia in obesity and diabetes: Potential therapeutic
effects of hyperoxia and nitrate. Oxid Med Cell Longev.
2017(5350267)2017.PubMed/NCBI View Article : Google Scholar
|
|
40
|
Gumanova NG, Teplova NV, Ryabchenko AU and
Denisov EN: Serum nitrate and nitrite levels in patients with
hypertension and ischemic stroke depend on diet: A multicenter
study. Clin Biochem. 48:29–32. 2015.PubMed/NCBI View Article : Google Scholar
|
|
41
|
Schneider MP, Ott C, Schmidt S, Kistner I,
Friedrich S and Schmieder RE: Poor glycemic control is related to
increased nitric oxide activity within the renal circulation of
patients with type 2 diabetes. Diabetes Care. 36:4071–4075.
2013.PubMed/NCBI View Article : Google Scholar
|