Introduction
Nitric oxide (NO) acts as an intracellular messenger
in physiological and pathological conditions (1). The bioavailability of NO, and therefore
its ability to perform physiological functions, can be affected by
the excessive production of reactive oxygen species (ROS) involved
in the development of diabetes. ROS have the capacity to reduce the
enzymatic (2) and non-enzymatic
(3) production of NO, or simply
eliminate it from tissues. NO reacts with superoxide radicals
resulting in peroxynitrite, a very potent oxidant that reacts with
tyrosine residues of proteins to form 3-nitrotirosine (3NT). 3NT
serves as an indicator of nitrosative stress, the elimination of NO
or modulation of signaling pathways. According to studies using
animal models, NO decreases the harmful effects of ROS on
biomolecules, whereas ROS limits the effects of NO by eliminating
it (4) or affecting its intracellular
receptors (5). Diabetes and its
complications increase dysfunction of the endothelium (6), the possible mechanisms of which are
discussed in a recent review (7).
In general, the bioavailability of NO is diminished
during the pathogenesis of diabetes (7-9),
despite an increase in the plasma levels in patients, as was shown
by a meta-analysis (10). This
limited bioavailability may be due to the elimination of NO by the
superoxide radical (11), or by
modulation of its production through enzymatic mechanisms (12) and/or nonenzymatic conditions such as
ischemia or stomach acidity (13,14).
Glutathione (GSH) is an abundant endogenous
antioxidant synthesized in large quantities in the liver. It is
transported via blood flow to tissues when there is an imbalance
between the production of ROS and the endogenous antioxidant
mechanisms. Extracellular GSH is not able to pass through cell
membranes; however, following enzymatic breakdown into its
constituent amino acids, these amino acids are able to traverse the
membrane. Once inside the cell, the amino acids are available for
the resynthesis of GSH. GSH is irreversibly utilized when its
product of oxidation (GSSG) is not recycled into GSH by glutathione
reductase (15). The erythrocyte GSH
levels are lower in patients with type 2 diabetes (16,17) and
there are reports that have shown that GSH production gradually
decreases in patients with diabetes with complications (18,19), and
that this decrease is dependent on the degree of hyperglycemia
(20). In a recent study it was shown
that a high-fat diet resulted in GSH deficiency in the kidney of
mice (21). GSH has a high affinity
for NO, and S-nitrosoglutathione is the primary intermediary
metabolite in the production of other nitrosothiols which serve as
metabolic regulators (22,23). Based on an in vivo study using
endotoxemic mice, an increase in NO resulted in decreased GSH
synthesis, whereas a decrease in NO levels had the opposite effect
(24).
Exercise prevents the harmful effects of ROS, and NO
may be a central signaling molecule involved in the adaptation of
muscles to exercise (25). A recent
review analyzed the evidence showing the protective effects of
aerobic exercise against the development of complications in
patients with diabetes (26).
Hyperbaric oxygenation (HBO) shows a beneficial therapeutic effect
in patients with ulcers caused by diabetes; however, the underlying
mechanisms have not been fully resolved. Pre-treatment with HBO
exhibits a protective effect against oxidative stress in different
types of tissues in animal models of various pathological processes
or stress (27-31).
Several studies have explored the hypothesis that oxidative stress
serves an important role in HBO-mediated effects at the cellular
level (32,33). However, studies examining the effects
of HBO on NO metabolism are limited: An increase in pulmonary
(34) or cardiac levels of NO
(35) results in a vasodilatory
effect, and thus an increase of oxygen being delivered to tissues
(36). The aim of the present study
was to evaluate the levels of NO, 3NT and GSH in mice with type 2
diabetes induced by a high-fat/high-fructose (HFHF) diet, compared
with control animals, and the effects of exercise and/or HBO on NO,
3NT and GSH levels in the diabetic mice.
Materials and methods
Animals and study design
A total of 70 3-month-old female CD1 mice (average
weight, 35.8 g) were housed in acrylic cages (20x20x30 cm) with a
12:12 h light/dark cycle. Mice pups were used as adult female
rodents and humans have a similar pattern of growth, in which
weight is stabilized at the adult stage (37). The synchronization of the estrous
cycle in the mice was not taken into consideration. In the first 3
months (phase 1), animals were fed a normal (control group) or a
HFHF diet in (diabetes group) and parameters were measured in
samples taken at the end of the 3 months and were used as the
initial values. The use of drinking liquids that contained fructose
results in a high fasting levels of glucose in the animals
(38). Therefore, these mice were
included in the high-fat diet. At the end of the second 3-month
period (phase 2), samples were taken again from the untreated
groups (final values) and from the experimental groups: After
exercise training, HBO or a combination of these two treatments.
The treatments were compared to the untreated diabetic mice. The
final values of the control mice were used to examine the effects
of ageing between the two phases. The time frame of the protocol
and the animal groups are illustrated in Table I.
 | Table ITime frame of the protocol used and
the different groups used. |
Table I
Time frame of the protocol used and
the different groups used.
| Animal groups | Phase
1a, diet | Phase
2b, treatment |
|---|
|
Controlc | Normal | - |
|
Diabetesc | HFHF | - |
| Control | Normal | Untreated |
| Diabetes | HFHF | Untreated |
| Diabetes | HFHF | Exercise |
| Diabetes | HFHF | HBO |
| Diabetes | HFHF | Exercise + HBO |
The percentage composition of the normal diet
(Chow), consumed by the control mice was 9% fat, 29% protein and
62% carbohydrates. For the high-fat diet, the normal solid food was
enriched with lard baked at 100˚C, resulting in percentage
composition of micronutrients of 38% fat, 19% protein and 43%
carbohydrates. The high-fructose diet consisted of 40%
carbohydrates (30% fructose and 10% dextrose) in a solution of
water. Food and water were provided ad libitum for the
control group and water with fructose and a HF diet for the
experimental group. Weight and body composition (Lee index:
;
where g is the weight in grams and l is the length of mice in mm)
were evaluated at the beginning and end of phase 2. Glucose
tolerance was quantified at the end of phase 1 by comparing the
diabetic group to the control group. A solution of 60% dextrose was
injected intraperitoneally at a dose of 3 g/kg. The glucose
concentration in the blood was measured after 0, 15, 30, 60, 90 and
120 min by taking blood samples from the tail.
At the start of phase 2, 7 mice from each group
(control and diabetes) were sacrificed by the intraperitoneal
injection of pentobarbital (100 mg/kg) to determine the initial
values of parameters in different tissues. During phase 2, the
animals in the control and diabetes groups were fed with their
respective diets. The total duration of the experiment was 6
months.
Treatments
The exercise protocol started with a 2-week
adaptation period of swimming (flotation) sessions 3 times per
week. The time of each session was gradually increased from 10 to
60 min. For the following 12 weeks, the mice were trained 3 times
per week, 60 min per session. The present protocol was designated
as moderate exercise training, based on a comparison to other
rodent studies using swimming training (39,40). The
water temperature was 32±2˚C. For the swimming sessions, animals
were placed in transparent tanks divided into cells (25x25 cm), one
animal per cell. Following each exercise session, mice were dried
and returned to their cages. All sessions were conducted between 11
am and 1 pm. The HBO procedure was carried out from 9 am to 10:30
am in a hyperbaric chamber for small animals, using an oxygen
pressure of 2 ATA (15 min pressurization, 60 min exposure and 15
min depressurization). A total of 10 HBO sessions were performed,
once every other day, in the second month of phase 2, as the
therapeutic use of HBO in humans includes 10-20 sessions (32). Upon completion of HBO and/or exercise,
animals were returned to their cages and fed with their
corresponding diet.
Tissue processing
The values of the measured parameters were assessed
in tissues extracted from the liver, skeletal muscle (the vastus
lateralis from the hind leg), lung, heart, thoracic aorta,
brain, spleen, small intestine (lamina propria and mucosa), kidney
and visceral adipose tissue. The aforementioned parameters were
assessed in these tissues for the following physiological reasons:
To evaluate the possible redistribution of GSH from the liver to
other tissues during stress, and to examine whether there was a
relation between redistribution and the response to NO. Samples
were obtained by placing a tissue in 30 mmol cold PBS (pH 7.2) and
adding 0.1% of Triton X-100 (1 mg of tissue per 10 µl buffer).
Tissues were homogenized and centrifuged at 900 x g. for 15 min at
4˚C and the supernatants were stored at -80˚C for processing within
two weeks. Cayman Chemical Company chemical kits were used to
measure total proteins (TP; cat. no. 704002), NO (nitrate/nitrite
colorimetric assay kit; cat. no. 780001) and total reduced GSH (GSH
assay kit; cat. no. 703002) in the tissue homogenates. In the
tissues with a significant presence of blood (liver, heart and
kidney), the homogenates were treated with an Amicon ultra-0.5
centrifugal filter device (30K) prior to measurement of NO levels.
The levels of 3NT (3NT ELISA kit; Abcam; cat. no. ab116691) was
measured in the homogenates using ELISA. The values of NO, GSH and
3NT are expressed as nmol/mg of TP.
Statistical analysis
GraphPad Prism version 5 (GraphPad Software, Inc.)
was used for statistical analysis. The mean values and standard
deviations were obtained for each group. The count data were
analyzed by ANOVA (7 animals/group), followed by a post-hoc Tukey's
test. Bivariate Pearson's correlation analysis was used to assess
the relation between the parameters in all tissues. P<0.05 was
considered to indicate a statistically significant difference.
Results
Lee index
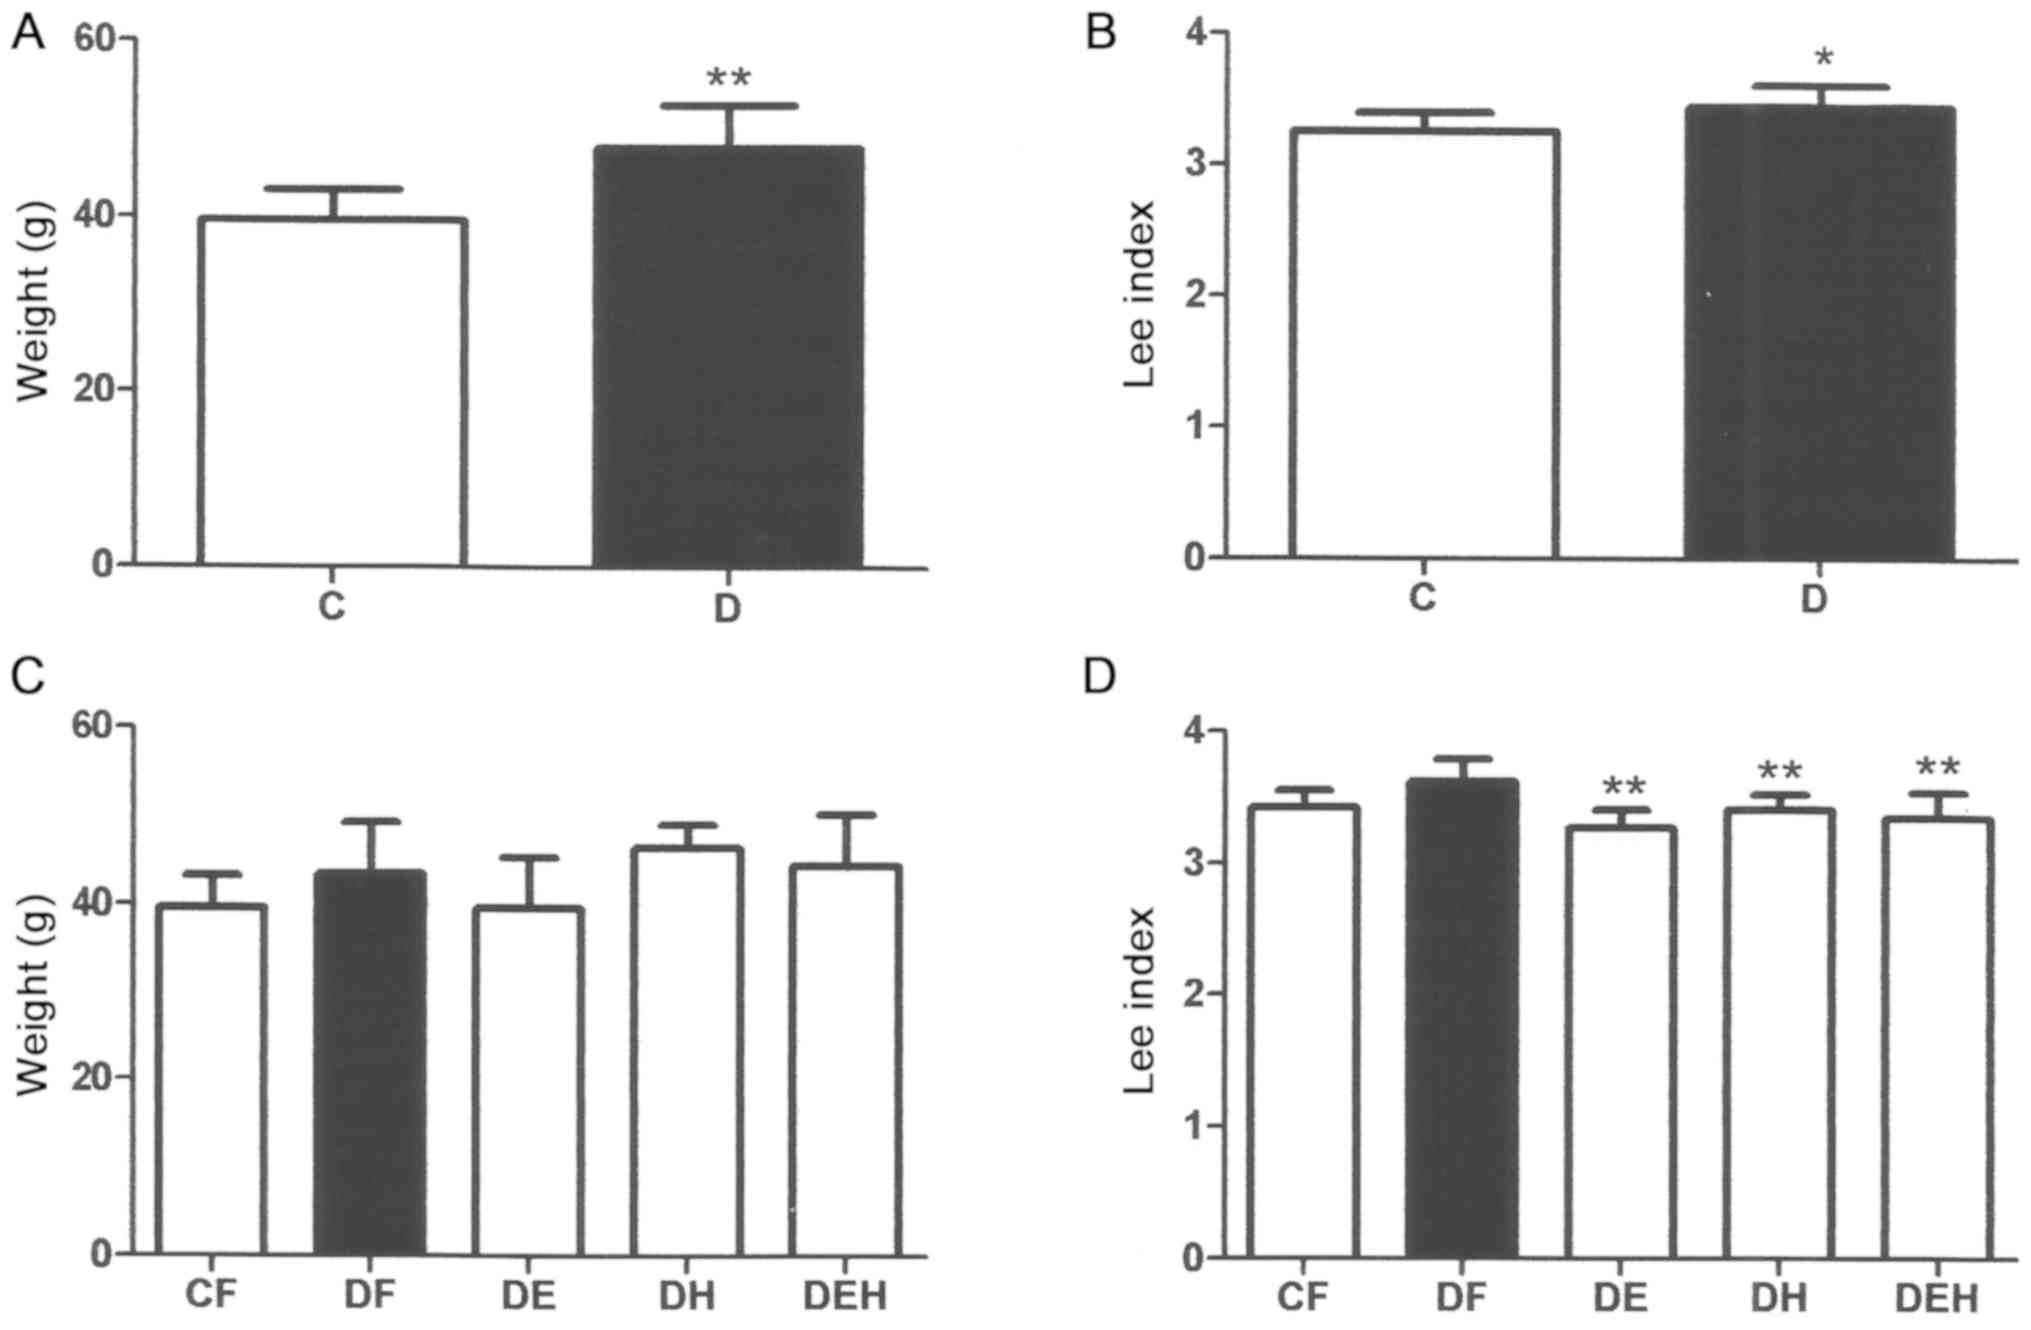
For all animals, the Lee index and weight was
determined at the start (Fig. 1A and
B) and end of phase 2 (Fig. 1C and D).
During phase 1, a significant gain in weight was observed for the
animals fed the HFHF diet (P<0.01; Fig. 1A). The inflammatory response promotes
insulin resistance, which is manifested as weight gain and an
accumulation of body fat (41). The
Lee index, which has a positive correlation with body fat in
females with obesity (42), and is an
indicator of type 2 diabetes, was significantly higher in the
diabetic mice compared with the control mice (Fig. 1B). At the end of phase 2, a
significant decrease in the Lee index was observed for all
treatments (P<0.01; Fig. 1D).
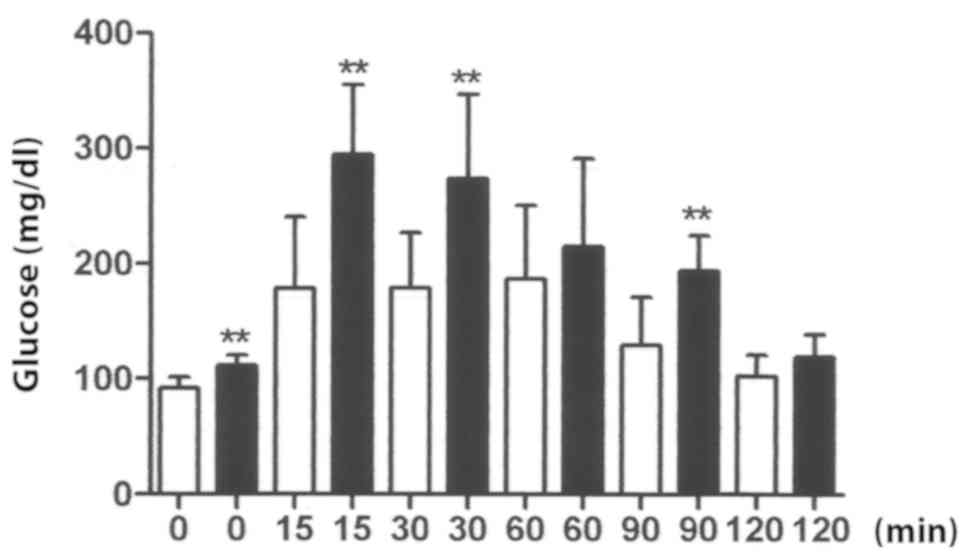
To analyze the behavior of the tolerance curve for
glucose (Fig. 2), it is important to
take into account, the measurement at 15 min captures the rapid
release of insulin into the system. This measurement provides the
first evidence of pancreatic failure. It is also a crucial element
in the diagnosis of type 2 diabetes (38,43,44). The
results confirm the successful establishment of diet-induced
diabetes mellitus type 2 (Figs. 1 and
2). NO, 3NT and GSH levels were
evaluated in tissues from various organs at the beginning and end
of phase 2 to determine the effect of the treatments with exercise
and/or HBO on the diabetic mice. The results of the measured
parameters in all tissues are presented in Table II.
| Table IIInitial, final and post-treatments
levels of NO, 3NT and GSH in all tissues. |
Table II
Initial, final and post-treatments
levels of NO, 3NT and GSH in all tissues.
| A, NO levels,
nmol/mg proteins |
|---|
| Tissue | Initial values in
the control mice | Initial values in
the diabetic mice | Final values in the
control mice | Final values in the
diabetic mice | Values in the
diabetic mice treated with exercise | Values in the
diabetic mice treated with HBO | Values in the
diabetic mice treated with both exercise and HBO |
|---|
| Muscle | 2.7±0.42 |
1.5±0.37b |
1.2±0.17d | 1.1±0.29 | 1.1±0.24 | 1.6±0.33 | 1.2±0.13 |
| Liver | 1.02±0.20 | 0.96±0.15 |
0.37±0.08d |
0.41±0.10f | 0.37±0.24 | 0.36±0.10 | 0.43±0.10 |
| Heart | 0.28±0.08 | 0.25±0.06 |
0.21±0.07c | 0.24±0.06 | 0.18±0.04 | 0.22±0.05 |
0.53±0.12g |
| Kidney | 1.27±0.15 | 1.48±0.15 |
0.42±0.08d |
0.42±0.11f | 0.34±0.05 |
0.28±0.06g |
0.29±0.07g |
| Lung | 2.79±0.83 | 3.25±0.69 |
5.21±1.05d |
2.27±0.46f | 1.96±0.38 |
1.09±0.26h |
0.37±0.10h |
| Brain | 0.40±0.10 | 0.33±0.07 | 0.30±0.09 |
0.21±0.07e | 0.20±0.07 | 1.86±0.70 | 0.18±0.06 |
| Aorta | 4.39±0.98 |
6.65±1.25a |
1.92±0.38d |
0.55±0.12f |
0.28±0.07h |
0.26±0.09h |
0.24±0.08h |
| Lamina propria | 0.35±0.08 | 0.34±0.07 | 0.28±0.09 | 0.26±0.06 | 0.21±0.06 | 0.19±0.06 | 0.19±0.05 |
| Mucosa | 0.32±0.13 | 0.33±0.10 | 0.24±0.09 |
0.23±0.15e | 0.18±0.05 | 0.14±0.04 |
0.55±0.12h |
| Adipose tissue | 3.14±0.67 | 3.56±1.06 |
2.19±0.44d | 5.31±1.46 | 5.17±0.92 | 4.99±0.99 | 3.65±0.92 |
| Spleen | 1.12±0.17 | 1.24±0.31 |
0.18±0.06d |
0.39±0.09f | 0.24±0.08 |
0.23±0.05g |
0.24±0.08g |
| B, 3NT levels,
nmol/mg proteins |
| Tissue | Initial values in
the control mice | Initial values in
the diabetic mice | Final values in the
control mice | Final values in the
diabetic mice | Values in the
diabetic mice treated with exercise | Values in the
diabetic mice treated with HBO | Values in the
diabetic mice treated with both exercise and HBO |
| Muscle | 1.5±0.30 |
0.58±0.12b | 1.9±0.42 | 0.41±0.11 |
1.1±0.24h |
0.05±0.015h |
0.94±0.20h |
| Liver | 6.5±0.92 |
8.9±1.6b | 8.9±1.7 | 10.0±1.48 |
13.6±2.7g |
13.5±2.12h |
15.8±2.67h |
| Heart | 4.5±0.89 |
14.1±1.9b |
10.4±2.3d |
5.9±0.96f | 5.2±0.93 | 4.7±0.96 | 4.5±0.85 |
| Kidney | 3.3±0.43 |
19.7±2.5b | 3.6±0.59 |
12.5±1.85f |
18.9±1.9h |
19.5±2.73h |
18.8±1.96g |
| Lung | 2.5±0.65 |
4.1±0.67b | 2.4±0.60 | 3.4±1.06 |
5.0±0.86h | 3.6±0.65 | 2.9±060 |
| Brain | 1.2±0.18 |
4.9±0.87b | 1.3±0.31 |
3.1±0.59f | 2.7±0.61 | 3.2±0.63 | 4.1±0.95 |
| Aorta | 4.0±0.78 |
12.5±2.6b |
6.6±1.2d | 12.0±2.44 |
6.1±0.92h |
6.5±1.56h |
6.2±1.43h |
| Lamina propria | 2.4±0.58 |
1.3±0.34b |
3.4±0.49c |
1.1±0.29f |
1.9±0.27h | 3.4±0.63 |
3.6±0.71h |
| Mucosa | 0.57±0.10 |
2.0±0.31b | 0.75±0.16 | 2.6±0.45 | 2.5±0.50 | 3.1±0.64 |
3.8±0.90g |
| Adipose tissue | 2.5±0.67 |
16.6±2.6b |
3.6±0.72c |
9.8±2.00f | 10.4±2.92 | 7.4±1.60 | 6.7±1.92 |
| Spleen | 0.74±0.17 |
2.6±0.51b |
2.2±0.48d |
1.8±0.39f | 2.0±0.38 | 2.3±0.40 |
3.9±0.84h |
| C, GSH, U/mg
proteins |
| Tissue | Initial values in
the control mice | Initial values in
the diabetic mice | Final values in the
control mice | Final values in the
diabetic mice | Values in the
diabetic mice treated with exercise | Values in the
diabetic mice treated with HBO | Values in the
diabetic mice treated with both exercise and HBO |
| Muscle | 2.6±0.34 | 2.3±0.48 |
0.22±0.03d |
0.08±0.02f |
0.31±0.06h |
0.44±0.07h |
0.32±0.06h |
| Liver | 84±18 | 90±19 | 75±11 | 81±16 | 88±16 | 84±14 | 86±15 |
| Heart | 3.0±0.63 | 3.8±0.76 |
0.40±0.08d |
0.20±0.04f |
0.36±0.06h |
0.34±0.05h |
0.47±0.09h |
| Kidney | 0.55±0.22 | 0.35±0.08 | 0.04±0.01 | 0.03±0.01 |
0.16±0.05h |
0.31±0.08h |
0.42±0.09h |
| Lung | 3.5±0.71 | 4.17±0.73 |
1.2±0.47d |
0.16±0.06f | 0.17±0.05 |
0.06±0.02h | 0.19±0.05 |
| Brain | 2.6±0.52 | 2.1±0.42 |
0.82±0.20d |
1.4±0.38f | 0.98±0.24 |
2.1±0.50h |
0.50±011h |
| Aorta | 1.7±0.53 |
2.7±0.83a |
0.18±0.06d |
0.50±0.14f |
0.18±0.06h |
0.27±0.12h | 0.37±0.12 |
| Lamina propria | 0.96±0.21 |
1.48±0.33b |
0.43±0.11d |
0.94±0.24e |
0.34±0.08h | 0.84±0.26 |
0.33±0.07h |
| Mucosa | 1.1±0.22 | 1.1±0.22 |
0.51±0.16d |
0.35±0.09f |
0.62±0.14h | 0.27±0.07 |
0.22±0.05h |
| Adipose tissue | 2.7±0.71 |
1.7±0.39b | 2.4±0.62 | 2.4±0.66 | 1.8±0.36 | 1.8±0.37 |
1.3±0.31h |
| Spleen | 6.7±1.22 |
4.8±0.68b |
0.21±0.04d |
0.18±0.02f |
0.34±0.08h |
0.10±0.04h |
0.32±0.09h |
Muscle
The basal level of NO in the muscle tissues of mice
with diabetes was ~50% of the levels observed in the control mice;
whereas the final level of NO in the muscle tissue of the control
group was <50% of the basal value, and a similar decrease was
observed in the diabetic mice between the start and end of phase 2.
The values for NO in the control and diabetic mice at the end of
phase 2 did not differ significantly. Compared with the untreated
diabetes group, no significant differences were observed in the
levels of NO in the animals treated with exercise, HBO or both. The
development of diabetes caused a 2.5-fold decrease in 3NT levels
compared with the control group, similar to the decrease in NO
levels in muscle tissue between the two groups. In both groups, the
final levels of 3NT remained relatively stable at the end of study,
but were lower in the diabetic mice. Additionally, 3NT levels
increased to a similar degree in the mice subjected to exercise or
exercise and HBO compared with the untreated diabetic mice. For the
animals treated with HBO alone, there was a significant decrease in
3NT levels to a minimal level, corroborating the protective effect
of HBO against nitrosative stress in muscle tissue (4,6). The
effect of exercise was more prominent in the mice treated with
exercise and HBO, as the response to exercise training alone was
similar to the combined treatment. The basal levels of GSH in
muscle tissues of mice fed either diet were high and did not differ
significantly. The final levels of GSH were >10-fold lower in
both groups, with the lowest level observed in the mice with
diabetes. All treatments resulted in a significant increase in GSH
levels compared with the final values in the diabetic mice. The
effect of treatment with HBO was more prominent than with exercise,
and the results coincided with the decrease in 3NT levels in the
muscle tissues.
Liver
The initial levels of NO in liver tissue was not
affected by diabetes; whereas the final levels of NO in the liver
decreased >50% in both groups. In the animals with diabetes, NO
levels were not altered by any of the treatments. The mice fed a
HFHF diet had higher initial 3NT levels compared with the mice fed
a normal diet, confirming an increased basal level of nitrosative
stress in a diabetic state. The final levels of 3NT in the control
group increased moderately (P<0.05), but no significant
difference was observed in the final values between the groups. In
comparison to the final values of the diabetic group, the three
treatments increased the levels of 3NT to a similar degree (all
P<0.05). Therefore, each treatment increased nitrosative stress
in the liver. The initial levels of GSH in the liver was
>30-fold higher compared with muscle tissues, but was not
significantly different between the diabetic mice compared with the
control group. No significant differences were observed in the
final levels of GSH between the two groups, and none of the three
treatments resulted in significant differences in levels.
Heart
The initial levels of NO were similar in the heart
tissues of both groups. The final values of NO were moderately
(P<0.05) reduced in the control animals and there was no
significant change in the diabetic mice. Exercise reduced the NO
levels, but HBO alone had no effect. There was large and
significant increase in the levels of NO in the mice treated with
both exercise and HBO, showing a possible synergistic effect of
exercise and HBO on the heart which was absent in either treatment
alone. The initial levels of 3NT were low in the control mice and
>3-fold higher for the diabetic mice. Compared with the initial
values, the final levels of 3NT were increased in the control mice
and decreased in the diabetic mice (both P<0.01). Neither
exercise, HBO or both had an effect on 3NT levels in the heart of
diabetic mice, suggesting that these treatments did not affect
nitrosative stress. The development of diabetes did not
significantly affect the initial levels of GSH in the heart,
although the GSH levels were elevated in both groups in the
majority of other tissues. The elevated initial levels of GSH
observed in all mice was followed by a significant and large
decrease in the final levels in both groups (all P<0.01). The
final levels were lower in the diabetic mice compared with the
control mice (P<0.01). All treatments increased GSH levels in
diabetic mice to levels similar to those observed in the final
values of the control group.
Kidney
The initial levels of NO in kidney tissues was
comparable between the control and diabetic mice. A ~3-fold
decrease in NO levels was observed in the final values in both
groups and all treatments moderately reduced NO levels, and
treatment with HBO or exercise and HBO combined resulted in a
significant reduction in NO levels. In the control group, the
initial and final values of 3NT levels were very low. However, the
initial value in the diabetes group was ~17-fold higher compared
with the control. Despite the decrease in 3NT levels in the final
values in both groups, the levels in the diabetic mice were still
4-fold higher than the control group. The three treatments
increased the levels of 3NT to a similar degree, reaching levels
similar to those of the initial values of the diabetic mice. The
initial GSH levels were moderately but not significantly lower in
the diabetic group (P>0.05). The final levels of GSH were
significantly and drastically reduced compared with the minimal
levels in both the untreated groups (P<0.01). All treatments
increased this parameter compared with the final values in the
diabetic group, with the combined treatment having the most
prominent effect, followed by HBO alone and then exercise alone.
With both treatments involving HBO, the final levels of GSH were
comparable to the initial values of the mice with diabetes. Thus,
nitrosative stress was exacerbated in the kidney due to the
development of diabetes and with the three treatments, similar to
what was observed in the liver. The initial levels of GSH in the
kidney in both groups was the lowest compared with all tissues
assessed in the present study, consistent with a previous study
(45).
Lung
In lung tissues, diabetes did not affect the initial
levels of NO, and the final levels of NO were increased in the
control group (P<0.01) and decreased in the diabetes group
(P<0.01), compared with the initial levels. Both treatments
involving HBO led to a decrease, and the decrease was more
pronounced in the combined treatment group. Lung tissue is the
first to be affected by sessions of HBO. The initial levels of 3NT
were higher in the diabetic mice, and no significant change was
observed in the final values in either the control or diabetic
mice. Exercise increased the levels of 3NT, whereas HBO and the
combined treatment did not have a significant effect. The changes
in GSH levels in lung tissues were similar to those observed in
other tissues. The initial values of the control and diabetic mice
were comparable, and the final values were significantly decreased
in both groups compared to the respective initial value, but did
not differ significantly between groups. HBO reduced GSH levels,
whereas exercise and the combined treatment did not have a notable
effect.
Thoracic aorta
The initial levels of NO in the thoracic aorta were
higher in the diabetic mice compared with the control mice
(P<0.05). The final levels were significantly and drastically
lower in both groups (P<0.01), and the decrease in the diabetic
mice was greater. All treatments resulted in ~50% decrease in the
NO levels. The initial levels of 3NT were higher in the diabetic
group compared with the control group (P<0.01). The final levels
of 3NT levels were increased in the control group only compared
with the respective initial values (all P<0.01). All treatments
decreased the increased levels of 3NT in the diabetic mice to a
similar degree (all P<0.01). The levels of GSH were higher in
the diabetic mice compared with the control group (P<0.05). In
both groups, the final GSH levels were considerably lower compared
with the respective initial values (both P<0.01). Exercise or
HBO significantly decreased GSH levels (both P<0.01), and to a
lesser extent in the mice treated with the combined treatment.
Intestinal lamina propria
The development of diabetes did not significantly
affect the initial, final or post-treatments values in the lamina
propria. The initial levels of 3NT in the lamina propria were lower
in the diabetic mice compared with the control group (P<0.01).
For the control mice, there was an increase in the levels of 3NT
between the initial and final levels (P<0.05), whereas in the
diabetic group there was no significant change. The decreased
levels of 3NT in the diabetic mice were increased with exercise
(P<0.01), and the increase was greater in the mice treated with
HBO alone or the combined treatment (both P<0.01), reaching
similar values to the final levels of the control group. This
confirmed the predominance of the effects of HBO over exercise in
the exacerbation of nitrosative stress. The initial levels of GSH
were higher in the mice diabetic mice compared with the control
animals (P<0.01). The final levels of GSH decreased in the
control group and in the diabetic group (P<0.05), but remained
higher in the diabetic mice compared with the control mice
(P<0.05). The two treatments involving exercise significantly
reduced the levels of GSH (both P<0.01); whereas HBO alone did
not notably affect GSH levels, demonstrating the predominance of
exercise in regard to this parameter.
Mucosa
The initial levels of NO were not affected by
diabetes. Only final levels of NO in the diabetic group decreased
in intestinal mucosa (P<0.05), and only combined treatment
increased this parameter (P<0.01). The initial levels of 3NT
were relatively low in the mucosa of control mice and was higher in
the diabetic group (P<0.01). There were no significant changes
in the final values of 3NT in both groups. 3NT levels were not
significantly affected by exercise or HBO treatment alone, the
combination treatment resulted in an increase in 3NT levels
(P<0.05), suggesting a synergistic effect of these two
treatments. The similar initials levels of GSH were followed by a
sharp decrease in the final values of both groups in the mucosa.
Exercise increased the levels of GSH in the mucosa (P<0.01),
whereas the combined treatment decreased this parameter.
Adipose tissue
The initial levels of NO were similar in the adipose
tissues of both the control and diabetic mice. The final levels
were decreased in the control group (P<0.01), but were not
significantly different in the diabetic mice, and none of the
treatments altered NO levels significantly. The initial levels of
3NT were low in the control mice and were significantly higher in
the diabetic mice (P<0.01). The final levels showed a moderate
increase in the control group (P<0.05) and a decrease in the
diabetic mice compared with the respective initial values
(P<0.01), and none of the treatments significantly altered the
3NT levels. Compared with the adipose tissue of the control group,
GSH levels were significantly lower in the diabetic mice
(P<0.01), and the final levels were similar in both groups
compared with their respective initial values, and only the
combined treatment resulted in a significant decrease in the levels
of GSH (P<0.01).
Spleen
The initials level of NO in the spleen tissue did
not differ significantly between the two groups. The final NO
levels were significantly lower in both groups compared with the
respective initial values (both P<0.01), and the final levels
were higher in the diabetic group compared with the control group
(P<0.01). All treatments reduced the concentration of NO (all
P<0.05). The initial levels of 3NT were lower in the spleen of
the control group compared with the diabetic group (P<0.01), and
were significantly higher in the final measurement in both groups
(both P<0.01). The elevated initial 3NT levels in the diabetes
group moderately decreased during phase 2 (P<0.01), leading to
comparable final levels between the two groups. Treatment with
exercise or HBO had no significant effect on 3NT, but the combined
treatment resulted in a significant increase (P<0.01). The
initial levels of GSH were higher in the control group compared
with diabetic group (P<0.01). The final levels decreased
considerably in both groups compared with the respective initial
values (both P<0.01), reaching similar levels. The levels of GSH
decreased with HBO alone (P<0.01), but increased with exercise
and the combined treatment (P<0.01), suggesting that exercise
predominated in the latter.
Brain
The initial levels of NO in brain tissue did not
differ significantly between the control and diabetic mice, and
there was a moderate significant decrease in the final values of NO
only in the diabetic group (P<0.05). None of the treatments
significantly altered the NO levels. The relatively low levels of
3NT in the control mice remained constant throughout the study.
Conversely, the initial values of 3NT in the diabetic mice were
significantly higher compared with the control group (P<0.01),
and the final values in the diabetic group were significantly lower
compared with the initial values in the diabetic mice (P<0.01).
The final value of 3NT was higher in the diabetic mice compared
with the control group and the treatments did not significantly
affect the 3NT levels. The initial levels of GSH in the brain were
not significantly affected by diabetes. The final levels were
decreased in both groups (both P<0.01), and were higher in the
diabetic mice compared with the control mice (P<0.05). HBO
increased the levels of GSH (P<0.01), and the combined treatment
resulted in a decrease (P<0.01).
Pearson correlation
Regarding the initial levels of GSH and 3NT in all
the evaluated tissues of the control mice, a significant negative
correlation was observed when averaged across all tissues
(r=-0.734, P=0.024) except liver (due to the high levels of GSH in
this tissue), and this was not observed in the diabetic group.
Under conditions of relative stability of NO levels in the control
group, this stability indicates a direct antioxidant affect against
peroxynitrite: A greater level of GSH corresponded to a lower level
of 3NT. There was a positive correlation observed between the
initial levels of NO and the final levels of 3NT in the control
group (r=0.641, P=0.044) suggesting an increase in nitrosative
stress: Higher initial levels of NO resulted in higher final levels
of 3NT (data not shown).
A positive correlation was observed between the
final levels of GSH and NO in the diabetic mice (r=0.788, P=0.007),
suggesting a close association between these parameters in the
pathological state as a correlation was not observed in the final
values of the control tissues. The statistical analysis of the
bivariate correlation of parameters in the tissues evaluated showed
a positive correlation between NO and GSH in all tissues from the
diabetic mice subjected to exercise (exercise alone: r=0.755,
P=0.012; combination treatment, r=0.878, P=0.01). Table III shows which parameters were
significantly altered in Table
II.
| Table IIIDirection of significant changes of
measured parameters in all tissues based on Table II. |
Table III
Direction of significant changes of
measured parameters in all tissues based on Table II.
| A, Animal
model |
|---|
| | Initial levels,
Control vs. diabetic group | Control, final vs.
initial levels | Diabetic group,
final vs. initial levels |
|---|
| Tissue | NO | 3NT | GSH | NO | 3NT | GSH | NO | 3NT | GSH |
|---|
| Muscle | D | D | 0 | D | 0 | D | 0 | 0 | D |
| Liver | 0 | I | 0 | D | 0 | 0 | D | 0 | 0 |
| Heart | 0 | I | 0 | D | I | D | 0 | D | D |
| Kidney | 0 | I | 0 | D | 0 | D | D | D | D |
| Lung | 0 | I | 0 | I | 0 | D | D | 0 | D |
| Brain | 0 | I | 0 | 0 | 0 | D | D | D | D |
| Aorta | I | I | I | D | I | D | D | 0 | D |
| LP | 0 | D | I | 0 | I | D | 0 | 0 | D |
| Muscosa | 0 | I | 0 | 0 | 0 | D | D | 0 | D |
| AT | 0 | I | D | D | I | 0 | 0 | D | 0 |
| Spleen | 0 | I | D | D | I | D | D | D | D |
| B, Treatment |
| | NO | 3NT | GSH |
| Tissue | DE | DH | DEH | DE | DH | DEH | DE | DH | DEH |
| Muscle | 0 | 0 | 0 | I | D | I | I | I | I |
| Liver | 0 | 0 | 0 | I | I | I | 0 | 0 | 0 |
| Heart | 0 | 0 | I | 0 | 0 | 0 | I | I | I |
| Kidney | 0 | D | D | I | I | I | I | I | I |
| Lung | 0 | D | D | I | 0 | 0 | 0 | D | 0 |
| Brain | 0 | 0 | 0 | 0 | 0 | 0 | 0 | I | D |
| Aorta | D | D | D | D | D | D | D | D | 0 |
| LP | 0 | 0 | 0 | I | I | I | D | 0 | D |
| Muscosa | 0 | 0 | I | 0 | 0 | I | I | 0 | D |
| AT | 0 | 0 | 0 | 0 | 0 | 0 | 0 | 0 | D |
| Spleen | D | D | D | 0 | 0 | I | I | D | I |
The development of diabetes did not affect the level
of NO in the tissues assessed except the aorta (Table IIIA). Conversely, induction of
diabetes significantly increased the levels of 3NT in the majority
of tissues (with a reduction in the muscle and lamina propria),
while decreasing the levels of GSH in adipose tissue and spleen,
and increasing its levels in the aorta and lamina propria. The
control and diabetes groups showed a drastic and significant
decrease in the initial levels of NO and GSH in all tissues between
the two phases of the study.
The positive effects of treatments against oxidative
stress are reflected by a decrease in 3NT levels or an increase in
GSH levels (4). Some treatments
resulted in a protective effect against nitrosative stress in the
diabetic mice in certain tissues (Table
IIIB): Aorta, all treatments; and muscle, HBO. However, a
negative effect (an increase in 3NT levels) was observed more
frequently: Liver, all treatments; kidney, all treatments;
intestinal lamina propria, all treatments; muscle, exercise and
combined treatment; lung, exercise; and spleen, combined treatment.
An increase in GSH levels were observed following all treatments in
the muscle, heart and kidney, after exercise in the mucosa and
spleen; after HBO only in the brain; and after combined treatment
in the spleen.
Discussion
The results of the present study confirmed the
successful establishment of a diet-induced diabetes mellitus type 2
model in mice. The age of mice is associated with the level of
basal metabolism (lower in adults), and increases the likelihood of
developing obesity based on diet (46-48).
The possible effect of a change of basal metabolic levels in adult
diabetic animals during the present study was eliminated by
comparison of post-treatment levels of measured parameters to final
levels of the diabetic group.
Oxidative stress served an important role in the
pathogenesis of diabetes and complications linked to dysfunction of
the endothelium. A possible initial mechanism of dysfunction of the
endothelium may be associated with a reduction in the
bioavailability of NO (6,49,50). In
the present study, the development of diabetes did not affect the
levels of NO in the majority of tissues. Indirectly, the stability
of NO during diabetes emphasizes the importance of its homeostasis
in tissues of mice in the experimental model used. The development
of diabetes drastically increased the levels of 3NT in the majority
of tissues, which is indicative of nitrosative stress (4,51), as it
is a product of a reaction of peroxynitrite (derived from the
reaction of NO with superoxide radicals) with the tyrosine residues
of proteins. Conversely, the role of S-nitrosation in various
signaling pathways associated with NO has also been discussed
(25) and may be relevant for
interpretation of the results of the present study considering the
importance of S-nitrosation in the pathogenesis of diabetes.
Principally, the effect of NO in the short-term is the
vasodilatation of large conduit vessels that can modulate the redox
state in tissues.
An increased production of superoxide in tissues is
well-documented during the pathogenesis of diabetes (7,9,16), suggesting increased elimination of NO
by these superoxide radicals in the tissues of the diabetic mice.
Therefore, the lack of difference in the levels of NO and elevated
levels of nitrosative stress observed in the majority of tissues in
the diabetic mice suggests that any increased elimination of NO by
superoxides was compensated for by an increase in its production in
this animal model. Excessive NO and superoxide production may
disrupt the physiological balance between generation of
peroxynitrite, antioxidant defense mechanisms and signaling
pathways involving NO in the tissues of diabetic mice (4). GSH is a low-weight multifunctional
molecule that also serves as the principal endogenous non-enzymatic
antioxidant (15). In the present
study, no changes in the levels of GSH were observed in the
majority of tissues in the diabetic mice. In vivo studies
have shown that the concentration of NO is closely associated with
the synthesis of GSH in tissues. Increased production of NO
inhibits the synthesis of GSH in rodent tissues, and a decreased
production results in increased synthesis of GSH (24,52). The
stability observed in the levels of NO in the diabetic mice in the
present study may therefore be associated with the stability in GSH
levels in the majority of tissues in the present study.
In the initial values of the control group only,
there was a significant negative correlation between the levels of
GSH and 3NT, and a positive correlation between the initial levels
of NO and final levels of 3NT in all tissues. In the tissues of the
control mice, the lower initial levels of nitrosative stress
corresponded with an increase in antioxidant defense, which is
manifested as higher levels of GSH. A high level of nitrosative
stress resulted in a low level of GSH as the compensatory
mechanisms were overwhelmed by excessive production of
peroxynitrite and consequently 3NT. Compensatory mechanisms
included increased production of GSH and/or its mobilization from
the liver, where its concentration was in the mM range, compared
with the µM concentrations observed in other tissues.
During phase 2 of the study, both the control and
untreated diabetes groups displayed a similar decrease in the
levels of NO and GSH in the majority of tissues, suggesting a
possible age-related effect and thus may reflect a decrease in the
basal levels of metabolism in adult mice. The lower initial levels
of 3NT were not significantly altered or significantly increased in
the majority of the tissues in the control group between the two
phases, whereas the elevated initial levels of 3NT in the diabetic
mice were unchanged or decreased between the two phases. The final
levels of nitrosative stress (as determined based on 3NT levels)
for the control group indicated either stability or an increase in
levels, and in the diabetic mice, the levels were either stable or
decreased. In the majority of these tissues the final 3NT levels
were higher in the diabetic mice compared with the control group.
This difference coincided with a positive correlation between the
final levels of GSH and NO in all tissues in the diabetic mice
only, contradicting the known effect of NO on the synthesis of GSH
in rodent tissues without diabetes (24,53) which
was also observed in the control group in the present study.
The role of NO-related mechanisms were examined in
processes of adaptation to exercise in tissues (25). During a range of pathological
processes and in all tissues and organs, NO was determined to be
the primary molecule linked to the regulation of vascular
endothelium tissue, and exercise may correct alterations in the
bioavailability of this radical. Enzymatic production of NO by
endothelial nitric oxide synthase has a regulatory role in
endothelial dysfunction (54) and NO
participates in vascular adaptation to exercise (55,56).
Therefore, the association between NO and different nitric oxide
synthases in diabetic tissues requires examination.
Studies have described the protective effect of HBO
pre-treatment against oxidative stress produced by distinct factors
in different animal models, including experimental damage to the
rat spinal cord (27), cerebral
ischemia-reperfusion (28),
experimental myocardial infarct (53), and the effect of ultraviolet light on
mouse skin and liver (29). HBO
pretreatment is also reported to reduce the levels of indicators of
oxidative stress in rat thoracic aorta, including NO (31) and to decrease oxidative stress in rat
lungs (30). In the present study,
exercise and HBO did not affect the levels of NO in the majority of
diabetic tissues, but the levels of nitrosative stress (3NT) and
GSH were increased in the majority of tissues, and contrary to the
control group, where a negative correlation was observed between
these parameters. An increase in the levels of GSH was interpreted
as a positive effect in relation to the redox equilibrium in
tissues.
All treatments did not alter or increase the levels
of GSH in muscle, liver heart, kidney, lung and brain tissues
(except after HBO alone in the lung, or after combined treatment in
the brain) suggesting a positive effect on the redox equilibrium of
tissues. HBO alone increased the levels of GSH in the brain and
decreased the levels in the lung. Conversely, exercise alone
resulted in changes in GSH levels in the small intestine, where an
increase was observed in the mucosa and a decrease was observed in
the lamina propria, and this may be reflective of redistribution of
GSH between different intestinal regions. The combination treatment
showed a similar effect on GSH levels as exercise in the majority
of tissues.
Increased or unchanged levels of GSH by all
treatments corresponded to an increase or unchanged levels of
nitrosative stress. It is possible that the elevated levels of
nitrosative stress facilitated the redistribution of GSH from liver
to other tissues. As the final level of GSH in liver of diabetic
mice was ≥80-fold higher compared with other tissues, alterations
in the level of GSH in the liver may have gone unnoticed. In our
previous study HBO-induced a notable decrease in the basal levels
of GSH in the liver which coincided with an increase in the muscle,
brain, small intestine and adipose tissue, without a significant
change in the grade of GSH oxidation in the exercised mice
(57). That is, the change in GSH
without a change in the oxidation of GSH following HBO, suggested
that GSH was redistributed from the liver to the other, reflecting
an improvement in the antioxidant capability of these tissues.
In conclusion, the development of diabetes in this
animal model caused nitrosative stress in the majority of tissues
without affecting GSH levels in the majority tissues, and all
treatments resulted in an increase or stabilization of GSH levels
in the muscle, liver, heart, kidney, lung and brain which coincided
with an increase or stabilization in nitrosative stress in the same
tissues.
Acknowledgements
We would like to thank our students Dr Pérez Castro
CC, Franco-Valdillo A and Dr Toledo-Blas Mirelle for their
assistance during the study.
Funding
The present study was funded by SIP and COFAA of
National Polytechnic Institute.
Availability of data and materials
The datasets used and/or analyzed during the present
study are available from the corresponding author on reasonable
request.
Authors' contributions
All authors performed the experiments. AK, GGB and
MDCCH performed the analysis and wrote the manuscript. LRGC and ELP
performed the analysis and interpreted the data. All authors read
and approved the final the manuscript.
Ethics approval and consent to
participate
The study protocol was reviewed and approved by the
Institutional Laboratory Use and Care Committee of the High Medical
School, National Polytechnic Institute (Mexico City, Mexico;
approval no. 02/28-08-2015).
Patient consent for publication
Not applicable.
Competing interests
The authors declare that they have no competing
interests.
References
|
1
|
Lo Faro ML, Fox B, Whatmore JL, Winyard PG
and Whiteman M: Hydrogen sulfide and nitric oxide interactions in
inflammation. Nitric Oxide. 41:38–47. 2014.PubMed/NCBI View Article : Google Scholar
|
|
2
|
Alderton WK, Cooper CE and Knowles RG:
Nitric oxide synthases: Structure, function and inhibition. Bichem
J. 357:593–615. 2001.PubMed/NCBI View Article : Google Scholar
|
|
3
|
Zhang Z, Naughton D, Winyard PG, Benjamin
N, Blake DR and Symons MC: Generation of nitric oxide by a nitrite
reductase activity of xanthine oxidase: A potential pathway for
nitric oxide formation in the absence of nitric oxide synthase
activity. Biochem Biophys Res Commun. 249:767–772. 1998.PubMed/NCBI View Article : Google Scholar
|
|
4
|
Beckman JS and Koppenol WH: Nitric oxide,
superoxide, and peroxynitrite: The good, the bad, and ugly. Am J
Physiol. 271:1424–1437. 1996.PubMed/NCBI View Article : Google Scholar
|
|
5
|
Chen JY, Ye ZX, Wang XF, Chang J, Yang MW,
Zhong HH, Hong FF and Yang SI: Nitric oxide bioavailability
dysfunction involves in atherosclerosis. Biomed Pharmacother.
97:423–428. 2018.PubMed/NCBI View Article : Google Scholar
|
|
6
|
Delamea BS, Leitão CB, Freadman R and
Canani LH: Nitric oxide system and diabetic nephropatju. Diabetol
Metab Syndr. 6:17–21. 2014.PubMed/NCBI View Article : Google Scholar
|
|
7
|
Yuan T, Yang T, Chen H, Fu D, Hu Y, Wang
J, Yuan Q, Yu H, Xu W and Xie X: New insights into oxidative stress
and inflammation during diabetes mellitus-accelerated
atherosclerosis. Redox Biol. 20:247–260. 2019.PubMed/NCBI View Article : Google Scholar
|
|
8
|
Low Wang CC, Hess CN, Hiatt WR and Goldfin
AB: Clinical update: Cardiovascular disease in diabetes mellitus:
Atherosclerotic cardiovascular disease and heart failure in type 2
diabetes mellitus mechanisms, management, and clinical
considerations. Circ. 133:2459–2502. 2016.PubMed/NCBI View Article : Google Scholar
|
|
9
|
Wang W, Shang C, Zhang W, Jin Z, Yao F, He
Y, Wang B, Li Y, Zhang J and Lin R: Hydroxityrosol regulates
oxidative stress and NO production through SIRT1 in diabetic mice
and vascular endothelial cells. Phytomed. 52:206–215.
2019.PubMed/NCBI View Article : Google Scholar
|
|
10
|
Assman TS, Brondani LA, Bouças AP,
Rheinheimer J, de Souzza BM, Canani LH, Bauer AC and Crispim D:
Nitric oxide levels in patients with diabetes mellitus: A
systematic review and meta-analysis. Nitric Oxide. 61:1–9.
2016.PubMed/NCBI View Article : Google Scholar
|
|
11
|
Millerbon FJ, Gutterman DD, Rios CD,
Heistad DD and Davidson BI: Superoxide production in vascular
smooth muscle contributes to oxidative stress and impaired
relaxation in atherosclerosis. Circ Res. 82:1298–1303.
1998.PubMed/NCBI View Article : Google Scholar
|
|
12
|
Tabit CE, Chung WB, Hamburg NM and Vita
JA: Endothelial dysfunction in diabetes mellitus: Molecular
mechanisms and clinical implications. Rev Endocr Metab Disord.
11:61–74. 2010.PubMed/NCBI View Article : Google Scholar
|
|
13
|
Cosby K, Partovi KS, Crawford JH, Patel
RP, Reiter CD, Martyr S, Yang BK, Waclawiw MA, Zalos G, Xu X, et
al: Nitrite reduction to nitric oxide by deoxyhemoglobin
vasodilates the human circulation. Nat Med. 9:1498–1505.
2003.PubMed/NCBI View
Article : Google Scholar
|
|
14
|
Totzeck M, Hengen-Cotta UB, Luedike P,
Berenbrink M, Klare JP, Steinhoff HJ, Semmler D, Shiva S, Williams
D, Kipar A, et al: Nitrite regulates hypoxic vasodilatation via
myoglobin-dependent nitric oxide generation. Circ. 126:325–334.
2012.PubMed/NCBI View Article : Google Scholar
|
|
15
|
Wu G, Fang YZ, Yang S, Lupton JR and
Turner ND: Glutathione metabolism and its implications for health.
J Nutr. 134:489–492. 2004.PubMed/NCBI View Article : Google Scholar
|
|
16
|
Sundaram RK, Bhaskar A, Vijayalingam S,
Viswanathan M, Mohan R and Shanmugasundaram KR: Antioxidant status
and lipid peroxidation in type II diabetes mellitus with and
without complications. Clin Sci (Lond). 90:255–260. 1996.PubMed/NCBI View Article : Google Scholar
|
|
17
|
Nguyen D, Hsu JW, Jahoor F and Sekhar RV:
Effect of increasing glutathione with cysteine and glycine
supplementation on mitochondrial fuel oxidation, insulin
sensitivity, and body composition in older HIVinfected patients. J
Clin Endocrinol Metab. 99:169–177. 2014.PubMed/NCBI View Article : Google Scholar
|
|
18
|
Sekhar RV, McKay SV, Patel SG, Guthikonda
AP, Reddy VT, Balasubramanyam A and Jahoor F: Glutathione synthesis
is diminished in patients with uncontrolled diabetes and restored
by dietary supplementation with cysteine and glycine. Diabetes
Care. 34:162–167. 2011.PubMed/NCBI View Article : Google Scholar
|
|
19
|
Lagman M, Ly J, Saing T, Kaur Singh M,
Vera Tudela E, Morris D, Chi P-T, Ochoa C, Sathananthan A and
Venketaran V: Investigating the causes for decreased levels of
glutathione in individuals with type II diabetes. PLoS One.
10(e0118436)2015.PubMed/NCBI View Article : Google Scholar
|
|
20
|
Lutchmansingh FK, Hsu JW, Bennett FI,
Badaloo AV, McFarlane-Anderson N, Gordon-Strachan GM, Wright-Pascoe
RA, Jahoor F, Michael S and Boyne MS: Glutathione metabolism in
type 2 diabetes and its relationship with microvascular
complications and glycaemia. PLoS One. 13(e0198626)2018.PubMed/NCBI View Article : Google Scholar
|
|
21
|
Parsanathan R and Jain SK: Glutathione
deficiency alters the vitamin D-metabolizing enzymes CYP27B1 and
CYP24A1 in human renal proximal tubule epithelial cells and kidney
of HFD-fed mic. Free Radic Biol Med. 131:376–381. 2019.PubMed/NCBI View Article : Google Scholar
|
|
22
|
Ilyer AKV, Rojanasakul Y and Azad N:
Nitrosothiols signaling and protein nitrosation in cell death.
Nitric Oxide. 42:9–18. 2014.PubMed/NCBI View Article : Google Scholar
|
|
23
|
Ganzarolli de Oliveira M: S-nitrosothiols
as platforms for topical nitric oxide delivery. Basic Clin
Pharmacol Toxicol. 119:49–56. 2016.PubMed/NCBI View Article : Google Scholar
|
|
24
|
Payabvash S, Ghahremani MH, Goliaei A,
Mandegary A, Shafaroodi H, Amanlou M and Dehpour AR: Nitric oxide
modulates glutathione synthesis during endotoxemia. Free Rad Biol
Med. 41:1817–1828. 2006.PubMed/NCBI View Article : Google Scholar
|
|
25
|
Surh F, Gehlert S, Grau M and Bloch W:
Skeletal muscle function during exercisefine-tuning of diverse
subsystems by nitric oxide. Int J Mol Sci. 14:7109–7139.
2013.PubMed/NCBI View Article : Google Scholar
|
|
26
|
Yaribeygi HY, Butler AE and Sahebkar A:
Aerobic exercise can modulate the underlying mechanisms involved in
the development of diabetic complications. J Cell Physiol.
234:12508–12515. 2019.PubMed/NCBI View Article : Google Scholar
|
|
27
|
Kahraman S, Düz B, Kayali H, Korkmaz A,
Öter S, Aydin A and Sayal A: Effects of methylprednisolone and
hyperbaric oxygen on oxidative status after experimental spinal
cord injury: Comparative study in rats. Neurochem Res.
32:1547–1551. 2007.PubMed/NCBI View Article : Google Scholar
|
|
28
|
Cheng O, Ostrowski RP, Wu B, Liu W, Chen C
and Zhang JH: Cyclooxygenase2 mediated hyperbaric oxygen
preconditioning in the rat model of transient global cerebral
ischemia. Stroke. 422:484–490. 2011.PubMed/NCBI View Article : Google Scholar
|
|
29
|
Fuller AM, Giardina C, Hightower LE,
Perdrizet GA and Tierney CA: Hyperbaric oxygen preconditioning
protects skin from UV-A damage. Cell Stress Chaperones. 8:97–107.
2013.PubMed/NCBI View Article : Google Scholar
|
|
30
|
Feng Y, Zhang Z, Li Q, Li W, Xu J and Cao
H: Hyperbaric oxygen preconditioning protects lung against
hyperoxic acute lung injury via heme oxygenase-1 induction. Biochem
Biophys Res Comm. 459:549–554. 2015.PubMed/NCBI View Article : Google Scholar
|
|
31
|
Guevara-Balcazar G, Lara-Padilla E,
Kormanovski A, Ramirez-Sanchez I, Castillo-Henkel EF and
Castillo-Hernandez MC: Changes in oxidative stress and vascular
reactivity of thoracic and abdominal rat aorta with different
periods of exposure to hyperbaric oxygenation. Int J Pharmac.
11:611–617. 2015.
|
|
32
|
Thom SR: Oxidative stress is fundamental
to hyperbaric oxygen therapy. J Appl Physiol (1985). 106:988–995.
2009.PubMed/NCBI View Article : Google Scholar
|
|
33
|
Castillo-Hernandez MC, Lara-Padilla E,
Kormanovski A, Perez-Tuñon JG, Lopez-Calderon EM and
Guevara-Balcazar G: Normalization of QRS segment, blood pressure
and heartbeat in an experimental model of amintriptyline
intoxication in rats following hyperbaric oxygenation therapy. Int
J Pharmac. 11:508–512. 2015.
|
|
34
|
Buras JA, Sthal GL, Svoboda KK and
Reenstra WR: Hyperbaric oxygen down-regulates ICAM-1 expression
induced by hypoxia and hypoglycemia: The role of NOS. Am J Physiol
Cell Physiol. 278:292–302. 2000.PubMed/NCBI View Article : Google Scholar
|
|
35
|
Cabigas BP, Su J, Hutchins W, Shi Y,
Schaefer RB, Recinos RF, Nilakantan V, Kindwall E, Niezgoda JA and
Baker JE: Hyperoxic and hyperbaric-induced cardioprotection: Role
of nitric oxide synthase 3. Cardiovasc Res. 72:143–151.
2006.PubMed/NCBI View Article : Google Scholar
|
|
36
|
Buerk DG: Nitric oxide regulation of
microvascular oxygen. Antiox Red Signal. 9:829–843. 2007.PubMed/NCBI View Article : Google Scholar
|
|
37
|
Thibault L: Animal models of
dietary-induced obesity. In animal models for the study of human
disease. pp. 277-303, 2013.
|
|
38
|
Sah SP, Singh B, Choudhary S and Kumar A:
Animal models of insulin resistance: A review. Pharmacol Rep.
68:1165–1177. 2016.PubMed/NCBI View Article : Google Scholar
|
|
39
|
Ravi Kiran T, Subramanyam MV and Asha Devi
S: Swim exercise training and adaptations in the antioxidant
defense system of myocardium of old rats: Relation to swim
intensity and duration. Comp Biochem Physiol B Biochem Mol Biol.
137:187–196. 2004.PubMed/NCBI View Article : Google Scholar
|
|
40
|
Nacao C, Ookawara S, Kizaki T, Oh-Ishi S,
Miyazaki H, Haga S, Sato Y, Ji LL and Ohno H: Effects of swimming
training on three superoxide dismutase isoenzymes in mouse tissue.
J Appl Physiol (1985). 88:649–654. 2000.PubMed/NCBI View Article : Google Scholar
|
|
41
|
Jung UJ and Choi MS: Obesity and its
metabolic complications: The role of adipokines and the
relationship between obesity, inflammation, insulin resistance,
dyslipidemia and nonalcoholic fatty liver disease. Int J Mol Sci.
15:6184–6223. 2014.PubMed/NCBI View Article : Google Scholar
|
|
42
|
Rogers P and Webb GP: Estimation of body
fat in normal and obese mice. Brit J Nutr. 43:83–87.
1980.PubMed/NCBI View Article : Google Scholar
|
|
43
|
Weyer C, Bogardus C, Mott DM and Pratley
RE: The natural history of insulin secretory dysfunction and
insulin resistance in the pathogenesis of type 2 diabetes mellitus.
J Clin Invest. 104:787–794. 1999.PubMed/NCBI View Article : Google Scholar
|
|
44
|
Defronzo RA, Eldor R and Abdul-Ghani M:
Pathophysiologic approach to therapy in patients with newly
diagnosed type 2 diabetes. Diab Care 36. (Suppl 2):S127–S138.
2013.PubMed/NCBI View Article : Google Scholar
|
|
45
|
Muthulakshmi S and Saravanan R: Protective
effects of azelaic acid against high-fat diet-induced oxidative
stress in liver, kidney and heart of C57BL/6J mice. Mol Cell
Biochem. 377:23–33. 2013.PubMed/NCBI View Article : Google Scholar
|
|
46
|
Vickers SP, Jackson HC and Cheetham SC:
The utility of animal models to evaluate novel anti-obesity agents.
Br J Pharmacol. 164:1248–1262. 2011.PubMed/NCBI View Article : Google Scholar
|
|
47
|
Makarov M and Makarov V: Diet-induced
models of metabolic disturbances. Report 2: Experimental obesity.
Lab Animals Sci. 2:12–17. 2018.
|
|
48
|
Rosini TC, da Silva ASR and de Moraes C:
Diet-induced obesity: Rodent model for the study of obesity related
disorders. Rev Assoc Med Bras (1992). 58:383–387. 2012.PubMed/NCBI(In English,
Portuguese).
|
|
49
|
Schmidt HH and Walter U: NO at work. Cell.
78:919–925. 2004.
|
|
50
|
Napoli C and Ignarro LJ: Nitric oxide and
pathogenic mechanisms involved in the development of vascular
diseases. Arch Pharmacol Res. 32:1103–1108. 2009.PubMed/NCBI View Article : Google Scholar
|
|
51
|
Davies MJ, Fu S, Wang H and Dean RT:
Stable markers of oxidant damage to proteins and their application
in the study of human disease. Free Radic Biol Med. 27:1151–1163.
1999.PubMed/NCBI View Article : Google Scholar
|
|
52
|
Minamiyama Y, Takemura S, Koyama K, Yu H,
Miyamoto M and Inone M: Dynamic aspects of glutathione and nitric
oxide metabolism in endotoxemic rats. Am J Physiol. 271:G575–G581.
1996.PubMed/NCBI View Article : Google Scholar
|
|
53
|
Sun Q, Liu Y, Sun X and Tao H:
Anti-apoptotic effect of hyperbaric oxygen preconditioning on a rat
model of myocardial infarction. J Surg Res. 171:41–46.
2011.PubMed/NCBI View Article : Google Scholar
|
|
54
|
Nisoli E, Clementi E, Paolucci C, Cozzi V,
Tonello C, Sciorati C, Bracale R, Valerio A, Francolini M, Moncada
S and Carruba MO: Mitochondrial biogenesis in mammal: The role of
endogenous nitric oxide. Science. 299:896–899. 2003.PubMed/NCBI View Article : Google Scholar
|
|
55
|
Miller MW, Knaub LA, Olivera-Fragoso LF,
Keller AC, Balasubramaniam V, Watson PA and Reusch JEB: Nitric
oxide regulates vascular adaptive mitochondrial dynamics. Am J
Physiol Heart Circ Physiol. 304:H1624–H1633. 2013.PubMed/NCBI View Article : Google Scholar
|
|
56
|
Whal MP, Scalzo RL, Regensteiner JG and
Reusch JEB: Mechanisms of aerobic exercise impairment in diabetes:
A narrative review. Front Endocrinol (Lausanne).
9(181)2018.PubMed/NCBI View Article : Google Scholar
|
|
57
|
Kormanovski A, Castillo-Hernández MC,
Guevara-Balcazar G, Pérez T and Lara-Padilla E: Gender difference
in nitric oxide and antioxidant response to physical stress in
tissues of trained mice after hyperbaric oxygen preconditioning:
Part 2. Physiol Pharmac. 23:309–321. 2019.
|