Introduction
The majority of the global population have been
infected by the Epstein-Barr virus (EBV). However, EBV subtype
distribution in EBV-induced diseases and the EBV antibody levels
varies among the infected population, according to their ethnicity
and geographic characteristics (1-3).
EBV favorably infects human B cells and is found to be associated
with several types of human B cell lymphoma as a consequence of
disrupted cellular pathways by EBV proteins, such as latent
membrane proteins (4-7).
EBV causes certain types of B cell lymphomas, such as diffuse large
B cell lymphoma (DLBCL), Burkitt lymphoma, Hodgkin lymphoma and
EBV-associated lymphoproliferative disorder that can cause
mortality in patients with immune deficiency (4). Furthermore, EBV can infect and
replicate in epithelial cells, and cause several types of cancer,
including nasopharyngeal carcinoma (NPC) and gastric carcinoma in
the infected cells (8-10).
EBV can transform human B cells, and alters their
normal phenotype properties into a cell with a more transformative
phenotype, which includes dysregulated proliferation and
immortalization of EBV-transformed B-lymphoblastoid cell lines
(BLCL), resulting in increased cell growth and survival (4,7,11). Host transcription factors, including
NF-κB, Jun/Fos and AP-1, are induced by EBV proteins, which may be
involved in the process of cellular transformation (4,12,13).
EBV can transform B cells into cells with
tumorigenic phenotypes, including immortalization and sustained
proliferative signaling, which are hallmarks of cancer (14). However, there are limited reports on
the cellular gene expression profiles in human BLCL, particularly
when compared with normal B cells (15,16). In
the present study, microarray expression analysis, a high
throughput method, was used to investigate the differential gene
expression profiles of human BLCL and cellular pathway alterations
associated with tumorigenic phenotypes of B cells. A more in-depth
understanding of the specific molecular mechanisms and cellular
pathways involved in EBV-induced cellular transformation may
highlight the identification of potential biomarkers and targets
for treatment of EBV-related diseases.
Materials and methods
Study participants
In the present study, 2 healthy male volunteers
(aged 38 and 40 years) were enrolled at The King Chulalongkorn
Memorial Hospital, Faculty of Medicine, Chulalongkorn University
(Bangkok, Thailand). The present study was approved by the
Institutional Review Board of the Faculty of Medicine,
Chulalongkorn University (Bangkok, Thailand) (approval no. 358/46)
and both subjects provided written informed consent for
participation.
Peripheral blood mononuclear cell
(PBMC) isolation and BLCL preparation
PBMCs were isolated from healthy donor blood
according to the manufacturer's protocol using density gradient
separation with Isoprep (Robbins Scientific Corporation). PBMCs
were adjusted to 1x10⁶ cells/ml with R10 medium;
RPMI-1640 supplemented with 100 U/ml penicillin and 100 U/ml
streptomycin (all from Gibco; Thermo Fisher Scientific, Inc.) and
10% heat-inactivated FBS (BioWhittaker, Inc.). For the
EBV-containing culture supernatant, the marmoset B-lymphoblastoid
cell line (B95-8) were maintained in R10 media at an exponentially
growing rate in a humidified incubator at 37˚C with 5%
CO2. After 3 days, the supernatant was collected and
centrifuged at 300 x g for 10 min at 4˚C to separate the
EBV-containing culture supernatant from the cells. The supernatant
was filtered through a 0.45 µm filter, aliquoted and stored at
-80˚C. Typically, the culture supernatant contains >100-1,000
transforming units per ml (17).
EBV-transformed BLCL were generated by incubating 1x10⁶
cells/ml PBMCs with 1 ml EBV supernatant from the B95-8 cell line
for 1 h at 37˚C with 5% CO2. BLCL were maintained in R20
medium; RPMI-1640 supplemented with 100 U/ml penicillin, 100 U/ml
streptomycin and 20% heat-inactivated FBS, with 1 mg/ml cyclosporin
A. The B95-8 cell line was kindly provided by The National
Institute of Health, Thailand. Following B cell transformation, the
BLCL were used for RNA extraction or cryopreserved for future
use.
RNA sample preparation
Total RNA was extracted from the cells mentioned
above using TRIzol® reagent (Invitrogen; Thermo Fisher
Scientific, Inc.) according to the manufacturer's protocol. RNA
purity and integrity qualification were evaluated on a ND-1000
Spectrophotometer (NanoDrop Technologies; Thermo Fisher Scientific,
Inc.) and an Agilent 2100 Bioanalyzer (Agilent Technologies, Inc.).
RNA samples were used for RNA labeling and hybridization using an
Agilent One-Color Microarray-Based Gene Expression Analysis
protocol (version 6.5; Agilent Technologies, Inc.). Briefly, 100 ng
total RNA from each sample was linearly amplified using the oligo
dT-promoter primer included in the kit, and labeled with Cy3-dCTP
and Cy5-dCTP at 40˚C for 2 h (Agilent Technologies, Inc.) for BLCL
and normal B cells, respectively. Following purification, the
concentration and specific activity of the labeled cRNAs (pmol
Cy3/µg cRNA) were measured using a NanoDrop ND-1000.
Hybridization and scanning
A transcriptome database of each RNA sample was
created using Agilent SurePrint G3 Human GE 8x60 K Microarray kit
(Agilent Technologies Inc.). Briefly, 600 ng of each labeled cRNA
was fragmented by adding 5 µl 10x blocking agent and 1 µl 25x
fragmentation buffers, and then heated at 60˚C for 30 min. Finally,
25 µl 2x GE hybridization buffer was added to dilute the labeled
cRNA. Hybridization solution (40 µl) was dispensed into the gasket
slide and assembled into the Agilent SurePrint G3 Human GE 8X60K,
V3 Microarrays. The slides were incubated for 17 h at 65˚C in an
Agilent hybridization oven and then washed at room temperature
using the Agilent One-Color Microarray-Based Gene Expression
Analysis protocol. The hybridized array was immediately scanned
with an Agilent Microarray Scanner D (Agilent Technologies,
Inc.)
Data processing and bioinformatics
analyses
Raw data were extracted using Agilent Feature
Extraction Software (version 11.0.1.1; Agilent technologies, Inc.).
The raw data for the same genes were then summarized automatically
using the Agilent feature extraction protocol to generate a raw
data text file, providing expression data for each gene probed on
the array. Array probes with Flag A in the samples were filtered
out. The selected gProcessedSignal value was log-transformed and
normalized using the Quantile method (18). Gene-Enrichment and Functional
Annotation analysis for the significant probe list was performed
using g: Profiler, a web server for functional enrichment analysis
(19) and Kyoto Encyclopedia of
Genes and Genomes (KEGG) (20).
Statistical analysis
R version 2.15.1 software (21) was used for image and statistical
analysis. Statistical significance of the expression data was
determined using the fold-change and local-pooled-error test for
identifying significantly differentially expressed genes in
microarray experiments in which the null hypothesis was that no
difference existed between 2 groups. Hierarchical cluster analysis
was performed using complete linkage and Euclidean distance as a
measure of similarity. Pearson's correlation (scatter plot) and
multidimensional scaling plot (2-D graphics) were used to analyze
the degree of reproducibility and similarity between samples,
respectively. Log2 fold-change values >4.0 and <-4.0 were set
as the cut off for significantly upregulated and downregulated
genes, respectively. False discovery rate adjusted P<0.05 was
considered to indicate a statistically significant Gene Ontology
(22,23) and KEGG pathway.
Results
Morphology of EBV-transformed
BLCL
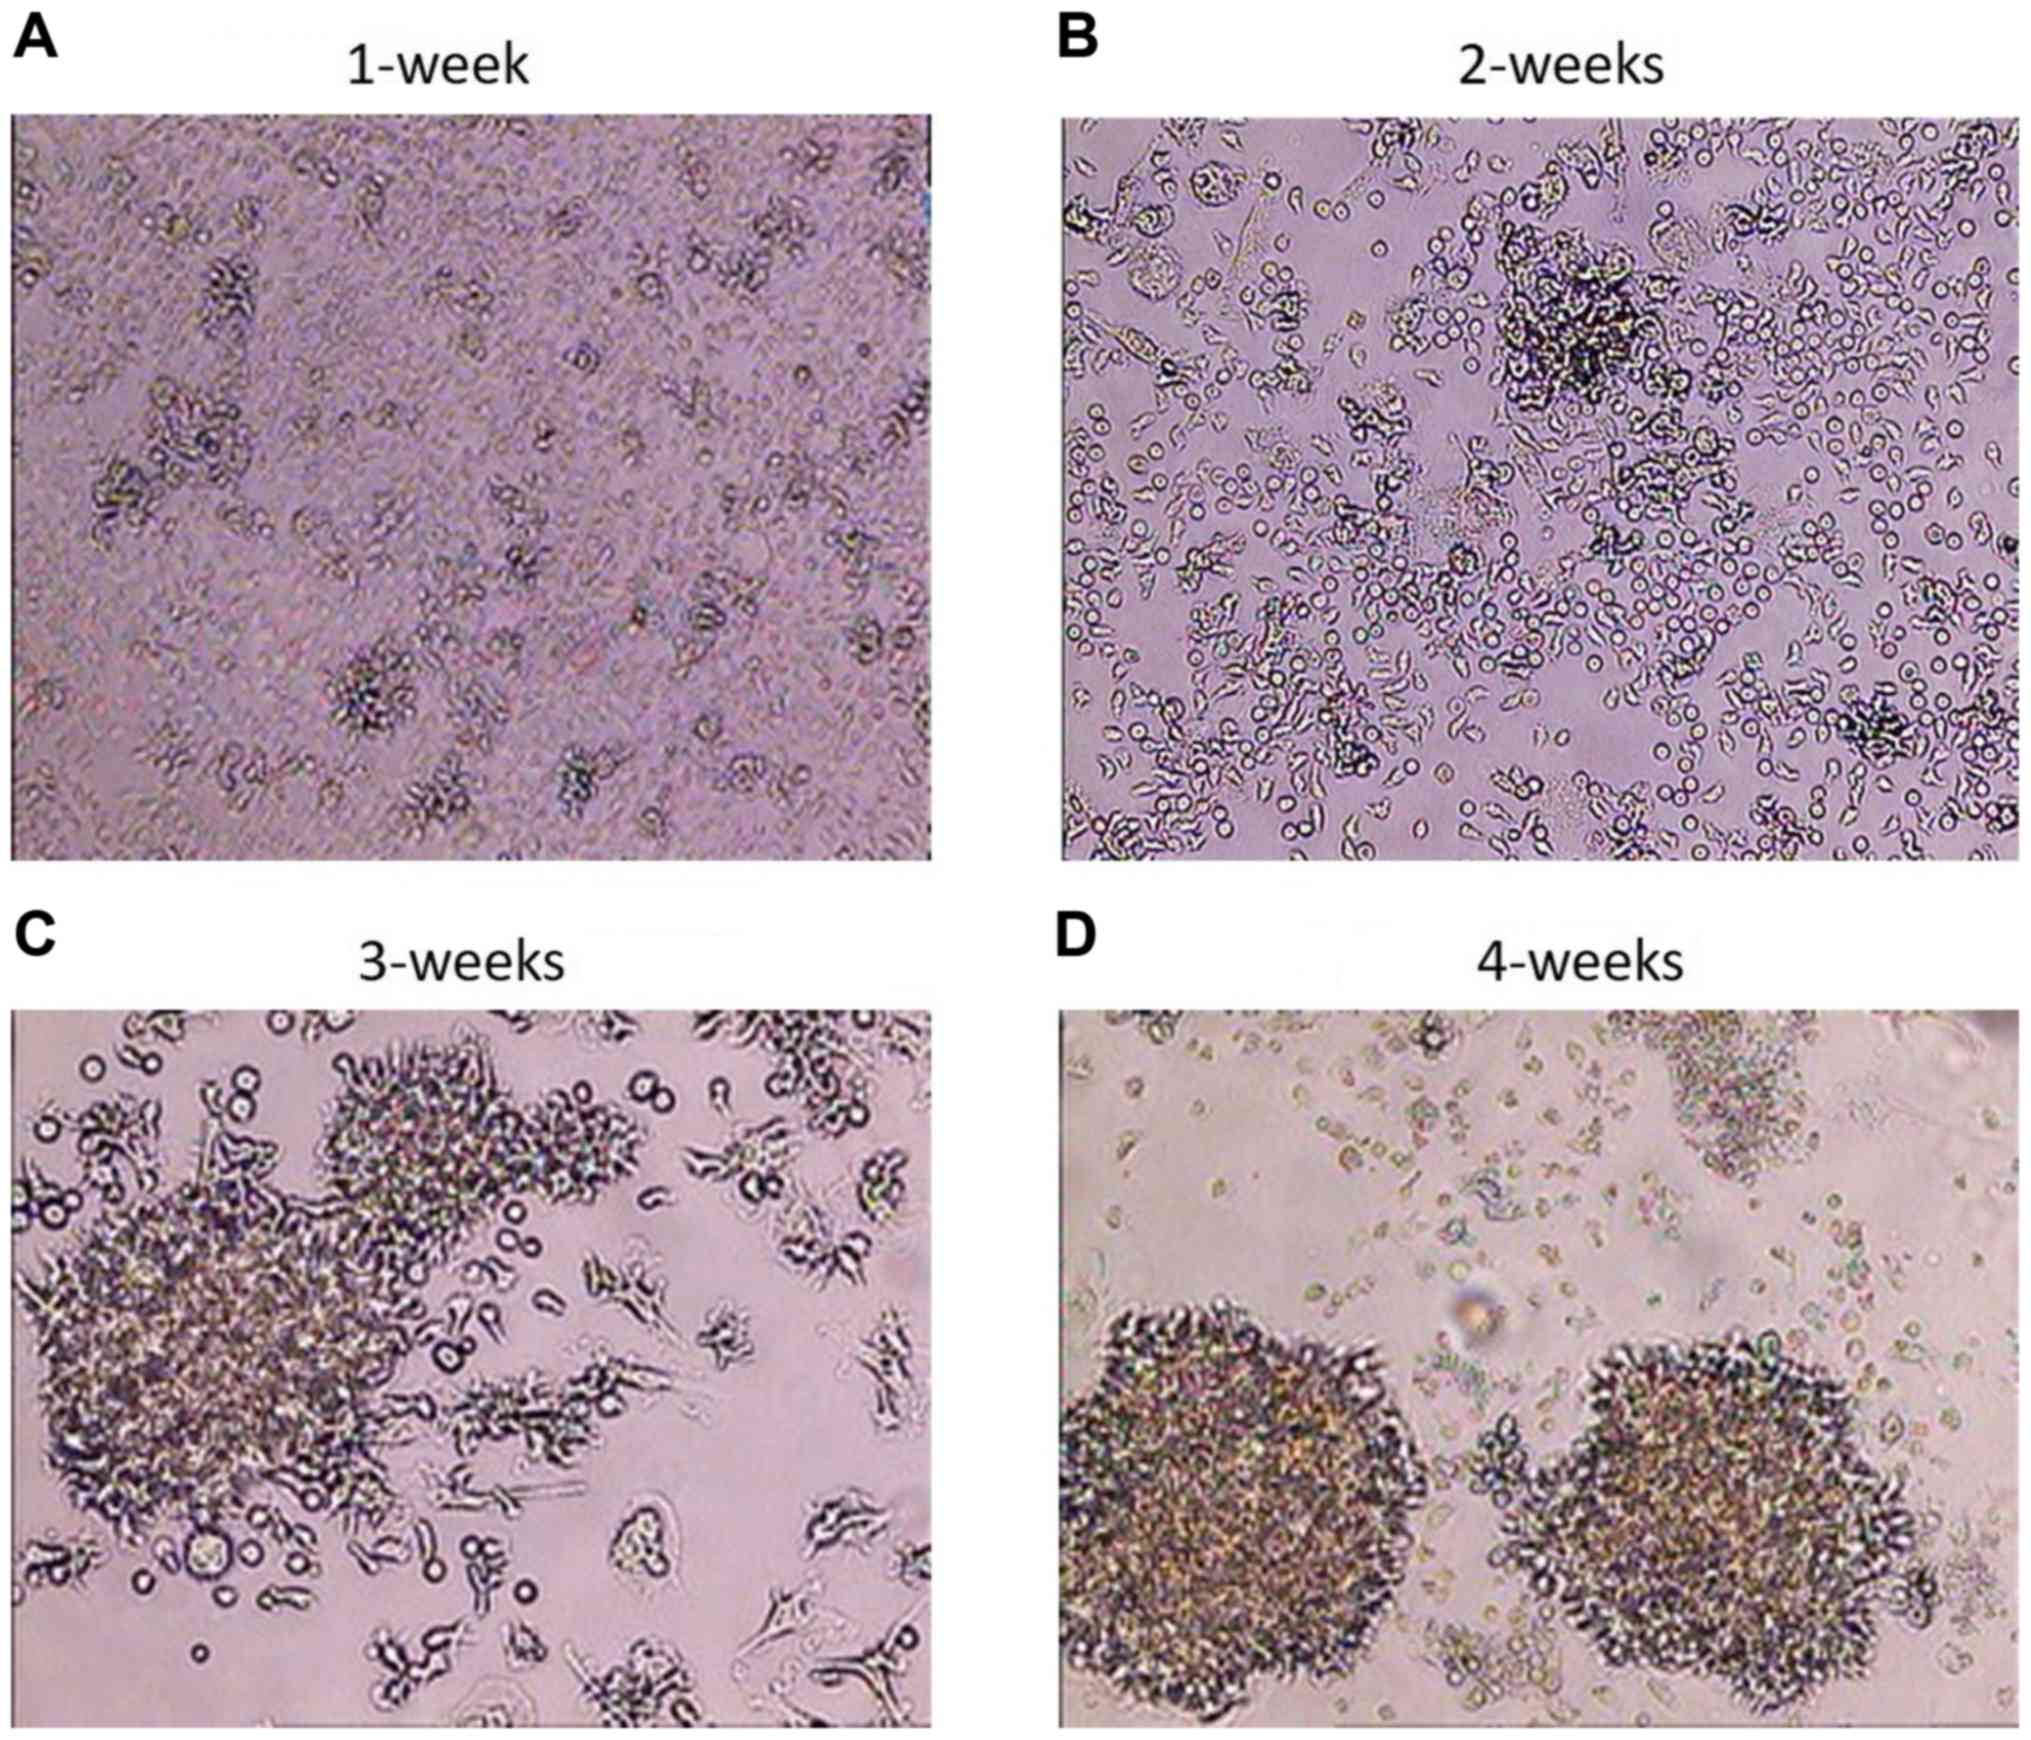
Following the infection of PBMCs and the
transformation of B cells into BLCL, the BLCL grew as small cell
clusters that were visible by light microscopy within a week
(Fig. 1A). With continued cell
culturing, microscopic clusters became larger and single cells
exhibited large nuclei and numerous vacuoles on weeks 2 and 3
(Fig. 1B and C). The highest degree of cell clumping,
cell elongation, cell trajectory and formation of rosette shapes
was visible macroscopically on week 4 (Fig. 1D). The infection rate was ~100%, at
this time point, and the B cell transformation was considered
successful (17,24-26);
BLCL were considered ready for RNA extraction.
Quality control check of gene
expression analysis by microarray analysis
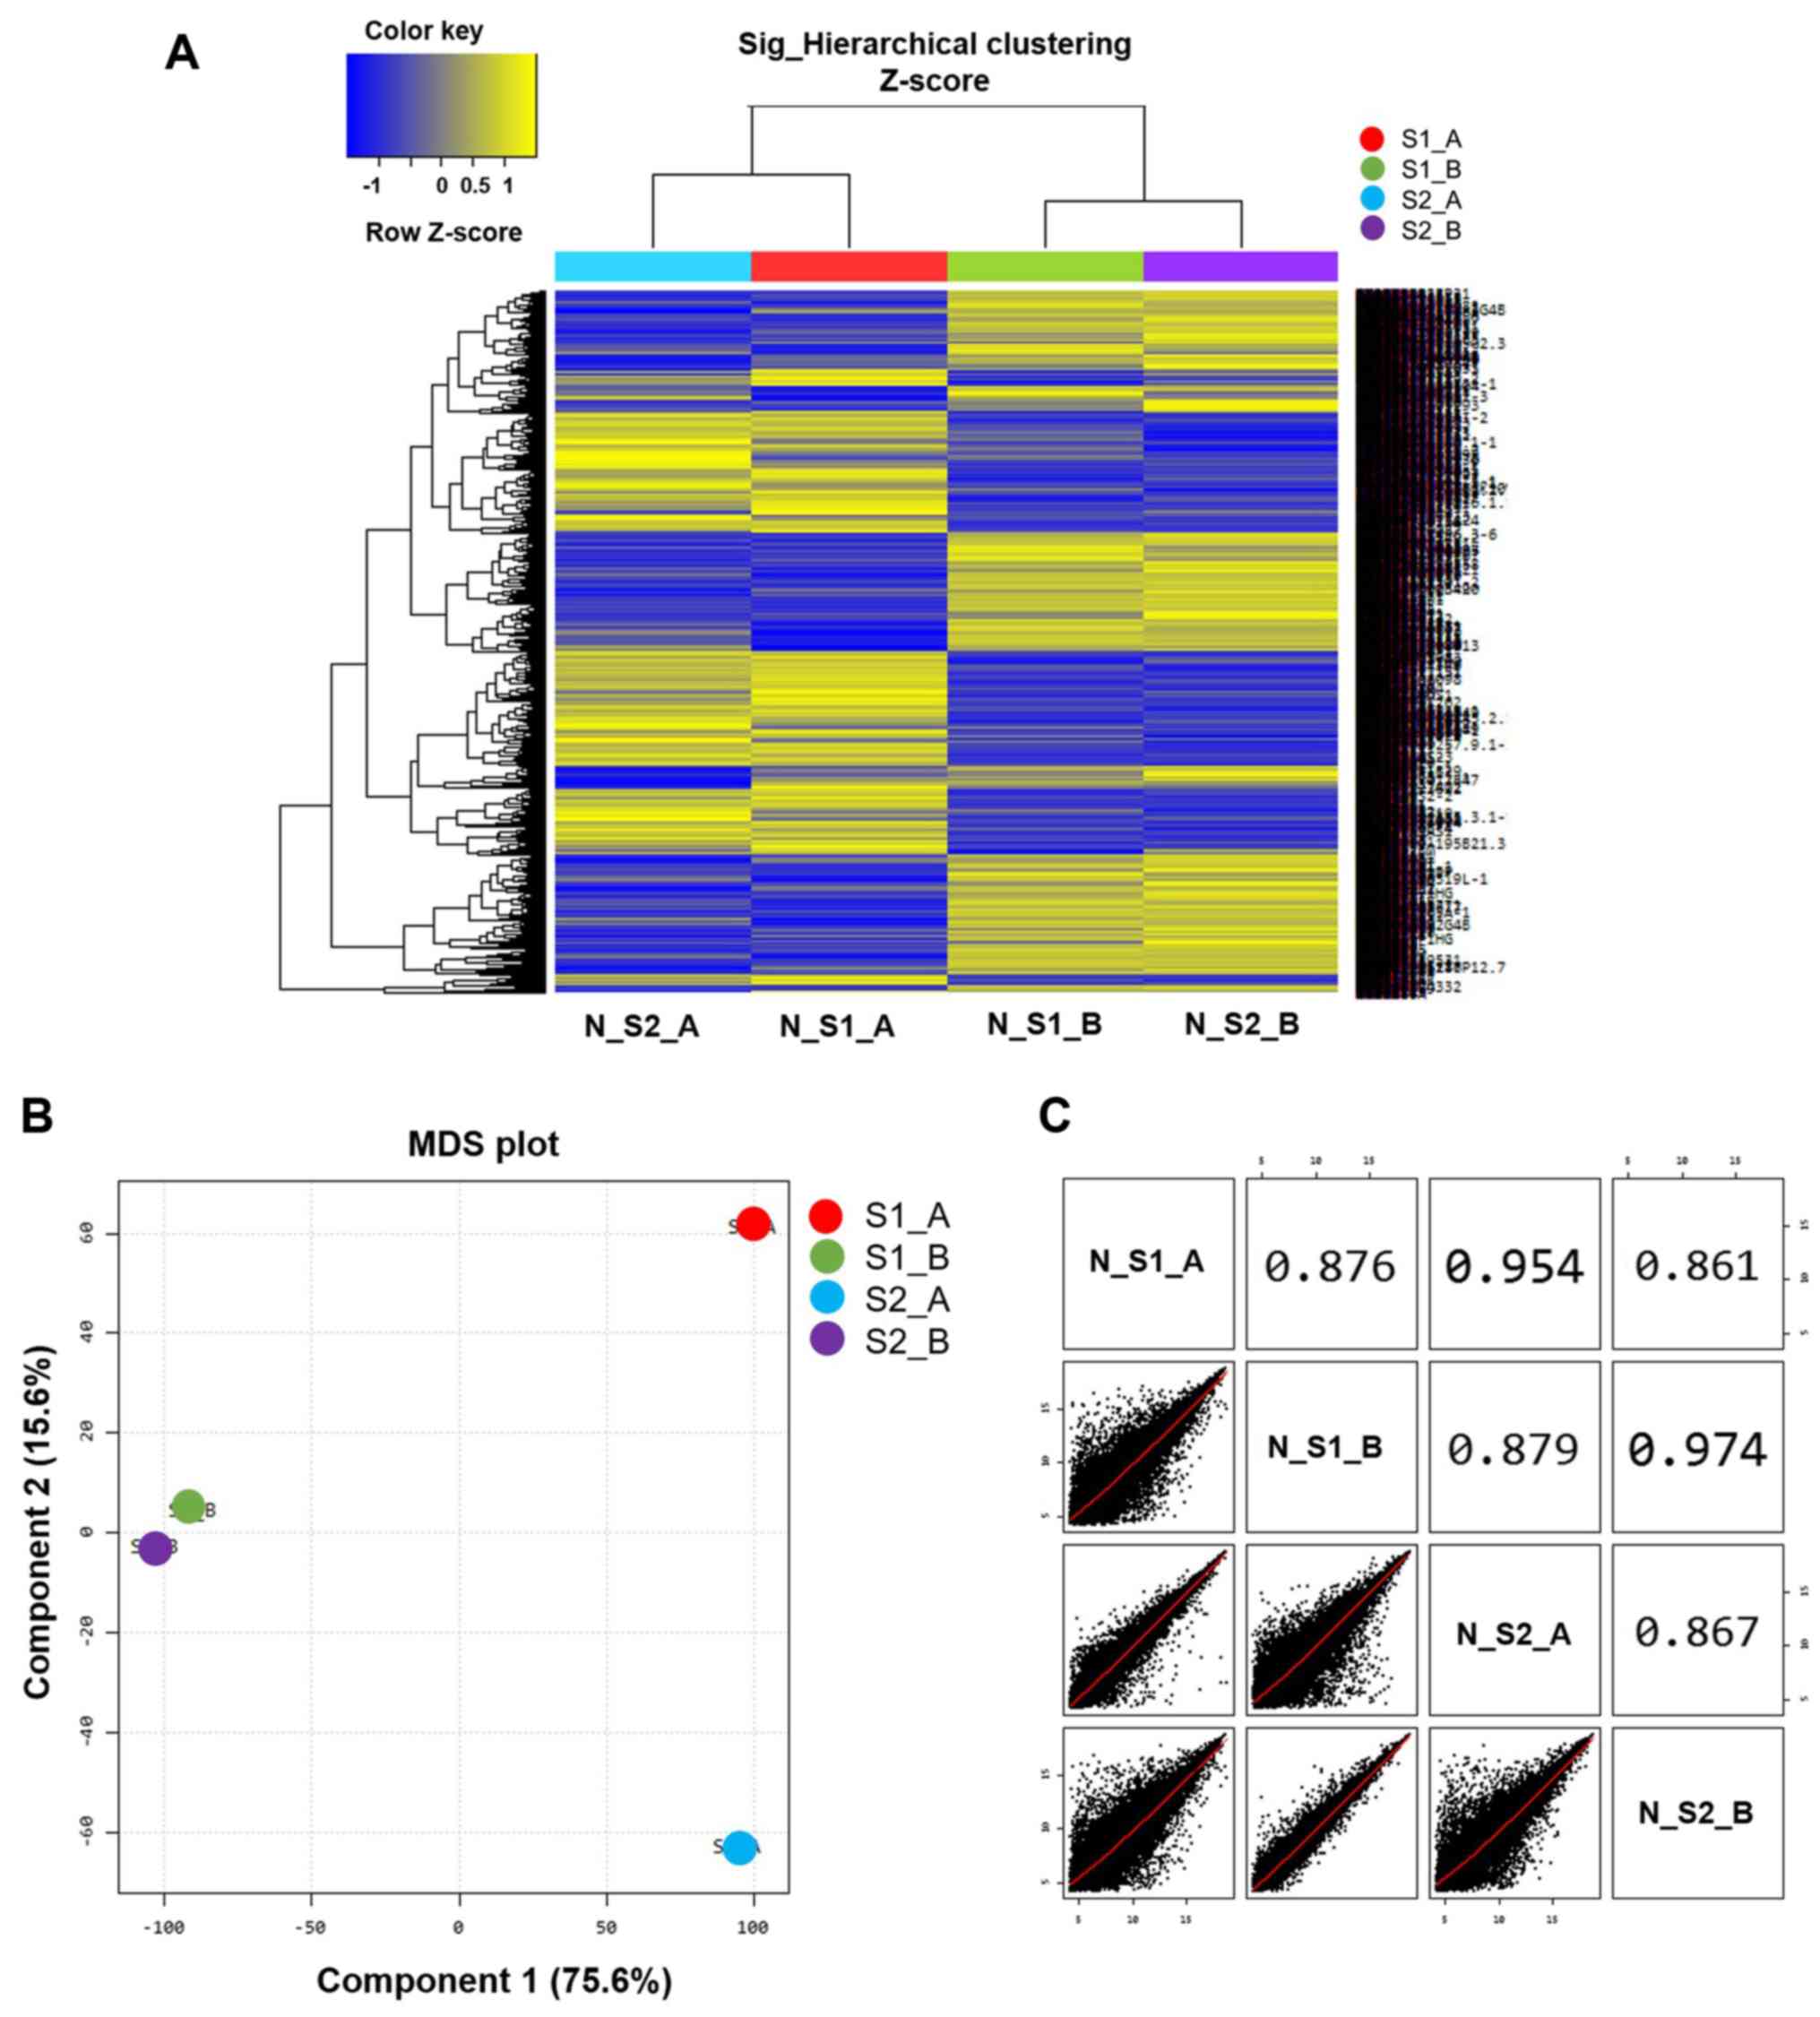
Microarray analysis was used to differentiate gene
expression profiles between normal B cells (S1_A and S2_A) and
EBV-transformed BLCL (S1_B and S2_B). A multidimensional scaling
plot was used to investigate the similarities amongst samples. Of
note, the two EBV-transformed BLCL datasets exhibited similar RNA
expression profiles that were represented by two points (S1_B and
S2_B; Fig. 2B), whereas the two
normal B cell datasets exhibited a long distance of RNA expression
profiles as represented by two separated points (S1_A and S2_A;
Fig. 2B). The scatter plots and
correlation analysis showed a close correlation between S1_B and
S2_B and S1_A and S2_A (Fig.
2C).
Gene expression and molecular pathway
analysis
Following data normalization, heat map clustering
was plotted to express the distance similarity between normal B
cells and EBV-transformed BLCL (Fig.
2A). A log2 fold-change of >4.0 and <4.0 were set as the
cut off points for the differential gene expression analysis of up
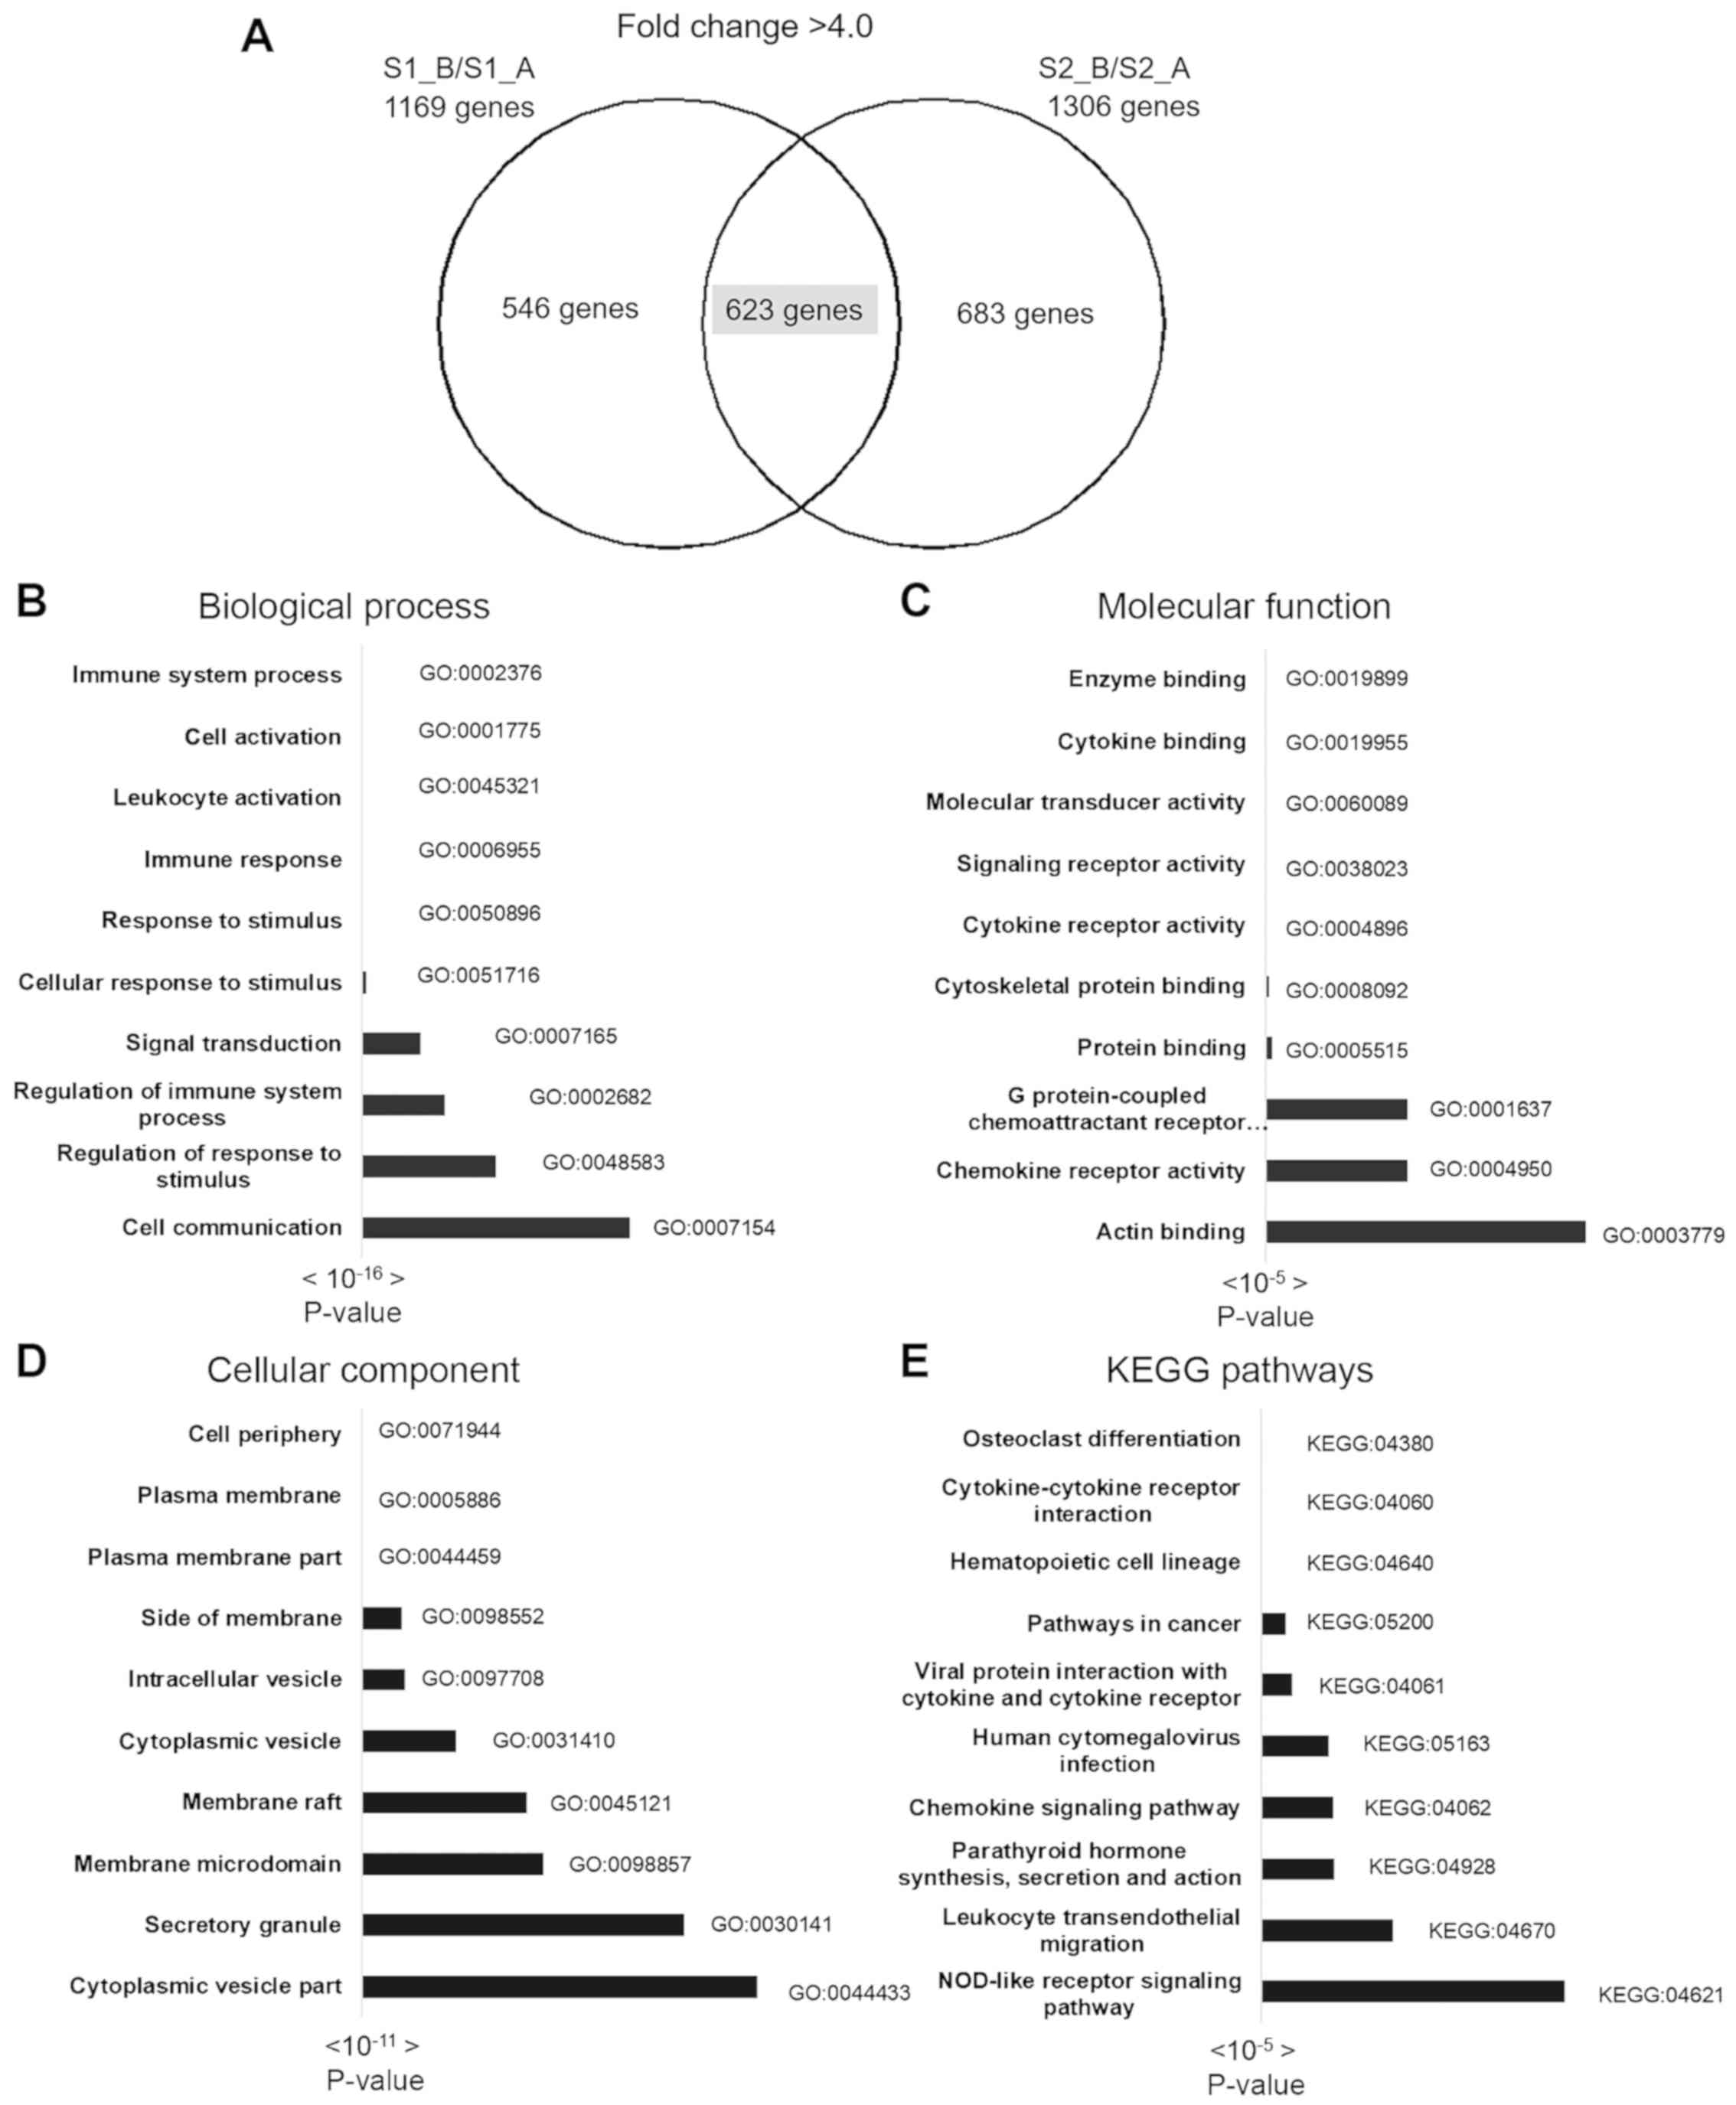
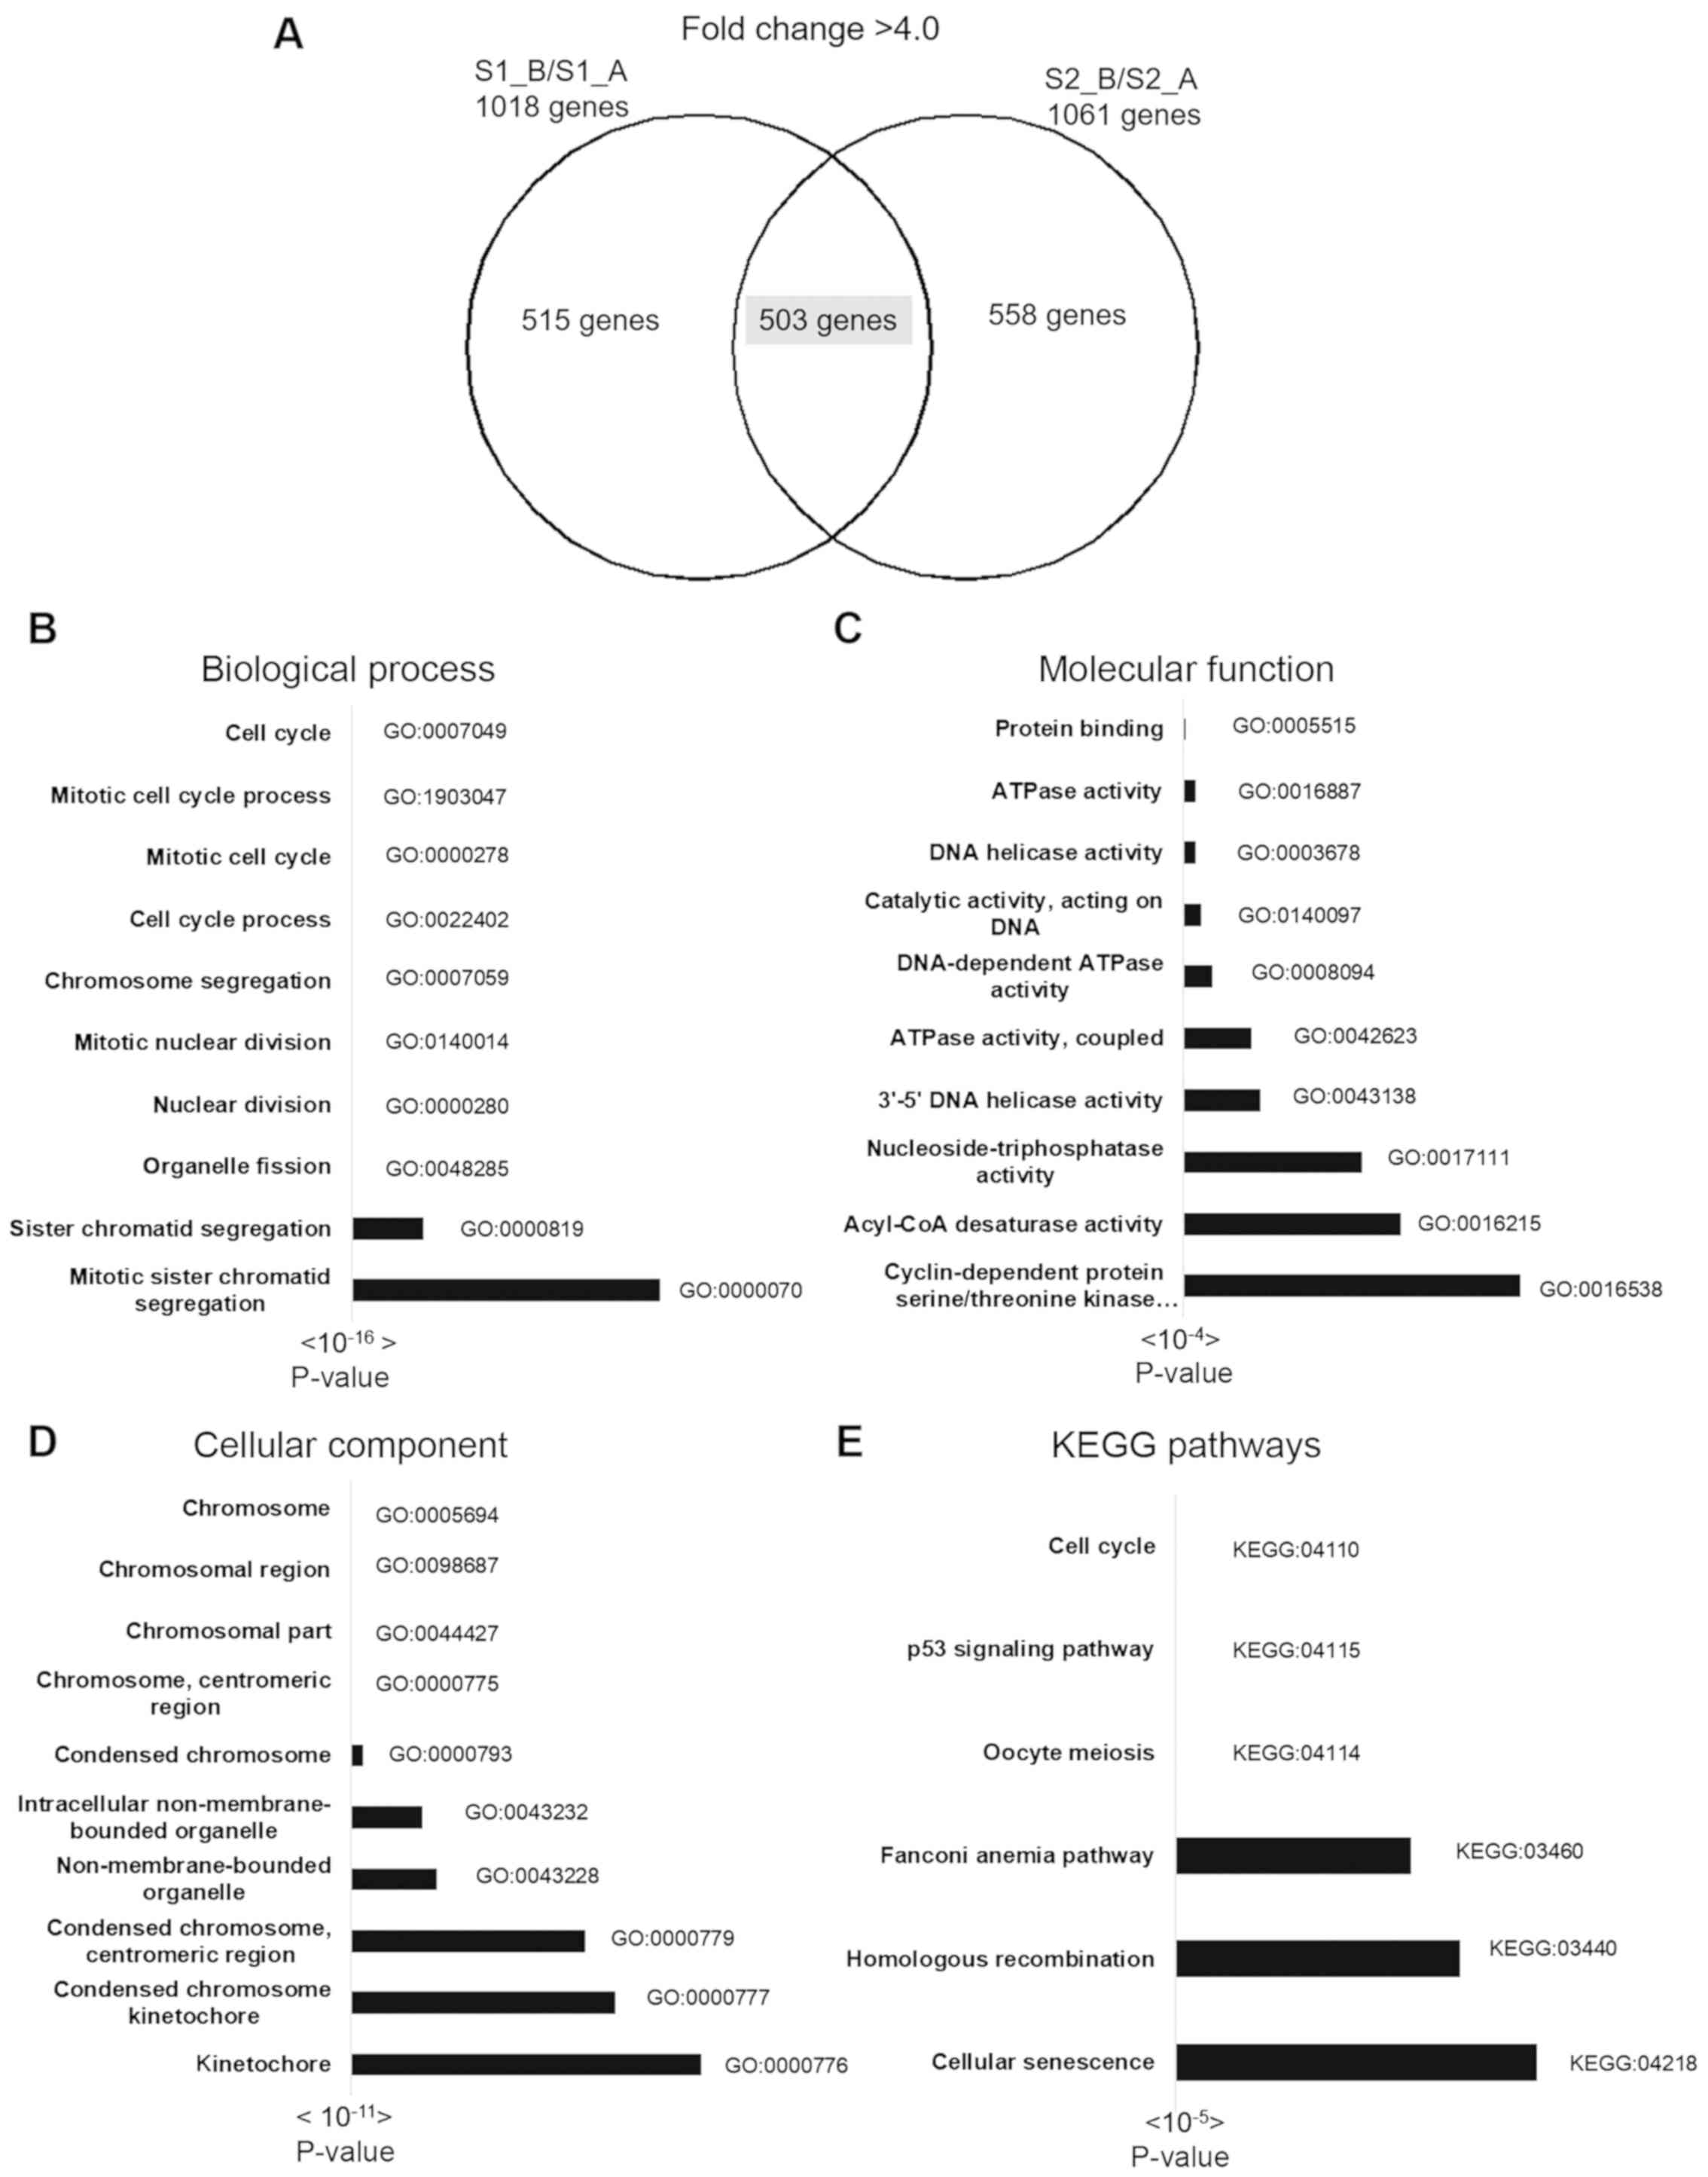
and downregulated genes, respectively. A total of 1,018 and 1,061
upregulated, and 1,169 and 1,306 downregulated genes were
identified in samples S1_B and S2_B, respectively. There were 623
overlapping upregulated genes with a >4.0 fold-change and 503
overlapping downregulated genes with a <4.0 fold-change in the
two datasets (S1_B and S2_B) (Table
SI). The top 30 most up and downregulated genes are shown in
Table I.
 | Table IThe 30 most significantly up- and
downregulated genes in EBV-transformed BLCL samples (S1_B and
S2_B), as compared with normal B cell samples (S1_A and S2_A). |
Table I
The 30 most significantly up- and
downregulated genes in EBV-transformed BLCL samples (S1_B and
S2_B), as compared with normal B cell samples (S1_A and S2_A).
| Gene symbol | Upregulated genes
Description | Mean Log FC | Gene symbol | Downregulated genes
Description | Mean LogFC |
|---|
| TYROBP | TYRO protein
tyrosine kinase-binding protein | 1,429.88 | EBI3 | Epstein-Barr
virus-induced gene 3 | -385.97 |
| CX3CR1 | CX3C chemokine
receptor 1 | 1,177.16 | MIR155HG | MIR155 Host
Gene | -263.21 |
| HBA2 | Hemoglobin subunit
alpha | 1,114.79 | LAMP3 | Lysosome-associated
membrane glycoprotein 3 | -210.37 |
| S100A9 | Protein
S100-A9 | 912.38 | lnc-EFR3B-4 | EFR3 Homolog B,
binding | -161.03 |
| CD8A | T-cell surface
glycoprotein CD8 alpha chain | 707.23 | CD70 | CD70 antigen | -124.01 |
| CSF1R | Macrophage
colony-stimulating factor 1 receptor | 652.57 | PYCR1 |
Pyrroline-5-carboxylate reductase 1,
mitochondrial | -119.83 |
| CSF1R | Colony stimulating
factor 1 receptor | 625.56 | HMMR | Hyaluronan mediated
motility receptor | -100.36 |
| GNLY | Granulysin | 548.88 | VWCE | von Willebrand
factor C and EGF domain-containing protein | -87.10 |
| S100A10 | Protein
S100-A10 | 485.02 | UBE2C |
Ubiquitin-conjugating enzyme E2 C | -80.61 |
| CD3D | T-cell surface
glycoprotein CD3 delta chain | 477.29 | PHLDA3 | Pleckstrin
homology-like domain family A member 3 | -80.53 |
| FOS | Proto-oncogene
c-Fos | 462.16 | PIK3CD-AS2 | PIK3CD Antisense
RNA 2 | -80.32 |
| CD14 | Monocyte
differentiation antigen CD14 | 433.84 | CDCA2 | Cell division
cycle-associated protein 2 | -75.40 |
| SERPINA1 | serpin family A
member 1 | 423.99 | FSCN1 | Fascin | -72.29 |
| MAFB | Transcription
factor MafB | 410.38 | MELK | Maternal embryonic
leucine zipper kinase | -68.64 |
| NKG7 | Protein NKG7 | 393.96 | CENPM | Centromere protein
M | -67.54 |
| PRAM1 | PRAME family member
1 | 334.75 | PLEKHH3 | Pleckstrin homology
domain-containing family H member 3 | -65.46 |
| LILRB3 | Leukocyte
immunoglobulin-like receptor subfamily B member 3 | 309.86 | CCNB2 | G2/mitotic-specific
cyclin-B2 | -63.19 |
| PTGDS | Prostaglandin-H2
D-isomerase | 305.56 | TYMS | Thymidylate
synthase | -61.40 |
| SPOCK2 | Testican-2 | 291.96 | CDK1 | Cyclin-dependent
kinase 1 | -59.03 |
| CD2 | T-cell surface
antigen CD2 | 283.29 | MND1 | Meiotic nuclear
divisions 1 | -54.32 |
| DUSP6 | Dual specificity
protein phosphatase 6 | 281.45 | CDCA3 | Cell division
cycle-associated protein 3 | -53.49 |
| F13A1 | Coagulation factor
XIII A chain | 270.72 | lnc-SPAG1-3 | lincRNA | -49.32 |
| CSF3R | Granulocyte
colony-stimulating factor receptor | 226.40 | BIRC5 | Baculoviral IAP
repeat-containing protein 5 | -49.25 |
| GP1BB | Platelet
glycoprotein Ib beta chain | 214.81 | ASPM | abnormal spindle
microtubule assembly | -47.99 |
| CTSW | Cathepsin W | 190.24 | CDCA5 | cell division cycle
associated 5 | -47.78 |
| C1orf162 | Transmembrane
protein C1orf162 | 173.42 | TROAP |
Trophinin-associated protein | -45.83 |
| NRGN | Neurogranin | 172.89 | TPX2 | Targeting protein
for Xklp2 | -45.54 |
| LST1 | Leukocyte-specific
transcript 1 protein | 157.63 | LOC283710 | Uncharacterized
LOC283710 | -42.64 |
| GLIPR2 | Golgi-associated
plant pathogenesis-related protein 1 | 143.79 | C16orf59 | Chromosome 16 open
reading frame 59 | -41.83 |
| DUSP1 | Dual specificity
protein phosphatase 1 | 137.27 | CDC45 | Cell division
control protein 45 homolog | -39.36 |
Gene-enrichment and functional annotation analysis
were performed using KEGG pathway and gene ontology analysis in
g:Profiler. A total of 623 overlapping upregulated genes were used
for complete gene ontology analysis; 178 terms in biological
process (BP), 37 terms in cellular component (CC), 24 terms in
molecular function (MF) and 15 KEGG pathways were identified. The
top 10 BP, CC, MF and KEGG pathways are shown in Fig. 3, and the top 3 pathways of the 30
most upregulated genes and gene lists are shown in Table II. The most significant BPs included
immune system process, cell activation, response to stimulus and
leukocyte activation. The most significant CCs included cell
periphery, plasma membrane and plasma membrane part. The most
significant MF pathways included enzyme binding, cytokine binding
and molecular transducer activity. The most significant KEGG
pathways included osteoclast differentiation, cytokine-cytokine
receptor interaction, hematopoietic cell lineage and pathways
involved in cancer.
| Table IITop 3 pathways and gene lists of
enriched GO categories, and KEGG pathways of 30 upregulated
genes. |
Table II
Top 3 pathways and gene lists of
enriched GO categories, and KEGG pathways of 30 upregulated
genes.
| A, Biological
process |
|---|
| Pathways | GO term | Gene count | Gene lists | P-value |
|---|
| Immune system
process | GO:0002376 | 18 | TYROBP, GNLY, FOS,
CD14, MAFB, CSF1R, CD8A, SERPINA1, LILRB3, CSF3R, S100A9, PRAM1,
CTSW, CD3D, CD2, LST1, CX3CR1, DUSP1 | 7.31533E-06 |
| Regulation of
immune system process | GO:0002682 | 14 | TYROBP, FOS, CD14,
MAFB, CD8A, LILRB3, CSF3R, S100A9, PRAM1, CD3D, CD2, LST1, CX3CR1,
DUSP1 | 8.96541E-06 |
| Cell
activation | GO:0001775 | 12 | TYROBP, CD14, MAFB,
CD8A, SERPINA1, LILRB3, S100A9, PRAM1, GP1BB CD3D, CD2, LST1 | 0.00026598 |
| B, Molecular
function |
| Pathways | GO term | Gene count | Gene lists | P-value |
| Signaling receptor
activity | GO:0038023 | 9 | CD14, CSF1R, CD8A,
LILRB3, CSF3R, GP1BB, CD3D, CD2, CX3CR1 | 0.01814678 |
| Molecular
transducer activity | GO:0060089 | 9 | CD14, CSF1R, CD8A,
LILRB3, CSF3R, GP1BB, CD3D, CD2, CX3CR1 | 0.02401768 |
| MAP kinase
tyrosine/ serine/threonine phosphatase activity | GO:0017017 | 2 | DUSP6, DUSP1 | 0.03972376 |
| C, Cellular
component |
| Pathways | GO term | Gene count | Gene lists | P-value |
| External side of
plasma membrane | GO:0009897 | 6 | CD14, CD8A, CSF3R,
CD3D, CD2, CX3CR1 | 0.00348039 |
| Cytoplasmic vesicle
part | GO:0044433 | 10 | TYROBP, GNLY, CD14,
F13A1, SERPINA1, LILRB3, S100A9, CTSW, NRGN, CD3D | 0.00526305 |
| Cell surface | GO:0009986 | 8 | TYROBP, CD14,
CSF1R, CD8A, CSF3R, CD3D, CD2, CX3CR1 | 0.00549100 |
| D, KEGG
pathway |
| Pathways | GO term | Gene count | Gene lists | P-value |
| Hematopoietic cell
lineage | KEGG:04640 | 7 | CD14, CSF1R, CD8A,
CSF3R, GP1BB, CD3D, CD2 | 5.73E-08 |
| Osteoclast
differentiation | KEGG:04380 | 4 | TYROBP, FOS, CSF1R,
LILRB3 | 0.01092597 |
| Acute myeloid
leukemia | KEGG:05221 | 3 | CD14, CSF1R,
DUSP6 | 0.02843111 |
Functional and pathway analysis results of 503
downregulated genes are shown in Fig.
4. There were 250 terms in BP, 112 terms in CC, 28 terms in MF
and 6 KEGG pathways identified by g: Profiler. The most significant
BPs included cell cycle, mitotic cell cycle process and mitotic
cell cycle. The most significant CCs included chromosome,
chromosomal region and chromosomal part. The most significant MF
pathways included protein binding, ATPase activity and DNA helicase
activity. The most significant KEGG pathways included cell cycle,
the p53 signaling pathway and oocyte meiosis (Fig. 4). The top 3 pathways of the 30 most
downregulated genes with gene lists are displayed in Table III.
| Table IIITop 3 pathways and gene lists of
enriched GO categories and KEGG pathways of 30 downregulated
genes. |
Table III
Top 3 pathways and gene lists of
enriched GO categories and KEGG pathways of 30 downregulated
genes.
| A, Biological
process |
|---|
| Pathways | GO term | Gene count | Gene lists | P-value |
|---|
| Cell cycle | GO:0007049 | 14 | HMMR, UBE2C, CDCA2,
MELK, CCNB2, TYMS, CDK1, MND1, CDCA3, BIRC5, ASPM, CDCA5, TPX2,
CDC45 | 2.14467E-05 |
| Mitotic cell cycle
phase transition | GO:0044772 | 9 | HMMR, UBE2C, MELK,
CCNB2, TYMS, CDK1, CDCA5, TPX2, CDC45 | 6.1294E-05 |
| Cell division | GO:0051301 | 9 | UBE2C, CDCA2,
CCNB2, CDK1, CDCA3, BIRC5, ASPM, CDCA5, TPX2 | 8.68163E-05 |
| B, Molecular
function |
| Pathways | GO term | Gene count | Gene lists | P-value |
| No statistically
significant results |
| C, Cellular
component |
| Pathways | GO term | Gene count | Gene lists | P-value |
| No statistically
significant results |
| D, KEGG
pathway |
| Pathways | GO term | Gene count | Gene lists | P-value |
| Cell cycle | KEGG:04110 | 3 | CCNB2, CDK1,
CDC45 | 0.04453008 |
EBV infection affected several cellular pathways;
according to BP and KEGG pathway analysis, EBV infection induced
the expression of cellular genes involved in cancer-related
pathways, including the MAPK signaling pathway (ARRB2, CD14,
CDC25B, DUSP1, DUSP6, HSPA6, JUND, MAP3K1, MAP3K6, MAPKAPK3,
PRKACB, PRKCA, RASGRP2, RASGRP4, TGFBR2 and TNFRSF1A), the WNT
signaling pathway (CCND3, CTBP2, FRAT1, FRAT2, LEF1, PLCB1, PLCB2,
PRKACB, PRKCA and WNT10B) and the PI3K-Akt signaling pathway
(CCND3, CDK4, CDK6, CSF1R, CSF3R, F2R, GNG11, GNG2, IL4R, IL6R,
ITGA5, ITGB1, JAK1, LAMB2, PPP2R2B, PRKCA, SGK3 and TLR2). These
genes promote proliferation of BLCL and their transformation to
immortalized cells. Cellular genes that function and are located in
the plasma membrane and cell surface, such as CX3CR1, CD8A, CD3D,
CD14, CD2, CDH23, CSF3R, TYROBP, CSF1R, S100A10, NKG7, LILRB3, CD2,
GP1BB, NRGN, ITGAM, ITGB and ITGAX were highly expressed, and these
genes were associated with the MF pathways; protein binding and
cell adhesion. As shown in Fig. 1D,
EBV-transformed BLCL exhibited cell clumping and rosette shape
formation.
Downregulated genes were primarily involved in cell
cycle (CCNB1, CCNB2, CCNE1, CCNE2, CDC20, CDC45, CDK1, CDKN2A,
CHEK1, E2F1, ESPL1, MAD2L1, MCM2, MCM4, MDM2, PCNA, PKMYT1, PTTG1,
PTTG2 and SFN), p53 signaling pathway (CCNB1, CCNB2, CCNE1, CCNE2,
CDK1, CDKN2A, CHEK1, DDB2, FAS, MDM2, RRM2B and SFN) and cellular
senescence (CCNB1, CCNB2, CCNE1, CCNE2, CDK1, CDKN2A, CHEK1, E2F1,
MAPK11, MDM2, MYBL2 and SLC25A4).
Discussion
The present study was performed to determine the
effects of EBV infection on alterations to cellular signaling
pathways in human B cells collected from two healthy Thai
individuals. The similarities between the gene expression profiles
of the two EBV-transformed BLCL indicated common characteristics of
EBV-induced transformation of B cells. A considerable number of
processes were upregulated in BLCL, including osteoclast
differentiation, cytokine-cytokine receptor interaction,
hematopoietic cell lineage, pathways in cancer, the chemokine
signaling pathway, leukocyte transendothelial migration and the
NOD-like receptor signaling pathway. Significantly downregulated
pathways consisted of genes involved in cell cycle regulation,
oocyte meiosis, the p53 signaling pathway, metabolic pathways and
cellular senescence, which was similar to the results of a previous
study using DLBCL samples (27).
Carter et al (28) used cDNA
array hybridization on nitrocellulose filters and RT-qPCR, similar
to the present study, and showed that cells involved in cell
adhesion and structure were highly expressed in
EBV-infected-lymphoblastoid cells. Previous studies using RNA
sequencing (RNAseq) to investigate cellular gene expression
patterns in EBV-transformed B cells at different time points found
similar alterations in the expression of genes and thus biological
pathways to those reported in the present study, such as immune
system process, response to stimulus, lymphocyte migration,
cellular activation, defense response, tumor necrosis
factor-mediated signaling pathway, G1/S transition of mitotic cell
cycle, DNA replication and cell cycle arrest (16,29).
This similarity suggests that the results of cellular
transcriptomic analysis of EBV-transformed B-cells obtained from
either microarray analysis or RNAseq analysis are similar.
Cellular genes that function and are located in the
external side of the plasma membrane or cytoplasmic vesicle that
were upregulated, may have been involved in cell-cell fusion. The
LMP-1 protein of EBV has the ability to induce the expression of
surface proteins, such as integrins and cadherins, which are
involved in cell adhesion (30). It
has been reported that integrin and EBV glycoprotein interactions
induce epithelial cell fusion (31).
The molecular pathways that may be involved in the expression of
cell surface proteins in the present study included Rho and
GTPase-mediated signal transduction, and these proteins have been
reported to result in cytoskeletal rearrangement and induce
cell-cell adhesion (32).
The other cellular genes with biological functions
in the MAPK, WNT and PI3K-Akt signaling pathways were upregulated
and involved in the acquisition of a tumorigenic phenotype in
EBV-infected B cells, included B-lymphoproliferative disease,
Hodgkin's lymphoma and Burkitt's lymphoma (4). The EBV encoded latent membrane protein
1 (LMP-1) viral oncoprotein functions similar to those of the
active receptor CD40/TNFR family, and has an oncogenic potential
that results in a long period of cell survival (9). LMP1 has the ability to activate several
cellular signaling pathways, including the MAPK signaling pathway,
which ultimately increases B cell proliferation (4). The WNT pathway also increases the
invasiveness of EBV-positive cells (33). Previous studies have shown that,
LEF1, a gene involved in the WNT pathway is also upregulated in
EBV-infected epithelial cells and B cells (33,34). In
addition, other studies have reported that LMP1 has the ability to
activate the PI3K/Akt pathway in NPC and nasal natural
killer/T-cell lymphoma, resulting in the inhibition of cell
apoptosis (35,36).
Overexpression of JAK1 and STAT4 in BLCL was
observed in the present study, which may be involved in the
JAK/STAT signaling pathway that has been reported to be activated
in DLBCL (37). MYC oncogene has
been reported to be overexpressed in Burkitt's lymphoma, and the
present study identified increased MYCL proto-oncogene
transcription factor in BLCL, which may be involved in cell
proliferation (37). CDK4 and CDK6
gene expression was also increased in BLCL, consistent with results
of previous studies that used RNAseq (16,29).
CDK4/6 proteins induce the phosphorylation of retinoblastoma
protein (pRb), as well as release free E2F from the pRb/E2F complex
to drive the cell cycle into the S phase (38). In addition, a CDK4/6 inhibitor has
been shown to suppress NPC cell growth and induce cell cycle arrest
(39).
In the present study, downregulation of genes
involved in cell cycle control, p53 signaling pathway and cellular
senescence was observed in the BLCL. By contrast, analysis of
EBV-positive undifferentiated NPC cells showed that genes involved
in the cell cycle and p53 signaling pathway, such as CDK1, CCNB1,
CCNB2 and MDM2 were upregulated (40).
A study of liver hepatocellular carcinoma (HCC)
reported high levels of BIRC5 expression in HCC compared with the
present study, which reported the downregulation of BIRC5 in
EBV-transformed BLCL (41). TROAP
was found to be upregulated in cholangiocarcinoma (42); however, the present study reported a
downregulation of TROAP expression in EBV-transformed BLCL. These
findings indicate that each pathogen has an independent ability to
alter cellular gene expression that transforms normal cells into
immortalized cells and causes cancer progression.
In conclusion, EBV-mediated transformation of
different cell types, affects the cellular gene expression profiles
and activities of cellular pathways. However, infected cells
exhibit alterations to common cellular pathways, such as
upregulation of the MAPK, WNT and PI3K-Akt signaling pathways,
which may highlight potential targets for therapeutic treatment of
patients with EBV-related cancer.
Supplementary Material
Supplementary Data
Acknowledgements
Not applicable.
Funding
This work was supported by the Applied Medical
Virology Research Unit of Chulalongkorn University, and
Chulalongkorn Academic Advancement into Its 2nd Century Project.
(CUAASC). This work was partly supported by the TRF Grant for New
Researchers from the Thailand Research Fund Grant (grant no.
TRG6080008) and Chulalongkorn University Office of International
Affairs Scholarship for Short-term Research.
Availability of data and materials
The datasets used and/or analyzed in the present
study are available from the corresponding author on reasonable
request.
Authors' contributions
NK and SB designed and performed the experiments. AC
and NK organized and analyzed the data. AC wrote the manuscript. RS
performed the experiments. All authors read and approved the final
manuscript.
Ethics approval and consent to
participate
The present study was approved by the Institutional
Review Board of the Faculty of Medicine, Chulalongkorn University
(Bangkok, Thailand) (approval no. 358/46) and both subjects
provided written informed consent.
Patient consent for publication
Not applicable.
Competing interests
The authors declare that they have no competing
interests.
References
|
1
|
Balfour HH Jr, Sifakis F, Sliman JA,
Knight JA, Schmeling DO and Thomas W: Age-specific prevalence of
Epstein-Barr virus infection among individuals aged 6-19 years in
the United States and factors affecting its acquisition. J Infect
Dis. 208:1286–1293. 2013.PubMed/NCBI View Article : Google Scholar
|
|
2
|
Condon LM, Cederberg LE, Rabinovitch MD,
Liebo RV, Go JC, Delaney AS, Schmeling DO, Thomas W and Balfour HH
Jr: Age-specific prevalence of Epstein-Barr virus infection among
Minnesota children: Effects of race/ethnicity and family
environment. Clin Infect Dis. 59:501–508. 2014.PubMed/NCBI View Article : Google Scholar
|
|
3
|
Hjalgrim H, Friborg J and Melbye M: The
epidemiology of EBV and its association with malignant disease. In:
Human Herpesviruses: Biology, Therapy, and Immunoprophylaxis. Arvin
A, Campadelli-Fiume G, Mocarski E, Moore PS, Roizman B, Whitley R
and Yamanishi K (eds). Cambridge, 2007. https://doi.org/10.1017/CBO9780511545313.054.
|
|
4
|
El-Sharkawy A, Al Zaidan L and Malki A:
Epstein-Barr virus-associated malignancies: Roles of viral
oncoproteins in carcinogenesis. Front Oncol. 8(265)2018.PubMed/NCBI View Article : Google Scholar
|
|
5
|
Esmeray E and Küçük C: Genetic alterations
in B cell lymphoma subtypes as potential biomarkers for noninvasive
diagnosis, prognosis, therapy, and disease monitoring. Turk J Biol.
44:1–14. 2020.PubMed/NCBI View Article : Google Scholar
|
|
6
|
Li CW, Jheng BR and Chen BS: Investigating
genetic-and-epigenetic networks, and the cellular mechanisms
occurring in Epstein-Barr virus-infected human B lymphocytes via
big data mining and genome-wide two-sided NGS data identification.
PLoS One. 13(e0202537)2018.PubMed/NCBI View Article : Google Scholar
|
|
7
|
Saha A and Robertson ES: Mechanisms of
B-cell oncogenesis induced by Epstein-Barr Virus. J Virol.
93(93)2019.PubMed/NCBI View Article : Google Scholar
|
|
8
|
Hutt-Fletcher LM: Epstein-Barr virus
replicating in epithelial cells. Proc Natl Acad Sci USA.
111:16242–16243. 2014.PubMed/NCBI View Article : Google Scholar
|
|
9
|
Rowe M and Zuo J: Immune responses to
Epstein-Barr virus: Molecular interactions in the virus evasion of
CD8+ T cell immunity. Microbes Infect. 12:173–181. 2010.PubMed/NCBI View Article : Google Scholar
|
|
10
|
Wanvimonsuk S, Thitiwanichpiwong P,
Keelawat S, Mutirangura A and Kitkumthorn N: Distribution of the
Epstein-Barr virus in the normal stomach and gastric lesions in
Thai population. J Med Virol. 91:444–449. 2019.PubMed/NCBI View Article : Google Scholar
|
|
11
|
Jha HC, Pei Y and Robertson ES:
Epstein-Barr virus: Diseases linked to infection and
transformation. Front Microbiol. 7(1,602)2016.PubMed/NCBI View Article : Google Scholar
|
|
12
|
Tulalamba W and Janvilisri T:
Nasopharyngeal carcinoma signaling pathway: An update on molecular
biomarkers. Int J Cell Biol. 2012(594681)2012.PubMed/NCBI View Article : Google Scholar
|
|
13
|
Atsaves V, Leventaki V, Rassidakis GZ and
Claret FX: AP-1 transcription factors as regulators of immune
responses in cancer. Cancers (Basel). 11(11)2019.PubMed/NCBI View Article : Google Scholar
|
|
14
|
Hanahan D and Weinberg RA: Hallmarks of
cancer: The next generation. Cell. 144:646–674. 2011.PubMed/NCBI View Article : Google Scholar
|
|
15
|
Park HW, Dahlin A, Qiu W and Tantisira KG:
Gene expression changes in lymphoblastoid cell lines and primary B
cells by dexamethasone. Pharmacogenet Genomics. 29:58–64.
2019.PubMed/NCBI View Article : Google Scholar
|
|
16
|
Wang C, Li D, Zhang L, Jiang S, Liang J,
Narita Y, Hou I, Zhong Q, Zheng Z, Xiao H, et al: RNA sequencing
analyses of gene expression during Epstein-Barr virus infection of
primary B lymphocytes. J Virol. 93(93)2019.PubMed/NCBI View Article : Google Scholar
|
|
17
|
Hui-Yuen J, McAllister S, Koganti S, Hill
E and Bhaduri-McIntosh S: Establishment of Epstein-Barr virus
growth-transformed lymphoblastoid cell lines. J Vis Exp.
(57)(3,321)2011.PubMed/NCBI View
Article : Google Scholar
|
|
18
|
Bolstad BM, Irizarry RA, Astrand M and
Speed TP: A comparison of normalization methods for high density
oligonucleotide array data based on variance and bias.
Bioinformatics. 19:185–193. 2003.PubMed/NCBI View Article : Google Scholar
|
|
19
|
Raudvere U, Kolberg L, Kuzmin I, Arak T,
Adler P, Peterson H and Vilo J: g:Profiler: A web server for
functional enrichment analysis and conversions of gene lists (2019
update). Nucleic Acids Res. 47 (W1):W191–W198. 2019.PubMed/NCBI View Article : Google Scholar
|
|
20
|
Kanehisa M: Post-genome informatics.
Oxford University Press, Oxford, UK, 2000.
|
|
21
|
R Core Team: (2012). R: A language and
environment for statistical computing. R Foundation for Statistical
Computing, Vienna, Austria. ISBN 3-900051-07-0. http://www.R-project.org/.
|
|
22
|
The Gene Ontology Consortium. The Gene
Ontology Resource: 20 years and still GOing strong. Nucleic Acids
Res. 47 (D1):330–338. 2019.PubMed/NCBI View Article : Google Scholar
|
|
23
|
Ashburner M, Ball CA, Blake JA, Botstein
D, Butler H, Cherry JM, Davis AP, Dolinski K, Dwight SS, Eppig JT,
et al: The Gene Ontology Consortium: Gene ontology: Tool for the
unification of biology. Nat Genet. 25:25–29. 2000.PubMed/NCBI View
Article : Google Scholar
|
|
24
|
Baik SY, Yun HS, Lee HJ, Lee MH, Jung SE,
Kim JW, Jeon JP, Shin YK, Rhee HS, Kimm KC, et al: Identification
of stathmin 1 expression induced by Epstein-Barr virus in human B
lymphocytes. Cell Prolif. 40:268–281. 2007.PubMed/NCBI View Article : Google Scholar
|
|
25
|
Hussain T and Mulherkar R: Lymphoblastoid
cell lines: A continuous in vitro source of cells to study
carcinogen sensitivity and DNA repair. Int J Mol Cell Med. 1:75–87.
2012.PubMed/NCBI
|
|
26
|
Jeon JP: Human lymphoblastoid cell lines
in pharmacogenomics. In: Handbook of pharmacogenomics and
stratified medicine. Padmanabhan S (ed). Academic Press, San Diego,
pp89-110, 2014.
|
|
27
|
Kato H, Karube K, Yamamoto K, Takizawa J,
Tsuzuki S, Yatabe Y, Kanda T, Katayama M, Ozawa Y, Ishitsuka K, et
al: Gene expression profiling of Epstein-Barr virus-positive
diffuse large B-cell lymphoma of the elderly reveals alterations of
characteristic oncogenetic pathways. Cancer Sci. 105:537–544.
2014.PubMed/NCBI View Article : Google Scholar
|
|
28
|
Carter KL, Cahir-McFarland E and Kieff E:
Epstein-barr virus-induced changes in B-lymphocyte gene expression.
J Virol. 76:10427–10436. 2002.PubMed/NCBI View Article : Google Scholar
|
|
29
|
Mrozek-Gorska P, Buschle A, Pich D,
Schwarzmayr T, Fechtner R, Scialdone A and Hammerschmidt W:
Epstein-Barr virus reprograms human B lymphocytes immediately in
the prelatent phase of infection. Proc Natl Acad Sci USA.
116:16046–16055. 2019.PubMed/NCBI View Article : Google Scholar
|
|
30
|
Wasil LR and Shair KHY: Epstein-Barr virus
LMP1 induces focal adhesions and epithelial cell migration through
effects on integrin-α5 and N-cadherin. Oncogenesis. 4:e171.
2015.PubMed/NCBI View Article : Google Scholar
|
|
31
|
Chesnokova LS, Nishimura SL and
Hutt-Fletcher LM: Fusion of epithelial cells by Epstein-Barr virus
proteins is triggered by binding of viral glycoproteins gHgL to
integrins αvβ6 or αvβ8. Proc Natl Acad Sci USA. 106:20464–20469.
2009.PubMed/NCBI View Article : Google Scholar
|
|
32
|
Weber GF, Bjerke MA and DeSimone DW:
Integrins and cadherins join forces to form adhesive networks. J
Cell Sci. 124:1183–1193. 2011.PubMed/NCBI View Article : Google Scholar
|
|
33
|
Birdwell CE, Prasai K, Dykes S, Jia Y,
Munroe TGC, Bienkowska-Haba M and Scott RS: Epstein-Barr virus
stably confers an invasive phenotype to epithelial cells through
reprogramming of the WNT pathway. Oncotarget. 9:10417–10435.
2018.PubMed/NCBI View Article : Google Scholar
|
|
34
|
Shackelford J, Maier C and Pagano JS:
Epstein-Barr virus activates beta-catenin in type III latently
infected B lymphocyte lines: Association with deubiquitinating
enzymes. Proc Natl Acad Sci USA. 100:15572–15576. 2003.PubMed/NCBI View Article : Google Scholar
|
|
35
|
Yang CF, Yang GD, Huang TJ, Li R, Chu QQ,
Xu L, Wang MS, Cai MD, Zhong L, Wei HJ, et al: EB-virus latent
membrane protein 1 potentiates the stemness of nasopharyngeal
carcinoma via preferential activation of PI3K/AKT pathway by a
positive feedback loop. Oncogene. 35:3419–3431. 2016.PubMed/NCBI View Article : Google Scholar
|
|
36
|
Sun L, Zhao Y, Shi H, Ma C and Wei L:
LMP-1 induces survivin expression to inhibit cell apoptosis through
the NF-κB and PI3K/Akt signaling pathways in nasal NK/T-cell
lymphoma. Oncol Rep. 33:2253–2260. 2015.PubMed/NCBI View Article : Google Scholar
|
|
37
|
Pei Y, Lewis AE and Robertson ES: Current
progress in EBV-associated B-cell lymphomas. Adv Exp Med Biol.
1018:57–74. 2017.PubMed/NCBI View Article : Google Scholar
|
|
38
|
Sobhani N, D'Angelo A, Pittacolo M,
Roviello G, Miccoli A, Corona SP, Bernocchi O, Generali D and Otto
T: Updates on the CDK4/6 inhibitory strategy and combinations in
breast cancer. Cells. 8(8)2019.PubMed/NCBI View Article : Google Scholar
|
|
39
|
Wong CH, Ma BBY, Hui CWC, Lo KW, Hui EP
and Chan ATC: Preclinical evaluation of ribociclib and its
synergistic effect in combination with alpelisib in
non-keratinizing nasopharyngeal carcinoma. Sci Rep.
8(8010)2018.PubMed/NCBI View Article : Google Scholar
|
|
40
|
Chen F, Shen C, Wang X, Wang H, Liu Y, Yu
C, Lv J, He J and Wen Z: Identification of genes and pathways in
nasopharyngeal carcinoma by bioinformatics analysis. Oncotarget.
8:63738–63749. 2017.PubMed/NCBI View Article : Google Scholar
|
|
41
|
Yang H, Zhang X, Cai XY, Wen DY, Ye ZH,
Liang L, Zhang L, Wang HL, Chen G and Feng ZB: From big data to
diagnosis and prognosis: Gene expression signatures in liver
hepatocellular carcinoma. PeerJ. 5(e3089)2017.PubMed/NCBI View Article : Google Scholar
|
|
42
|
Chujan S, Suriyo T, Ungtrakul T, Pomyen Y
and Satayavivad J: Potential candidate treatment agents for
targeting of cholangiocarcinoma identified by gene expression
profile analysis. Biomed Rep. 9:42–52. 2018.PubMed/NCBI View Article : Google Scholar
|