Introduction
Bladder cancer (BC) is the second most frequently
occurring urinary system tumor and the mortality rate of BC is
gradually increasing worldwide (1,2). The
main risk factors for this cancer type include tobacco smoking and
exposure to certain chemicals in the workplace and in the general
environment (3-5).
However, little is known about the molecular mechanisms underlying
BC. Increasing evidence suggests that the occurrence and
development of BC is related to gene mutations and abnormal gene
expression. Studies have indicated that oxidative stress has an
important role in BC (6-8).
In the past decade, numerous BC biomarkers have been identified,
including various tumor suppressor genes, oncogenes, growth
factors, growth factor receptors, hormone receptors, proliferation
and apoptosis markers, cell adhesion molecules, stromal factors and
oncoproteins (9). Due to the lack
of methods available for early diagnosis and the poor understanding
of the molecular mechanisms of the occurrence and development of
BC, patients are generally diagnosed when at advanced BC stages.
Therefore, research on the molecular mechanisms of the occurrence
and development of BC is particularly important to allow for early
diagnosis and to provide early treatment interventions.
In recent years, microarray technology has been
widely used in studies related to gene expression. Its application
complements the methods of gene expression studies and strengthens
research on disease susceptibility and disease pathology. After
detecting the differences in gene expression, the next step is to
find the biological functions of these differences and use
bioinformatics analysis to screen for gene changes at the genomic
level, so as to identify differentially expressed genes (DEG) and
functional pathways involved in the occurrence and development of
liver cancer. However, the analysis of a single microarray data set
has limitations, and its results require to be further verified.
Therefore, in the present study, following the method of Li et
al (10) from 2017, gene chip
datasets in the comprehensive gene expression omnibus (GEO)
database were analyzed, common DEGs from the intersection of the
two data sets were identified through a Venn diagram, and they were
subjected to Gene Ontology (GO) and Kyoto Encyclopedia of Genes and
Genomes (KEGG) analysis. The results provide a theoretical basis
for further study of the molecular mechanisms of BC.
In the present study, the expression of BC-related
genes and their impact on progression, malignancy and prognosis
were examined. Through the analysis of two mRNA microarray data
sets, a total of 362 DEGs, comprising 315 upregulated and 47
downregulated DEGs, were identified. Subsequently, 13 central genes
were identified by using the Cancer Genome Atlas (TCGA) database
and protein-protein interaction (PPI) network analysis. In
conclusion, 362 DEGs and 13 hub genes were identified. Through
various software analyses, it was indicated that these genes may be
candidate biomarkers of BC. Among these hub genes, platelet-derived
growth factor receptor α (PDGFRA) had the highest degree of
connectivity.
Materials and methods
Screening of DEGs of BC in the GEO
database
GEO (http://www.ncbi.nlm.nih.gov/geo) (11) is a global database of diseases,
which contains a large amount of genomic data. The
GSE38264(12) and GSE61615(13) gene chip data sets were downloaded
from GEO (Affymetrix GPL570 platform; Affymetrix human genome U133
Plus 2.0 array). The gene chip was annotated using the DAVID
website (http://david.ncifcrf.gov) (14). Overall, the GSE38264 dataset
contains 28 BC tissue samples and 10 non-cancer samples, while the
GSE6165 dataset contains two BC samples and two non-cancer
samples.
Identification of DEGs
GEO2R (https://www.ncbi.nlm.nih.gov/geo/geo2r/) was used to
screen DEGs between BC and non-cancerous samples. GEO2R is an
interactive network tool that allows users to compare two or more
datasets in the GEO series (15).
It may be used to analyze the online analysis tools of GSE38264 and
GSE6165; |log fold change| >1.5 and P<0.001 were selected as
cut-off criteria (16).
KEGG and GO enrichment analyses of
DEGs
DAVID (http://david.ncifcrf.gov; version 6.8) (14) is an online bioinformatics database
used to analyze gene function through GO and also allows for the
identification of gene-related pathways using KEGG analysis
(17). In order to further explore
the biological processes and signaling pathways of these DEGs,
functional analysis was performed (18). GO collects information about
molecular function, biological process and cellular composition.
KEGG pathway analysis is used to mine significant pathways related
to DEGs and has prognostic significance. GO and KEGG are executed
by the R package of clusterprofiler (19). A false discovery rate <0.05 was
considered to indicate statistical significance.
Construction of the PPI network and
analysis of modules
The STRING database, an online resource dedicated to
organism-wide protein association networks (20), was used to construct the PPI network
to provide an analysis of the functional interactions between
proteins indicative of the underlying mechanisms of disease
generation or development. The DEGs were analyzed using STRING by
downloading data from the protein interaction network and the PPI
of DEGs was constructed using Cytoscape (version 3.7.2), an open
bioinformatics software platform used to construct a visualized
protein interaction network (21).
Cytoscape's plug-in molecular complex detection (Mcode) (version
2.0.0) was used to cluster a given network based on topology to
find densely connected areas (22).
Cytoscape was used to draw a PPI network and Mcode was used to
identify the most important modules in the PPI network.
Retrieval of BC patient information
from TCGA database
TCGA clinical data were downloaded from the Genomic
Data Commons data portal (https://portal.gdc.cancer.gov/) (23). The clinical information of 412
patients with BC (anonymized) was downloaded from the TCGA database
and the association between the hub gene and tumor stages was
analyzed using R software for data exploration, statistical
analysis and mapping (24).
Selection and analysis of hub
genes
The plug-in biological network ontology tool (Bingo)
(version 3.0.3) in Cytoscape was used to analyze the hub gene and
visualize its biological processes (25). Using the National Center for
Biotechnology Information (NCBI) genomics browser (https://www.ncbi.nlm.nih.gov/), a functional
clustering of central genes was constructed (26). Kaplan-Meier plotter was used to
analyze overall survival and disease-free survival associated with
the expression of central genes. Using the Oncomine online database
(http://www.oncomine.com) (27-29),
the importance of key genes in other BC datasets was analyzed. The
hierarchical clustering of central genes was performed using the
University of California Santa Cruz Website (http://genome.ucsc.edu/).
Patients
Tumor and normal tissue samples were provided by
three patients with squamous cell carcinoma of the bladder. In
March 2022, three male patients aged 57, 54 and 59 years were
hospitalized at the First Affiliated Hospital of Xinjiang Medical
University (Urumqi, China), all from Xinjiang, China. All 3
patients had painless and complete hematuria.
Differential expression of hub genes
in patients by reverse transcription-quantitative (RT-q)PCR
The total RNA in the sample to be tested was
extracted with TRIzol (Thermo Fisher Scientific, Inc.) and the
purity and concentration of RNA were detected by a
spectrophotometer. RNA was reverse transcribed into cDNA with an RT
kit (Thermo Fisher Scientific, Inc.) according to the
manufacturer's instructions. Real-time qPCR was performed with SYBR
green real-time PCR reagent (Thermo Fisher Scientific, Inc.)
according to the manufacturer's instructions and the reaction time
and temperature had been determined in a preliminary experiment.
The PCR amplification conditions were as follows: Initial
denaturation at 95˚C for 5 min, followed by 40 times cycles of 95˚C
for 10 sec, 58˚C for 20 sec and 72˚C for 30 sec. GAPDH was used as
the internal reference and the relative mRNA expression level of
the gene to be tested was analyzed using the 2-∆∆Cq
method (30). Primers used for
detection of gene expression are listed in Table I.
 | Table IPrimer sequences. |
Table I
Primer sequences.
| Gene/direction | Primer sequence
(5'-3') |
|---|
| GAPDH | |
|
Forward |
TGCACCACCAACTGCTTAGC |
|
Reverse |
GGCATGGACTGTGGTCATGAG |
| KLRD1 | |
|
Forward |
GTGAACAGAAAACTTGGAACGA |
|
Reverse |
ATAGATACTGGGAGAGTGCAGA |
| MT1X | |
|
Forward |
CCTGCAAGAAGAGCTGCTGC |
|
Reverse |
GCAGCTGCACTTGTCTGACG |
| PDGFRA | |
|
Forward |
GAAAATGAAAAGGTTGTGCAGC |
|
Reverse |
CTCTTCTTCAGACATGGGGTAC |
| PTPRC | |
|
Forward |
AAGTGCGGAAACAGAAGAGGTAGTG |
|
Reverse |
CAGGGTAGGTGCTGGCAATGAC |
| TGFBI | |
|
Forward |
ACTCAGCCAAGACACTATTTGA |
|
Reverse |
CTTGTATGGGCATCAATTGGAG |
Immunohistochemical detection of
transforming growth factor (TGF) β-induced (TGFBI) expression in
BC
Paraffin-embedded tissues were sliced and dewaxed
(10 min for xylene I/II; 5 min for 100% ethanol I/II; 10 sec for
95, 90, 85 and 75% ethanol. They were incubated with 3%
H2O2 for 5-10 min at room temperature to
eliminate the activity of endogenous peroxidase. Following rinsing
with distilled water, they were soaked in PBS for 5 min, blocked
with 5-10% normal goat serum (Shanghai Suolaibao Biological Co.) in
PBS at room temperature for 10 min and the serum was drained off.
The primary antibody to TGFBI (cat. no. PA5-82358; Thermo Fisher
Scientific, Inc.) working solution (diluted with PBS at 1:200) was
added dropwise and incubated at 4˚C overnight. After washing with
PBS, an appropriate amount of biotin-labeled secondary antibody
conjugated to HRP (cat. no. A-11001; Thermo Fisher Scientific,
Inc.) working solution was added and samples were incubated at 37˚C
for 30 min. Following washing with PBS for 5 min, an appropriate
amount of horseradish enzyme (Shanghai Suolaibao Biological Co.)
working solution was added with incubation at 37˚C for 10-30 min.
Samples were washed with PBS for 5 min and the chromogenic agent
diaminobenzidine was added for 3-15 min. Samples were fully rinsed
with tap water, re-dyed with hematoxylin, dehydrated, cleared with
xylene and sealed with neutral balsam. Slides were then observed
under an inverted microscope (WMJ-9590; Nikon Corporation).
H&E staining of BC sections
Paraffin sections are dewaxed and rehydrated as
follows: They dewaxed with xylene and rehydrated with an ethanol
gradient and then distilled water. Hematoxylin was then used to
stain the nuclei: The slices were stained with Harris hematoxylin
for 3-8 min, washed with tap water, differentiated with 1%
hydrochloric acid alcohol for several seconds, washed with tap
water, turned back to blue with 0.6% ammonia and washed with
running water. The sections were then stained with eosin for 1-3
min. Subsequently, the samples were dehydrated with an ethanol
gradient, cleared with xylene. The slices were then slightly dried
and sealed with neutral balsam, followed by observation under a
microscope.
Statistical analysis
Statistical analysis was performed using R software
(4.1.0) and GraphPad (version 8.0; GraphPad Software, Inc.). All
data were expressed as the mean ± standard deviation and
statistical analysis among different groups was performed by SPSS
24.0 software (IBM Corporation). Differences between groups were
evaluated using one-way ANOVA with Tukey's post-hoc test. P<0.05
was considered to indicate a statistically significant
difference.
Results
Identification of DEGs in BC
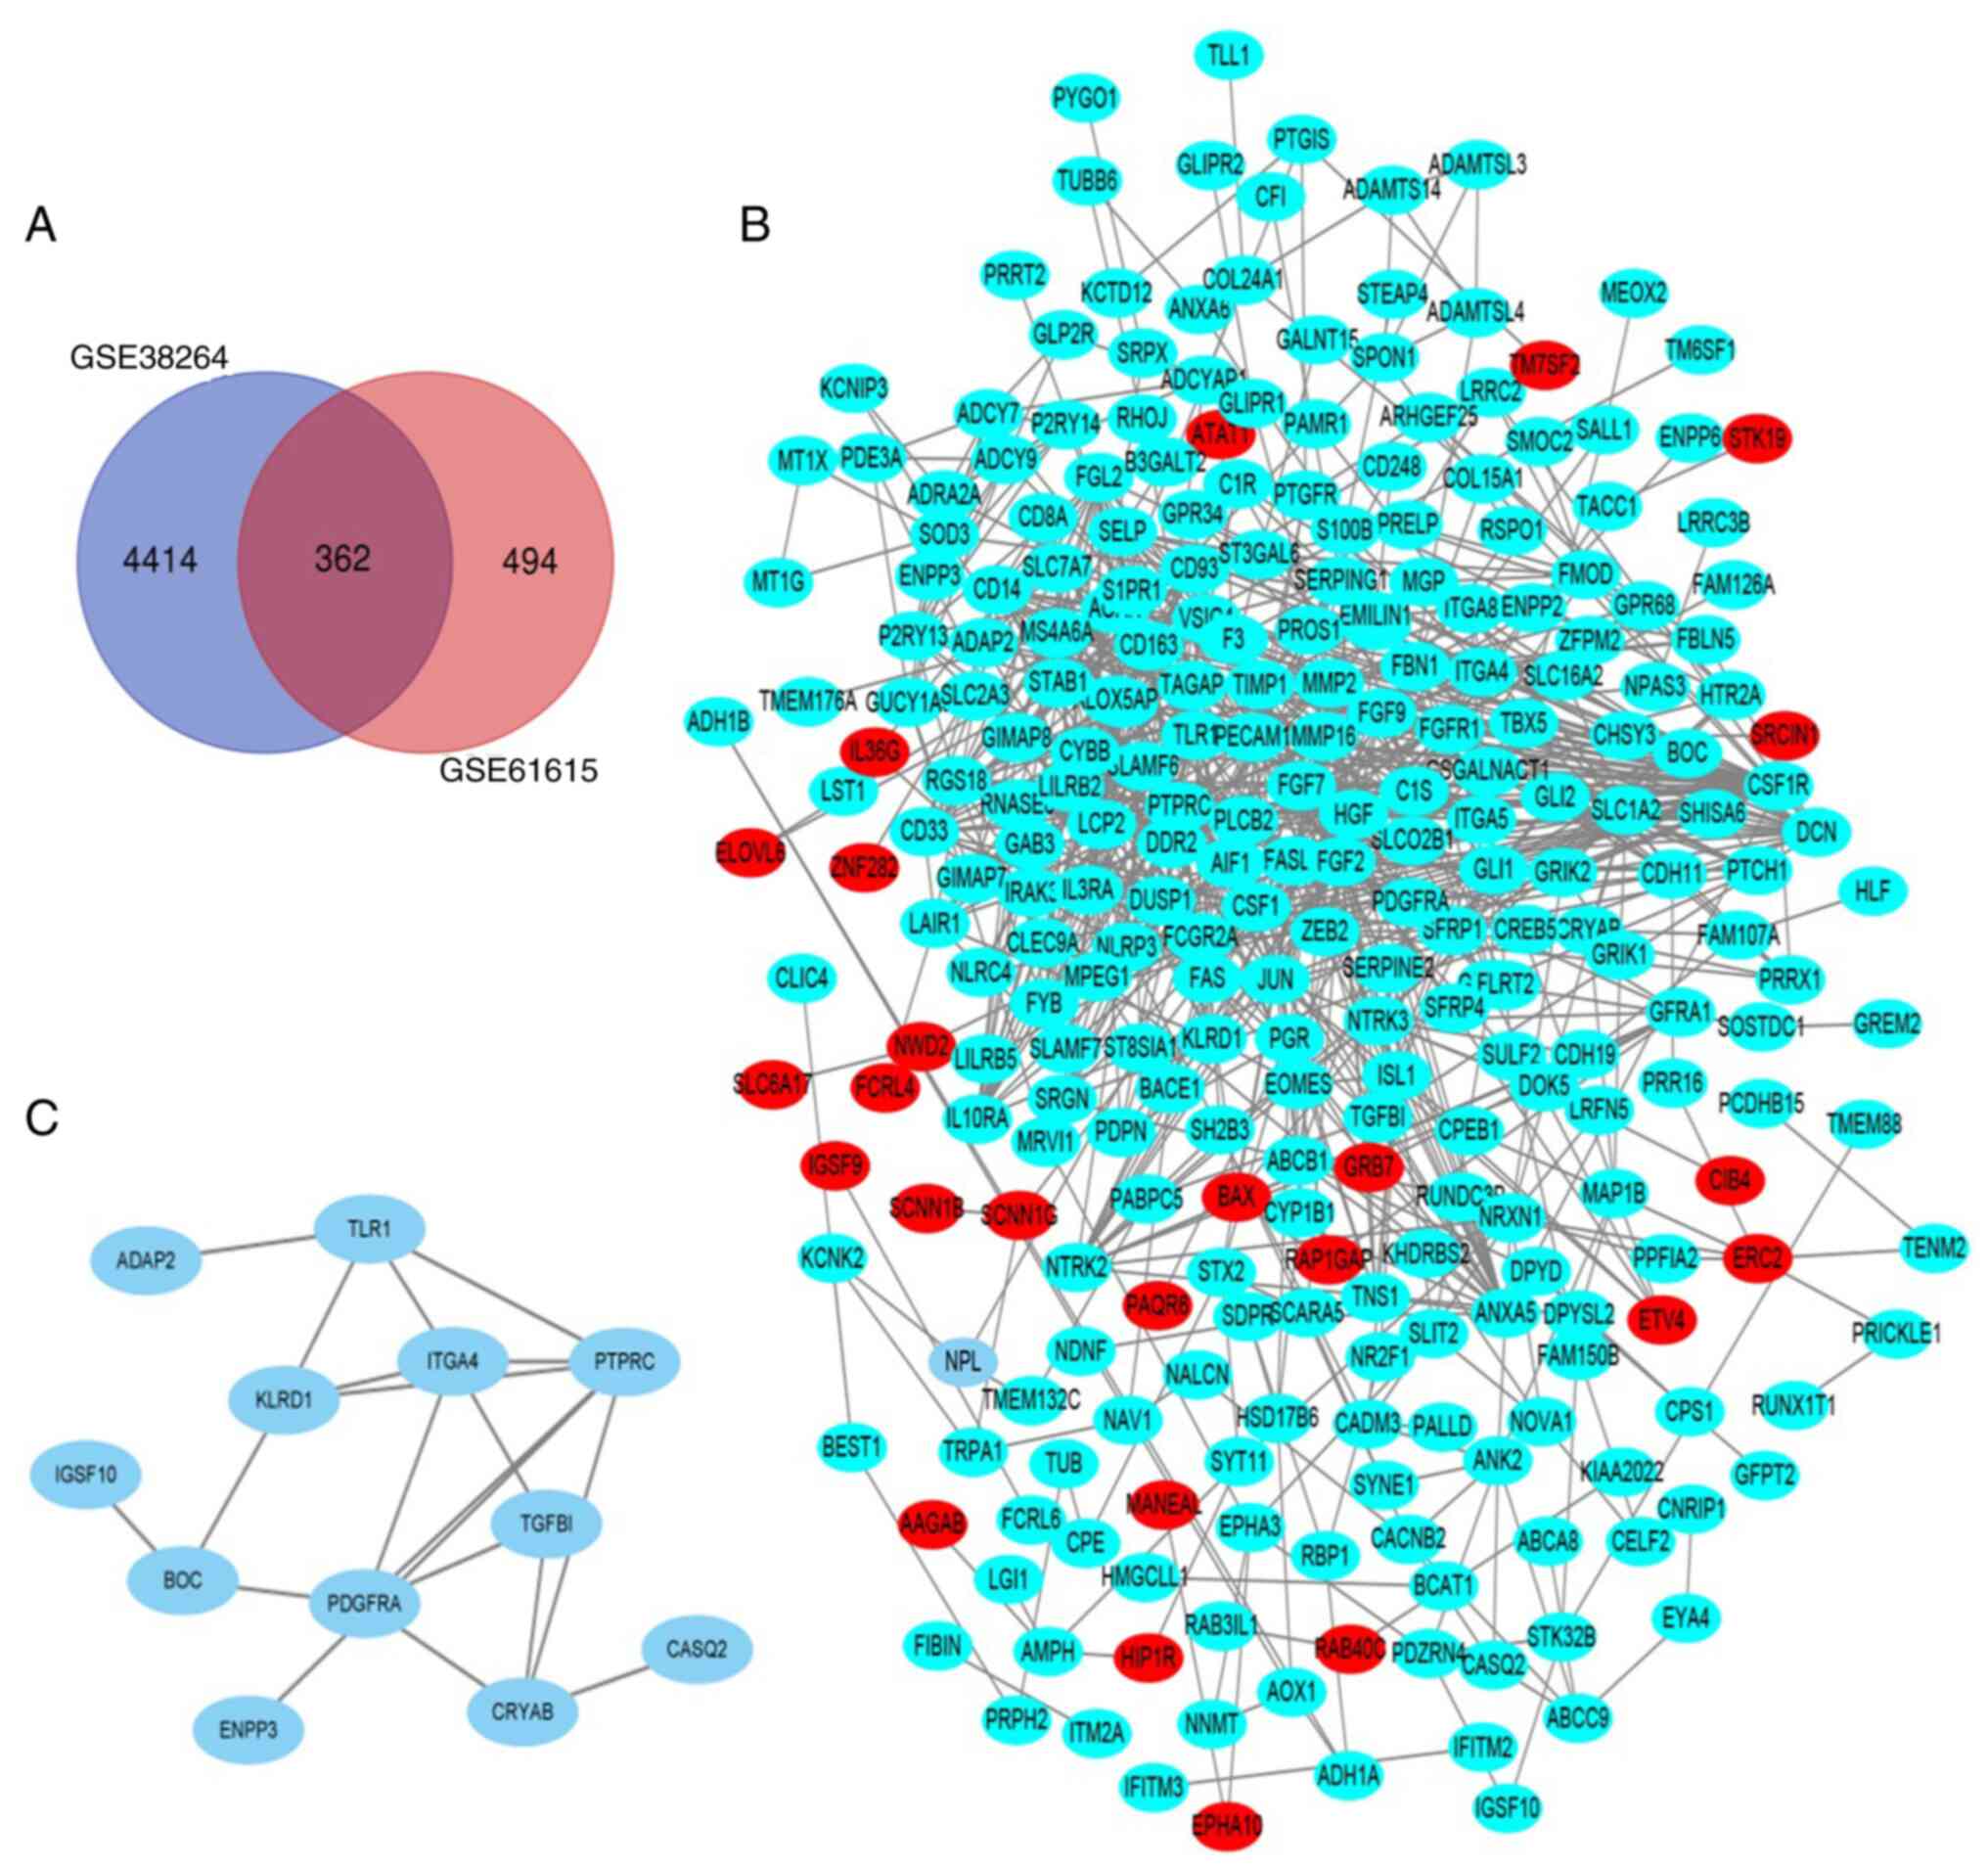
After standardizing gene expression values in the
GeneChip datasets GSE38264 and GSE6165, 4,414 and 494 DEGs were
screened, respectively. As indicated in the Venn diagram (Fig. 1A), the overlap between the two
datasets contained 362 genes.
KEGG and GO enrichment analyses of
DEGs
The DEGs were analyzed using functional analysis
with the Web tool DAVID. GO analysis indicated that the changes in
the category molecular function mainly included heparin binding,
calcium ion binding, protein homodimerization activity, scavenger
receptor activity and sequence-specific DNA binding (Table II). The enriched biological process
terms of the DEGs were extracellular matrix organization, positive
regulation of cell proliferation, angiogenesis and
peptidyl-tyrosine phosphorylation (Table II). In the category cellular
component, the DEGs were mainly concentrated in the integral
component of the plasma membrane, the plasma membrane, the
extracellular region and the integral component of the membrane
(Table II). KEGG pathway analysis
suggested that the DEGs were mainly enriched in the Rap1 signaling
pathway, pathways in cancer, the PI3K-Akt signaling pathway,
proteoglycans in cancer and the MAPK signaling pathway.
| Table IIGO and KEGG pathway enrichment
analysis of DEGs in BC samples. |
Table II
GO and KEGG pathway enrichment
analysis of DEGs in BC samples.
| A, GO |
|---|
| Term | Description | Count in gene
set | P-value |
|---|
| GO:0030198 | Extracellular
matrix organization | 17 |
1.01x10⁻⁶ |
| GO:0008284 | Positive regulation
of cell proliferation | 24 |
2.81x10⁻⁵ |
| GO:0001525 | Angiogenesis | 15 |
9.06x10⁻⁵ |
| GO:0018108 | Peptidyl-tyrosine
phosphorylation | 12 |
1.58x10⁻⁴ |
| GO:0008201 | Heparin
binding | 18 |
6.71x10⁻⁹ |
| GO:0005509 | Calcium ion
binding | 36 |
1.50x10⁻⁷ |
| GO:0042803 | Protein
homodimerization activity | 29 |
2.09x10⁻⁴ |
| GO:0005044 | Scavenger receptor
activity | 6 |
1.84x10⁻³ |
| GO:0043565 | Sequence-specific
DNA binding | 17 |
3.11x10⁻² |
| GO:0005887 | Integral component
of plasma membrane | 61 |
2.29x10⁻⁹ |
| GO:0005886 | Plasma
membrane | 125 |
8.24x10⁻⁹ |
| GO:0005576 | Extracellular
region | 61 |
2.42x10⁻⁷ |
| GO:0016021 | Integral component
of membrane | 142 |
2.48x10⁻⁷ |
| B, KEGG |
| Term | Description | Count in gene
set | P-value |
| Hsa04015 | Rapl signaling
pathway | 14 |
3.24x10⁻⁴ |
| Hsa05200 | Pathways in
cancer | 19 |
9.61x10⁻⁴ |
| Hsa04151 | PI3K-Akt signaling
pathway | 15 |
1.02x10⁻² |
| Hsa05205 | Proteoglycans in
cancer | 10 |
2.05x10⁻² |
| Hsa04010 | MAPK signaling
pathway | 12 |
1.38x10⁻² |
Construction of the PPI network and
analysis of the modules
Cytoscape was used to construct a PPI network of the
different DEGs (Fig. 1B) and the
most important module was obtained from the PPI network with 12
nodes (Fig. 1C). DAVID was used to
analyze the most important module genes in Cellular Component and
it was indicated that these genes were mainly plasma membrane and
membrane components (Table
III).
| Table IIIGO pathway enrichment analysis of
differentially expressed genes in the most significant module. |
Table III
GO pathway enrichment analysis of
differentially expressed genes in the most significant module.
| Pathway ID | Pathway
description | Count in gene
set | P-value |
|---|
| GO:1990405 | Protein antigen
binding | 2 | 0.003254 |
| GO:0005886 | Plasma
membrane | 8 | 0.008012 |
| GO:0005515 | Protein
binding | 11 | 0.008428 |
| GO:0005887 | Integral component
of plasma membrane | 5 | 0.010799 |
| GO:0046872 | Metal ion
binding | 5 | 0.036499 |
| GO:0007155 | Cell adhesion | 3 | 0.041053 |
| GO:0009986 | Cell surface | 3 | 0.047841 |
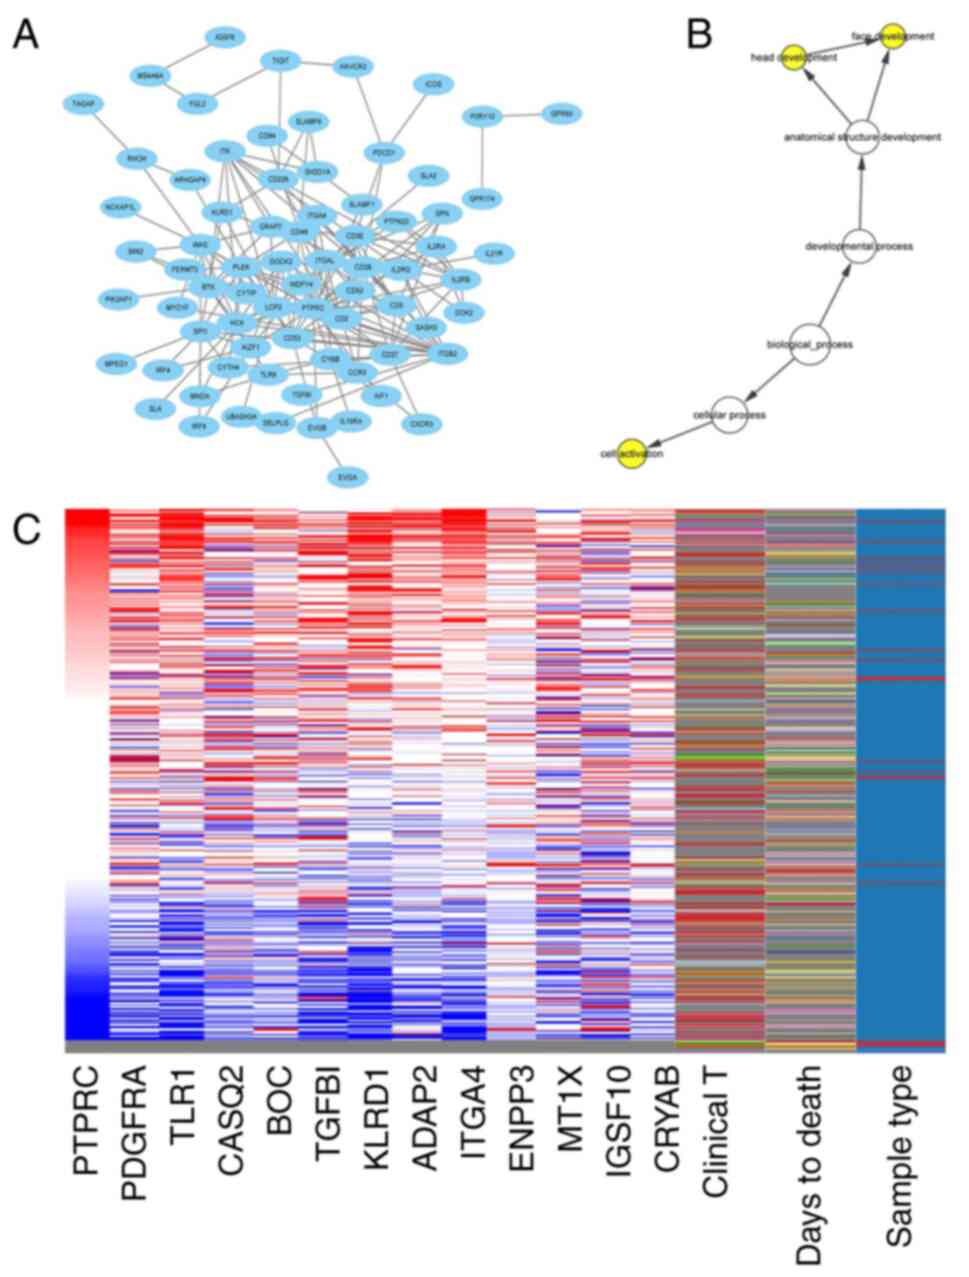
Selection and analysis of hub
genes
Using Cytoscape Mcode, a total of 13 hub genes were
selected. These 13 genes are listed in Table IV. The PPI network of the hub gene
PDGFRA and its co-expressed genes was constructed using Cytoscape
(Fig. 2A). The biological processes
of the hub gene and its co-expressed genes are presented in
Fig. 2B. Hierarchical cluster
analysis revealed that the hub gene was able to distinguish liver
cancer samples from noncancer samples (Fig. 2C). Kaplan-Meier curves were used to
analyze the survival rate of the hub genes. It was indicated that
patients with BC with higher expression of PDGFRA, Toll-like
receptor (TLR)1, CASQ2, BOC, TGFBI, KLRD1, ADAP2, ITGA4, ENPP3,
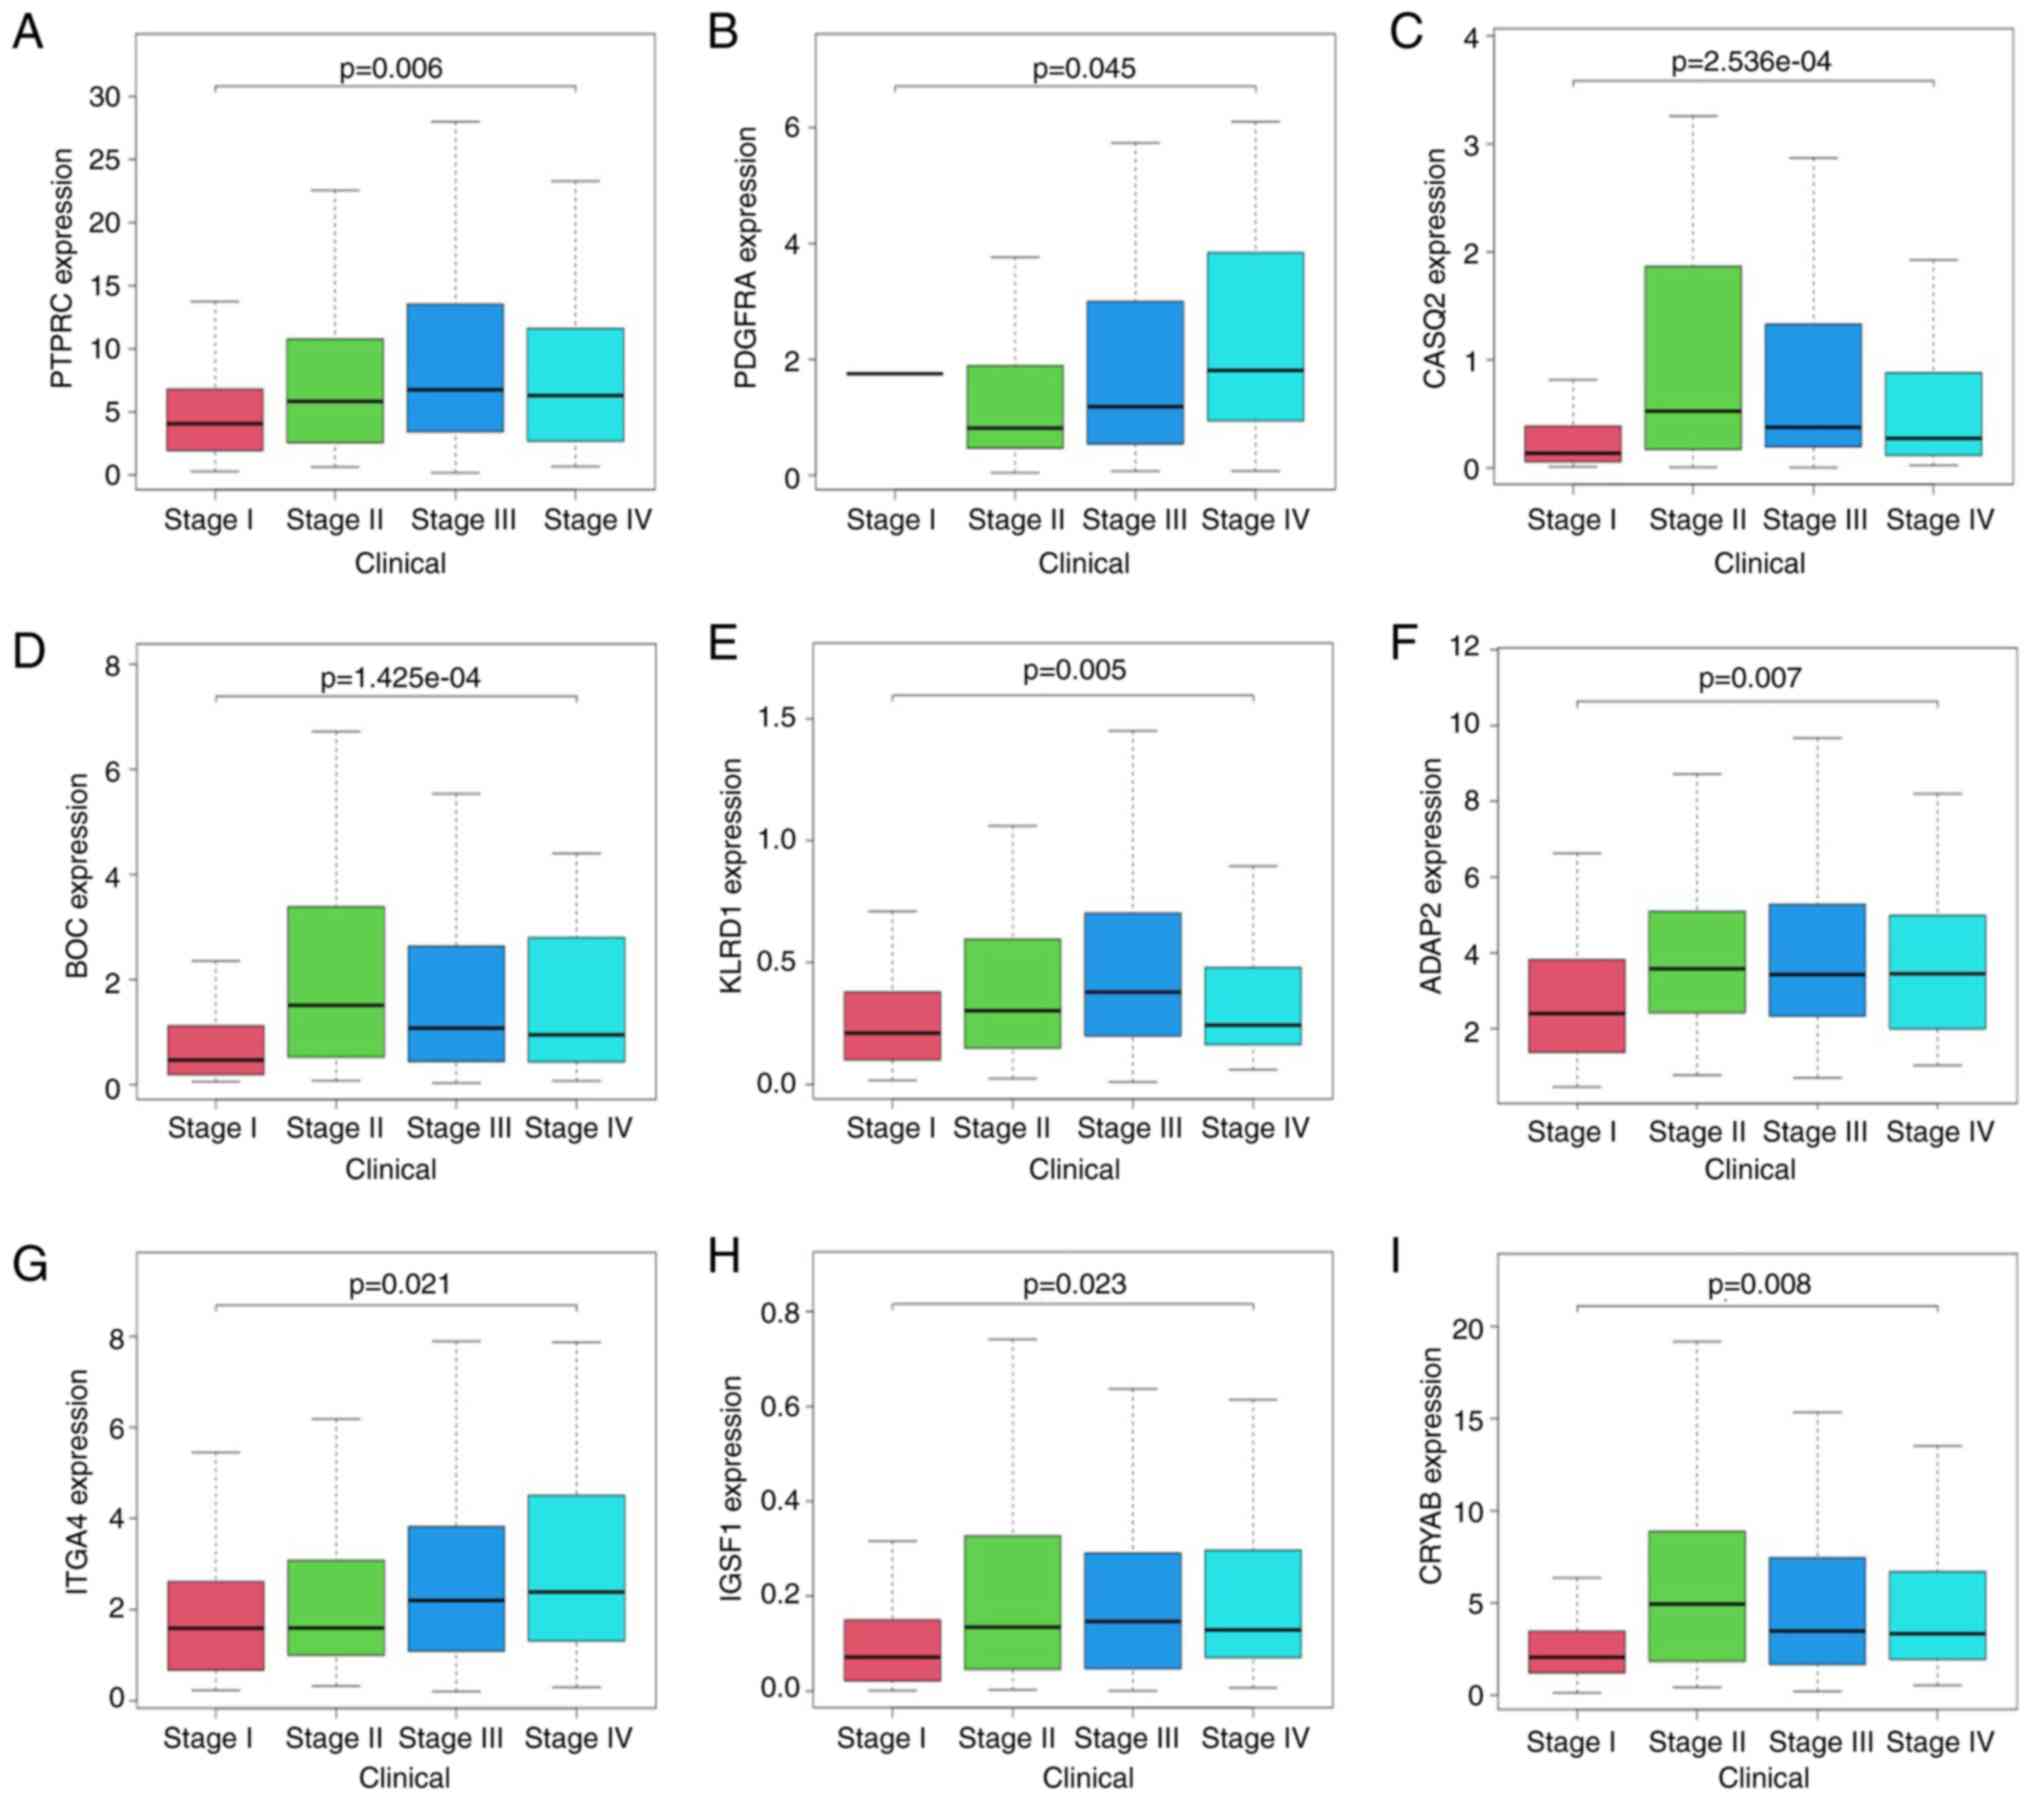
MT1X, IGSF10 and CRYAB had poor overall survival (Fig. 3). PTPRC, PDGFRA, CASQ2, TGFBI, KLRD1
and MT1X were significantly correlated with BC in different BC
datasets (Fig. 4A-F). In the TCGA
clinical database of patients with BC, PTPRC, PDGFRA, CASQ2, BOC,
KLRD1, ADAP2, ITGA4, IGSF1 and CRYAB mRNA levels were associated
with tumor grade (Fig. 5A-I).
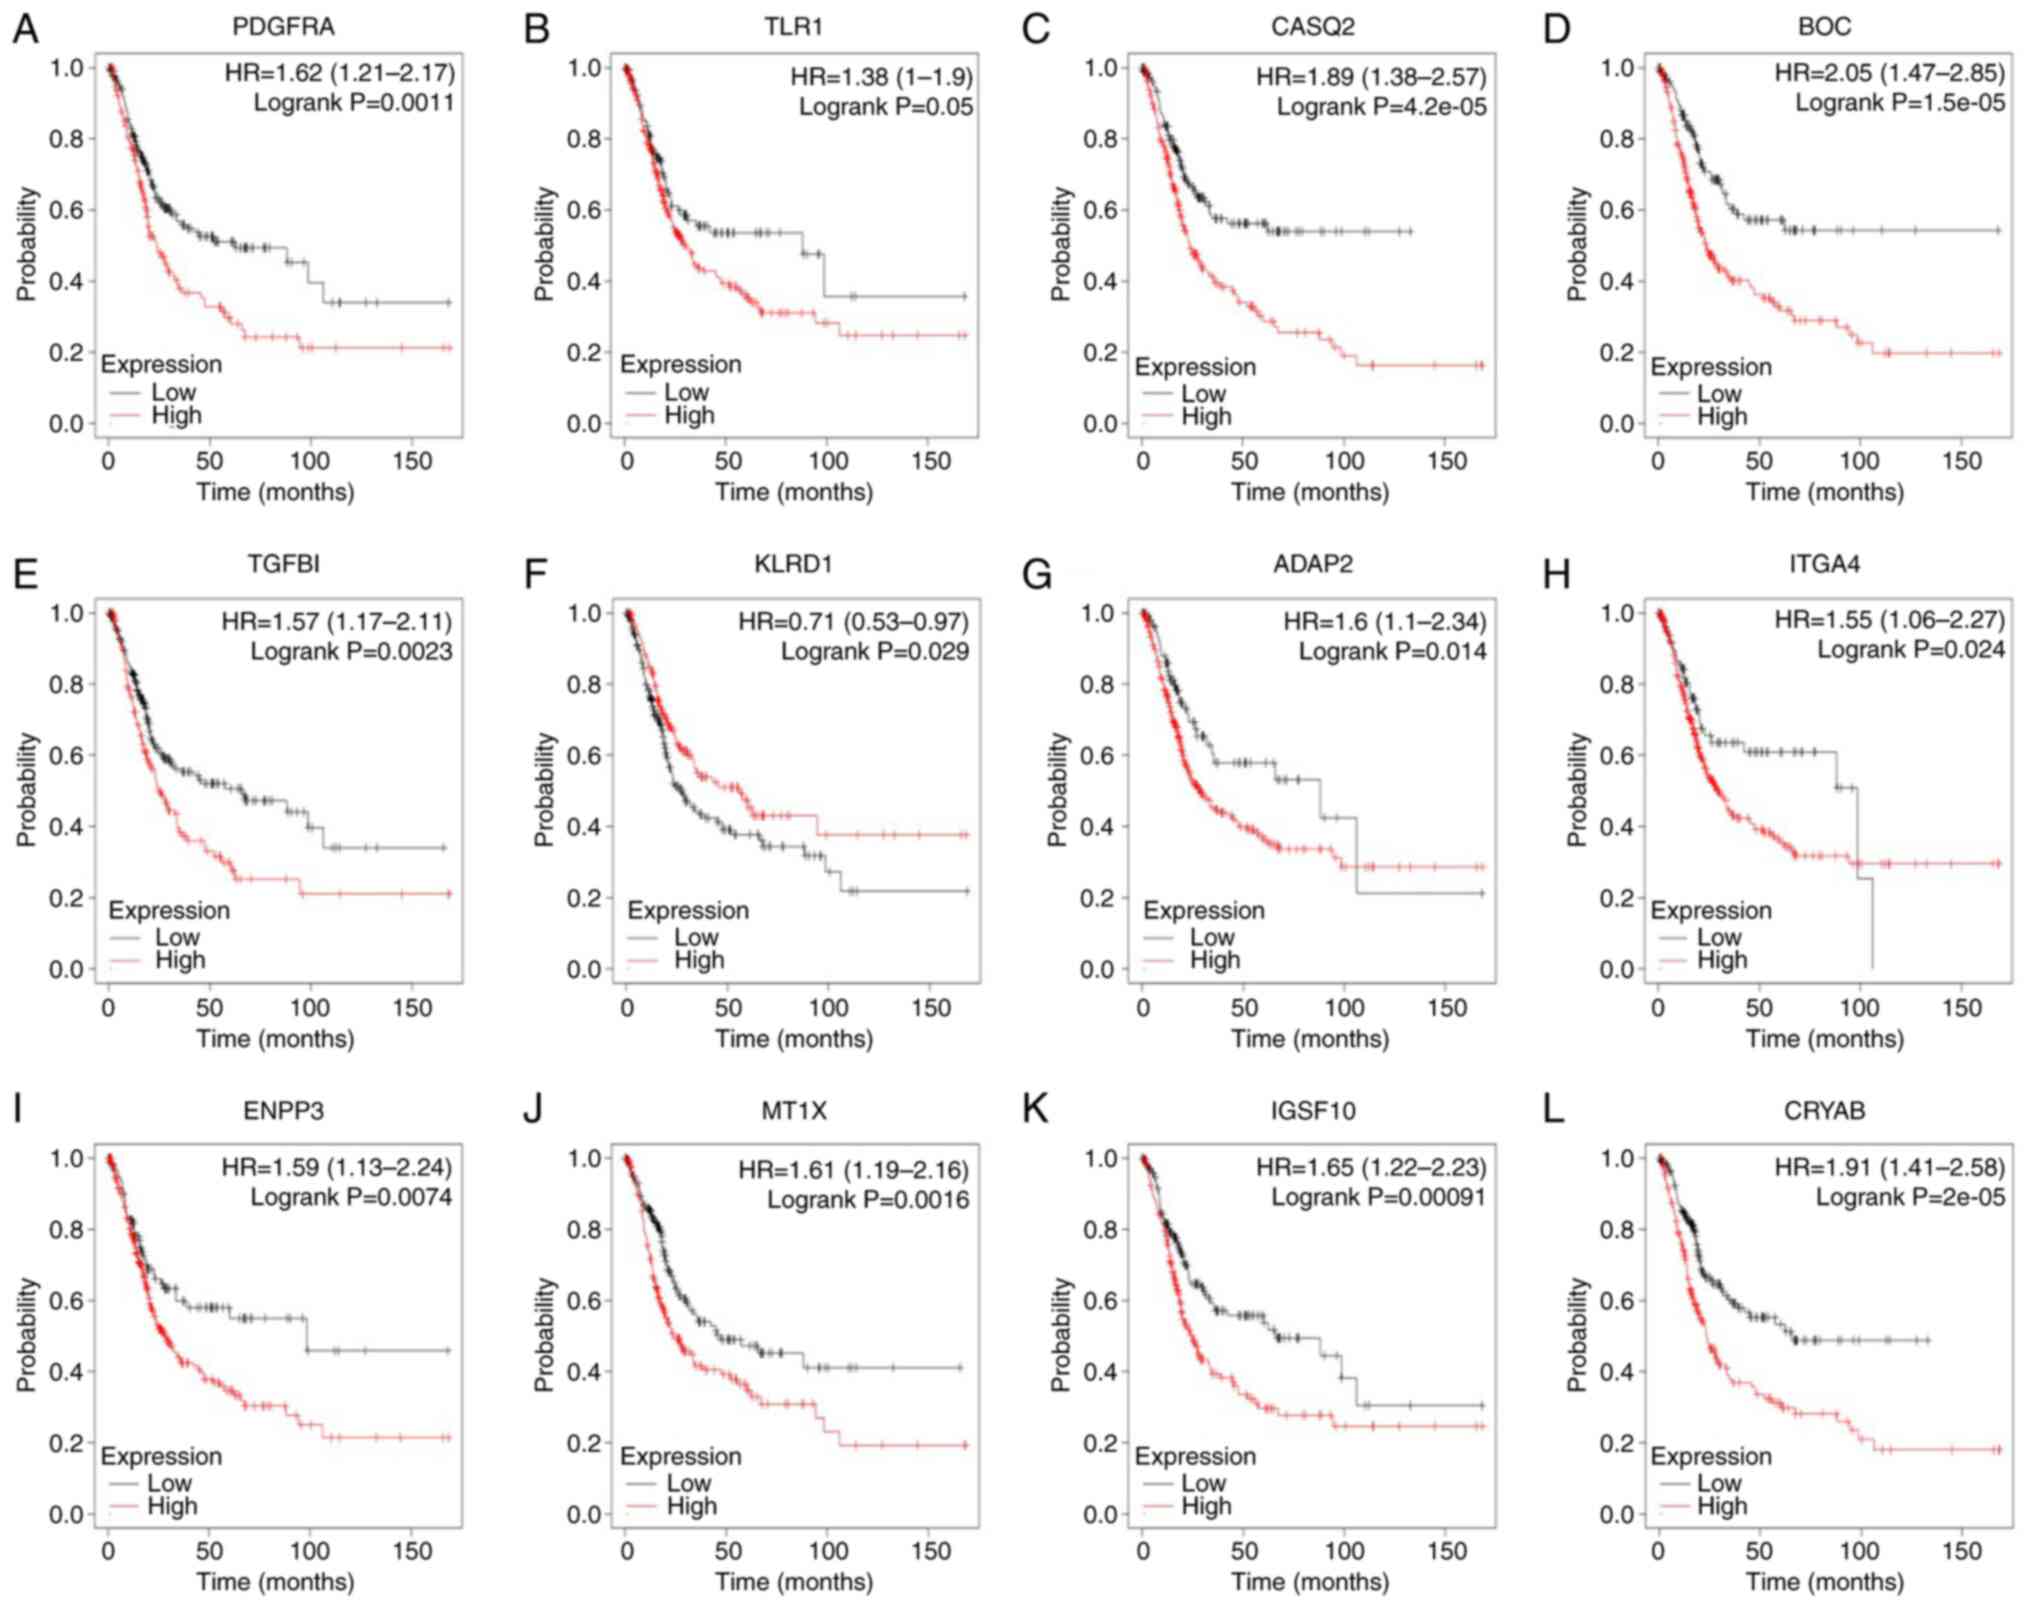 | Figure 3Kaplan-Meier plotter online platform
was used to analyze overall survival associated with central genes.
P<0.05 was considered statistically significant. Survival
analysis for (A) PDGFRA, (B) TLR1, (C) CASQ2, (D) BOC, (E) TGFBI,
(F) KLRD1, (G) ADAP2, (H) ITGA4, (I) ENPP3, (J) MT1X, (K) IGSF10
and (L) CRYAB in bladder cancer. HR, hazard ratio (presented with
95% CI). |
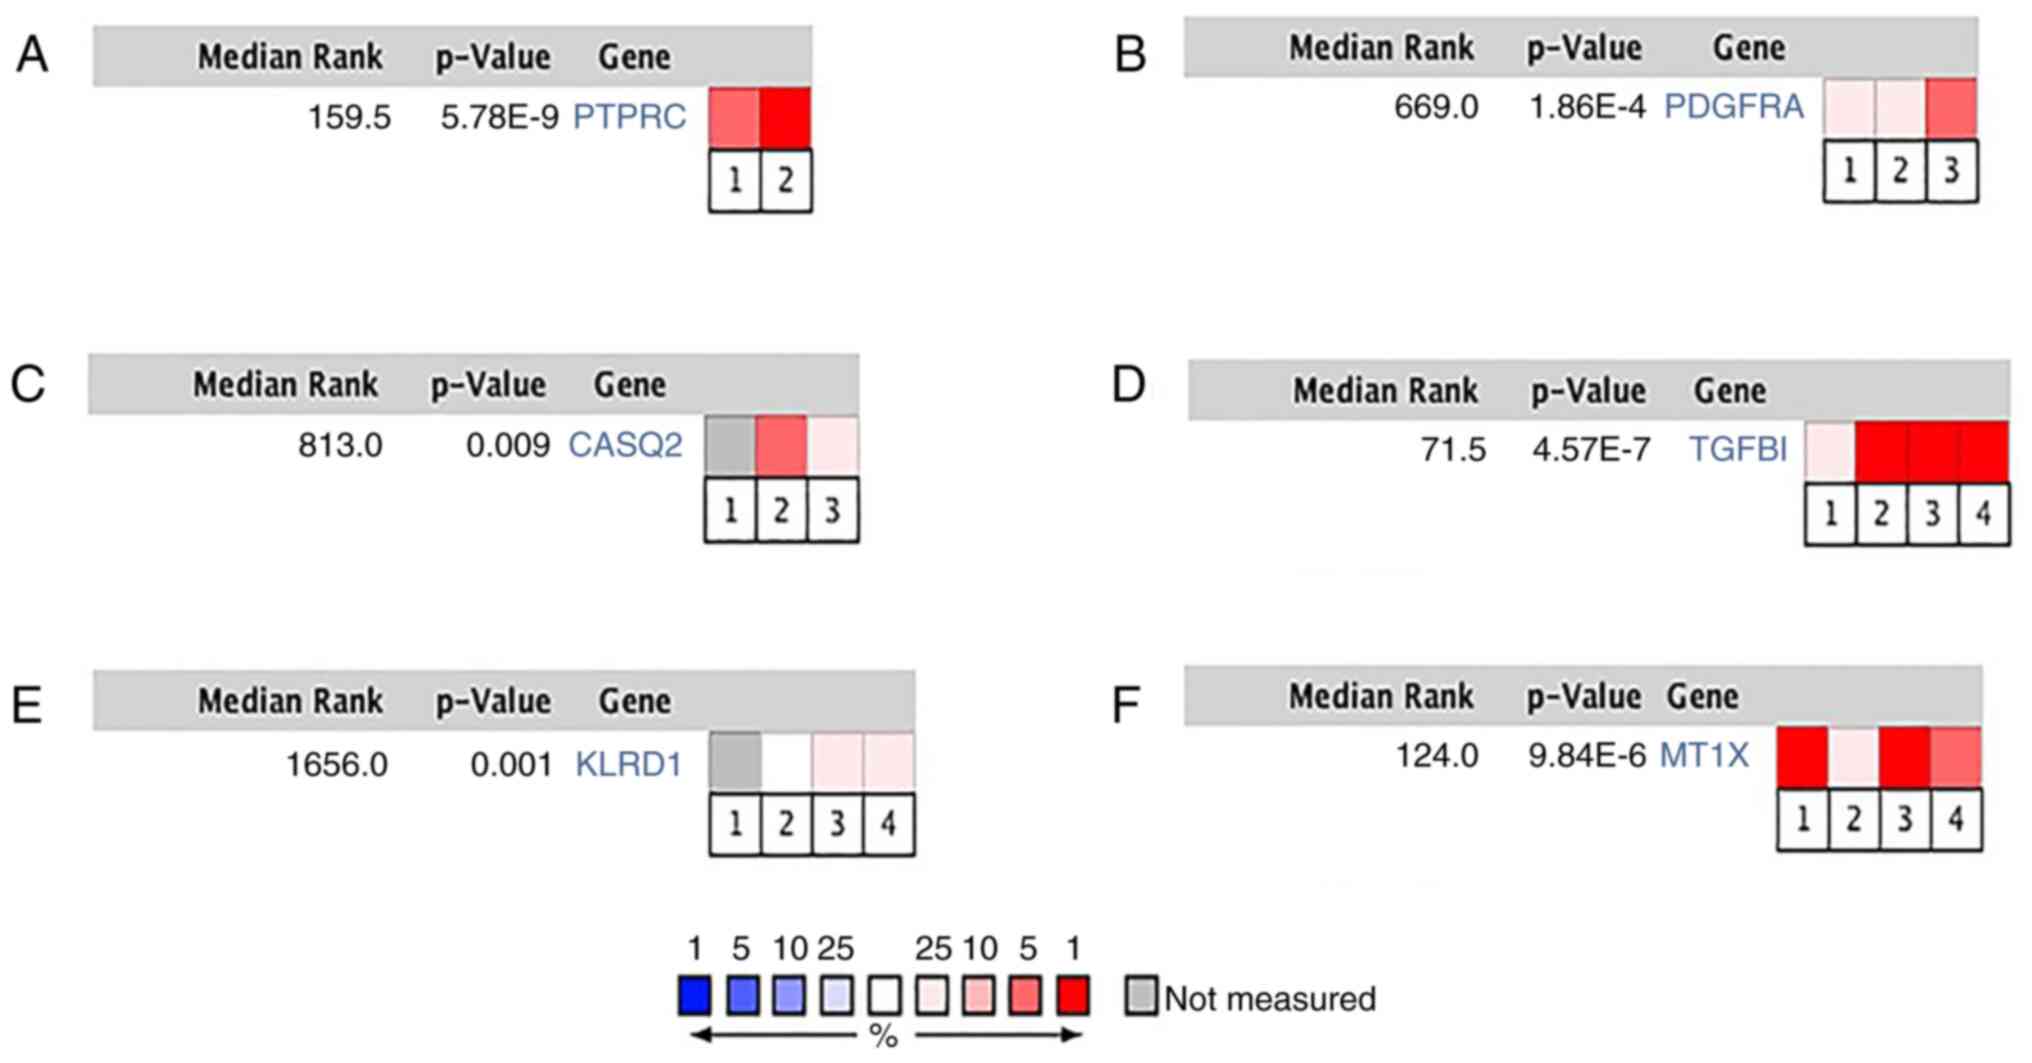 | Figure 4Hub gene expression in Blaveri
Bladder, Dyrskjot Bladder, Sanchez-Carbayo Bladder and Stransky
bladder datasets. (A) PTPRC in Blaveri Bladder and Sanchez-Carbayo
Bladder datasets, (B) PDGFRA in Blaveri Bladder, Sanchez-Carbayo
Bladder and Stransky bladder datasets, (C) CASQ2 in Blaveri
Bladder, Sanchez-Carbayo Bladder and Stransky bladder datasets, (D)
TGFBI in Blaveri Bladder, Dyrskjot Bladder, Sanchez-Carbayo Bladder
and Stransky bladder datasets, (E) KLRD1 in Blaveri Bladder,
Dyrskjot Bladder, Sanchez-Carbayo Bladder and Stransky bladder
datasets, (F) MT1X in Blaveri Bladder, Dyrskjot Bladder,
Sanchez-Carbayo Bladder and Stransky bladder datasets. Heat maps of
PTPRC, PDGFRA, CASQ2, TGFBI, KLRD1 and MT1X gene expression in
clinical bladder cancer samples vs. normal tissues. P<0.05 was
considered statistically significant. 1-4 in the figure are
respectively quoted from refs. 69-72. Data source cited in
figure. |
| Table IVFunctional roles of 13 hub genes with
degree ≥10. |
Table IV
Functional roles of 13 hub genes with
degree ≥10.
| Gene symbol | Full name | Function |
|---|
| PTPRC | Protein tyrosine
phosphatase receptor type C | Essential regulator
of T- and B-cell antigen receptor signaling |
| PDGFRA | Platelet-derived
growth factor receptor α | Mutations in this
gene have been associated with idiopathic hypereosinophilic
syndrome, somatic and familial gastrointestinal stromal tumors and
a variety of other cancers |
| TLR1 | Toll-like receptor
1 | Associated with
nasopharyngeal cancer |
| CASQ2 | Calsequestrin
2 | Mutations in this
gene cause stress-induced polymorphic ventricular tachycardia |
| BOC | BOC cell
adhesion-associated oncogene regulated | Component of a
cell-surface receptor complex that mediates cell-cell interactions
between muscle precursor cells, and promotes myogenic
differentiation |
| TGFBI | Transforming growth
factor β-induced | Mutations in this
gene are associated with multiple types of corneal dystrophy |
| KLRD1 | Killer cell lectin
like receptor D1 | Several transcript
variants encoding different isoforms have been found for this
gene |
| ADAP2 | ArfGAP with dual PH
domains | The gene is able to
block the entry of certain RNA viruses |
| ITGA4 | Integrin subunit
α4 | This gene is
associated with gastrointestinal stromal tumors |
| ENPP3 | Ectonucleotide
pyrophosphatase/phosphodiesterase 3 | Antibody drugs of
ENPP3 may be used to treat advanced renal cell carcinoma |
| MT1X | Metallothionein
1X | High expression of
this gene is related to the progression of hepatocellular
carcinoma |
| IGSF10 | Immunoglobulin
superfamily member 10 | High expression of
this gene is related to the occurrence and development of breast
cancer |
| CRYAB | Crystallin αB | CRYAB inhibits
migration and invasion of bladder cancer cells through the PI3K/AKT
and ERK pathways |
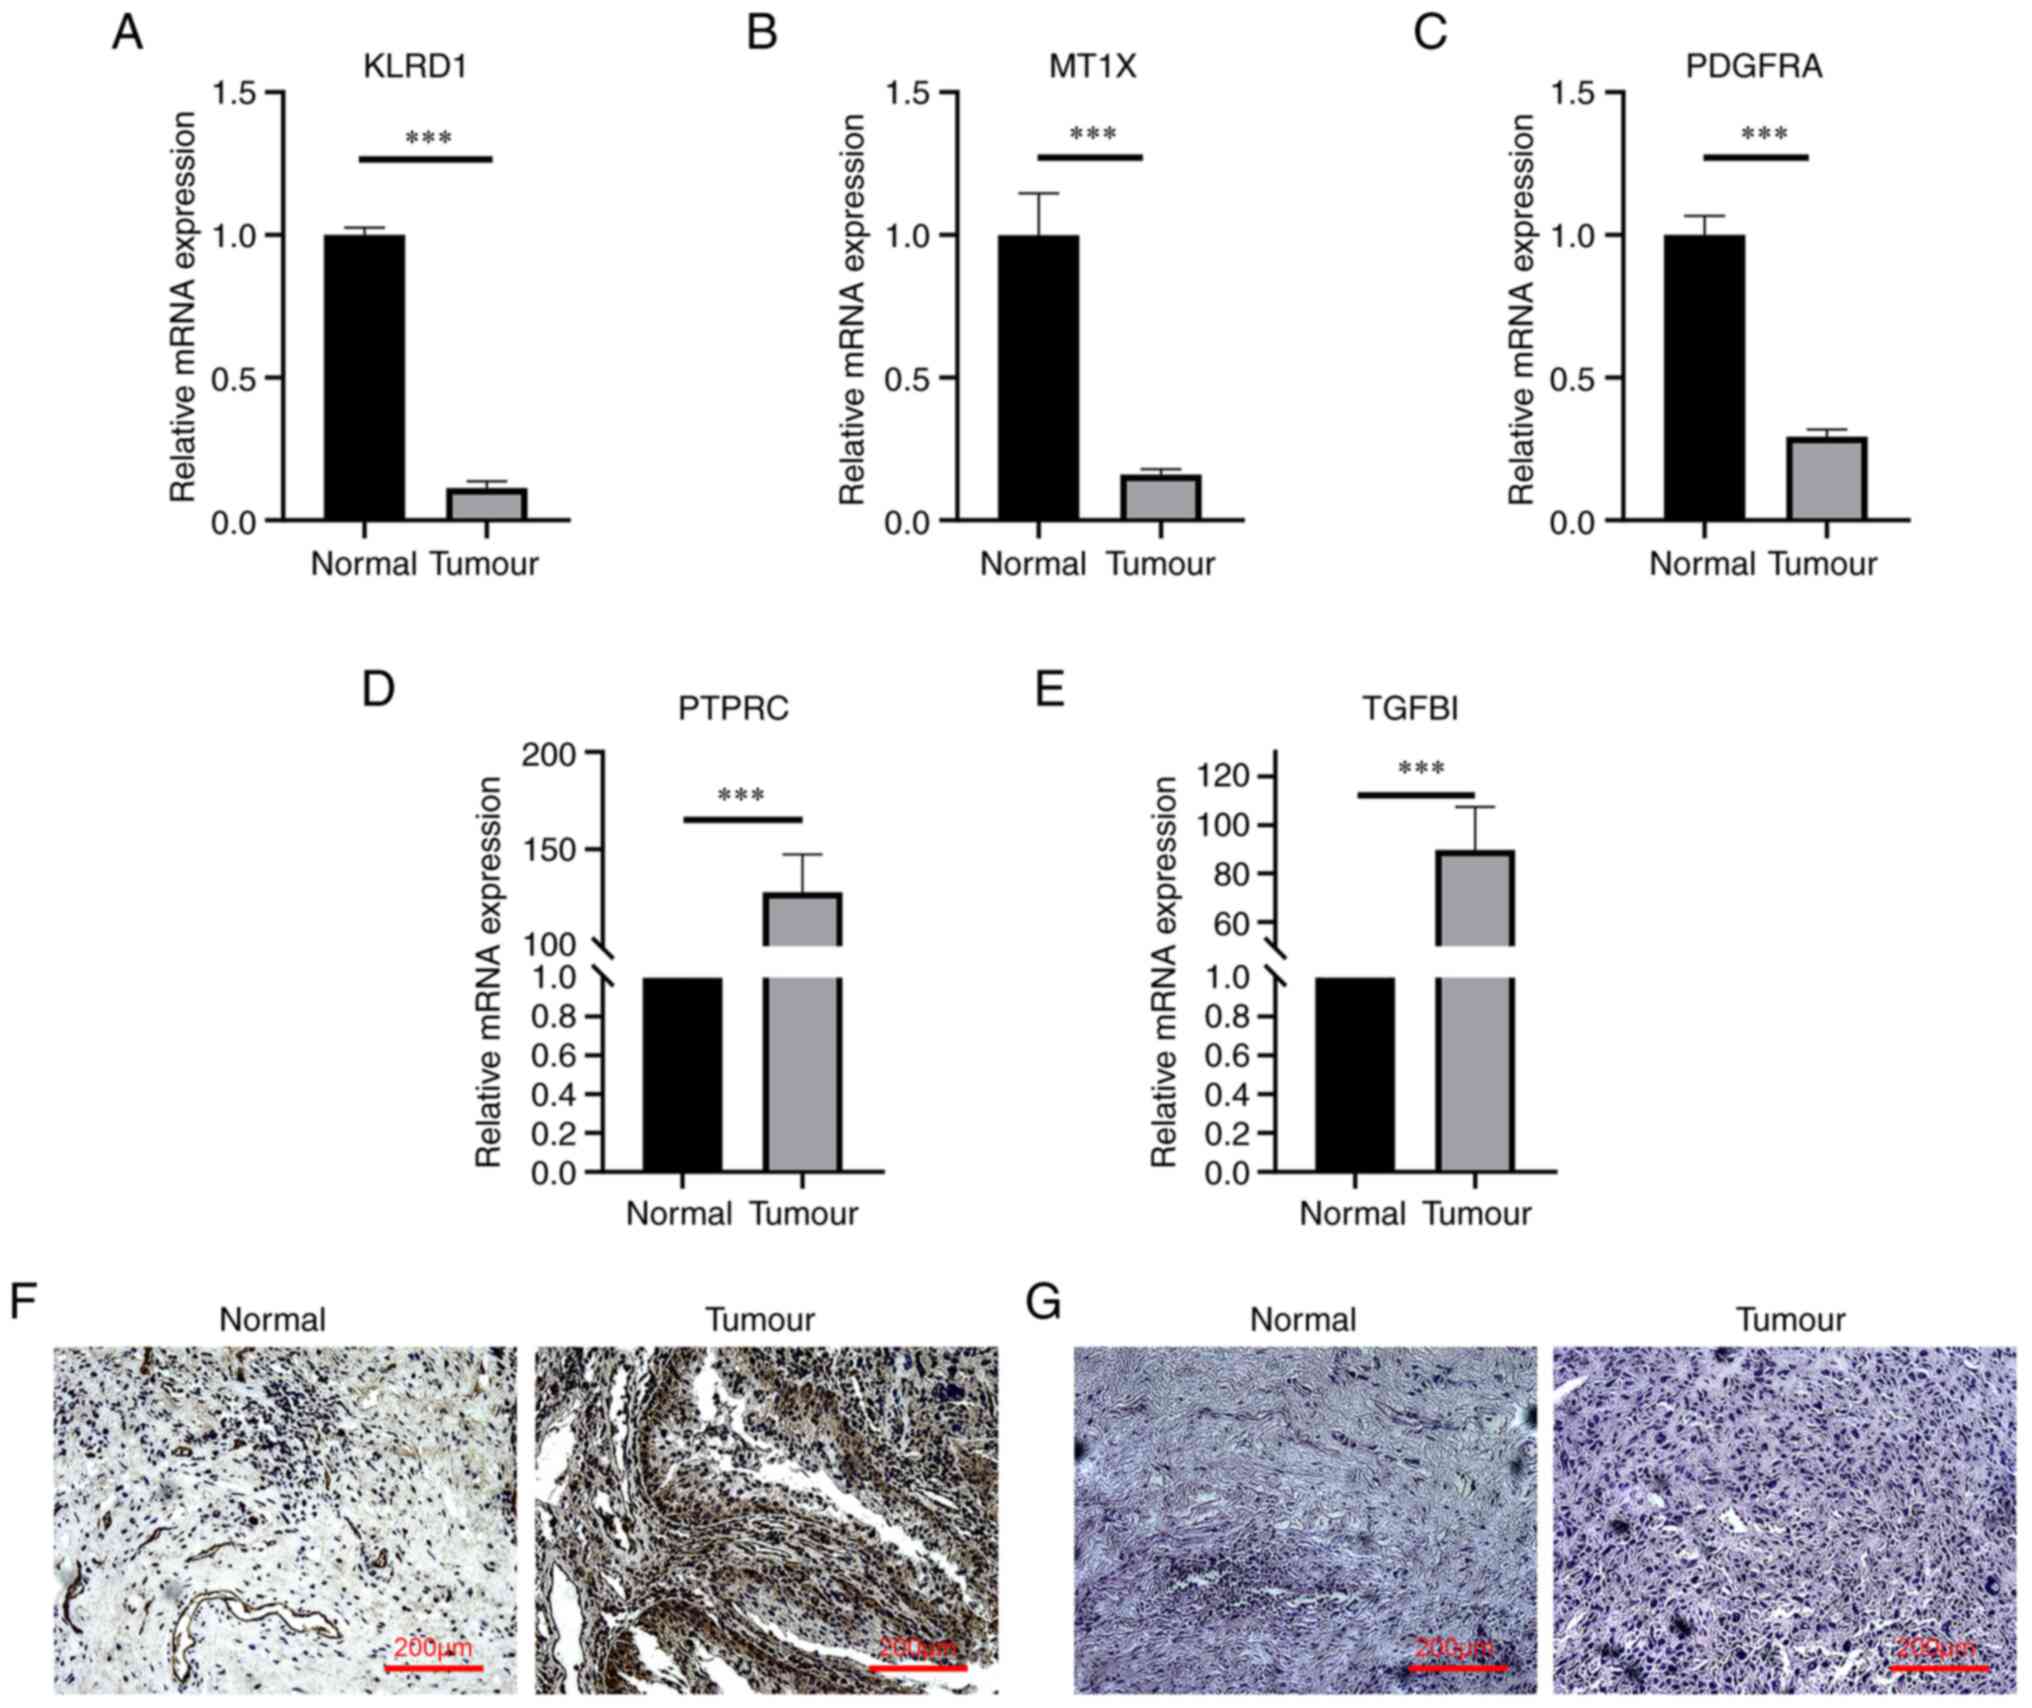
RT-qPCR verifies hub genes
RT-qPCR was used to detect the expression of hub
genes in cancerous and paracancerous tissues of patients with BC.
The results indicated that the expression levels of the hub genes
KLRD1, MT1X and PDGFRA in cancer tissues were significantly lower
than those in adjacent tissues (Fig.
6A-C), while the expression levels of PTPRC and TGFBI were
significantly higher than those in adjacent tissues (Fig. 6D and E).
Immunohistochemical detection of TGFBI
and H&E staining
Immunohistochemical analysis of TGFBI protein
indicated that the positive expression rate in tumor tissue was
high (Fig. 6F). The H&E
staining results of BC and normal tissues under the light
microscope indicated that the tumor group exhibited irregular
mitosis, while the nuclei of normal tissues were normal round,
without any irregular mitosis (Fig.
6G).
Discussion
BC is one of the 10 most common tumor types. In
recent years, mortalities from BC have increased (31,32).
The main causes of BC include smoking, occupational exposure, diet,
long-term use of certain drugs, infection and gene polymorphisms
(33,34). However, the molecular mechanisms
underlying BC have remained to be fully elucidated. The abnormal
expression of the assembly factor for bundle microtubules, TEF
transcription factor, PAR bZIP family member, chloride
intracellular channel protein 1, zinc finger and the SCAN domain
containing 16, c-myc or RAS, p53 or p21 genes, have been reported
to be involved in BC (35-37).
Furthermore, the loss of UTX, also known as lysine-specific
demethylase 6A, and the activation of receptor tyrosine kinase
fibroblast growth factor receptor 3, are reported to be BC-related
(38). The treatment outcomes of
patients with early undetected BC are poor and early effective
diagnostic markers are urgently required. The application of
multiple bioinformatics approaches contributes to the analysis of
molecular changes in the development of BC and has also been used
in the diagnosis of other diseases (39-42).
Through the analysis of two mRNA microarray
datasets, a total of 362 DEGs, comprising 315 upregulated and 47
downregulated DEG, were identified in the present study. Enrichment
analysis using GO and KEGG was performed to explore the
interactions between DEGs. DEGs were mainly enriched in
extracellular matrix organization, heparin binding and plasma
membrane. In previous studies, the extracellular matrix has been
found to have an important role in the occurrence and development
of tumors, and may cause tumor invasion and migration (43-45).
Furthermore, recent studies have indicated that heparin binding may
significantly promote tumor growth (46,47).
Furthermore, the results of the GO enrichment analysis suggested
that at least 8 DEGs are involved in the composition of the plasma
membrane. The plasma membrane frequently has an important role in
improving oxidative stress and particularly in tumors, the repair
of the plasma membrane is dysfunctional (48-50).
Consequently, the above evidence is consistent with the present
results.
In the present study, 13 DEGs were selected as the
central genes with a degree of connectivity of ≥10. Among these
central genes, PDGFRA had the highest nodal degree (37). After extensive study of the
literature, it was indicated that PDGFRA has an important role in
wound healing and the occurrence and development of tumors. The
gene mutation is obviously related to familial gastrointestinal
stromal tumors and other cancers (51,52).
Therefore, it may be considered a target for anticancer drugs, such
as imatinib (53). In the present
study, the PPI network analysis suggested that PDGFRA directly
interacted with ENPP3, PTPRC, TGFBI, BOC and CRYAB, indicating the
key role of PDGFRA in BC. This gene encodes a cell surface tyrosine
kinase receptor for members of the PDGF family. These growth
factors are mitogens for cells of mesenchymal origin. The identity
of the growth factor bound to a receptor monomer determines whether
the functional receptor is a homodimer or a heterodimer, composed
of both PDGFRA and PDGFRB polypeptides. CRYAB is a
ferroptosis-related gene and its high expression may lead to poor
prognosis of gastric cancer and non-small cell lung cancer
(54,55). It was reported that the mutation of
PDGFRA is also related to gastric cancer (51). Therefore, it may be speculated that
PDGFRA and CRYAB have a synergistic effect and high expression of
PDGFRA and CRYAB may lead to poor prognosis of BC (51). Of note, these results are consistent
with the present RT-qPCR results. Furthermore, in the present
study, it was indicated that certain genes have a trend of gradual
increase with the progression of the tumor stage, such as PTPRC,
PDGFRA, KLRD1, ADAP2 and ITGA4.
ENPP3 is a molecular therapeutic target for renal
cell carcinoma. It is expressed in renal tubules, activated
basophils and mast cells. In cancer, ENPP3 is expressed in most
clear-cell histologies (94%), such as bladder tissue and kidney
tissue. However, it still requires to be proven whether ENPP3 may
be used as a molecular therapeutic target for BC (56-58).
As expected, BOC has been reported in numerous tumor-related
publications. BOC is highly expressed in early BC. It promotes a
high level of DNA damage by increasing Sonic hedgehog signal
transduction and ultimately affects the occurrence and development
of BC (59). PRPC (CD45, leukocyte
antigen) is a receptor-like protein tyrosine phosphatase expressed
in all leukocytes. There are several glycoprotein isoforms, which
are the result of the alternative splicing of exons 4, 5 and 6
(also known as A, B and C) of CD45 pre-mRNA, which has been
reported to be associated with ovarian cancer (60). The TLR1 protein is a member of the
TLR family. High expression of TLR1 has been found to have a
significant correlation with the occurrence of gastric cancer
(61). This gene can affect tumor
promotion (such as pro-inflammatory, angiogenesis, and
anti-apoptosis) or antitumor immunity (62). A recent study of CASQ2 found that
CASQ2 is a conventional marker of leiomyosarcoma (63). TGFBI may be induced by human
adenocarcinoma cells and secreted TGF-β (64). Previous reports have revealed that
TGFBI acts as a tumor suppressor gene in various tumor types,
including lung and breast cancer (65-67).
The expression of MT1X changes in oral cancer and may predict
cancer metastasis and the treatment effect in patients (68). The genes identified in the present
study provide predictive markers for clinicians to diagnose BC in
the future and provide directions for experimental research. These
diagnostic markers still require to be experimentally verified.
In conclusion, the present study set out to identify
DEGs that may be associated with BC. A total of 13 hub genes were
identified and through various bioinformatics analyses, these genes
were determined to serve as potential diagnostic markers of BC;
however, the biological function of these genes in BC still
requires further investigation.
Acknowledgements
Not applicable.
Funding
Funding: This study was supported by the National Natural
Science Foundation of China project ‘The effect of fluoride on the
interaction between osteocalcin and Leydig cells’ (project no.
81360409).
Availability of data and materials
TCGA mRNA expression and clinical data were
downloaded from the TCGA public database (https://portal.gdc.cancer.gov/) and the GEO mRNA
expression and clinical data were downloaded from the GEO public
database (https://www.ncbi.nlm.nih.gov/geo/).
Authors' contributions
LW and XY completed the experiments. BS and LL were
involved in the study conception and design. BS and LW performed
the bioinformatics analysis. LL and XY wrote and edited the
manuscript. BS and LL checked and confirm the authenticity of all
the raw data. All authors have read and approved the final version
of the manuscript.
Ethics approval and consent to
participate
Written informed consent was provided by the three
patients who donated their BC tissues. Ethical review was performed
and the protocol was approved by the ethics committee of Xinjiang
Medical University (Urumqi, China; review no.
XJYKDXR20220106001).
Patient consent for publication
Not applicable.
Competing interests
The authors declare that they have no competing
interests.
References
|
1
|
Aghaalikhani N, Rashtchizadeh N, Shadpour
P, Allameh A and Mahmoodi M: Cancer stem cells as a therapeutic
target in bladder cancer. J Cell Physiol. 234:3197–3206.
2019.PubMed/NCBI View Article : Google Scholar
|
|
2
|
Bhanvadia SK: Bladder cancer survivorship.
Curr Urol Rep. 19(111)2018.PubMed/NCBI View Article : Google Scholar
|
|
3
|
Cumberbatch MGK, Jubber I, Black PC,
Esperto F, Figueroa JD, Kamat AM, Kiemeney L, Lotan Y, Pang K,
Silverman DT, et al: Epidemiology of bladder cancer: A systematic
review and contemporary update of risk factors in 2018. Eur Urol.
74:784–795. 2018.PubMed/NCBI View Article : Google Scholar
|
|
4
|
Freedman ND, Silverman DT, Hollenbeck AR,
Schatzkin A and Abnet CC: Association between smoking and risk of
bladder cancer among men and women. JAMA. 306:737–745.
2011.PubMed/NCBI View Article : Google Scholar
|
|
5
|
Ma Y and Li MD: Establishment of a strong
link between smoking and cancer pathogenesis through DNA
methylation analysis. Sci Rep. 7(1811)2017.PubMed/NCBI View Article : Google Scholar
|
|
6
|
Islam MO, Bacchetti T and Ferretti G:
Alterations of antioxidant enzymes and biomarkers of
nitro-oxidative stress in tissues of bladder cancer. Oxid Med Cell
Longev. 2019(2730896)2019.PubMed/NCBI View Article : Google Scholar
|
|
7
|
Sawicka E, Lisowska A, Kowal P and Długosz
A: The role of oxidative stress in bladder cancer. Postepy Hig Med
Dosw (Online). 69:744–752. 2015.PubMed/NCBI View Article : Google Scholar : (In Polish).
|
|
8
|
Whongsiri P, Pimratana C, Wijitsettakul U,
Sanpavat A, Jindatip D, Hoffmann MJ, Goering W, Schulz WA and
Boonla C: Oxidative stress and LINE-1 reactivation in bladder
cancer are epigenetically linked through active chromatin
formation. Free Radic Biol Med. 134:419–428. 2019.PubMed/NCBI View Article : Google Scholar
|
|
9
|
Zhang X, Han C and He J: Research progress
of oncogene and tumor suppressor gene in bladder cancer. Panminerva
Med. 57:191–200. 2015.PubMed/NCBI
|
|
10
|
Li L, Lei Q, Zhang S, Kong L and Qin B:
Screening and identification of key biomarkers in hepatocellular
carcinoma: Evidence from bioinformatic analysis. Oncol Rep.
38:2607–2618. 2017.PubMed/NCBI View Article : Google Scholar
|
|
11
|
Edgar R, Domrachev M and Lash AE: Gene
expression omnibus: NCBI gene expression and hybridization array
data repository. Nucleic Acids Res. 30:207–210. 2002.PubMed/NCBI View Article : Google Scholar
|
|
12
|
Santos M, Martínez-Fernández M, Dueñas M,
García-Escudero R, Alfaya B, Villacampa F, Saiz-Ladera C, Costa C,
Oteo M, Duarte J, et al: In vivo disruption of an Rb-E2F-Ezh2
signaling loop causes bladder cancer. Cancer Res. 74:6565–6577.
2014.PubMed/NCBI View Article : Google Scholar
|
|
13
|
Zhao F, Lin T, He W, Han J, Zhu D, Hu K,
Li W, Zheng Z, Huang J and Xie W: Knockdown of a novel lincRNA
AATBC suppresses proliferation and induces apoptosis in bladder
cancer. Oncotarget. 6:1064–1078. 2015.PubMed/NCBI View Article : Google Scholar
|
|
14
|
Huang DW, Sherman BT, Tan Q, Collins JR,
Alvord WG, Roayaei J, Stephens R, Baseler MW, Lane HC and Lempicki
RA: The DAVID Gene Functional Classification Tool: A novel
biological module-centric algorithm to functionally analyze large
gene lists. Genome Biol. 8(R183)2007.PubMed/NCBI View Article : Google Scholar
|
|
15
|
Mougeot JL, Noll BD and Bahrani Mougeot
FK: Sjögren's syndrome X-chromosome dose effect: An epigenetic
perspective. Oral Dis. 25:372–384. 2019.PubMed/NCBI View Article : Google Scholar
|
|
16
|
Yang G, Chen Q, Xiao J, Zhang H, Wang Z
and Lin X: Identification of genes and analysis of prognostic
values in nonsmoking females with non-small cell lung carcinoma by
bioinformatics analyses. Cancer Manag Res. 10:4287–4295.
2018.PubMed/NCBI View Article : Google Scholar
|
|
17
|
Kanehisa M: The KEGG database. Novartis
Found Symp. 247:91–101. 2002.PubMed/NCBI
|
|
18
|
Ashburner M, Ball CA, Blake JA, Botstein
D, Butler H, Cherry JM, Davis AP, Dolinski K, Dwight SS, Eppig JT,
et al: Gene ontology: Tool for the unification of biology. The Gene
Ontology Consortium. Nat Genet. 25:25–29. 2000.PubMed/NCBI View
Article : Google Scholar
|
|
19
|
Szklarczyk D, Gable AL, Nastou KC, Lyon D,
Kirsch R, Pyysalo S, Doncheva NT, Legeay M, Fang T, Bork P, et al:
The STRING database in 2021: Customizable protein-protein networks,
and functional characterization of user-uploaded gene/measurement
sets. Nucleic Acids Res. 49(D1):D605–D612. 2021.PubMed/NCBI View Article : Google Scholar
|
|
20
|
Doncheva NT, Morris JH, Gorodkin J and
Jensen LJ: Cytoscape StringApp: Network analysis and visualization
of proteomics data. J Proteome Res. 18:623–632. 2019.PubMed/NCBI View Article : Google Scholar
|
|
21
|
Wang J, Zhong J, Chen G, Li M, Wu FX and
Pan Y: ClusterViz: A Cytoscape APP for cluster analysis of
biological network. IEEE/ACM Trans Comput Biol Bioinform.
12:815–822. 2015.PubMed/NCBI View Article : Google Scholar
|
|
22
|
Liu J, Lichtenberg T, Hoadley KA, Poisson
LM, Lazar AJ, Cherniack AD, Kovatich AJ, Benz CC, Levine DA, Lee
AV, et al: An integrated TCGA pan-cancer clinical data resource to
drive high-quality survival outcome analytics. Cell.
173:400–416.e11. 2018.PubMed/NCBI View Article : Google Scholar
|
|
23
|
Chan BKC: Data analysis using R
Programming. Adv Exp Med Biol. 1082:47–122. 2018.PubMed/NCBI View Article : Google Scholar
|
|
24
|
Maere S, Heymans K and Kuiper M: BiNGO: A
Cytoscape plugin to assess overrepresentation of gene ontology
categories in biological networks. Bioinformatics. 21:3448–3449.
2005.PubMed/NCBI View Article : Google Scholar
|
|
25
|
Rangwala SH, Kuznetsov A, Ananiev V,
Asztalos A, Borodin E, Evgeniev V, Joukov V, Lotov V, Pannu R,
Rudnev D, et al: Accessing NCBI data using the NCBI Sequence Viewer
and Genome Data Viewer (GDV). Genome Res. 31:159–169.
2021.PubMed/NCBI View Article : Google Scholar
|
|
26
|
Park J, Lee SI, Shin S, Hong JH, Yoo HM
and Kim JG: Genetic profiling of somatic alterations by Oncomine
Focus Assay in Korean patients with advanced gastric cancer. Oncol
Lett. 20(129)2020.PubMed/NCBI View Article : Google Scholar
|
|
27
|
Liu D, Mao Y, Chen C, Zhu F, Lu W and Ma
H: Expression patterns and clinical significances of ENO2 in lung
cancer: An analysis based on Oncomine database. Ann Transl Med.
8(639)2020.PubMed/NCBI View Article : Google Scholar
|
|
28
|
Zhu J, Jin L, Zhang A, Gao P, Dai G, Xu M,
Xu L and Yang D: Coexpression analysis of the EZH2 gene using The
cancer genome atlas and oncomine databases identifies coexpressed
genes involved in biological networks in breast cancer,
glioblastoma, and prostate cancer. Med Sci Monit.
26(e922346)2020.PubMed/NCBI View Article : Google Scholar
|
|
29
|
Sahin Y, Yucetas U, Ates HA, Erkan E,
Yucetas E, Temiz MZ, Toktas MG, Kadihasanoglu M and Topkaya BC:
Improving the diagnosis of high grade and stage bladder cancer by
detecting increased urinary calprotectin expression in tumor tissue
and tumor-associated inflammatory response. Investig Clin Urol.
60:343–350. 2019.PubMed/NCBI View Article : Google Scholar
|
|
30
|
Livak KJ and Schmittgen TD: Analysis of
relative gene expression data using real-time quantitative PCR and
the 2(-Delta Delta C(T)) Method. Methods. 25:402–408.
2001.PubMed/NCBI View Article : Google Scholar
|
|
31
|
Wang Q, Zhang T, Wu J, Wen J, Tao D, Wan T
and Zhu W: Prognosis and risk factors of patients with upper
urinary tract urothelial carcinoma and postoperative recurrence of
bladder cancer in central China. BMC Urol. 19(24)2019.PubMed/NCBI View Article : Google Scholar
|
|
32
|
Rozanec JJ and Secin FP: Epidemiology,
etiology and prevention of bladder cancer. Arch Esp Urol.
73:872–878. 2020.PubMed/NCBI(In Spanish).
|
|
33
|
Koie T, Ohyama C, Makiyama K, Shimazui T,
Miyagawa T, Mizutani K, Tsuchiya T, Kato T and Nakane K: Utility of
robot-assisted radical cystectomy with intracorporeal urinary
diversion for muscle-invasive bladder cancer. Int J Urol.
26:334–340. 2019.PubMed/NCBI View Article : Google Scholar
|
|
34
|
Saleh AA, Gohar SF, Hemida AS, Elgharbawy
M and Soliman SE: Evaluation of ASPM and TEF gene expressions as
potential biomarkers for bladder cancer. Biochem Genet. 58:490–507.
2020.PubMed/NCBI View Article : Google Scholar
|
|
35
|
Adelmann TG, Camerota TC, Ceausu AR,
Cimpean AM, Mazzanti M and Raica M: Chloride intracellular channel
protein 1 (CLIC1) ιs over-expressed in muscle invasive urinary
bladder cancer. Anticancer Res. 40:6879–6884. 2020.PubMed/NCBI View Article : Google Scholar
|
|
36
|
Li X, Shang D, Shen H, Song J, Hao G and
Tian Y: ZSCAN16 promotes proliferation, migration and invasion of
bladder cancer via regulating NF-kB, AKT, mTOR, P38 and other
genes. Biomed Pharmacother. 126(110066)2020.PubMed/NCBI View Article : Google Scholar
|
|
37
|
Barrows D, Feng L, Carroll TS and Allis
CD: Loss of UTX/KDM6A and the activation of FGFR3 converge to
regulate differentiation gene-expression programs in bladder
cancer. Proc Natl Acad Sci USA. 117:25732–25741. 2020.PubMed/NCBI View Article : Google Scholar
|
|
38
|
Bolón-Canedo V, Alonso-Betanzos A,
López-de-Ullibarri I and Cao R: Challenges and future trends for
microarray analysis. Methods Mol Biol. 1986:283–293.
2019.PubMed/NCBI View Article : Google Scholar
|
|
39
|
Lu W, Li N and Liao F: Identification of
key genes and pathways in pancreatic cancer gene expression profile
by integrative analysis. Genes (Basel). 10(612)2019.PubMed/NCBI View Article : Google Scholar
|
|
40
|
Ma X, Wang P, Xu G, Yu F and Ma Y:
Integrative genomics analysis of various omics data and networks
identify risk genes and variants vulnerable to childhood-onset
asthma. BMC Med Genomics. 13(123)2020.PubMed/NCBI View Article : Google Scholar
|
|
41
|
Ma Y, Huang Y, Zhao S, Yao Y, Zhang Y, Qu
J, Wu N and Su J: Integrative genomics analysis reveals a 21q22.11
locus contributing risk to COVID-19. Hum Mol Genet. 30:1247–1258.
2021.PubMed/NCBI View Article : Google Scholar
|
|
42
|
Pal A, Haliti P, Dharmadhikari B, Qi W and
Patra P: Manipulating extracellular matrix organizations and
parameters to control local cancer invasion. IEEE/ACM Trans Comput
Biol Bioinform. 18:2566–2576. 2021.PubMed/NCBI View Article : Google Scholar
|
|
43
|
Schaeffer J, Tannahill D, Cioni JM,
Rowlands D and Keynes R: Identification of the extracellular matrix
protein Fibulin-2 as a regulator of spinal nerve organization. Dev
Biol. 442:101–114. 2018.PubMed/NCBI View Article : Google Scholar
|
|
44
|
Jones CE, Hammer AM, Cho Y, Sizemore GM,
Cukierman E, Yee LD, Ghadiali SN, Ostrowski MC and Leight JL:
Stromal PTEN regulates extracellular matrix organization in the
mammary gland. Neoplasia. 21:132–145. 2019.PubMed/NCBI View Article : Google Scholar
|
|
45
|
Ling L, Tan SK, Goh TH, Cheung E, Nurcombe
V, van Wijnen AJ and Cool SM: Targeting the heparin-binding domain
of fibroblast growth factor receptor 1 as a potential cancer
therapy. Mol Cancer. 14(136)2015.PubMed/NCBI View Article : Google Scholar
|
|
46
|
Ngernyuang N, Yan W, Schwartz LM, Oh D,
Liu YB, Chen H and Shao R: A heparin binding motif rich in arginine
and lysine is the functional domain of YKL-40. Neoplasia.
20:182–192. 2018.PubMed/NCBI View Article : Google Scholar
|
|
47
|
Lauritzen SP, Boye TL and Nylandsted J:
Annexins are instrumental for efficient plasma membrane repair in
cancer cells. Semin Cell Dev Biol. 45:32–38. 2015.PubMed/NCBI View Article : Google Scholar
|
|
48
|
Zhu J, Xu M, Gao M, Zhang Z, Xu Y, Xia T
and Liu S: Graphene oxide induced perturbation to plasma membrane
and cytoskeletal meshwork sensitize cancer cells to
chemotherapeutic agents. ACS Nano. 11:2637–2651. 2017.PubMed/NCBI View Article : Google Scholar
|
|
49
|
Peters AA, Milevskiy MJ, Lee WC, Curry MC,
Smart CE, Saunus JM, Reid L, da Silva L, Marcial DL, Dray E, et al:
The calcium pump plasma membrane Ca(2+)-ATPase 2 (PMCA2) regulates
breast cancer cell proliferation and sensitivity to doxorubicin.
Sci Rep. 6(25505)2016.PubMed/NCBI View Article : Google Scholar
|
|
50
|
Tan L, Cho KJ, Neupane P, Capon RJ and
Hancock JF: An oxanthroquinone derivative that disrupts RAS plasma
membrane localization inhibits cancer cell growth. J Biol Chem.
293:13696–13706. 2018.PubMed/NCBI View Article : Google Scholar
|
|
51
|
Jones RL, Serrano C, von Mehren M, George
S, Heinrich MC, Kang YK, Schöffski P, Cassier PA, Mir O, Chawla SP,
et al: Avapritinib in unresectable or metastatic PDGFRA
D842V-mutant gastrointestinal stromal tumours: Long-term efficacy
and safety data from the NAVIGATOR phase I trial. Eur J Cancer.
145:132–142. 2021.PubMed/NCBI View Article : Google Scholar
|
|
52
|
Ranjbaran R, Abbasi M, Rafiei Dehbidi G,
Seyyedi N, Behzad-Behbahani A and Sharifzadeh S: Phosflow
assessment of PDGFRA phosphorylation state: A guide for tyrosine
kinase inhibitor targeted therapy in hypereosinophilia patients.
Cytometry A. 99:784–792. 2021.PubMed/NCBI View Article : Google Scholar
|
|
53
|
Jašek K, Váňová B, Grendár M, Štanclová A,
Szépe P, Hornáková A, Holubeková V, Plank L and Lasabová Z: BRAF
mutations in KIT/PDGFRA positive gastrointestinal stromal tumours
(GISTs): Is their frequency underestimated? Pathol Res Pract.
216(153171)2020.PubMed/NCBI View Article : Google Scholar
|
|
54
|
Tao X, Cheng L, Li Y, Ci H, Xu J, Wu S and
Tao Y: Expression of CRYAB with the angiogenesis and poor prognosis
for human gastric cancer. Medicine (Baltimore).
98(e17799)2019.PubMed/NCBI View Article : Google Scholar
|
|
55
|
Qin H, Ni Y, Tong J, Zhao J, Zhou X, Cai
W, Liang J and Yao X: Elevated expression of CRYAB predicts
unfavorable prognosis in non-small cell lung cancer. Med Oncol.
31(142)2014.PubMed/NCBI View Article : Google Scholar
|
|
56
|
Thompson JA, Motzer RJ, Molina AM,
Choueiri TK, Heath EI, Redman BG, Sangha RS, Ernst DS, Pili R, Kim
SK, et al: Phase I trials of anti-ENPP3 antibody-drug conjugates in
advanced refractory renal cell carcinomas. Clin Cancer Res.
24:4399–4406. 2018.PubMed/NCBI View Article : Google Scholar
|
|
57
|
Doñate F, Raitano A, Morrison K, An Z,
Capo L, Aviña H, Karki S, Morrison K, Yang P, Ou J, et al: AGS16F
is a novel antibody drug conjugate directed against ENPP3 for the
treatment of renal cell carcinoma. Clin Cancer Res. 22:1989–1999.
2016.PubMed/NCBI View Article : Google Scholar
|
|
58
|
Trapero C, Jover L, Fernández-Montolí ME,
García-Tejedor A, Vidal A, Gómez de Aranda I, Ponce J, Matias-Guiu
X and Martín-Satué M: Analysis of the ectoenzymes ADA, ALP, ENPP1,
and ENPP3, in the contents of ovarian endometriomas as candidate
biomarkers of endometriosis. Am J Reprod Immunol.
79:2018.PubMed/NCBI View Article : Google Scholar
|
|
59
|
Mille F, Tamayo-Orrego L, Lévesque M,
Remke M, Korshunov A, Cardin J, Bouchard N, Izzi L, Kool M,
Northcott PA, et al: The Shh receptor Boc promotes progression of
early medulloblastoma to advanced tumors. Dev Cell. 31:34–47.
2014.PubMed/NCBI View Article : Google Scholar
|
|
60
|
Landskron J, Kraggerud SM, Wik E, Dørum A,
Bjørnslett M, Melum E, Helland Ø, Bjørge L, Lothe RA, Salvesen HB
and Taskén K: C77G in PTPRC (CD45) is no risk allele for ovarian
cancer, but associated with less aggressive disease. PLoS One.
12(e0182030)2017.PubMed/NCBI View Article : Google Scholar
|
|
61
|
Dargiene G, Streleckiene G, Skieceviciene
J, Leja M, Link A, Wex T, Kupcinskas L, Malfertheiner P and
Kupcinskas J: TLR1 and PRKAA1 gene polymorphisms in the development
of atrophic gastritis and gastric cancer. J Gastrointestin Liver
Dis. 27:363–369. 2018.PubMed/NCBI View Article : Google Scholar
|
|
62
|
Pradere JP, Dapito DH and Schwabe RF: The
Yin and Yang of Toll-like receptors in cancer. Oncogene.
33:3485–3495. 2014.PubMed/NCBI View Article : Google Scholar
|
|
63
|
Demicco EG, Boland GM, Brewer Savannah KJ,
Lusby K, Young ED, Ingram D, Watson KL, Bailey M, Guo X, Hornick
JL, et al: Progressive loss of myogenic differentiation in
leiomyosarcoma has prognostic value. Histopathology. 66:627–638.
2015.PubMed/NCBI View Article : Google Scholar
|
|
64
|
Skonier J, Neubauer M, Madisen L, Bennett
K, Plowman GD and Purchio AF: cDNA cloning and sequence analysis of
beta ig-h3, a novel gene induced in a human adenocarcinoma cell
line after treatment with transforming growth factor-beta. DNA Cell
Biol. 11:511–522. 1992.PubMed/NCBI View Article : Google Scholar
|
|
65
|
Wen G, Partridge MA, Li B, Hong M, Liao W,
Cheng SK, Zhao Y, Calaf GM, Liu T, Zhou J, et al: TGFBI expression
reduces in vitro and in vivo metastatic potential of lung and
breast tumor cells. Cancer Lett. 308:23–32. 2011.PubMed/NCBI View Article : Google Scholar
|
|
66
|
Calaf GM, Echiburú-Chau C, Zhao YL and Hei
TK: BigH3 protein expression as a marker for breast cancer. Int J
Mol Med. 21:561–568. 2008.PubMed/NCBI
|
|
67
|
Ahmed AA, Mills AD, Ibrahim AE, Temple J,
Blenkiron C, Vias M, Massie CE, Iyer NG, McGeoch A, Crawford R, et
al: The extracellular matrix protein TGFBI induces microtubule
stabilization and sensitizes ovarian cancers to paclitaxel. Cancer
Cell. 12:514–527. 2007.PubMed/NCBI View Article : Google Scholar
|
|
68
|
Brazão-Silva MT, Rodrigues MF, Eisenberg
AL, Dias FL, de Castro LM, Nunes FD, Faria PR, Cardoso SV, Loyola
AM and de Sousa SC: Metallothionein gene expression is altered in
oral cancer and may predict metastasis and patient outcomes.
Histopathology. 67:358–367. 2015.PubMed/NCBI View Article : Google Scholar
|
|
69
|
Blaveri E, Simko JP, Korkola JE, Brewer
JL, Baehner F, Mehta K, Devries S, Koppie T, Pejavar S, Carroll P
and Waldman FM: Bladder cancer outcome and subtype classification
by gene expression. Clin Cancer Res. 11:4044–4055. 2005.PubMed/NCBI View Article : Google Scholar
|
|
70
|
Sanchez-Carbayo M, Socci ND, Lozano J,
Saint F and Cordon-Cardo C: Defining molecular profiles of poor
outcome in patients with invasive bladder cancer using
oligonucleotide microarrays. J Clin Oncol. 24:778–789.
2006.PubMed/NCBI View Article : Google Scholar
|
|
71
|
Stransky N, Vallot C, Reyal F,
Bernard-Pierrot I, de Medina SG, Segraves R, de Rycke Y, Elvin P,
Cassidy A, Spraggon C, et al: Regional copy number-independent
deregulation of transcription in cancer. Nat Genet. 38:1386–1396.
2006.PubMed/NCBI View
Article : Google Scholar
|
|
72
|
Dyrskjøt L, Thykjaer T, Kruhøffer M,
Jensen JL, Marcussen N, Hamilton-Dutoit S, Wolf H and Orntoft TF: .
Identifying distinct classes of bladder carcinoma using
microarrays. Nat Genet. 33:90–96. 2003.PubMed/NCBI View
Article : Google Scholar
|