Introduction
Systemic chemotherapy, the first-line standard
treatment for advanced oesophageal cancer, leads to a median
survival of only ~1 year. Immune checkpoint inhibitors (ICIs) have
emerged as a breakthrough therapy for tumours resulting in
impressive progress in the treatment of multiple tumour types
(1-3).
Commonly used ICIs include anti-cytotoxic T lymphocyte antigen-4
(CTLA-4), anti-programmed death receptor-1 (PD-1), and
anti-programmed death receptor ligand-1 (PD-L1) antibodies.
Anti-PD-1 monoclonal antibodies significantly improve therapeutic
efficacy in advanced oesophageal cancer, and three phase III
clinical trials, KEYNOTE-181(4),
ATTRACTION-3(5), and ESCORT
(6), have confirmed that
second-line treatment with anti-PD-1 monoclonal antibodies
significantly improved the survival benefit in some patients with
advanced oesophageal cancer, confirming the important role of
anti-PD-1 monoclonal antibodies in the treatment of advanced
oesophageal cancer. The recent KEYNOTE-590(7) and ESCORT-1st (8) studies also found that anti-PD-1
monoclonal antibodies in combination with chemotherapy as
first-line treatment of advanced oesophageal cancer significantly
prolonged overall survival (OS) and led to a median OS of 13-16
months. However, the tumour overall response rate (ORR) and median
progression-free survival (mPFS) in patients with advanced
oesophageal cancer undergoing second-line treatment with anti-PD-1
monoclonal antibodies were ~20% and ~2 months, respectively. The
corresponding data for patients with advanced oesophageal cancer
undergoing first-line treatment with anti-PD-1 monoclonal
antibodies combined with chemotherapy were ~50% and ~6 months,
respectively (7,8). These findings indicate that most
patients with advanced oesophageal cancer develop primary and
acquired resistance against anti-PD-1 monoclonal antibodies.
Therefore, it is important to examine the molecular mechanisms of
anti-PD-1 monoclonal antibody resistance in oesophageal cancer to
improve patient prognosis.
Metabolomics is an emerging histological discipline
that, together with genomics and proteomics, forms the cornerstone
of systems biology. It analyses the metabolic status of the whole
or the system by means of high-throughput detection and assessment
of the dynamics of thousands of low-molecular-weight metabolites
that are formed via chemical transformation under certain metabolic
conditions (9,10). More precisely, metabolomics is used
to identify and quantify metabolites for revealing the association
between metabolite changes and pathological states, or for
revealing the effects of external factors. Metabolomics holds great
application potential as an advanced analytical technique and
bioinformatics tool for the diagnosis of various cancers, such as
non-small cell lung cancer (11),
colorectal cancer (12) and gastric
cancer (13). Analytical techniques
in metabolomics mainly include nuclear magnetic resonance (NMR),
gas chromatography-mass spectrometry (GC-MS), and liquid
chromatography-mass spectrometry (LC-MS), which have different
characteristics and technical limitations. In particular, MS
techniques, such as GC-MS and LC-MS, have the advantages of high
sensitivity and a wide detection range with a simple and useful
database for metabolite identification (14-18).
NMR spectroscopy allows rapid and high-throughput detection with
relatively high reproducibility while requiring a small number of
samples and being non-destructive to the samples, and is therefore
suitable for tissue analysis (19).
Data-independent acquisition mass spectrometry
(DIA-MS) is a next-generation proteomic method that generates
permanent digital proteomic maps, allowing highly reproducible
retrospective analysis of cell and tissue samples (20). The technology has been widely used
in oncology research to elucidate the mechanisms of cancer
development (21), mechanisms of
drug resistance, molecular classification of cancer, and screening
of cancer biomarkers (22). The
number of applications of DIA-MS to cancer proteomics has
continually increased since the introduction of this technology in
2012 and includes different cancer types such as colorectal cancer
(23,24), hepatocellular carcinoma (25), pancreatic cancer (26), prostate cancer (27), and follicular thyroid tumours
(28).
In the present study, plasma samples were collected
from 15/16 patients with a pathological report confirming complete
response/partial response (CR/PR) or stable disease/progressive
disease (SD/PD) after immunotherapy. Metabolomic and proteomic
assays were performed on the plasma samples to elucidate the
changes in protein expression and metabolite expression within the
CR/PR group vs. the PD/SD group. This is the first time a
multi-omics technique has been used to explore proteins and
metabolites associated with resistance to PD-1 monoclonal antibody
in patients with oesophageal squamous cell carcinoma (OSCC).
Materials and methods
Study design
In order to explore the molecular mechanism of
immunotherapy resistance in OSCC, plasma samples were collected
from patients with OSCC who underwent treatment with an anti-PD-1
monoclonal antibody combined with chemotherapy after the fourth
treatment cycle between January 2021 and January 2022. The cohort
was comprised of 31 patients including 8 females and 23 males.
Their ages ranged from 42 to 80 with a median age of 65 years. The
inclusion criteria were as follows: i) Age, 18 to 80 years; ii)
Eastern Cooperative Oncology Group (ECOG) performance status (PS)
score 0 to 1(29); iii) history or
pathology confirmed ESCC; iv) chemotherapy regimen consisted of
cisplatin plus 5-fluorouracil; and v) no previous tumor-related
treatments. The exclusion criteria were: i) esophageal
adenocarcinoma and small-cell carcinoma; and ii) incomplete
follow-up data. The treatment efficacy was evaluated by the
Responsive Evaluation Criteria in Solid Tumours (RECIST)
1.1(30) at the same period.
Finally, the plasma samples were divided into the CR/PR group
(n=15) and the SD/PD group (n=16). Subsequently, the differentially
expressed proteins (DEPs) and differentially expressed metabolites
(DEMs) between the two groups, which may be the main contributing
factors to immunotherapy resistance, were determined using
proteomic (DIA proteomics) and metabolic analysis (including
TM-widely targeted metabolomics and widely targeted lipidomics).
Furthermore, the DEPs and DEMs were annotated to Kyoto Encyclopedia
of Genes and Genomes (KEGG) enrichment analysis and the molecular
mechanisms were elucidated by conjoint analysis of the DEPs and
DEMs. The study work flow is illustrated in Fig. 1.
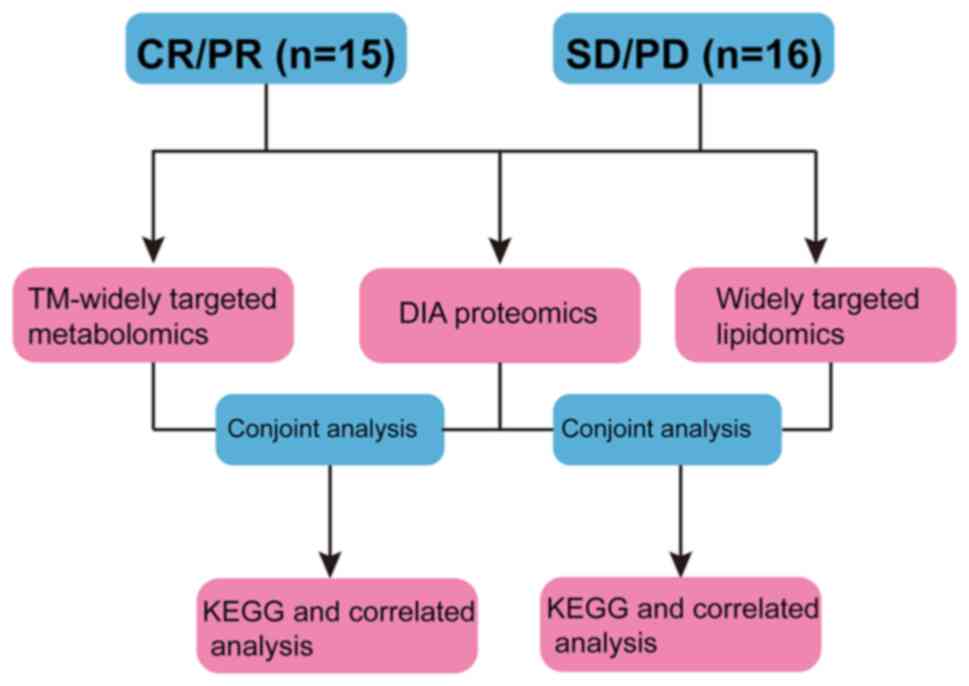 | Figure 1Workflow of the present study. The
plasmas of patients with oesophageal squamous cell carcinoma, who
were treatment with anti-programmed death receptor-1 monoclonal
antibody combined with chemotherapy after the fourth treatment
cycle, were collected. The curative effect was simultaneously
determined by the Responsive Evaluation Criteria in Solid Tumours
1.1 at the same period. Finally, the plasma samples were divided
into a complete response/partial response group (n=15) and a stable
disease/progressive disease group (n=16). The DEPs and DEMs between
the two groups, which may mainly contribute to the immunotherapy
resistance, were then identified by proteomic (data-independent
acquisition proteomics) and metabolic (including TM-widely targeted
metabolomics and widely targeted lipidomics) analysis. Furthermore,
conjoint analysis of the DEPs and DEMs included Kyoto Encyclopedia
of Genes and Genomes enrichment pathway analysis and correlated
analysis was used to elucidate the molecular mechanisms. CR/PR,
complete response/partial response; SD/PD, stable
disease/progressive disease; DEPs, differentially expressed
proteins; DEMs, differentially expressed metabolites; DIA,
data-independent acquisition; KEGG, Kyoto Encyclopedia of Genes and
Genomes. |
Sample collection
A total of 31 plasma samples of oesophageal squamous
cell carcinoma, including 15 CR/PR and 16 SD/PD who underwent PD-1
monoclonal antibody combined with chemotherapy were collected. The
CR, PR, SD, PD was determined using RECIST 1.1. TNM staging was
performed according to the sixth Union for International Cancer
Control (UICC) TNM classification system (31) due to the large span of diagnosis.
All oesophageal samples were collected from patients at Renmin
Hospital of Wuhan University (Wuhan, China) between January 2021
and January 2022. Blood was collected after obtaining written
informed consent from the participants. All patient consents were
provided by the participants themselves or their guardian. The
present study was performed in accordance with the Declaration of
Helsinki, and the study was approved (approval no. WDRY2020-K212)
by the Bioethics Committee of Renmin Hospital of Wuhan University
(Wuhan, China). Detailed clinicopathological data and qualified
blood samples were available for all participants. The sample
details are provided in Table I.
All samples were immediately stored at -80˚C until further
analysis. The workflow of the present study is presented in
Fig. 1.
 | Table IClinicopathological characteristics
of patients with oesophageal squamous cell carcinoma. |
Table I
Clinicopathological characteristics
of patients with oesophageal squamous cell carcinoma.
| | CR/PR (n=15) | SD/PD (n=16) |
|---|
| Age (%) | | |
|
<65 | 10 (66.7) | 8 (50.0) |
|
≥65 | 5 (33.3) | 8 (50.0) |
| Sex (%) | | |
|
Female | 2 (13.3) | 6 (37.5) |
|
Male | 13 (86.7) | 10 (62.5) |
| TNM stage (%) | | |
|
Stage I | 1 (6.7) | 0 (0.0) |
|
Stage
II | 2 (13.3) | 2 (12.5) |
|
Stage
III | 4 (26.7) | 8 (50.0) |
|
Stage
IV | 8 (53.3) | 6 (37.5) |
TM-widely targeted metabolomics.
Sample extraction
The steps for sample extraction were as follows: i)
The sample was removed from the -80˚C refrigerator and placed on
ice until no pieces of ice were observed in the sample (all
subsequent operations were required to be performed on ice). ii)
After thawing, the sample was shaken on a vortex mixer for 10 sec
to ensure thorough mixing, and then 50 µl of the sample was
transferred to a centrifuge tube numbered correspondingly. iii) A
metabolite extraction agent (300 µl, 20/80 acetonitrile/methanol
solution) containing internal standards was added to the centrifuge
tube, shaken on the vortex mixer for 3 min, and centrifuged at
1,609.92 x g for 10 min at 4˚C. iv) Following centrifugation, 200
µl of the supernatant was transferred into another correspondingly
numbered tube, which was then allowed to stand for 30 min at -20˚C
in the refrigerator. v) The aforementioned tube was centrifuged at
1,609.92 x g for 3 min at 4˚C, then 180 µl of supernatant was
transferred into the liner tube of the corresponding injection vial
for instrumental analysis.
LC-MS operating conditions for
metabolite detection
The samples were firstly analysed by a non-targeted
metabolite to enlarge the database for widely targeted metabolites.
Non-targeted metabolite detection was conducted using ultra
performance liquid chromatography (UPLC; ExionLC AD; https://sciex.com.cn/) coupled with quadrupole-time of
flight mass spectrometry (TripleTOF 6600; AB SCIEX). The operating
conditions of UPLC were as follows: ACQUITY HSS T3 columns (2.1x100
mm, 1.8 µm), 0.1% formic acid/water as mobile phase A, 0.1% formic
acid/acetonitrile as mobile phase B, column temperature of 40˚C,
flow rate of 0.35 ml/min, and injection volume of 5 µl.
The data acquisition instrumentation system for
widely targeted metabolomics primarily comprised a UPLC instrument
(ExionLC AD; https://sciex.com.cn/) coupled with a
tandem mass spectrometry (MS/MS) instrument (QTRAP®;
https://sciex.com/).
Chromatographic separation conditions were as
follows: i) a Waters ACQUITY UPLC HSS T3 C18 column (1.8 µm;
2.1x100 mm) as the chromatography column; ii) ultra-pure water
(containing 0.1% formic acid) as phase A and acetonitrile
(containing 0.1% formic acid) as phase B; iii) a mobile-phase
gradient with water/acetonitrile (V/V) of 95:5 at 0 min, 10:90 at
11.0 min, 10:90 at 12.0 min, 95:5 at 12.1 min, and 95:5 at 14.0
min; and iv) mobile-phase flow rate of 0.35 ml/min, column
temperature of 40˚C, and injection volume of 2 µl.
MS conditions
The electrospray ionization (ESI) source temperature
was 500˚C, with an ion spray voltage of 5,500 V for the positive
mode and -4,500 V for the negative mode. The ion source gas I (GS
I) and gas II (GS II) pressures were both 50 psi, and the curtain
gas (CUR) pressure was 25 psi. Collision-activated dissociation
(CAD) parameters were set to high values. In the triple quadrupole
(Qtrap), each ion pair was scanned for detection based on the
optimized declustering potential (DP) and collision energy
(CE).
Widely targeted lipidomics. Sample
extraction
The steps for sample extraction were as follows: i)
The sample was removed from the -80˚C refrigerator and placed on
ice until no pieces of ice were observed in the sample. ii) After
thawing, the sample was shaken on a vortex mixer for 10 sec to
ensure thorough mixing, and then 50 µl of the sample was
transferred to a centrifuge tube numbered accordingly. iii) To the
centrifuge tube 1 ml of lipid extraction buffer (methyl tert-butyl
ether/methanol=3:1, V/V) was added containing internal standards,
followed by shaking the resulting mixture on a vortex mixer for 15
min. iv) To the above mixture 200 µl of water was added, and the
new mixture was shaken on a vortex mixer for 1 min, followed by
centrifugation at 1,609.92 x g for 10 min at 4˚C. v) Following
centrifugation, 200 µl of the supernatant was transferred into a
correspondingly numbered centrifuge tube and concentrated until
completely dry. vi) To the aforementioned centrifuge tube, 200 µl
of mobile phase B was added, and the mixture was shaken on a vortex
mixer for 3 min, followed by centrifugation at 1,609.92 x g for 10
min at 4˚C, and then by sampling of the supernatant for LC-MS/MS
analysis.
Data acquisition conditions of
metabolites
The data acquisition instrumentation system
consisted primarily of a UPLC instrument (ExionLC AD) coupled with
a tandem mass spectrometry (MS/MS) instrument
(QTRAP®).
Liquid phase conditions were mainly the following:
i) A Thermo Accucore™ C30 column (2.6 µm, 2.1x100 mm) as
the chromatography column; ii) acetonitrile/water (60/40, V/V;
containing 0.1% formic acid and 10 mmol/l ammonium formate) as
mobile phase A, and acetonitrile/isopropanol (10/90, V/V)
(containing 0.1% formic acid and 10 mmol/l ammonium formate) as
mobile phase B; iii) a mobile-phase gradient with A/B (V/V) of
80:20 at 0 min, 70:30 at 2 min, 40:60 at 4 min, 15:85 at 9 min,
10:90 at 14 min, 5:95 at 15.5 min, 5:95 at 17.3 min, 80:20 at 17.5
min, and 80:20 at 20 min; iv) a mobile-phase flow rate of 0.35
ml/min, column temperature of 45˚C, and injection volume of 2
µl.
MS conditions were mainly the following: The ESI
source temperature was 500˚C, with an ion spray voltage of 5,500 V
for the positive mode and -4,500 V for the negative mode. The ion
source GS I and GS II pressures were 45 psi and 55 psi,
respectively, and the CUR pressure was 25 psi. CAD parameters were
set to medium values. In the Qtrap, each ion pair was scanned for
detection based on the optimized DP and CE.
Metabolite identification and
quantification and data analysis
After MS data were analysed with software Analyst
1.6.3 (AB SCIEX), substances were accurately identified by
mass-to-charge ratio (m/z) and RT of multiple ion pairs and second
spectra of the identified metabolites using the self-built target
standard database MWDB (including secondary spectra and RT), the
public MHK database compiled by Metware [comprising Metlin, Human
Metabolome Database (HMDB), and KEGG databases and including
secondary spectra and RT], and the MetDNA algorithm.
After screening the characteristic ions of each
substance by triple quadrupole, the signal strength of
characteristic ions in the detector was obtained. Subsequently,
through integrating and correcting chromatographic peaks using the
software MultiQuant (version 3.0.3; AB SCIEX), the relative content
of the corresponding substance represented by the area of each
chromatographic peak, was obtained.
Significantly regulated metabolites between groups
were determined by variable importance in projection (VIP) ≥1 and
absolute Log2FC ≥1.5 or ≤0.67. VIP values were extracted from
Orthogonal Partial Least Squares Discriminant Analysis (OPLS-DA)
results, which also contain score plots and permutation plots, and
permutation plots were generated using R package MetaboAnalystR
(version 1.0.1; https://www.metaboanalyst.ca/). The data was log
transformed (log2) and mean centering was performed before OPLS-DA.
In order to avoid overfitting, a permutation test (200
permutations) was performed. Metabolite annotation was performed
based on the KEGG compound database (http://www.kegg.jp/kegg/compound/).
Quantitative proteomics. Sample
extraction
Lysis solution (8 M urea/100 mM Tris-Cl) was added
to the sample. The resulting mixture was sonicated in a water bath
and incubated with dithiothreitol (DTT) for 1 h at 37˚C. Next,
iodoacetamide (IAA) was added and the alkylation reaction was
allowed to take place at room temperature in the dark to block the
sulfhydryl groups. Protein concentration was determined using the
Bradford method. After protein quantification, 50 µg of the protein
sample was used for sodium dodecyl-sulphate polyacrylamide gel
electrophoresis (5% concentrated gel; 12% separation gel), which
was based on observation of Coomassie brilliant, blue-stained
protein bands. After sample reduction and alkylation, 100 mM
Tris-HCl was added to the sample to dilute the urea concentration
to <2 M. Trypsin was added at an enzyme-to-protein mass ratio of
1:50 and the mixture was incubated overnight at 37˚C for enzymatic
protein cleavage, which was terminated the next day by adding 10%
TFA. The supernatant was desalted with Sep-Pak C18, suction-dried,
and stored at -20˚C for later use.
MS detection
MS data were acquired using an Orbitrap Exploris 480
mass spectrometer in tandem with an EASY-nLC 1200 LC system (Thermo
Fisher Scientific, Inc.). Peptide samples were solubilized by a
loading buffer, aspirated by an autosampler, and loaded to an
analytical column (75 µm x25 cm, C18, 1.9 µm, 100 Å) for
separation. Two mobile phases (mobile phase A, 0.1% formic acid;
mobile phase B, 0.1% formic acid with 80% acetonitrile) were used
in a gradient. The flow rate of each liquid phase was set to 300
nl/min. MS data were acquired in DIA mode, with each scan cycle
consisting of one MS1 scan (R=60K, AGC=3e6, Max IT=30 msec, scan
range=350-1,250 m/z) and 40 MS2 scans of variable windows (R=30K,
AGC=1,000%, Max IT=50 msec). High field asymmetric waveform ion
mobility spectrometry (FAIMS) was operated (CV-45) and the
collision energy was set to 30.
Data analysis
Raw DIA data were analysed using software DIA-NN
(v1.8) (32) according to the
following steps: i) A spectral library was predicted from the
Swiss-Prot human database (which was reviewed on March 12, 2021) by
using the DL algorithm of DIA-NN; ii) protein and peptide ions were
identified from the predicted library using the match between run
(MBR) algorithm with the raw DIA data; iii) the protein and peptide
ion identifications were filtered at a 1% false discovery rate
(FDR) to obtain quantitative proteomic information for subsequent
analysis.
A sample reproducibility test was performed using
PCA analysis and correlation coefficient analysis (Pearson
correlation test) based on the relative quantification results of
protein. The mean expression level of a given protein across all
biological replicates in one group was divided by the counterpart
in the other group, and the ratio was defined as the fold change
(FC), with FC <0.67 or FC >1.5 as the threshold for
differential expression of proteins in the two groups. A T-test on
the FC data, with P<0.05 considered indicative of statistical
significance, was performed to identify differentially expressed
proteins DEPs. Functional enrichment analysis of DEPs was performed
to identify the Gene Ontology (GO; http://www.geneontology.org/) categories and KEGG
pathways (clusterProfiler 3.10.1; https://bioconductor.org/packages/release/bioc/html/clusterProfiler.html).
Results
Metabolomic changes in the SD/PD group
relative to the CR/PR group
Widely targeted metabolomics and lipidomics were
performed on the plasma samples of the CR/PR and PD/SD groups of
patients with OSCC to elucidate the metabolomic differences between
the two groups. A total of 904 metabolites belonging to the lipid
family, including sterol lipid, fatty acyl class, glycerol
phospholipids, sphingolipid, and glyceride class were identified by
wildly targeted lipids. A total of 1,517 metabolites were detected
by TM-widely targeted metabolomics, including bile acids, amino
acid, phenolic acids, nucleotide, and its metabolites.
As shown in the volcano plot, a total of 16
downregulated metabolites and 47 upregulated metabolites were
detected by widely targeted lipidomics (Fig. 2A). The upregulated differentially
expressed metabolites were mainly Carnitine C6:1, TG(16:0 22:6),
PC(14:0-20:5), LNAPE(20:5/N-18:1), TG(10:0-12:0_14;0),
PC(15:0_20:5), TG(14:0,_14:1_18:1), PI(18: 0,_20:5), PE(20:5_18:1),
and PE(16:0_20:5), and the downregulated differentially expressed
metabolites were mainly LPI(20:3/0:0), PE(18:2,_19:1),
PC(15:0_20:3), Carnitine C10:1-OH, PC(O-18:1_18;2),
PC(O-18:0-20:3), TXB2, PE(O-17:1_20:4), PI(18:1_20:2), and
PE(P-17:0_20:4; (Fig. 2B). KEGG
enrichment analysis of the differentially expressed metabolites
showed that these were mainly enriched in the primary bile acid
biosynthesis pathway and the bile secretion pathway, as well as the
cholesterol metabolism pathway (Fig.
2C). This suggests that the poor prognosis of patients in the
SD/PD group may be related to these three pathways.
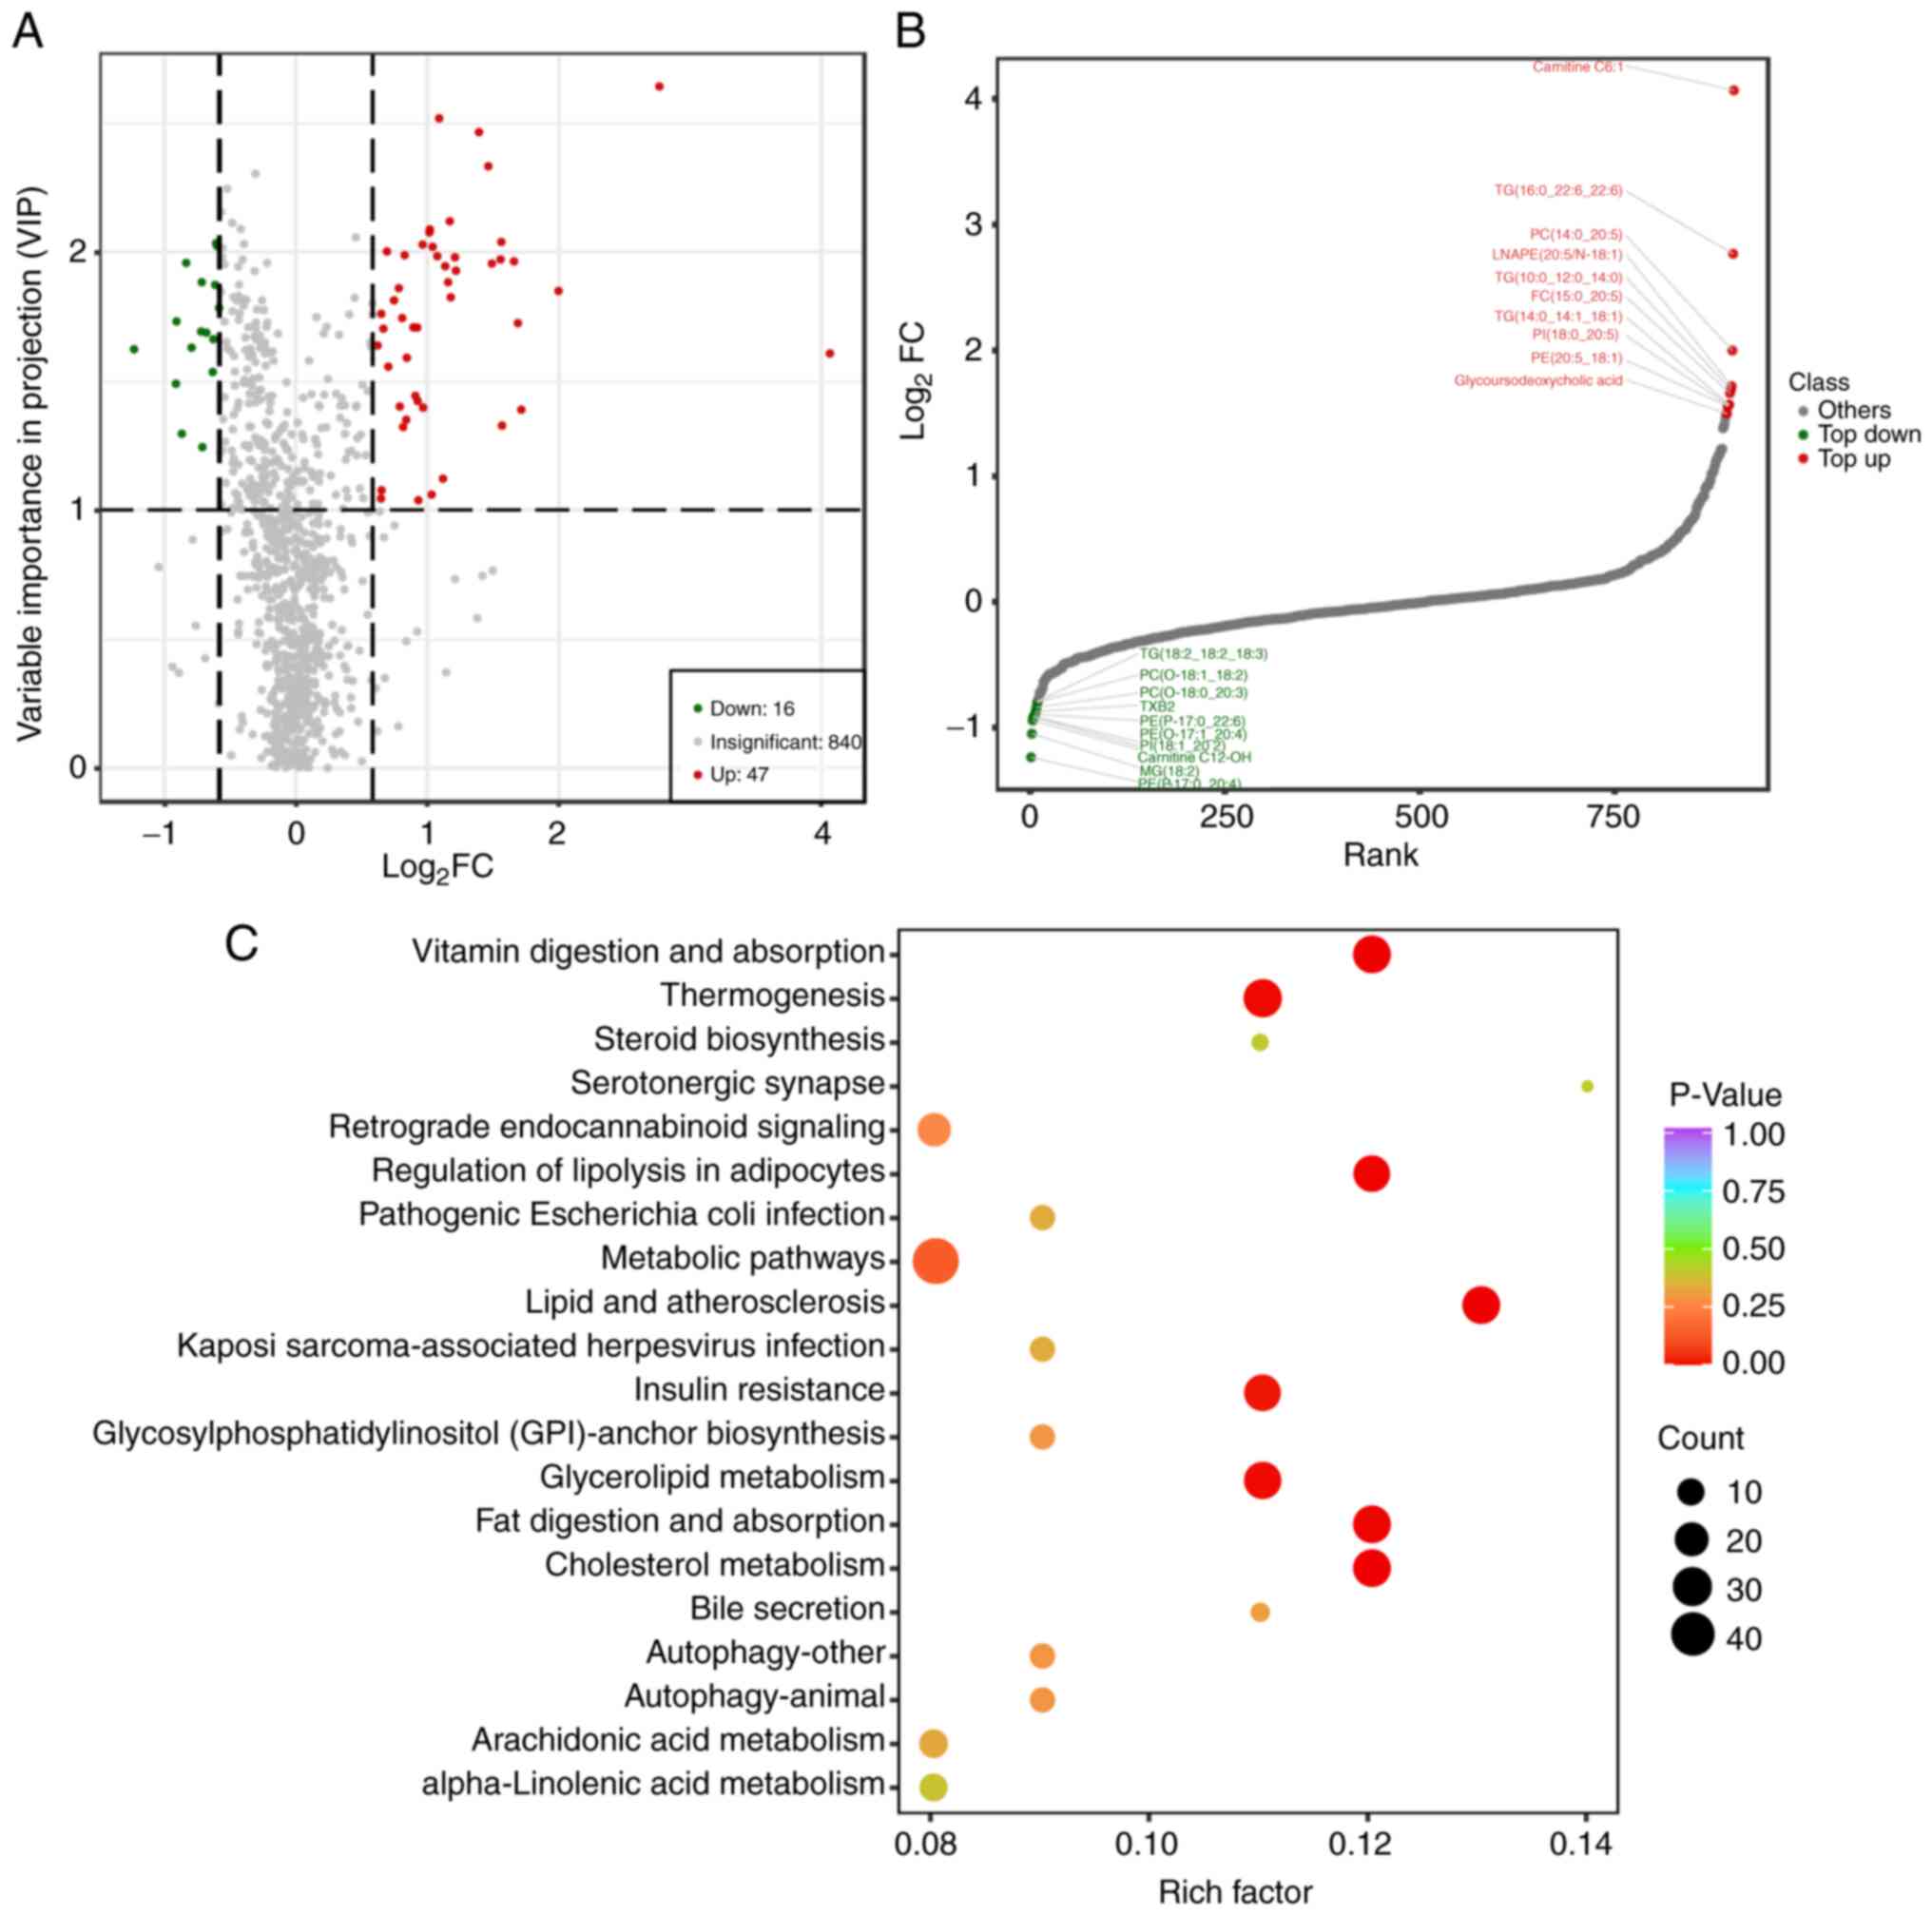 | Figure 2Metabolic change analysis of stable
disease/progressive disease vs. complete response/partial response
using TM-widely targeted metabolomics. (A) The volcano plot shows
the DEMs in the two groups. Each dot in the volcano map represents
a metabolite, with the green dots representing downregulated
differential metabolites, the red dots representing upregulated
differential metabolites, and the grey dots representing detected
but not significantly different metabolites. The x-coordinate
represents the logarithmic value (log2FC) of the multiple of the
relative content difference of a certain metabolite in the two
groups of samples. The greater the absolute value of the
x-coordinate is, the greater the relative content difference of the
substance between the two groups of samples. Under VIP + FC (fold
change) double screening conditions: The ordinate represents the
VIP value, and the larger the ordinate value, the more significant
the difference, and the more reliable the differentially expressed
metabolites obtained by screening. (B) The top 10 up- and
downregulated DEMs of the two groups. The horizontal coordinate
represents the cumulative number of substances ordered according to
the difference multiple from the smallest to the largest, and the
vertical coordinate represents the pair value with the difference
multiple as base 2. Each point represents a substance; the green
points represent the top 10 downregulated substances, and the red
points represent the top 10 upregulated substances. (C) The Kyoto
Encyclopedia of Genes and Genomes pathway enrichment analysis of
the DEMs. The rich factor is the ratio of the number of DEMs in the
corresponding pathway to the total number of metabolites detected
by the pathway. The higher the value, the greater the enrichment
degree. The abscissa represents the rich factor corresponding to
each pathway; the ordinate represents the pathway name; the colour
of the dots is the P-value; the redder it is, the more significant
the enrichment is. The size of the dot represents the number of
enriched differential metabolites. DEMs, differentially expressed
metabolites; VIP, variable importance in projection. |
Moreover, widely targeted metabolomics showed that a
total of 74 metabolites were downregulated and 60 metabolites were
upregulated (Fig. 3A). The top ten
up or downregulated metabolites are shown in Fig. 3B. KEGG enrichment analysis of the
differentially expressed metabolites showed that these were mainly
enriched in the ‘NF-kappaB signaling pathway’, the ‘primary bile
acid biosynthesis’, the ‘cholesterol metabolism’ (Fig. 3C), suggesting that the poor
prognosis of patients in the SD/PD group may be related to these
pathways.
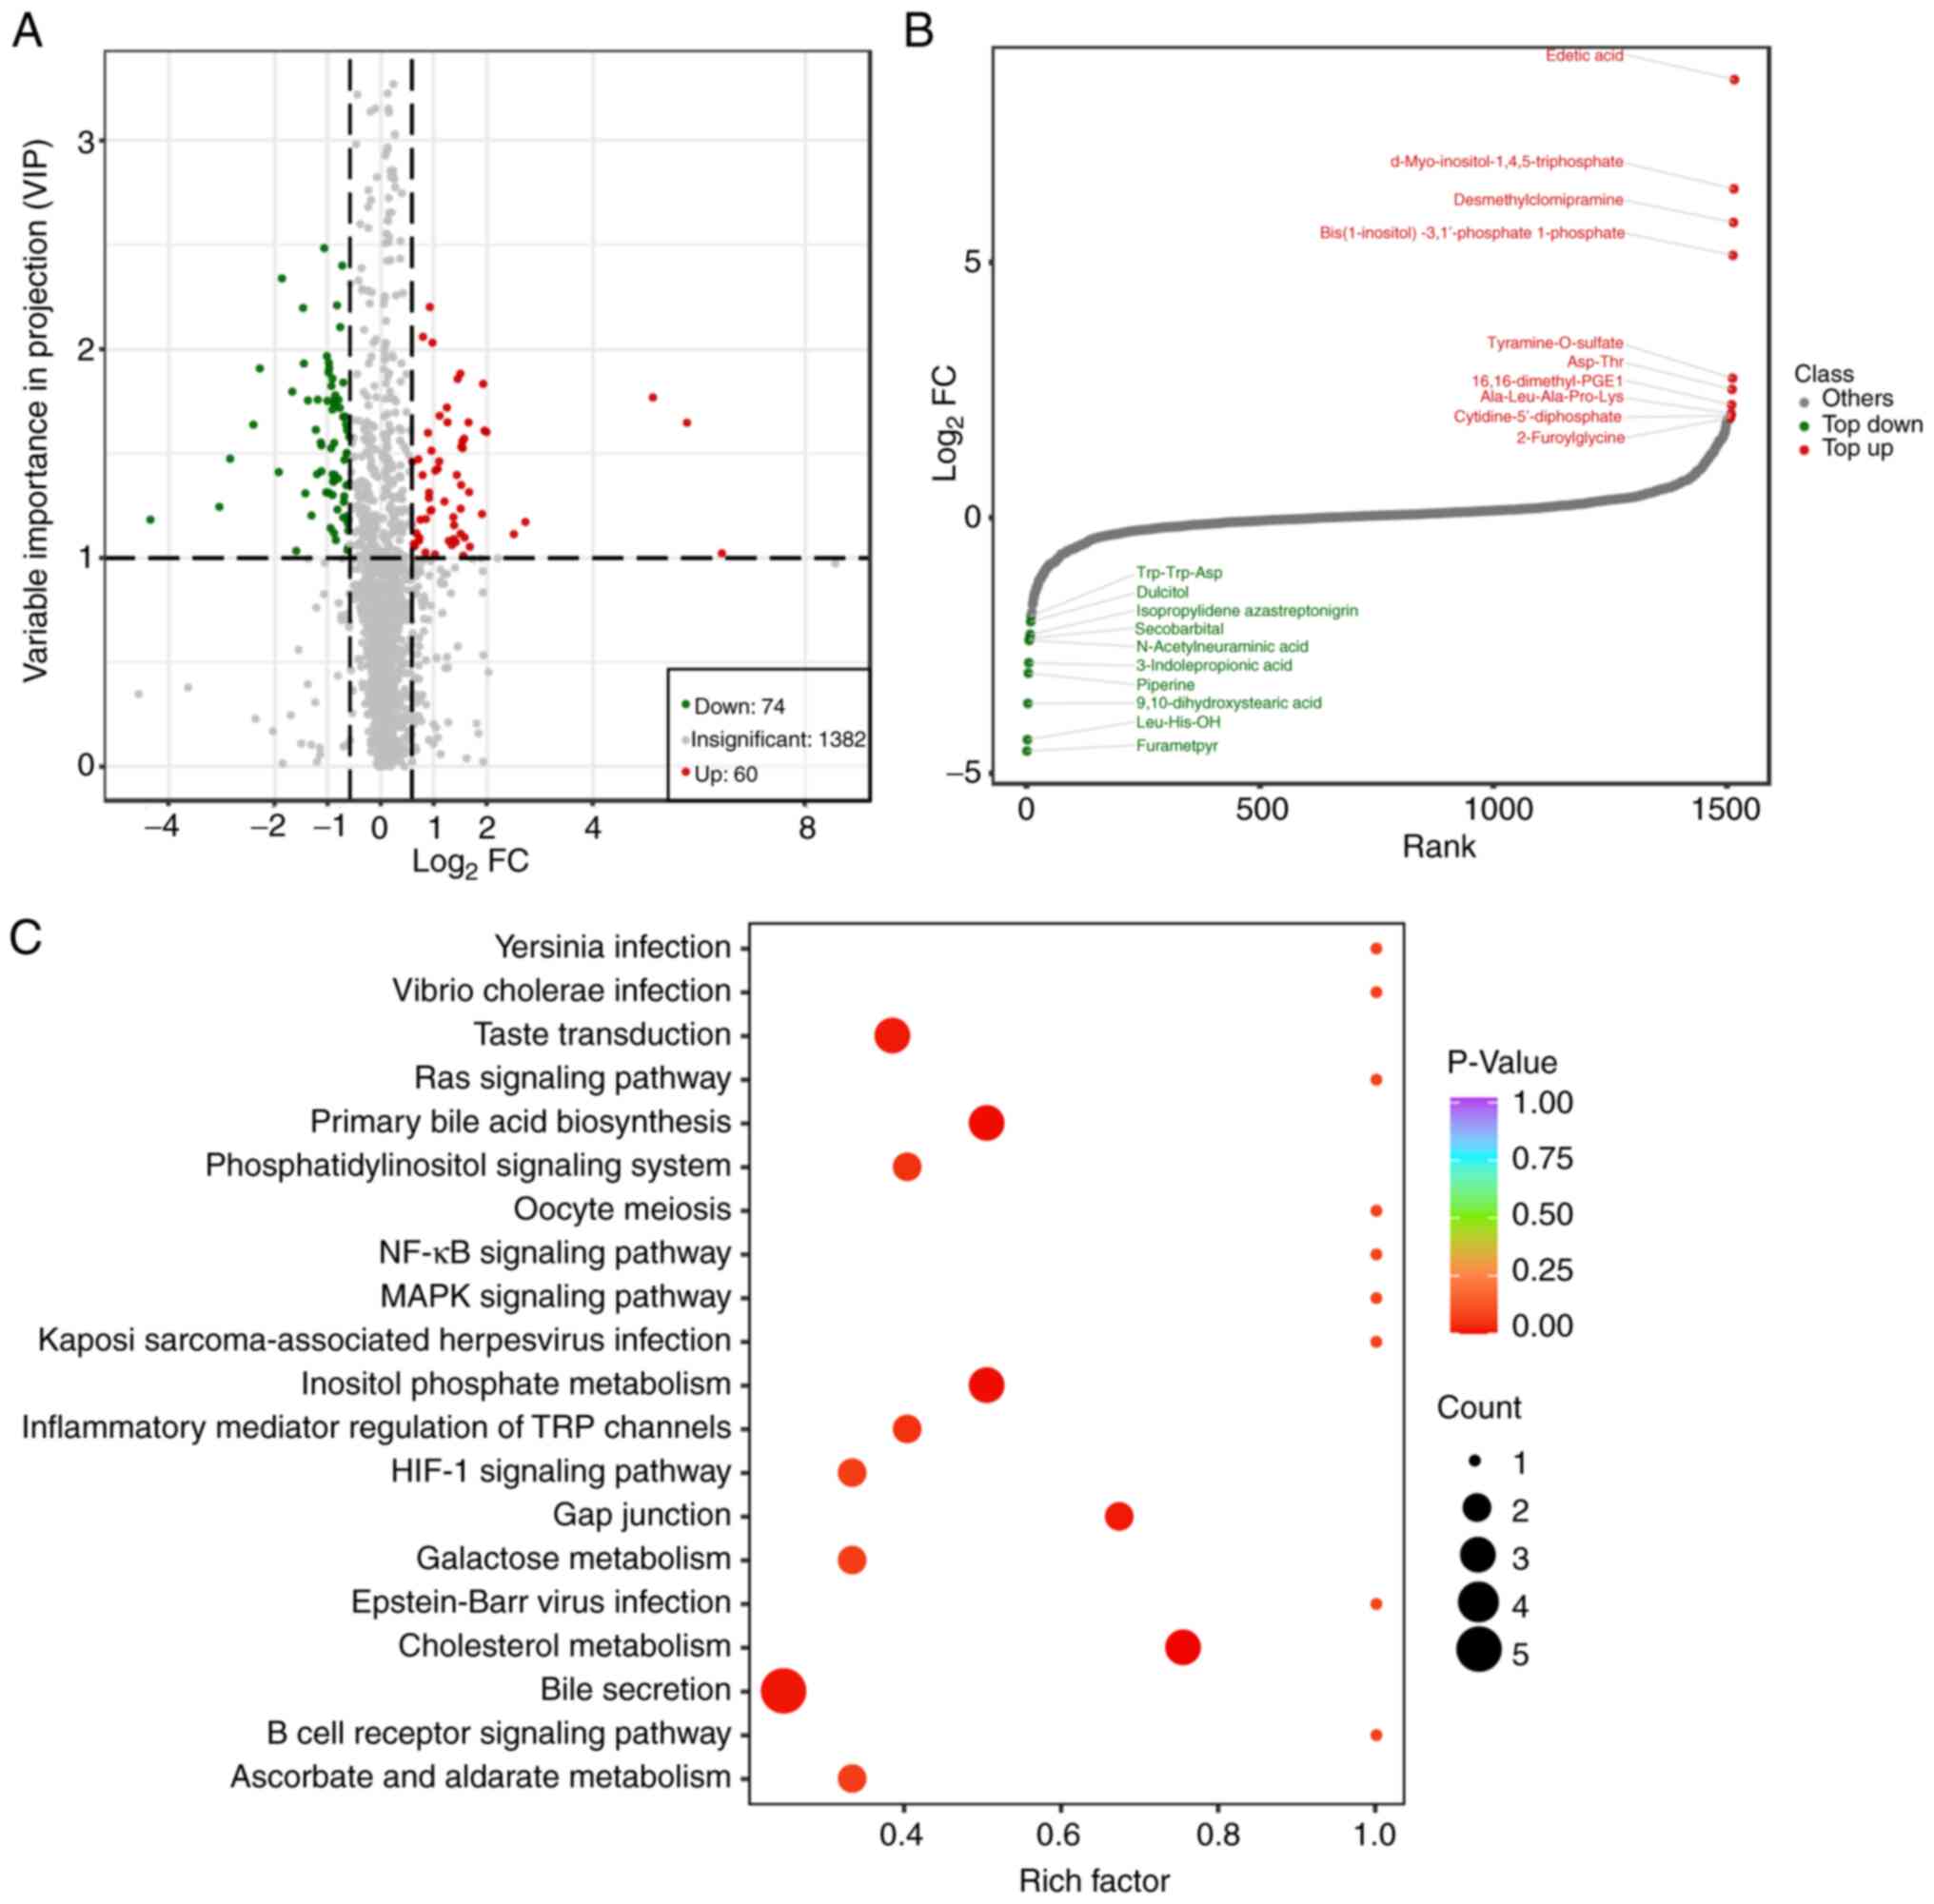 | Figure 3Metabolic change analysis of stable
disease/progressive disease vs. complete response/partial response
using widely targeted lipidomics. (A) The Volcano plot shows the
DEMs in the two groups. Each dot in the volcano map represents a
metabolite, with the green dots representing downregulated
differential metabolites, the red dots representing upregulated
differential metabolites, and the grey dots representing detected
but not significantly different metabolites. The x-coordinate
represents the logarithmic value (log2FC) of the multiple of the
relative content difference of a certain metabolite in the two
groups of samples. The greater the absolute value of the
x-coordinate is, the greater the relative content difference of the
substance between the two groups of samples. Under VIP + FC (fold
change) double screening conditions: The ordinate represents the
VIP value, and the larger the ordinate value, the more significant
the difference, and the more reliable the DEMs obtained by
screening. (B) The top10 up- and downregulated DEMs of the two
groups. The horizontal coordinate represents the cumulative number
of substances ordered according to the difference multiple from the
smallest to the largest, and the vertical coordinate represents the
pair value with the difference multiple as base 2. Each point
represents a substance; the green points represent the top 10
downregulated substances, and the red points represent the top 10
upregulated substances. (C) The Kyoto Encyclopedia of Genes and
Genomes pathway enrichment analysis of the DEMs. The rich factor is
the ratio of the number of DEMs in the corresponding pathway to the
total number of metabolites detected by the pathway. The higher the
value, the greater the enrichment degree. The abscissa represents
the rich factor corresponding to each pathway; the ordinate
represents the pathway name; the colour of the dots is the P-value;
the redder it is, the more significant the enrichment is. The size
of the dot represents the number of enriched differential
metabolites. DEMs, differentially expressed metabolites; VIP,
variable importance in projection. |
Proteomic changes of the SD/PD and
CR/PR groups after immunotherapy
Quantitative proteomic analysis was performed on the
plasma samples of both groups to elucidate the proteomic changes in
the SD/PD group. MS data were acquired using the DIA mode, which
combined the advantages of traditional shotgun proteomics with
those of the selected/multiple reaction monitoring (SRM/MRM)
technique, a technique considered as the ‘gold standard’ for
MS-based absolute quantification. The entire scan range of the mass
spectrometer was divided into several windows by m/z, and all
parent ions in each window were then fragmented and detected,
followed by collecting and using the fragmentation information of
all parent ions for protein characterization and quantification.
First of all, data were searched against the Swiss-Prot Human
database and the results were filtered at 1% FDR, which identified
12,365 peptides and 1,535 proteins. Second, 113 differentially
expressed proteins were identified, comprising 50 upregulated
proteins and 63 downregulated proteins (Fig. 4A). For better observation of protein
change patterns, proteins with significant differential expression
were normalized and a clustered heat map was generated. This showed
that protein expression profiles were significantly different
between the CR/PR and SD/PD groups (Fig. 4B). Next, all differentially
expressed proteins were subjected to enrichment analysis for GO
categories using ClusterProfiler (33) and the results are shown in Fig. 4C. KEGG pathway enrichment analysis
revealed that differentially expressed proteins were mainly
enriched in the ‘PI3K-Akt signaling pathway’, the ‘NF-kappaB
signaling pathway’, and the ‘phospholipase D signaling pathway’
(Fig. 4D).
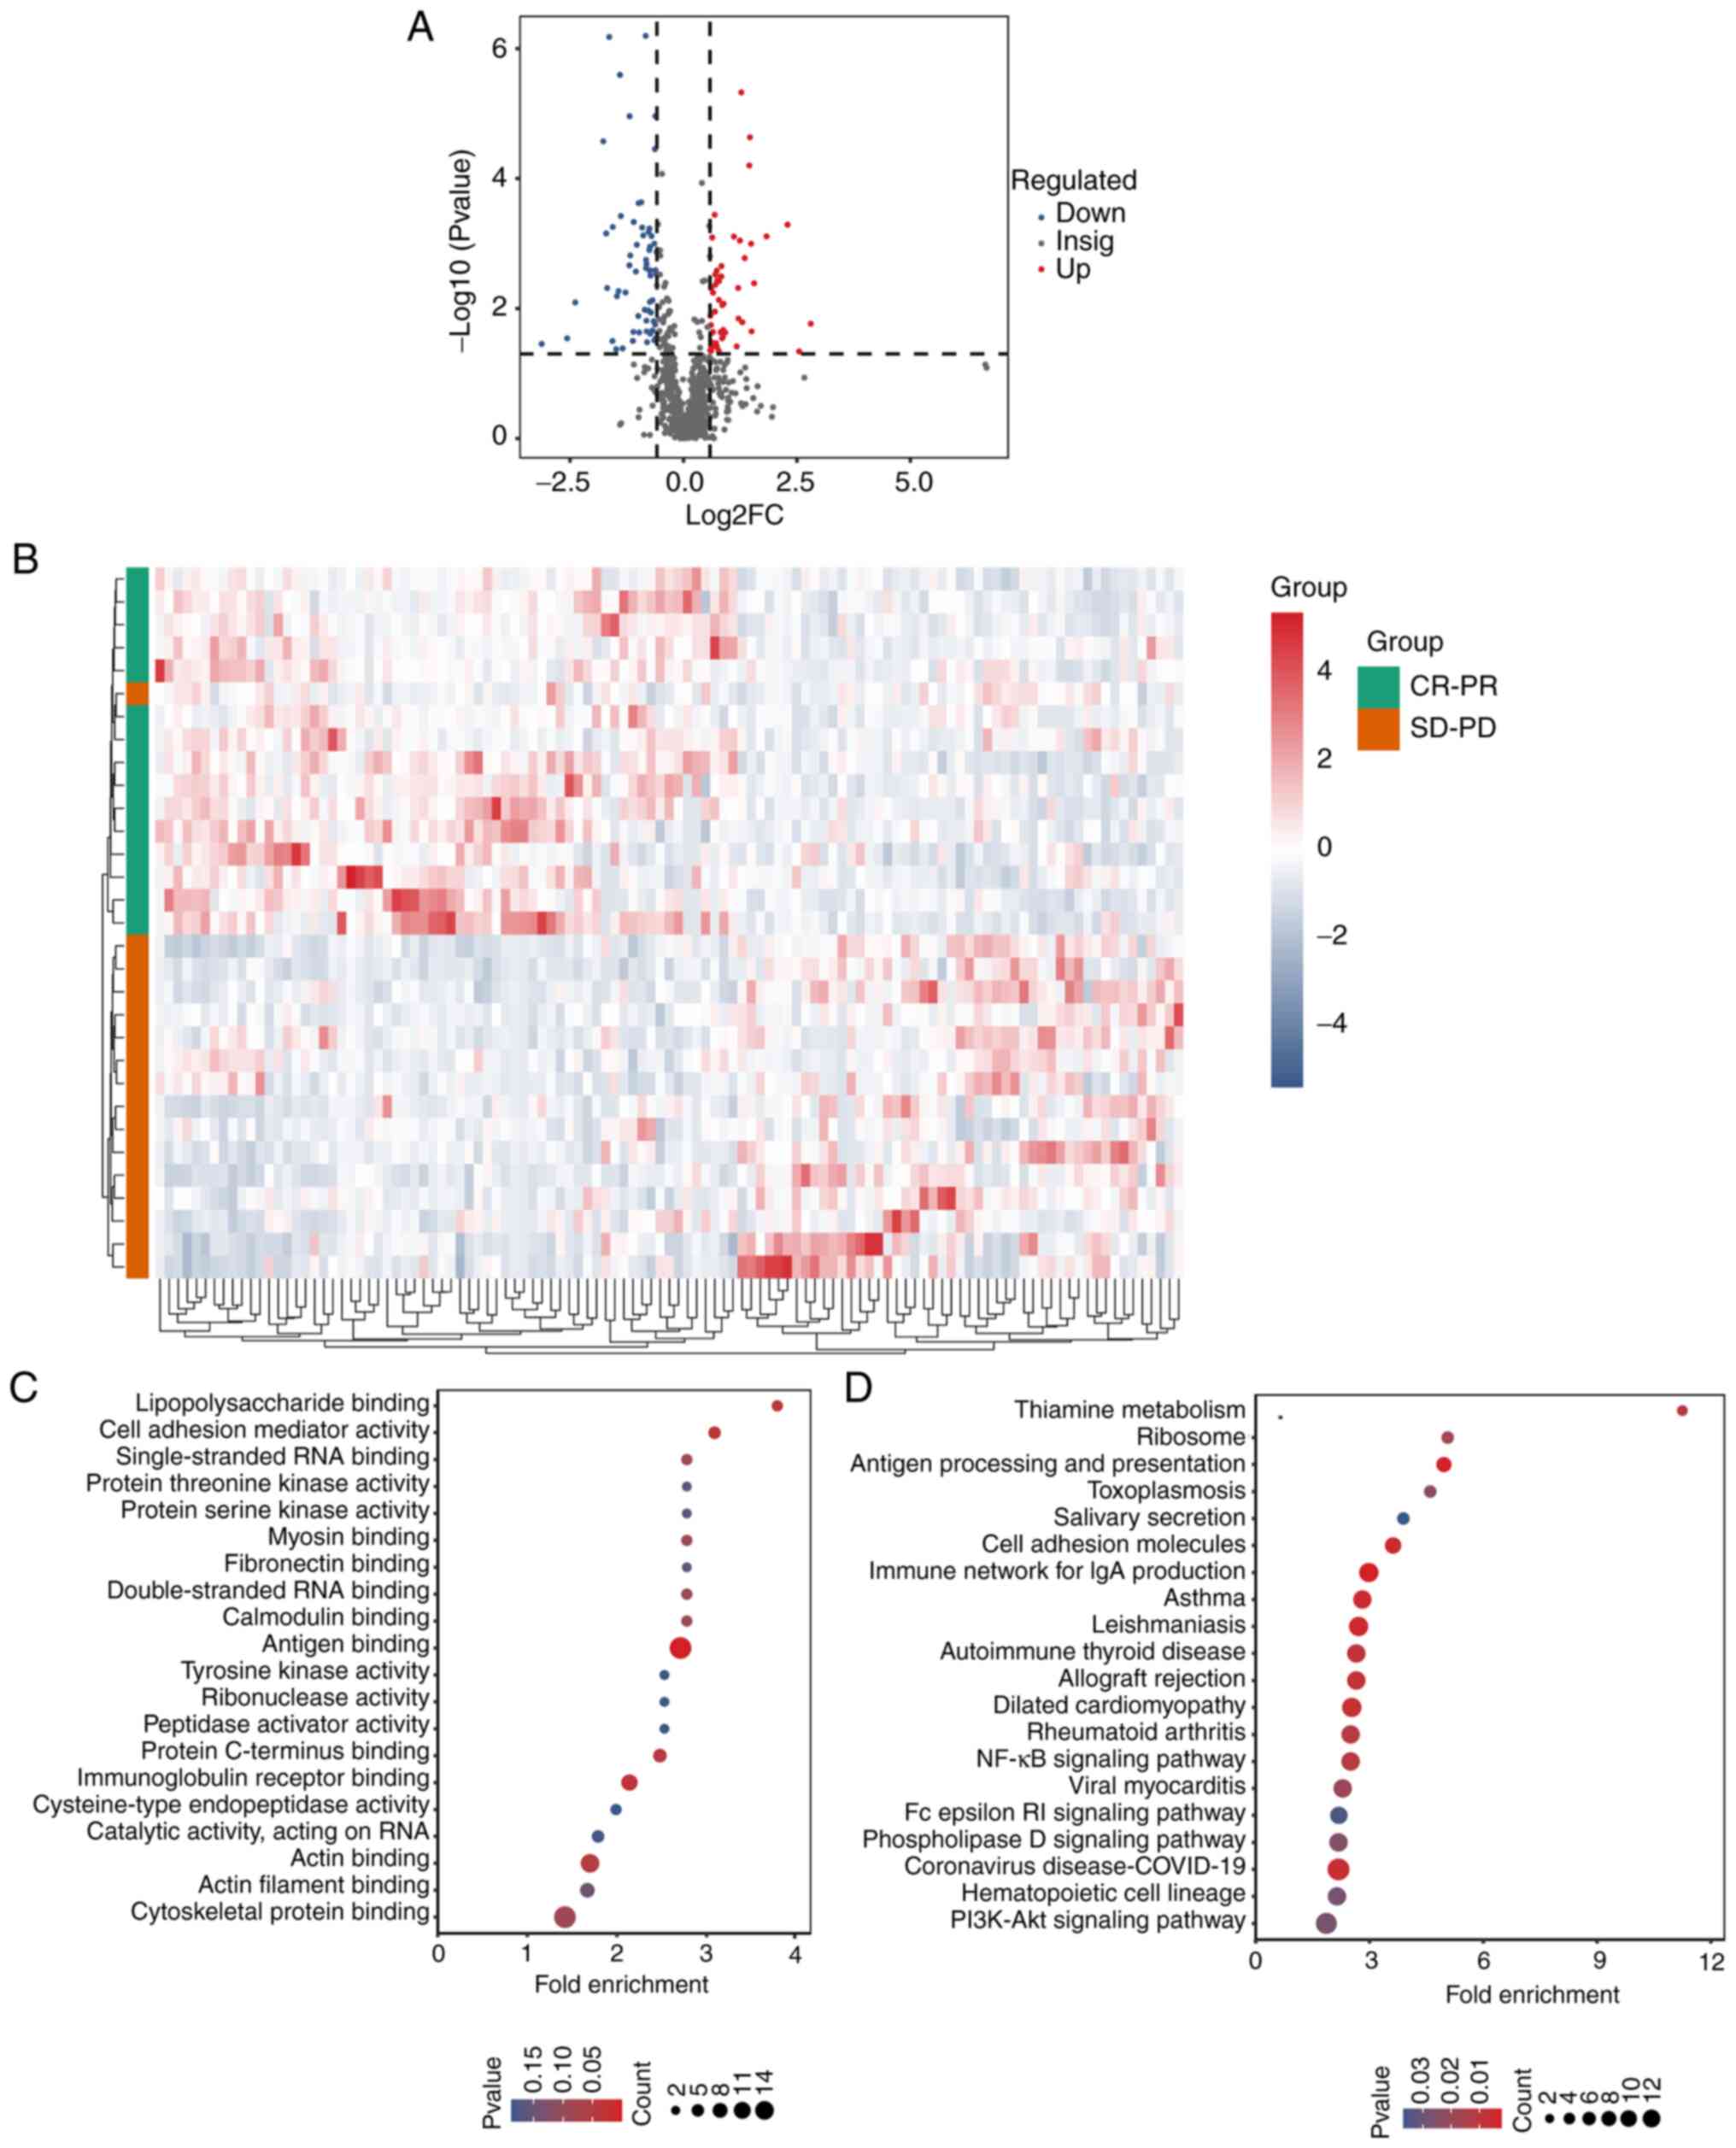 | Figure 4Protein profiling changes of stable
disease/progressive disease vs. complete response/partial response
using quantitative proteomics. (A) The volcano plot shows the DEPs
in the two groups. The horizontal coordinate represents log2FC, the
vertical coordinate represents-log10(P-value), the red and blue
scatter plots represent the upregulated and downregulated proteins,
respectively, and the dark grey scatter plots represent the
non-significantly expressed proteins. (B) The heat map of the
protein profiling of the two groups. The row represents the protein
cluster, the column represents the sample cluster, and the shorter
the cluster branch, the larger the similarity. (C) The top 20 GO
biological processes of the DEPs. The x-coordinate represents the
enrichment ratio (GeneRatio/BgRatio). The greater the enrichment
ratio, the greater the degree of enrichment of the differential
protein. The y-coordinate represents the enriched GO items. The
change of dot colour from blue to red represents the change in the
P-value from large to small. The smaller the P-value, the more
statistically significant it is. The size of the dot represents the
number of different proteins annotated by the corresponding item.
(D) The top 20 KEGG pathways of the DEPs. The x-coordinate
represents the enrichment ratio (GeneRatio/BgRatio). The larger the
enrichment ratio is, the higher the enrichment degree of
differential protein is. The y-coordinate represents the enriched
KEGG pathway. The change of dot colour from blue to red represents
the change of the P-value from large to small. The smaller the
P-value is, the more statistically significant it is. The size of
the dot represents the number of different proteins in the
corresponding functional annotation. DEPs, differentially expressed
proteins; GO, Gene Ontology; KEGG, Kyoto Encyclopedia of Genes and
Genomes; SD-PD, stable disease-progressive disease; CR-PR, complete
response-partial response. |
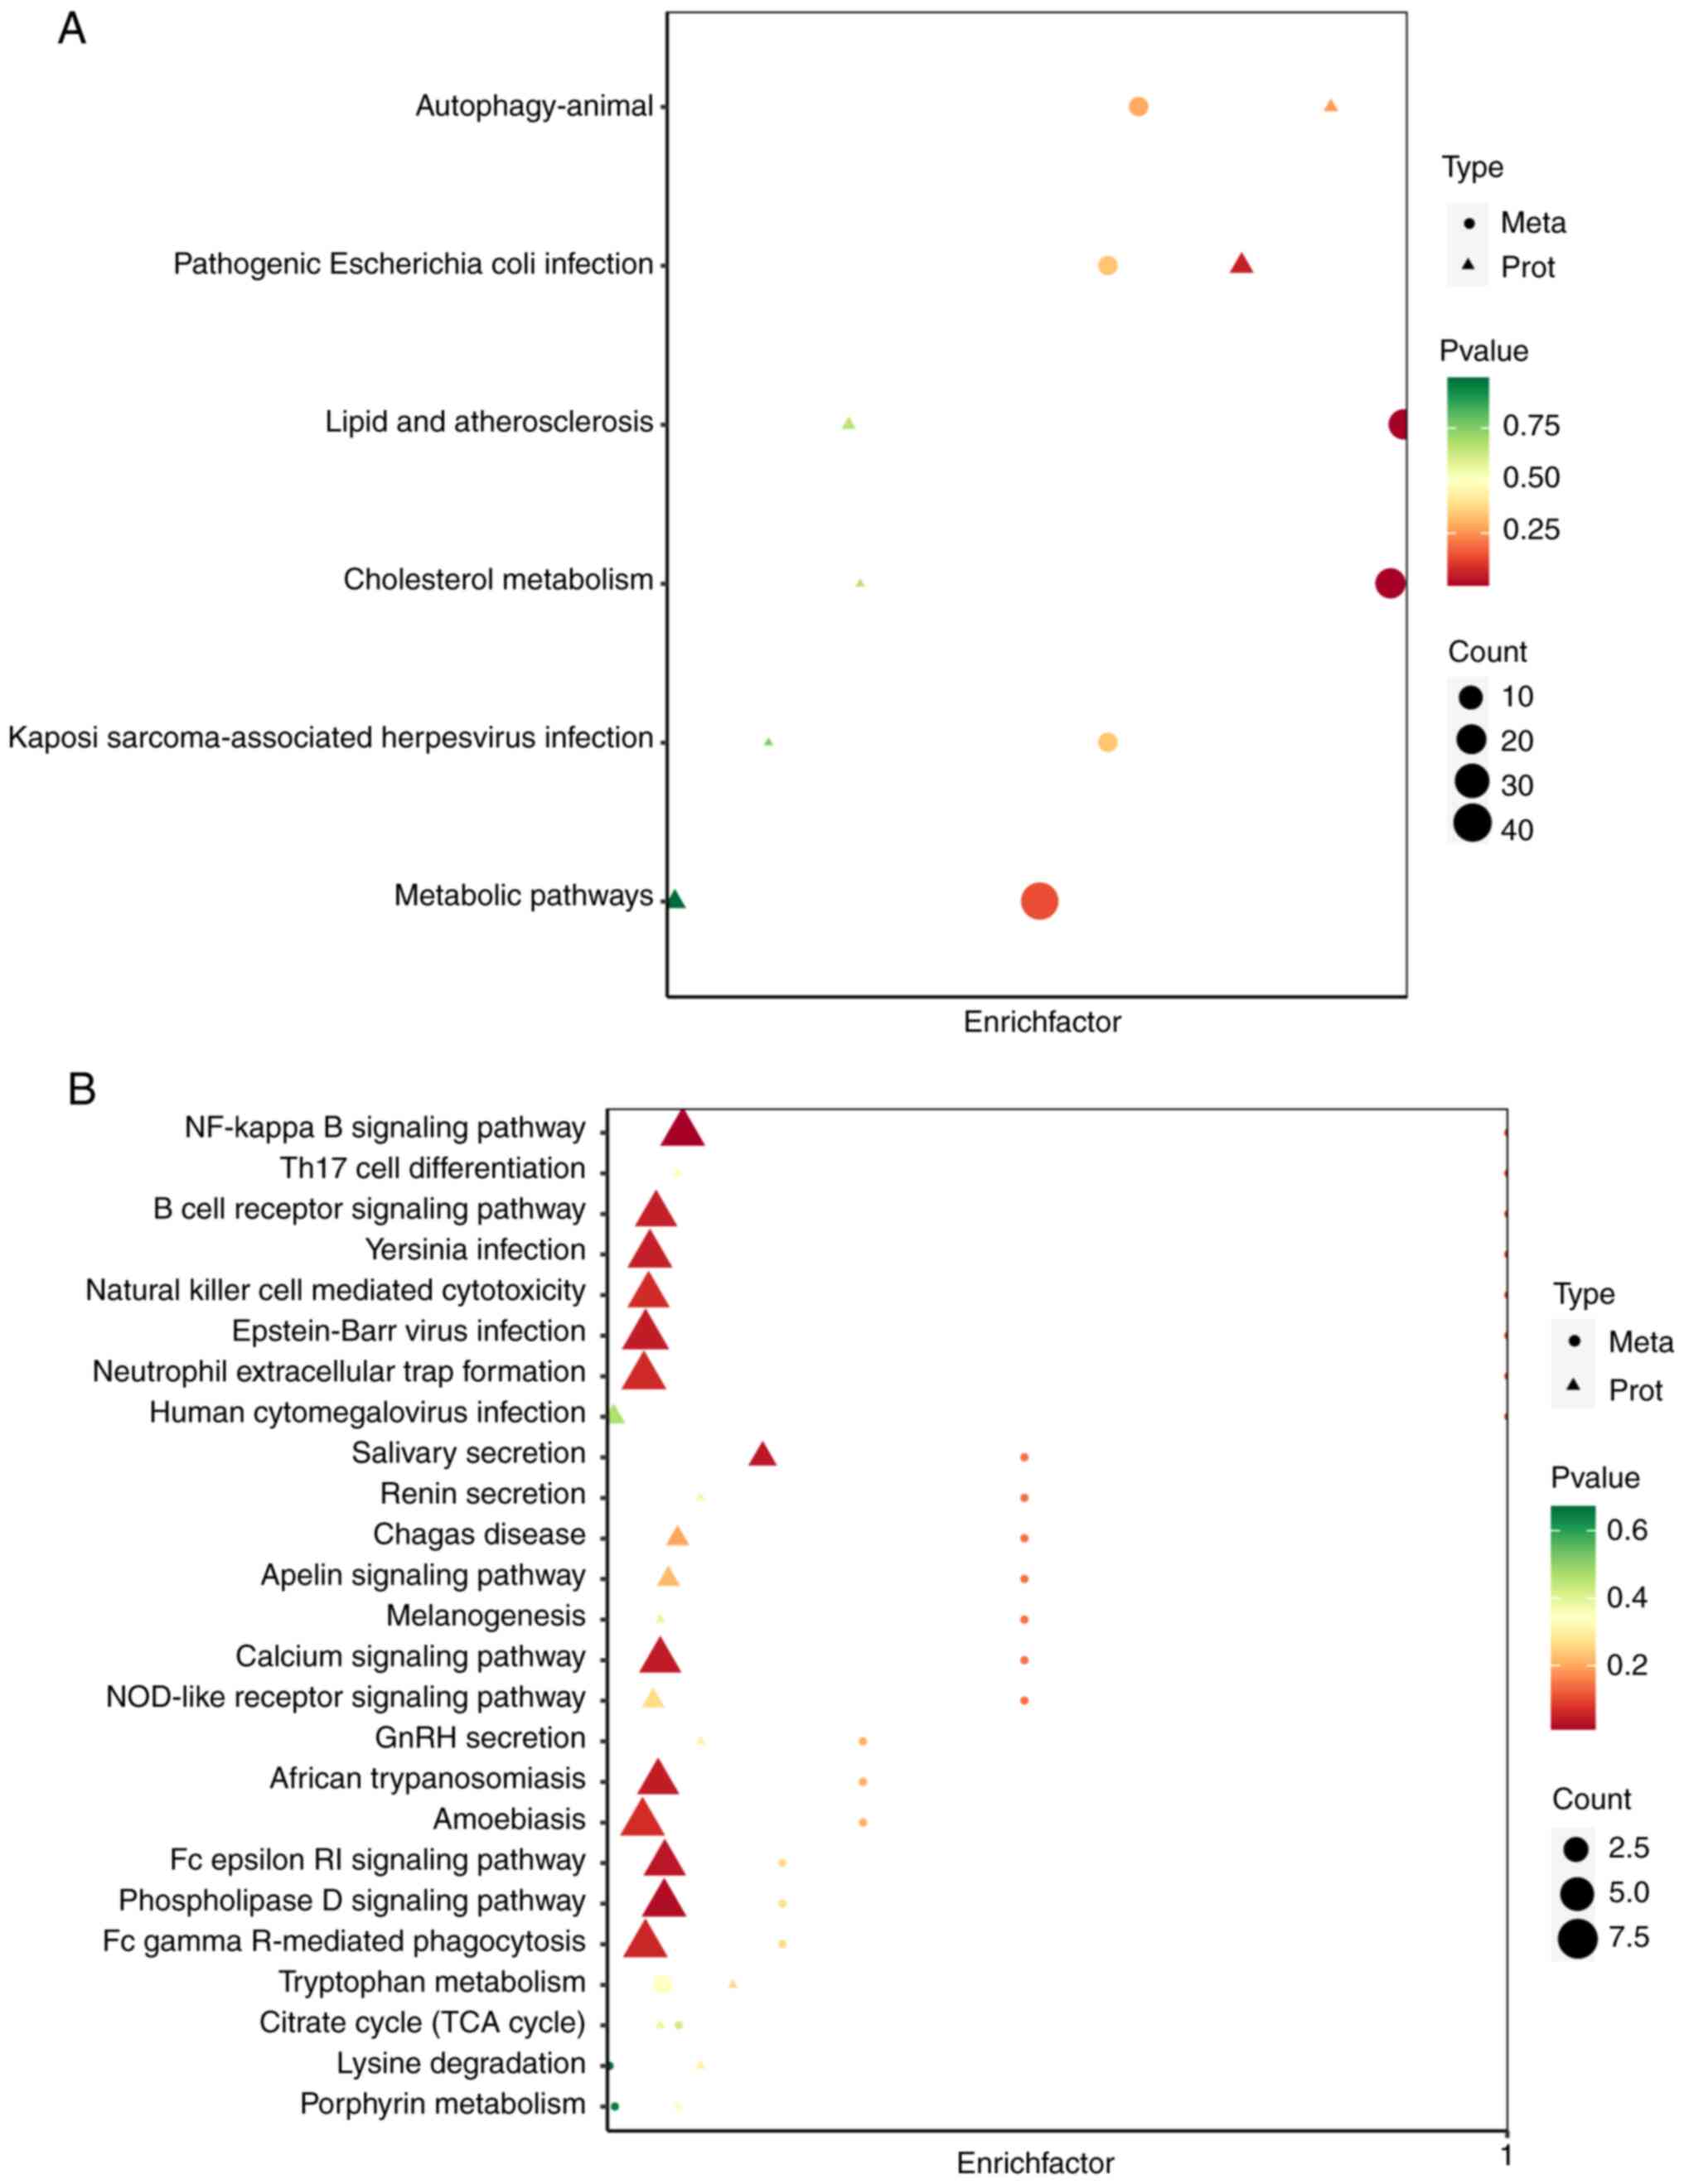
Combined metabolomic and proteomic
analysis
Correlation analysis between proteomic and
metabolomic data was performed to elucidate the mutual regulatory
relationship between differentially expressed proteins and
metabolites. First of all, the common KEGG pathways wherein both
differentially expressed proteins and metabolites were enriched
were identified according to KEGG pathway enrichment analysis. The
combined analysis of widely targeted proteomic and lipidomic data
showed that DEMs and DEPs were enriched in the ‘cholesterol
metabolism’ pathway (Fig. 5A). The
combined analysis of widely targeted metabolomic and proteomic data
showed that DEPs and DEMs were enriched in the ‘NF-kappaB signaling
pathway’ and in the ‘phospholipase D signaling pathway’ (Fig. 5B). The results indicated that the
PD-1 monoclonal antibody resistance may be attributed to the three
metabolic signalling pathways.
Cholesterol metabolism, NF-kappaB, and
phospholipase D signalling pathway analysis
Considering that cholesterol metabolism, NF-kappaB,
and phospholipase D signalling pathways play important roles in
PD-1 monoclonal antibody resistance in patients with OSCC, the
enrichment of DEMs and DEPs was then analysed in these pathways in
detail. The heatmap showed that the expression of triglyceride,
cholesteryl ester, and apolipoprotein H (APOH) was upregulated in
the SD/PD group (Fig. 6A),
indicating that the cholesterol metabolism signalling pathway was
correlated with the poor prognosis of patients with OSCC treated
with immunotherapy combined with chemotherapy. The expression of
IGHV6-1, IGHV3-72, IGHV1-18, IGHV3-11, IGHV2-70, IGHV1-2, LY96,
IGHV2-5, KIT and d-myo-inositol-1,4,5-triphosphate enrichment in
the NF-kappaB and phospholipase D signalling pathway was also
upregulated (Fig. 6B and C), suggesting that the NF-kappaB and
phospholipase D signalling pathway was activated to promote the
immunotherapy and chemotherapy resistance of OSCC. The process
described above indicates that the proteins target metabolites to
regulate a series of pathways. Clarifying the correlation between
the proteins and metabolites is essential for further screening of
the mechanisms of resistance to the PD-1 monoclonal antibody in
patients with OSCC. The results showed that TG, CE,
glycochenodeoxycholic acid, glycocholic acid, and taurocholic acid
were co-regulated by APOH (Fig. 6D
and E), indicating that APOH may
contribute to the immunotherapy and chemotherapy resistance by
regulating the metabolism of TG, CE, glycochenodeoxycholic acid,
glycocholic acid, and taurocholic acid. Cholesterol metabolism is
described in Fig. 6F.
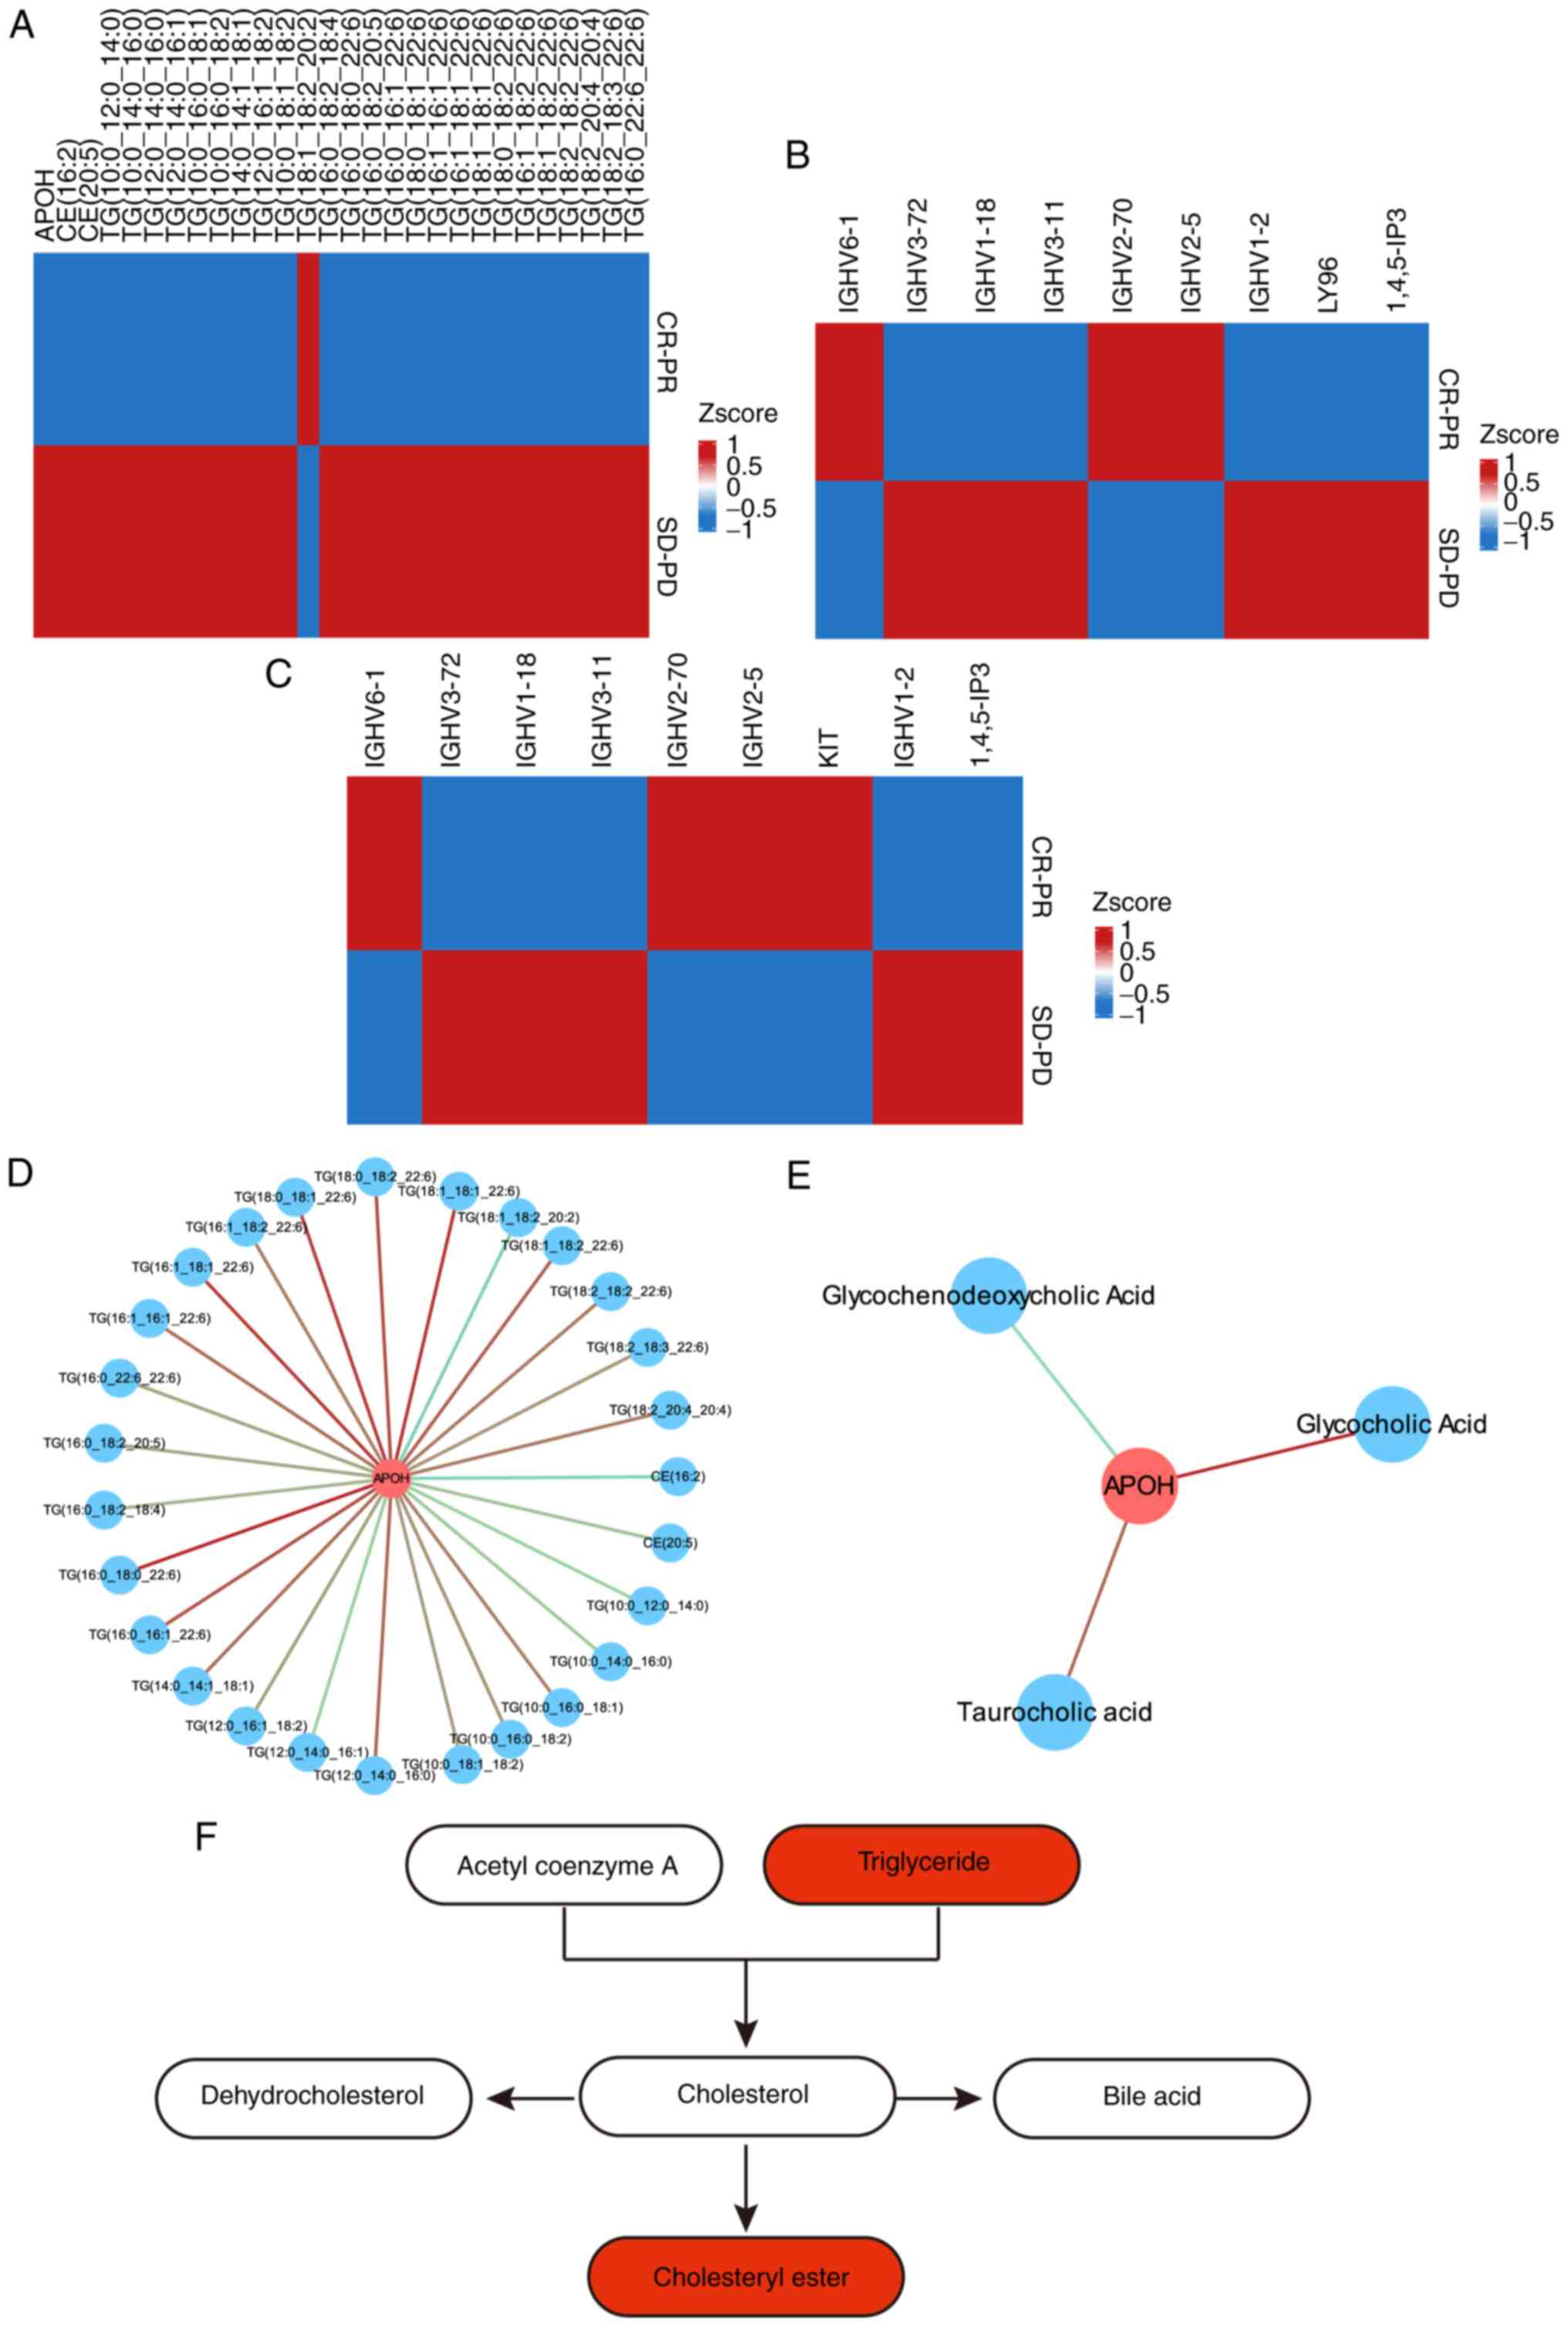 | Figure 6Enrichment of DEMs and DEPs in the
cholesterol metabolism, NF-kappaB and phospholipase D signaling
pathways. (A) Enrichment of DEMs and DEPs in the cholesterol
metabolism signaling pathway. (B) Enrichment of DEMs and DEPs in
the NF-kappaB signaling pathway. (C) Enrichment of DEMs and DEPs in
the phospholipase D signaling pathway. (D) The correlation network
of the DEMs and DEPs in the cholesterol metabolism signaling
pathway. Blue circles represent metabolites, red circles represent
proteins, red lines represent positive correlations, and blue lines
represent negative correlations. (E) The correlation network of the
DEMs and DEPs in the bile secretion signaling pathway. Blue circles
represent metabolites, red circles represent proteins, red lines
represent positive correlations, and blue lines represent negative
correlations. (F) The cholesterol metabolism pathway; the
upregulated metabolites are indicated in red. DEMs, differentially
expressed metabolites; DEPs, differentially expressed proteins;
SD-PD, stable disease-progressive disease; CR-PR, complete
response-partial response; APOH, apolipoprotein H. |
Discussion
In recent years, an increasing number of studies
have used MS to identify biomarkers of oesophageal cancer. In one
study, non-targeted metabolomics was performed on tumour tissues
from 15 patients with stage I, II, III, and IV OSCC and 15 control
individuals with normal oesophageal tissues, and the results showed
that glycerophosphate metabolism played an important role in the
development and progression of OSCC (34). A database search showed that
glycerophospholipid metabolism genes, phosphatidylserine synthase 1
(PTDSS1) and lysophosphatidylcholine acyltransferase 1 (LPCAT1),
can predict prognosis in patients with OSCC (34). A targeted LC-MS/MS assay performed
on serum samples from 320 patients with oesophageal cancer and 323
healthy individuals revealed that d-mannose was significantly
upregulated in the serum of patients with oesophageal cancer and
could be used as a potential biomarker for the diagnosis of
oesophageal cancer (35). Liquid
chromatography-quadrupole/time-of-flight mass spectrometry
(LC-Q/TOF-MS)-based non-targeted metabolomic examination of the
serum samples of 40 patients with OSCC and 10 healthy individuals
revealed that phosphatidylcholine metabolism was significantly
abnormal in the serum of patients with OSCC (36). LC-MS and NMR analysis revealed that
metabolites abnormally expressed in patients with oesophageal
adenocarcinoma included β-hydroxybytyrate, lysine, glutamine,
citrate, creatinine, lactate, and glucose (37). Furthermore, serum proline was found
to be expressed at reduced levels in patients with oesophageal
cancer and can be used as a risk marker for early diagnosis of
patients with oesophageal cancer (38). A total of seven glycoproteins and 13
glycopeptides were found to be upregulated in patients with
oesophageal cancer (39). An
LC-MS-based study identified 20 OSCC-related biomarkers, of which
nine metabolites were associated with in situ tumour
metastasis, lymph node metastasis, and OS. Glutamate was associated
with in situ tumour metastasis; oleic acid, LysoPC (15:0),
uracil, inosine, and choline were associated with lymph node
metastasis; and glutamine, kynurenine, serine, and uracil were
associated with OS (40).
Numerous studies have been conducted in recent years
to explore the proteomic changes of patients with oesophageal
cancer (41-44).
By using Isobaric Tags for Relative and Absolute Quantification
(iTRAQ), one study identified 516 differentially expressed proteins
in oesophageal cancer tissues and normal tissues adjacent to the
cancer, in which N-alpha-acetyltransferase 10 (NAA10) was expressed
at reduced levels in oesophageal cancer tissues and NAA10 inhibited
the proliferation of OSCC cells; this suggests that NAA10 may serve
as a suppressor of OSCC and a new potential diagnostic biomarker
for OSCC (45). In addition, the
regulatory mechanism of MARCH8 has been elucidated using the iTRAQ
technique (46). A combined
application of iTRAQ and 2D-LC-MS/MS identified 90 differentially
expressed proteins in 28 patients with OSCC and healthy
individuals, including extracellular matrix protein 1 (ECM1) and
lumican (LUM), which were subsequently shown to promote the
proliferation and metastasis of OSCC cells (47). Using iTRAQ proteomics, one study
identified 431 proteins differentially expressed in OSCC tissues
relative to paracancerous tissues, such as 4-hydroxylase subunit
α-1, prolyl4-hydroxylase subunit α-2, calponin-2, immunoglobulin
superfamily containing leucine-rich repeat protein, and
3-hydroxylase 1(48). Liu et
al used large-scale and high-resolution MS-based proteomics to
classify oesophageal cancer into two subtypes, SI and S2, with the
S2 subtype characterized by upregulation of spliceosomal and
ribosomal proteins as the biomarker (49). A total of 9,042 proteins and 26,892
phosphosites were identified through extensive proteomic and
phosphoproteomic analysis based on iTRAQ, including 556
differentially expressed proteins and 1,691 differentially
expressed phosphorylation sites; protein levels of the spliceosome
pathway and phosphorylated protein levels were significantly
upregulated in patients with stage III oesophageal cancer with the
poorest postoperative prognosis, and CDC-like kinase may serve as a
potential therapeutic target for patients with OSCC (50).
The NF-κB pathway plays an important role in the
development and progression of tumours. Activation of this pathway
can upregulate downstream pro- and anti-apoptotic gene expression
and can regulate a range of signalling pathways to promote tumour
cell proliferation and inhibit apoptosis, including the signalling
pathways of STAT3, API, interferon, regulatory factors, NRF2,
Notch, WNT-β-catenin, and p53 (51-54).
In addition, the NF-κB pathway and inflammation can promote
genomic, epigenetic, and metabolomic alterations that lead to the
epithelial-to-mesenchymal transition (EMT), metastasis, and
invasion of tumour cells, resulting in tumour resistance to immune
drugs (55-57).
Bulk and single-cell transcriptomic analyses revealed that clinical
patients treated effectively with anti-CTLA4 and anti-PD1 showed
upregulation of NF-κB pathway genes in both tumour cells and immune
cells (58). Moreover, a large
number of NF-κB-regulated cytokines and chemokines were up- or
downregulated in patients who responded well to immunotherapy
(59). CD28 binding leads to
activation of the NF-κB pathway through a number of processes,
which plays an important role in the in vivo anti-PD-1
treatment of mice (59). In
addition, two classical NF-κB pathway-dependent genes, IFNγ and
CD127, can enhance the efficacy of dual CTLA-4/PD-1 inhibition
(60). It has been widely
demonstrated that activation of the NF-κB pathway significantly
enhances the efficacy of tumour immunotherapy (61-63).
Numerous studies have shown that inhibitors of the NF-κB pathway
can inhibit tumour cell survival, proliferation, and invasion both
in vivo and in vitro, possibly by promoting the
maturation of DC cells and enhancing the antitumor activity of T
and NK cells (64-66).
The phospholipase D family is widely distributed in
cells. Phospholipase D isoforms (PLDs) and their hydrolysis product
phosphatidic acid (PA) have been shown to be involved in the
proliferation and metastasis of a variety of cancers. Both PLDs and
PA can promote the activation of mTOR and can promote the
expression of growth factor receptors, forming positive feedback
with the wingless-related integration site protein
(Wnt)/β-catenin/transcription factor 4 (TCF-4) pathway, thereby
promoting tumour cell survival. They can also act as second
messengers for numerous growth factors to promote cascade signal
amplification. PLDs and PAs can promote tumour cell survival under
nutrient deficiency. In the case of insufficient glucose levels,
PLD-1 can provide energy to tumour cells by activating autophagy
(67). In addition, PLDs and PAs
are involved in mitochondria-mediated apoptotic processes.
Mitochondrial cardiolipin deficiency leads to the downregulation of
cytochrome, which causes activation of caspase-9 and caspase-3 and
in turn activation of caspase cascade reaction, thereby promoting
apoptosis (68). PA is an important
intermediate metabolite for cardiolipin synthesis. Conversely, PLDs
and PA can promote tumour invasion and metastasis. In particular,
PLD2 plays an important role in SNAI1 and SNAI2-mediated EMT
(69). PLDs and PA can promote the
binding of NF-κB with specificity protein 1, which in turn promotes
the expression of SP1, thereby increasing the degradation of the
extracellular matrix (70). By
regulating the PI3K/Akt and mitogen-activated protein kinase/ERK
pathways, PLDs and PA can activate HIFs to promote the production
of pro-angiogenic downstream targets and the phosphorylation of
sphingosine kinase to sphingosine-1-phosphate, thereby activating
VEGF receptors to promote tumour angiogenesis. The metastasis of
vascular endothelial cells was promoted by upregulating the
expression of MMPs and releasing Cripto-1. Some inhibitors of PLDs,
such as resveratrol, quercetin, and honokiol have also been shown
to have antitumor effects (71-73).
Cholesterol is a precursor of bile acids and
cholesterol hormones, and has been shown to promote the development
and progression of colon, breast, and prostate cancers. It also
regulates tumour development and progression by modulating a range
of signalling pathways involved therein. Tumour cells require large
amounts of cholesterol to meet the metabolic requirements of their
rapid proliferation, such as the requirements for cell formation
and other physiological functions (74). For example,
6-oxo-cholestan-3β,5α-diol has been revealed to be highly expressed
in patients with breast cancer (75), and to promote tumour progression by
binding to the glucocorticoid receptor. Therefore, cholesterol
metabolism can promote tumour progression, including tumour cell
proliferation, metastasis, and invasion (76-79).
During cholesterol metabolism, immunosuppressive cells such as
neutrophils (80), myeloid-derived
suppressor cells (81), and
tumour-associated macrophages (82)
may be recruited to the tumour microenvironment, where they promote
tumour progression, or suppress tumour regression by enhancing the
function of T cells (83). In
short, due to the important role of cholesterol metabolism in
tumour progression, its inhibitors such as strains (84), lipophilic statins (85), R408-8071(86), and zaragonic acids (87) are mostly used in the clinical
treatment of tumours.
The NF-κB pathway, phospholipase D family and
cholesterol metabolism pathway play an important role in the tumour
progression. In the present study, the three aforementioned
signalling pathways were identified using metabolomics and
proteomics as being involved in the molecular mechanisms of
anti-PD-1 monoclonal antibody resistance in patients with OSCC.
More importantly, it was hypothesized that the resistance of
anti-PD-1 monoclonal antibodies induced by cholesterol may be
regulated by APOH. APOH also promotes progression in various
cancers. For example, it was negatively related to prognosis in
colorectal cancer (88) and
hepatocellular carcinoma (89). In
addition, APOH may be a promising non-invasive biomarker for renal
cancer (90). A previous study
found that as an immune-related gene, APOH could predict prognosis
in early stage lung squamous cell carcinoma (91) and gastric cancer (92). However, the present study was
limited by the small sample size and the lack of validation
samples. Therefore, plasma samples from patients with OSCC
undergoing treatment with anti-PD-1 monoclonal antibodies will be
collected in the future to perform targeted metabolomics and
proteomics to clarify the metabolites, metabolic pathways, and
molecular mechanisms involved in anti-PD-1 monoclonal antibody
resistance in patients with OSCC. Animal models of OSCC where the
mice are treated with PD-1 monoclonal antibody alone, chemotherapy
alone, and their combination will also be examined using
metabolic/proteomic analysis to elucidate the DEPs and the DEMs
between the chemoresistance alone group and the combination
resistance group, and between the PD-1 monoclonal antibody
resistance group and the combination resistance group, and thus
investigate the potential interactions between the two therapies
which lead to the immunotherapy resistance. Animal models and cell
lines of OSCC will also be used to elucidate the molecular
mechanisms of immunotherapy resistance in OSCC, and in addition, a
search for low-molecular-weight drugs affecting metabolic pathways
will be performed in order to enhance the sensitivity of
immunotherapy in OSCC, and improve the prognosis of OSCC
patients.
Acknowledgements
Not applicable.
Funding
Funding: The present study was funded by the Central Leading
Local Science and Technology Development Special Foundation (grant
no. ZYYD2020000169).
Availability of data and materials
The mass spectrometry proteomics data have been
deposited to the ProteomeXchange Consortium (http://proteomecentral.proteomexchange.org) via the
iProX partner repository with the dataset identifier PXD039045.
URL: https://www.iprox.cn/page/PSV023.html;?url=16729105460717iE2.
Password: I8Kh The raw metabolic data have already been submitted
to the Metabolights database with an associated accession number of
MTBLS6796 with the URL, www.ebi.ac.uk/metabolights/MTBLS6796.
Authors' contributions
LG substantially contributed to the conception of
the study as well as the acquisition and analysis of the data. LG
drafted the manuscript and YC revised it critically for important
intellectual content. The funding was provided by YC. LG and YC
confirm the authenticity of all the raw data. Both authors (LG and
YC) read and approved the manuscript and agree to be accountable
for all aspects of the research in ensuring that the accuracy or
integrity of any part of the work are appropriately investigated
and resolved.
Ethics approval and consent to
participate
All procedures performed in studies involving human
participants were conducted in accordance with the ethical
standards of the institutional and national research committee and
with the 1964 Declaration of Helsinki and its later amendments or
comparable ethical standards. The study was approved (approval no.
WDRY2020-K212) by the Bioethics Committee of Renmin Hospital of
Wuhan University (Wuhan, Hubei). Written nformed consent was
obtained from all participants included in the study.
Patient consent for publication
Not applicable.
Competing interests
The authors declare that they have no competing
interests.
References
|
1
|
Bagchi S, Yuan R and Engleman EG: Immune
checkpoint inhibitors for the treatment of cancer: Clinical impact
and mechanisms of response and resistance. Annu Rev Pathol.
16:223–249. 2021.PubMed/NCBI View Article : Google Scholar
|
|
2
|
Carlino MS, Larkin J and Long GV: Immune
checkpoint inhibitors in melanoma. Lancet. 398:1002–1014.
2021.PubMed/NCBI View Article : Google Scholar
|
|
3
|
Li F, Chen Y, Pang M, Yang P and Jing H:
Immune checkpoint inhibitors and cellular treatment for lymphoma
immunotherapy. Clin Exp Immunol. 205:1–11. 2021.PubMed/NCBI View Article : Google Scholar
|
|
4
|
Kojima T, Shah MA, Muro K, Francois E,
Adenis A, Hsu CH, Doi T, Moriwaki T, Kim SB, Lee SH, et al:
Randomized phase III KEYNOTE-181 study of pembrolizumab versus
chemotherapy in advanced esophageal cancer. J Clin Oncol.
38:4138–4148. 2020.PubMed/NCBI View Article : Google Scholar
|
|
5
|
Kato K, Cho BC, Takahashi M, Okada M, Lin
CY, Chin K, Kadowaki S, Ahn MJ, Hamamoto Y, Doki Y, et al:
Nivolumab versus chemotherapy in patients with advanced oesophageal
squamous cell carcinoma refractory or intolerant to previous
chemotherapy (ATTRACTION-3): A multicentre, randomised, open-label,
phase 3 trial. Lancet Oncol. 20:1506–1517. 2019.PubMed/NCBI View Article : Google Scholar
|
|
6
|
Huang J, Xu J, Chen Y, Zhuang W, Zhang Y,
Chen Z, Chen J, Zhang H, Niu Z, Fan Q, et al: Camrelizumab versus
investigator's choice of chemotherapy as second-line therapy for
advanced or metastatic oesophageal squamous cell carcinoma
(ESCORT): A multicentre, randomised, open-label, phase 3 study.
Lancet Oncol. 21:832–842. 2020.PubMed/NCBI View Article : Google Scholar
|
|
7
|
Sun JM, Shen L, Shah MA, Enzinger P,
Adenis A, Doi T, Kojima T, Metges JP, Li Z, Kim SB, et al:
Pembrolizumab plus chemotherapy versus chemotherapy alone for
first-line treatment of advanced oesophageal cancer (KEYNOTE-590):
A randomised, placebo-controlled, phase 3 study. Lancet.
398:759–771. 2021.PubMed/NCBI View Article : Google Scholar
|
|
8
|
Luo H, Lu J, Bai Y, Mao T, Wang J, Fan Q,
Zhang Y, Zhao K, Chen Z, Gao S, et al: Effect of camrelizumab vs
placebo added to chemotherapy on survival and progression-free
survival in patients with advanced or metastatic esophageal
squamous cell carcinoma: The ESCORT-1st randomized clinical trial.
JAMA. 326:916–925. 2021.PubMed/NCBI View Article : Google Scholar
|
|
9
|
Rinschen MM, Ivanisevic J, Giera M and
Siuzdak G: Identification of bioactive metabolites using activity
metabolomics. Nat Rev Mol Cell Biol. 20:353–367. 2019.PubMed/NCBI View Article : Google Scholar
|
|
10
|
Muthubharathi BC, Gowripriya T and
Balamurugan K: Metabolomics: Small molecules that matter more. Mol
Omics. 17:210–229. 2021.PubMed/NCBI View Article : Google Scholar
|
|
11
|
Chen PH, Cai L, Huffman K, Yang C, Kim J,
Faubert B, Boroughs L, Ko B, Sudderth J, McMillan EA, et al:
Metabolic diversity in human non-small cell lung cancer cells. Mol
Cell. 76:838–851.e5. 2019.PubMed/NCBI View Article : Google Scholar
|
|
12
|
Shen Y, Sun M, Zhu J, Wei M, Li H, Zhao P,
Wang J, Li R, Tian L, Tao Y, et al: Tissue metabolic profiling
reveals major metabolic alteration in colorectal cancer. Mol Omics.
17:464–471. 2021.PubMed/NCBI View Article : Google Scholar
|
|
13
|
Li L and Ma J: Molecular characterization
of metabolic subtypes of gastric cancer based on metabolism-related
lncRNA. Sci Rep. 11(21491)2021.PubMed/NCBI View Article : Google Scholar
|
|
14
|
Chen CJ, Lee DY, Yu J, Lin YN and Lin TM:
Recent advances in LC-MS-based metabolomics for clinical biomarker
discovery. Mass Spectrom Rev. (e21785)2022.PubMed/NCBI View Article : Google Scholar : (Epub ahead of
print).
|
|
15
|
Seger C and Salzmann L: After another
decade: LC-MS/MS became routine in clinical diagnostics. Clin
Biochem. 82:2–11. 2020.PubMed/NCBI View Article : Google Scholar
|
|
16
|
Beccaria M and Cabooter D: Current
developments in LC-MS for pharmaceutical analysis. Analyst.
145:1129–1157. 2020.PubMed/NCBI View Article : Google Scholar
|
|
17
|
Zhang S, Wang H and Zhu MJ: A sensitive
GC/MS detection method for analyzing microbial metabolites short
chain fatty acids in fecal and serum samples. Talanta. 196:249–254.
2019.PubMed/NCBI View Article : Google Scholar
|
|
18
|
Beale DJ, Pinu FR, Kouremenos KA, Poojary
MM, Narayana VK, Boughton BA, Kanojia K, Dayalan S, Jones OAH and
Dias DA: Review of recent developments in GC-MS approaches to
metabolomics-based research. Metabolomics. 14(152)2018.PubMed/NCBI View Article : Google Scholar
|
|
19
|
Hu R, Li T, Yang Y, Tian Y and Zhang L:
NMR-based metabolomics in cancer research. Adv Exp Med Biol.
1280:201–218. 2021.PubMed/NCBI View Article : Google Scholar
|
|
20
|
Bichmann L, Gupta S, Rosenberger G,
Kuchenbecker L, Sachsenberg T, Ewels P, Alka O, Pfeuffer J,
Kohlbacher O and Röst H: DIAproteomics: A multifunctional data
analysis pipeline for data-independent acquisition proteomics and
peptidomics. J Proteome Res. 20:3758–3766. 2021.PubMed/NCBI View Article : Google Scholar
|
|
21
|
Ma L, Muscat JE, Sinha R, Sun D and Xiu G:
Proteomics of exhaled breath condensate in lung cancer and controls
using data-independent acquisition (DIA): A pilot study. J Breath
Res. 15(026002)2021.PubMed/NCBI View Article : Google Scholar
|
|
22
|
Krasny L and Huang PH: Data-independent
acquisition mass spectrometry (DIA-MS) for proteomic applications
in oncology. Mol Omics. 17:29–42. 2021.PubMed/NCBI View Article : Google Scholar
|
|
23
|
Zheng X, Xu K, Zhou B, Chen T, Huang Y, Li
Q, Wen F, Ge W, Wang J, Yu S, et al: A circulating extracellular
vesicles-based novel screening tool for colorectal cancer revealed
by shotgun and data-independent acquisition mass spectrometry. J
Extracell Vesicles. 9(1750202)2020.PubMed/NCBI View Article : Google Scholar
|
|
24
|
Rao J, Wan X, Tou F, He Q, Xiong A, Chen
X, Cui W and Zheng Z: Molecular characterization of advanced
colorectal cancer using serum proteomics and metabolomics. Front
Mol Biosci. 8(687229)2021.PubMed/NCBI View Article : Google Scholar
|
|
25
|
Zhang Q, Zhang Y, Sun S, Wang K, Qian J,
Cui Z, Tao T and Zhou J: ACOX2 is a prognostic marker and impedes
the progression of hepatocellular carcinoma via PPARα pathway. Cell
Death Dis. 12(15)2021.PubMed/NCBI View Article : Google Scholar
|
|
26
|
Kong R, Qian X and Ying W: Pancreatic
cancer cells spectral library by DIA-MS and the phenotype analysis
of gemcitabine sensitivity. Sci Data. 9(283)2022.PubMed/NCBI View Article : Google Scholar
|
|
27
|
Keam SP, Gulati T, Gamell C, Caramia F,
Huang C, Schittenhelm RB, Kleifeld O, Neeson PJ, Haupt Y and
Williams SG: Exploring the oncoproteomic response of human prostate
cancer to therapeutic radiation using data-independent acquisition
(DIA) mass spectrometry. Prostate. 78:563–575. 2018.PubMed/NCBI View Article : Google Scholar
|
|
28
|
Sun Y, Li L, Zhou Y, Ge W, Wang H, Wu R,
Liu W, Chen H, Xiao Q, Cai X, et al: Stratification of follicular
thyroid tumours using data-independent acquisition proteomics and a
comprehensive thyroid tissue spectral library. Mol Oncol.
16:1611–1624. 2022.PubMed/NCBI View Article : Google Scholar
|
|
29
|
Oken MM, Creech RH, Tormey DC, Horton J,
Davis TE, McFadden ET and Carbone PP: Toxicity and response
criteria of the Eastern cooperative oncology group. Am J Clin
Oncol. 5:649–655. 1982.PubMed/NCBI
|
|
30
|
Schwartz LH, Litière S, de Vries E, Ford
R, Gwyther S, Mandrekar S, Shankar L, Bogaerts J, Chen A, Dancey J,
et al: RECIST 1.1-update and clarification: From the RECIST
committee. Eur J Cancer. 62:132–137. 2016.PubMed/NCBI View Article : Google Scholar
|
|
31
|
Greene FL, Page DL, Fleming ID, Fritz AG,
Balch CM, Haller DG and Morrow M (eds): AJCC cancer staging manual.
6th edition. American Joint Committe on Cancer, Chicago, IL,
pp91-99, 2002.
|
|
32
|
Demichev V, Messner CB, Vernardis SI,
Lilley KS and Ralser M: DIA-NN: Neural networks and interference
correction enable deep proteome coverage in high throughput. Nat
Methods. 17:41–44. 2020.PubMed/NCBI View Article : Google Scholar
|
|
33
|
Yu G, Wang LG, Han Y and He QY:
clusterProfiler: An R package for comparing biological themes among
gene clusters. OMICS. 16:284–287. 2012.PubMed/NCBI View Article : Google Scholar
|
|
34
|
Yang T, Hui R, Nouws J, Sauler M, Zeng T
and Wu Q: Untargeted metabolomics analysis of esophageal squamous
cell cancer progression. J Transl Med. 20(127)2022.PubMed/NCBI View Article : Google Scholar
|
|
35
|
White L, Ma J, Liang S, Sanchez-Espiridion
B and Liang D: LC-MS/MS determination of d-mannose in human serum
as a potential cancer biomarker. J Pharm Biomed Anal. 137:54–59.
2017.PubMed/NCBI View Article : Google Scholar
|
|
36
|
Mir SA, Rajagopalan P, Jain AP, Khan AA,
Datta KK, Mohan SV, Lateef SS, Sahasrabuddhe N, Somani BL, Keshava
Prasad TS, et al: LC-MS-based serum metabolomic analysis reveals
dysregulation of phosphatidylcholines in esophageal squamous cell
carcinoma. J Proteomics. 127:96–102. 2015.PubMed/NCBI View Article : Google Scholar
|
|
37
|
Zhang J, Bowers J, Liu L, Wei S, Gowda GA,
Hammoud Z and Raftery D: Esophageal cancer metabolite biomarkers
detected by LC-MS and NMR methods. PLoS One.
7(e30181)2012.PubMed/NCBI View Article : Google Scholar
|
|
38
|
Liang S, Sanchez-Espiridion B, Xie H, Ma
J, Wu X and Liang D: Determination of proline in human serum by a
robust LC-MS/MS method: Application to identification of human
metabolites as candidate biomarkers for esophageal cancer early
detection and risk stratification. Biomed Chromatogr. 29:570–577.
2015.PubMed/NCBI View Article : Google Scholar
|
|
39
|
Song E, Zhu R, Hammoud ZT and Mechref Y:
LC-MS/MS quantitation of esophagus disease blood serum
glycoproteins by enrichment with hydrazide chemistry and lectin
affinity chromatography. J Proteome Res. 13:4808–4820.
2014.PubMed/NCBI View Article : Google Scholar
|
|
40
|
Zhang H, Wang L, Hou Z, Ma H, Mamtimin B,
Hasim A and Sheyhidin I: Metabolomic profiling reveals potential
biomarkers in esophageal cancer progression using liquid
chromatography-mass spectrometry platform. Biochem Biophys Res
Commun. 491:119–125. 2017.PubMed/NCBI View Article : Google Scholar
|
|
41
|
Guo JH, Xing GL, Fang XH, Wu HF, Zhang B,
Yu JZ, Fan ZM and Wang LD: Proteomic profiling of fetal esophageal
epithelium, esophageal cancer, and tumor-adjacent esophageal
epithelium and immunohistochemical characterization of a
representative differential protein, PRX6. World J Gastroenterol.
23:1434–1442. 2017.PubMed/NCBI View Article : Google Scholar
|
|
42
|
Yazdian-Robati R, Ahmadi H, Riahi MM, Lari
P, Aledavood SA, Rashedinia M, Abnous K and Ramezani M: Comparative
proteome analysis of human esophageal cancer and adjacent normal
tissues. Iran J Basic Med Sci. 20:265–271. 2017.PubMed/NCBI View Article : Google Scholar
|
|
43
|
O'Neill JR, Pak HS, Pairo-Castineira E,
Save V, Paterson-Brown S, Nenutil R, Vojtěšek B, Overton I, Scherl
A and Hupp TR: Quantitative shotgun proteomics unveils candidate
novel esophageal adenocarcinoma (EAC)-specific proteins. Mol Cell
Proteomics. 16:1138–1150. 2017.PubMed/NCBI View Article : Google Scholar
|
|
44
|
Schwacke J, Millar TP, Hammond CE, Saha A,
Hoffman BJ, Romagnuolo J, Hill EG and Smolka AJ: Discrimination of
normal and esophageal cancer plasma proteomes by MALDI-TOF mass
spectrometry. Dig Dis Sci. 60:1645–1654. 2015.PubMed/NCBI View Article : Google Scholar
|
|
45
|
Wang D, Chen J, Han J, Wang K, Fang W, Jin
J and Xue S: iTRAQ and two-dimensional-LC-MS/MS reveal NAA10 is a
potential biomarker in esophageal squamous cell carcinoma.
Proteomics Clin Appl. 16(e2100081)2022.PubMed/NCBI View Article : Google Scholar
|
|
46
|
Singh S, Bano A, Saraya A, Das P and
Sharma R: iTRAQ-based analysis for the identification of MARCH8
targets in human esophageal squamous cell carcinoma. J Proteomics.
236(104125)2021.PubMed/NCBI View Article : Google Scholar
|
|
47
|
Wang X, Peng Y, Xie M, Gao Z, Yin L, Pu Y
and Liu R: Identification of extracellular matrix protein 1 as a
potential plasma biomarker of ESCC by proteomic analysis using
iTRAQ and 2D-LC-MS/MS. Proteomics Clin Appl.
11(1600163)2017.PubMed/NCBI View Article : Google Scholar
|
|
48
|
Deng F, Zhou K, Li Q, Liu D, Li M, Wang H,
Zhang W and Ma Y: iTRAQ-based quantitative proteomic analysis of
esophageal squamous cell carcinoma. Tumour Biol. 37:1909–1918.
2016.PubMed/NCBI View Article : Google Scholar
|
|
49
|
Liu W, Xie L, He YH, Wu ZY, Liu LX, Bai
XF, Deng DX, Xu XE, Liao LD, Lin W, et al: Large-scale and
high-resolution mass spectrometry-based proteomics profiling
defines molecular subtypes of esophageal cancer for therapeutic
targeting. Nat Commun. 12(4961)2021.PubMed/NCBI View Article : Google Scholar
|
|
50
|
Li Y, Yang B, Ma Y, Peng X, Wang Z, Sheng
B, Wei Z, Cui Y and Liu Z: Phosphoproteomics reveals therapeutic
targets of esophageal squamous cell carcinoma. Signal Transduct
Target Ther. 6(381)2021.PubMed/NCBI View Article : Google Scholar
|
|
51
|
Joyce D, Albanese C, Steer J, Fu M,
Bouzahzah B and Pestell RG: NF-kappaB and cell-cycle regulation:
the cyclin connection. Cytokine Growth Factor Rev. 12:73–90.
2001.PubMed/NCBI View Article : Google Scholar
|
|
52
|
Grivennikov SI and Karin M: Dangerous
liaisons: STAT3 and NF-kappaB collaboration and crosstalk in
cancer. Cytokine Growth Factor Rev. 21:11–19. 2010.PubMed/NCBI View Article : Google Scholar
|
|
53
|
Vanden Berghe T, Linkermann A,
Jouan-Lanhouet S, Walczak H and Vandenabeele P: Regulated necrosis:
The expanding network of non-apoptotic cell death pathways. Nat Rev
Mol Cell Biol. 15:135–147. 2014.PubMed/NCBI View Article : Google Scholar
|
|
54
|
Taniguchi K, Wu LW, Grivennikov SI, de
Jong PR, Lian I, Yu FX, Wang K, Ho SB, Boland BS, Chang JT, et al:
A gp130-Src-YAP module links inflammation to epithelial
regeneration. Nature. 519:57–62. 2015.PubMed/NCBI View Article : Google Scholar
|
|
55
|
Johnson RF and Perkins ND: Nuclear
factor-κB, p53, and mitochondria: Regulation of cellular metabolism
and the Warburg effect. Trends Biochem Sci. 37:317–324.
2012.PubMed/NCBI View Article : Google Scholar
|
|
56
|
Xia Y, Shen S and Verma IM: NF-κB, an
active player in human cancers. Cancer Immunol Res. 2:823–830.
2014.PubMed/NCBI View Article : Google Scholar
|
|
57
|
Wu Y and Zhou BP: Inflammation: A driving
force speeds cancer metastasis. Cell Cycle. 8:3267–3273.
2009.PubMed/NCBI View Article : Google Scholar
|
|
58
|
Amato CM, Hintzsche JD, Wells K, Applegate
A, Gorden NT, Vorwald VM, Tobin RP, Nassar K, Shellman YG, Kim J,
et al: Pre-treatment mutational and transcriptomic landscape of
responding metastatic melanoma patients to anti-PD1 immunotherapy.
Cancers (Basel). 12(1943)2020.PubMed/NCBI View Article : Google Scholar
|
|
59
|
Roh W, Chen PL, Reuben A, Spencer CN,
Prieto PA, Miller JP, Gopalakrishnan V, Wang F, Cooper ZA, Reddy
SM, et al: Integrated molecular analysis of tumor biopsies on
sequential CTLA-4 and PD-1 blockade reveals markers of response and
resistance. Sci Transl Med. 9(eaah3560)2017.PubMed/NCBI View Article : Google Scholar
|
|
60
|
Shi LZ, Fu T, Guan B, Chen J, Blando JM,
Allison JP, Xiong L, Subudhi SK, Gao J and Sharma P: Interdependent
IL-7 and IFN-γ signalling in T-cell controls tumour eradication by
combined α-CTLA-4+α-PD-1 therapy. Nat Commun.
7(12335)2016.PubMed/NCBI View Article : Google Scholar
|
|
61
|
Dong MB, Wang G, Chow RD, Ye L, Zhu L, Dai
X, Park JJ, Kim HR, Errami Y, Guzman CD, et al: Systematic
immunotherapy target discovery using genome-scale in vivo CRISPR
screens in CD8 T cells. Cell. 178:1189–1204.e23. 2019.PubMed/NCBI View Article : Google Scholar
|
|
62
|
Li G, Boucher JC, Kotani H, Park K, Zhang
Y, Shrestha B, Wang X, Guan L, Beatty N, Abate-Daga D and Davila
ML: 4-1BB enhancement of CAR T function requires NF-κB and TRAFs.
JCI Insight. 3(e121322)2018.PubMed/NCBI View Article : Google Scholar
|
|
63
|
Philipson BI, O'Connor RS, May MJ, June
CH, Albelda SM and Milone MC: 4-1BB costimulation promotes CAR T
cell survival through noncanonical NF-κB signaling. Sci Signal.
13(eaay8248)2020.PubMed/NCBI View Article : Google Scholar
|
|
64
|
Schumacher LY, Vo DD, Garban HJ,
Comin-Anduix B, Owens SK, Dissette VB, Glaspy JA, McBride WH,
Bonavida B, Economou JS and Ribas A: Immunosensitization of tumor
cells to dendritic cell-activated immune responses with the
proteasome inhibitor bortezomib (PS-341, Velcade). J Immunol.
176:4757–4765. 2006.PubMed/NCBI View Article : Google Scholar
|
|
65
|
Enzler T, Sano Y, Choo MK, Cottam HB,
Karin M, Tsao H and Park JM: Cell-selective inhibition of NF-κB
signaling improves therapeutic index in a melanoma chemotherapy
model. Cancer Discov. 1:496–507. 2011.PubMed/NCBI View Article : Google Scholar
|
|
66
|
Xiao Z, Su Z, Han S, Huang J, Lin L and
Shuai X: Dual pH-sensitive nanodrug blocks PD-1 immune checkpoint
and uses T cells to deliver NF-κB inhibitor for antitumor
immunotherapy. Sci Adv. 6(eaay7785)2020.PubMed/NCBI View Article : Google Scholar
|
|
67
|
Cai M, He J, Xiong J, Tay LW, Wang Z, Rog
C, Wang J, Xie Y, Wang G, Banno Y, et al: Phospholipase
D1-regulated autophagy supplies free fatty acids to counter
nutrient stress in cancer cells. Cell Death Dis.
7(e2448)2016.PubMed/NCBI View Article : Google Scholar
|
|
68
|
Palikaras K, Lionaki E and Tavernarakis N:
Mechanisms of mitophagy in cellular homeostasis, physiology and
pathology. Nat Cell Biol. 20:1013–1022. 2018.PubMed/NCBI View Article : Google Scholar
|
|
69
|
Ganesan R, Mallets E and Gomez-Cambronero
J: The transcription factors Slug (SNAI2) and Snail (SNAI1)
regulate phospholipase D (PLD) promoter in opposite ways towards
cancer cell invasion. Mol Oncol. 10:663–676. 2016.PubMed/NCBI View Article : Google Scholar
|
|
70
|
Ho HY, Lin CW, Chien MH, Reiter RJ, Su SC,
Hsieh YH and Yang SF: Melatonin suppresses TPA-induced metastasis
by downregulating matrix metalloproteinase-9 expression through
JNK/SP-1 signaling in nasopharyngeal carcinoma. J Pineal Res.
61:479–492. 2016.PubMed/NCBI View Article : Google Scholar
|
|
71
|
Issuree PD, Pushparaj PN, Pervaiz S and
Melendez AJ: Resveratrol attenuates C5a-induced inflammatory
responses in vitro and in vivo by inhibiting phospholipase D and
sphingosine kinase activities. FASEB J. 23:2412–2424.
2009.PubMed/NCBI View Article : Google Scholar
|
|
72
|
Park MH and Min do S: Quercetin-induced
downregulation of phospholipase D1 inhibits proliferation and
invasion in U87 glioma cells. Biochem Biophys Res Commun.
412:710–715. 2011.PubMed/NCBI View Article : Google Scholar
|
|
73
|
Garcia A, Zheng Y, Zhao C, Toschi A, Fan
J, Shraibman N, Brown HA, Bar-Sagi D, Foster DA and Arbiser JL:
Honokiol suppresses survival signals mediated by Ras-dependent
phospholipase D activity in human cancer cells. Clin Cancer Res.
14:4267–4274. 2008.PubMed/NCBI View Article : Google Scholar
|
|
74
|
Huang B, Song BL and Xu C: Cholesterol
metabolism in cancer: Mechanisms and therapeutic opportunities. Nat
Metab. 2:132–141. 2020.PubMed/NCBI View Article : Google Scholar
|
|
75
|
Voisin M, de Medina P, Mallinger A, Dalenc
F, Huc-Claustre E, Leignadier J, Serhan N, Soules R, Ségala G,
Mougel A, et al: Identification of a tumor-promoter cholesterol
metabolite in human breast cancers acting through the
glucocorticoid receptor. Proc Natl Acad Sci USA. 114:E9346–E9355.
2017.PubMed/NCBI View Article : Google Scholar
|
|
76
|
Chimento A, Casaburi I, Avena P, Trotta F,
De Luca A, Rago V, Pezzi V and Sirianni R: Cholesterol and its
metabolites in tumor growth: Therapeutic potential of statins in
cancer treatment. Front Endocrinol (Lausanne).
9(807)2019.PubMed/NCBI View Article : Google Scholar
|
|
77
|
Ding X, Zhang W, Li S and Yang H: The role
of cholesterol metabolism in cancer. Am J Cancer Res. 9:219–227.
2019.PubMed/NCBI
|
|
78
|
Wang Y, Liu C and Hu L: Cholesterol
regulates cell proliferation and apoptosis of colorectal cancer by
modulating miR-33a-PIM3 pathway. Biochem Biophys Res Commun.
511:685–692. 2019.PubMed/NCBI View Article : Google Scholar
|
|
79
|
Liu Z, Liu X, Liu S and Cao Q: Cholesterol
promotes the migration and invasion of renal carcinoma cells by
regulating the KLF5/miR-27a/FBXW7 pathway. Biochem Biophys Res
Commun. 502:69–75. 2018.PubMed/NCBI View Article : Google Scholar
|
|
80
|
Raccosta L, Fontana R, Maggioni D,
Lanterna C, Villablanca EJ, Paniccia A, Musumeci A, Chiricozzi E,
Trincavelli ML, Daniele S, et al: The oxysterol-CXCR2 axis plays a
key role in the recruitment of tumor-promoting neutrophils. J Exp
Med. 210:1711–1728. 2013.PubMed/NCBI View Article : Google Scholar
|
|
81
|
Condamine T, Dominguez GA, Youn JI,
Kossenkov AV, Mony S, Alicea-Torres K, Tcyganov E, Hashimoto A,
Nefedova Y, Lin C, et al: Lectin-type oxidized LDL receptor-1
distinguishes population of human polymorphonuclear myeloid-derived
suppressor cells in cancer patients. Sci Immunol.
1(aaf8943)2016.PubMed/NCBI View Article : Google Scholar
|
|
82
|
Goossens P, Rodriguez-Vita J, Etzerodt A,
Masse M, Rastoin O, Gouirand V, Ulas T, Papantonopoulou O, Van Eck
M, Auphan-Anezin N, et al: Membrane cholesterol efflux drives
tumor-associated macrophage reprogramming and tumor progression.
Cell Metab. 29:1376–1389.e4. 2019.PubMed/NCBI View Article : Google Scholar
|
|
83
|
Kidani Y, Elsaesser H, Hock MB, Vergnes L,
Williams KJ, Argus JP, Marbois BN, Komisopoulou E, Wilson EB,
Osborne TF, et al: Sterol regulatory element-binding proteins are
essential for the metabolic programming of effector T cells and
adaptive immunity. Nat Immunol. 14:489–499. 2013.PubMed/NCBI View Article : Google Scholar
|
|
84
|
Larsen SB, Dehlendorff C, Skriver C,
Dalton SO, Jespersen CG, Borre M, Brasso K, Nørgaard M, Johansen C,
Sørensen HT, et al: Postdiagnosis statin use and mortality in
danish patients with prostate cancer. J Clin Oncol. 35:3290–3297.
2017.PubMed/NCBI View Article : Google Scholar
|
|
85
|
Xia Y, Xie Y, Yu Z, Xiao H, Jiang G, Zhou
X, Yang Y, Li X, Zhao M, Li L, et al: The mevalonate pathway is a
druggable target for vaccine adjuvant discovery. Cell.
175:1059–1073.e21. 2018.PubMed/NCBI View Article : Google Scholar
|
|
86
|
Maione F, Oliaro-Bosso S, Meda C, Di
Nicolantonio F, Bussolino F, Balliano G, Viola F and Giraudo E: The
cholesterol biosynthesis enzyme oxidosqualene cyclase is a new
target to impair tumour angiogenesis and metastasis dissemination.
Sci Rep. 5(9054)2015.PubMed/NCBI View Article : Google Scholar
|
|
87
|
Lanterna C, Musumeci A, Raccosta L, Corna
G, Moresco M, Maggioni D, Fontana R, Doglioni C, Bordignon C,
Traversari C and Russo V: The administration of drugs inhibiting
cholesterol/oxysterol synthesis is safe and increases the efficacy
of immunotherapeutic regimens in tumor-bearing mice. Cancer Immunol
Immunother. 65:1303–1315. 2016.PubMed/NCBI View Article : Google Scholar
|
|
88
|
Lu Y, Wang Y, Qiu Y and Xuan W: Analysis
of the relationship between the expression level of TTR and APOH
and prognosis in patients with colorectal cancer metastasis based
on bioinformatics. Contrast Media Mol Imaging.
2022(1121312)2022.PubMed/NCBI View Article : Google Scholar
|
|
89
|
Li X, Wang L, Wang L, Feng Z and Peng C:
Single-cell sequencing of hepatocellular carcinoma reveals cell
interactions and cell heterogeneity in the microenvironment. Int J
Gen Med. 14:10141–10153. 2021.PubMed/NCBI View Article : Google Scholar
|
|
90
|
Mandili G, Notarpietro A, Khadjavi A,
Allasia M, Battaglia A, Lucatello B, Frea B, Turrini F, Novelli F,
Giribaldi G and Destefanis P: Beta-2-glycoprotein-1 and
alpha-1-antitrypsin as urinary markers of renal cancer in von
Hippel-Lindau patients. Biomarkers. 23:123–130. 2018.PubMed/NCBI View Article : Google Scholar
|
|
91
|
Fan T, Lu Z, Liu Y, Wang L, Tian H, Zheng
Y, Zheng B, Xue L, Tan F, Xue Q, et al: A novel immune-related
seventeen-gene signature for predicting early stage lung squamous
cell carcinoma prognosis. Front Immunol. 12(665407)2021.PubMed/NCBI View Article : Google Scholar
|
|
92
|
Qiu XT, Song YC, Liu J, Wang ZM, Niu X and
He J: Identification of an immune-related gene-based signature to
predict prognosis of patients with gastric cancer. World J
Gastrointest Oncol. 12:857–876. 2020.PubMed/NCBI View Article : Google Scholar
|