Introduction
Lung malignancy is a common malignant tumor globally
and its morbidity and mortality increase yearly due to improvements
in early detection (1). In 2020,
2.2 million new cases and 1.8 million deaths of lung malignancy
were estimated globally (2). Lung
malignancy is a complex disease that has diverse histological and
molecular types, and 85% of lung malignancy cases are non-small
cell lung cancer (NSCLC) and 15% are SCLC (3,4). As
tumor-induced immunosuppression is often identified in patients
with cancer and contributes to cancer progression, immune
checkpoint immunotherapy has attracted attention (5,6).
Myeloid cells are the most abundant nucleated
hematopoietic cells in the human body and are distinct cell
populations with multiple functions (7). However, during pathological processes
including cancer, chronic inflammation and trauma, myeloid cells
are largely converted to myeloid-derived suppressor cells (MDSCs)
(8). MDSCs in the mouse represent
activated Gr-1(+) CD11b(+) myeloid precursor cells (9) and then further classified into two
subtypes: Monocyte like-MDSCs (M-MDSCs; CD11b+Ly6C high
Ly6G-) and granulocyte like-MDSCs (G-MDSCs;
CD11b+Ly6C low Ly6G-). MDSCs are usually
identified based on CD11b and CD33 in humans, with low levels of
major histocompatibility complex class II molecule human leukocyte
antigen-D-related (HLA-DR) (10).
High levels of arginase 1 are often expressed by MDSCs and reactive
oxygen species and nitric oxide are produced, thereby leading to T
cell depletion (11,12) and T regulatory cell (Treg) expansion
(13).
Tregs are a subpopulation of T cells and can
suppress the immune responses of cells, including T and B and
natural killer cells, monocyte and dendritic cells, to maintain
immune homeostasis and tolerance (14). Tregs in human can be sorted by
CD4+CD25+CD127 (IL-7R)-/low
(15). Tregs secrete suppressive
cytokines such as IL-10, TGF-B, and IL-35 to suppress T cells, can
inhibit induction of IL-2 mRNA in target T cells, and interact with
CTLA-4 and CD80/CD86 on antigen presenting cells (APCs) to prevent
their binding to CD28 present on T cells (16). Chronic infection results in large
accumulation of Tregs and expression of programmed death-1 (PD-1)
(17). Immunosuppressive effects of
MDSCs are achieved by expressing large amounts of immunosuppressive
mediators, especially PD-ligand (L)1(18). PD-1 binds to its ligand PD-L1 to
inhibit the proliferation of T cells and promote Treg
differentiation and function (19).
The absence of consensus regarding involvements of T cell and MDSC
subsets may limit understanding of cancer autoimmunity in lung
malignancy.
The present study recruited lung malignancy cases
and healthy individuals and performed a direct comparative analysis
of MDSC, G-MDSCs and M-MDSCs, and T cell subsets with regard to
their frequency, as well as their peripheral immunosuppressive
mediators in a bid to investigate tumor-specific immune responses
in lung malignancy.
Materials and methods
Study population
The present study was a case-control study involving
patients with lung malignancy and healthy controls. Inclusion
criteria for cases were as follows: i) Lung malignancy diagnosed
according to World Health Organization classification (20); ii) TNM staging established based on
the 7th edition of the TNM Classification of Lung Cancer (21) and iii) an age of 18 years or above.
Exclusion criteria were as follows: i) Previous history of
infectious diseases, atopy, allergic rhinitis, asthma, autoimmune
disease, liver and kidney dysfunction or other malignancy and ii)
use of immunomodulatory drugs. Ethics Committee of Beijing Tsinghua
Changgung Hospital (Beijing, China) approved the protocol (approval
no. 18190-0-01). All cases and healthy controls were informed of
study background and objective and signed informed consent. A total
of 102 patients with lung malignancy, consisting of 71 males and 31
females, who were admitted to Tsinghua Changgung Hospital between
February 2019 and January 2020 were analyzed. These patients' age
ranged from 33 to 92 years. Additionally, 34 healthy individuals
(20 males and 14 females) undergoing physical examination between
November 2019 and January 2020, without autoimmune diseases and/or
active infection and administration of immunomodulatory or
corticosteroid drugs, were included as controls. The age of healthy
individuals ranged from 34 to 78 years.
Peripheral blood sampling and
processing
Peripheral blood samples (5 ml) were collected and
placed into heparinized tubes within 24 h of admission to the
Tsinghua Changgung Hospital (Beijing, China) (for cases) or
physical examination (for controls). Heparinized blood was
immediately iced and centrifuged at 400 x g (30 min, 4˚C) and
density-gradient centrifugation was performed to separate
peripheral blood mononuclear cells (PBMCs) via Ficoll as previously
described (22).
Circulating T cell subpopulation
detection
Flow cytometry was performed to detect phenotypes of
T cells. The functional compartments of CD4+ and
CD8+T cells were phenotypically characterized as
CD3+CD4+ and CD3+CD4,
respectively. The phenotypic characteristic of Tregs were
determined according to their differential expression of CD25 and
CD127
(CD4+CD25+brightCD127-/+low
expression). The subpopulations expressing PD-1 and CTLA4 were
determined in each of the T cell subsets as follows:
CTLA4+CD4, PD-1+CD8, CTLA4+CD8,
PD-1+Treg, PD-1+CD4, CTLA4+Treg.
Phenotypical analyses of T cells were characterized by
fluorescence-activated cell sorting (FACS) using a CytoFLEX
(Beckman Coulter, Inc.) with anti-human-specific antibodies against
surface CD markers (all eBioscience; Thermo Fisher Scientific,
Inc.) as follows: CD3 (cat. no. MHCD0327; APC-Alexa
Fluor™ 750), CD4 (cat. no. 25-0049-42; PE-Cyanine), CD25
(cat. no. 12-0257-42; PE), CD127 (cat. no. 17-1278-42; APC), CTLA-4
(cat. no. 85-46-1529-42; PerCP-eFluor® 710) and PD-1
(CD279; cat. no. 61-2799-42; PE-eFluor™ 610). A total of
5 µl antibodies was added according to the manufacturer's
instructions and incubated at 4˚C for 30 min. CytExpert for DxFLEX
version 1.0 (Beckman Coulter, Inc.) was used for flow cytometry
analysis.
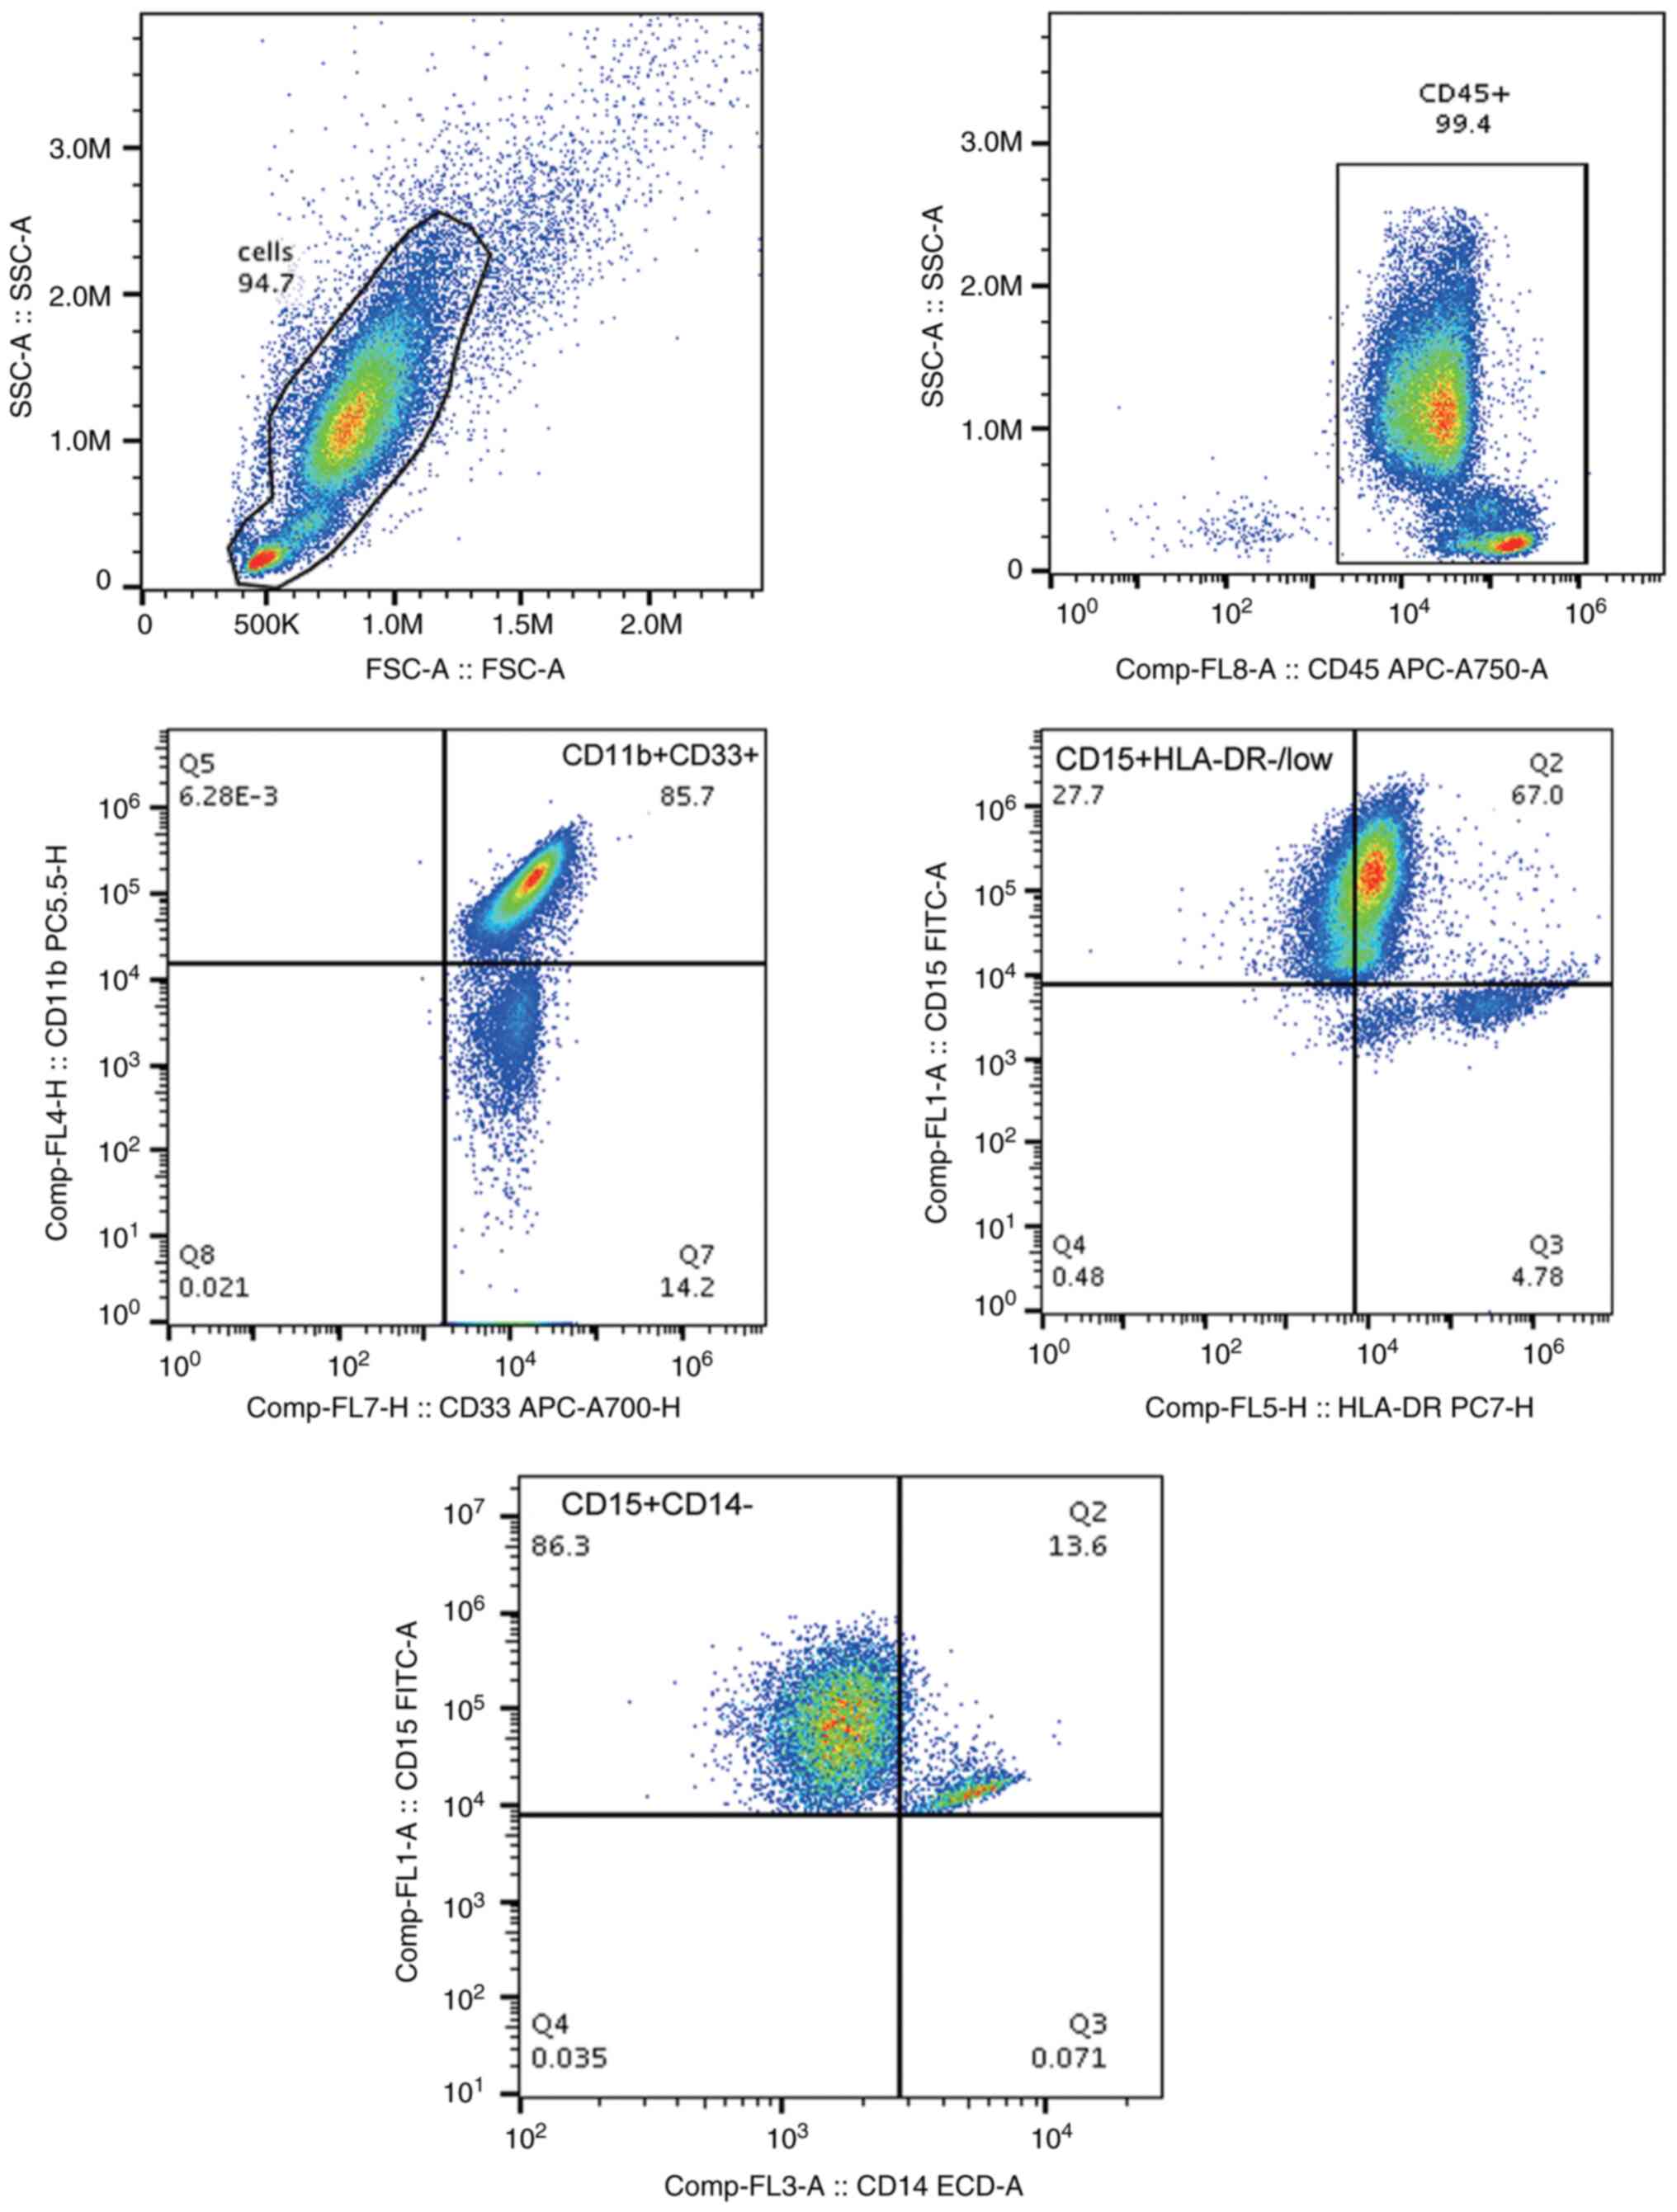
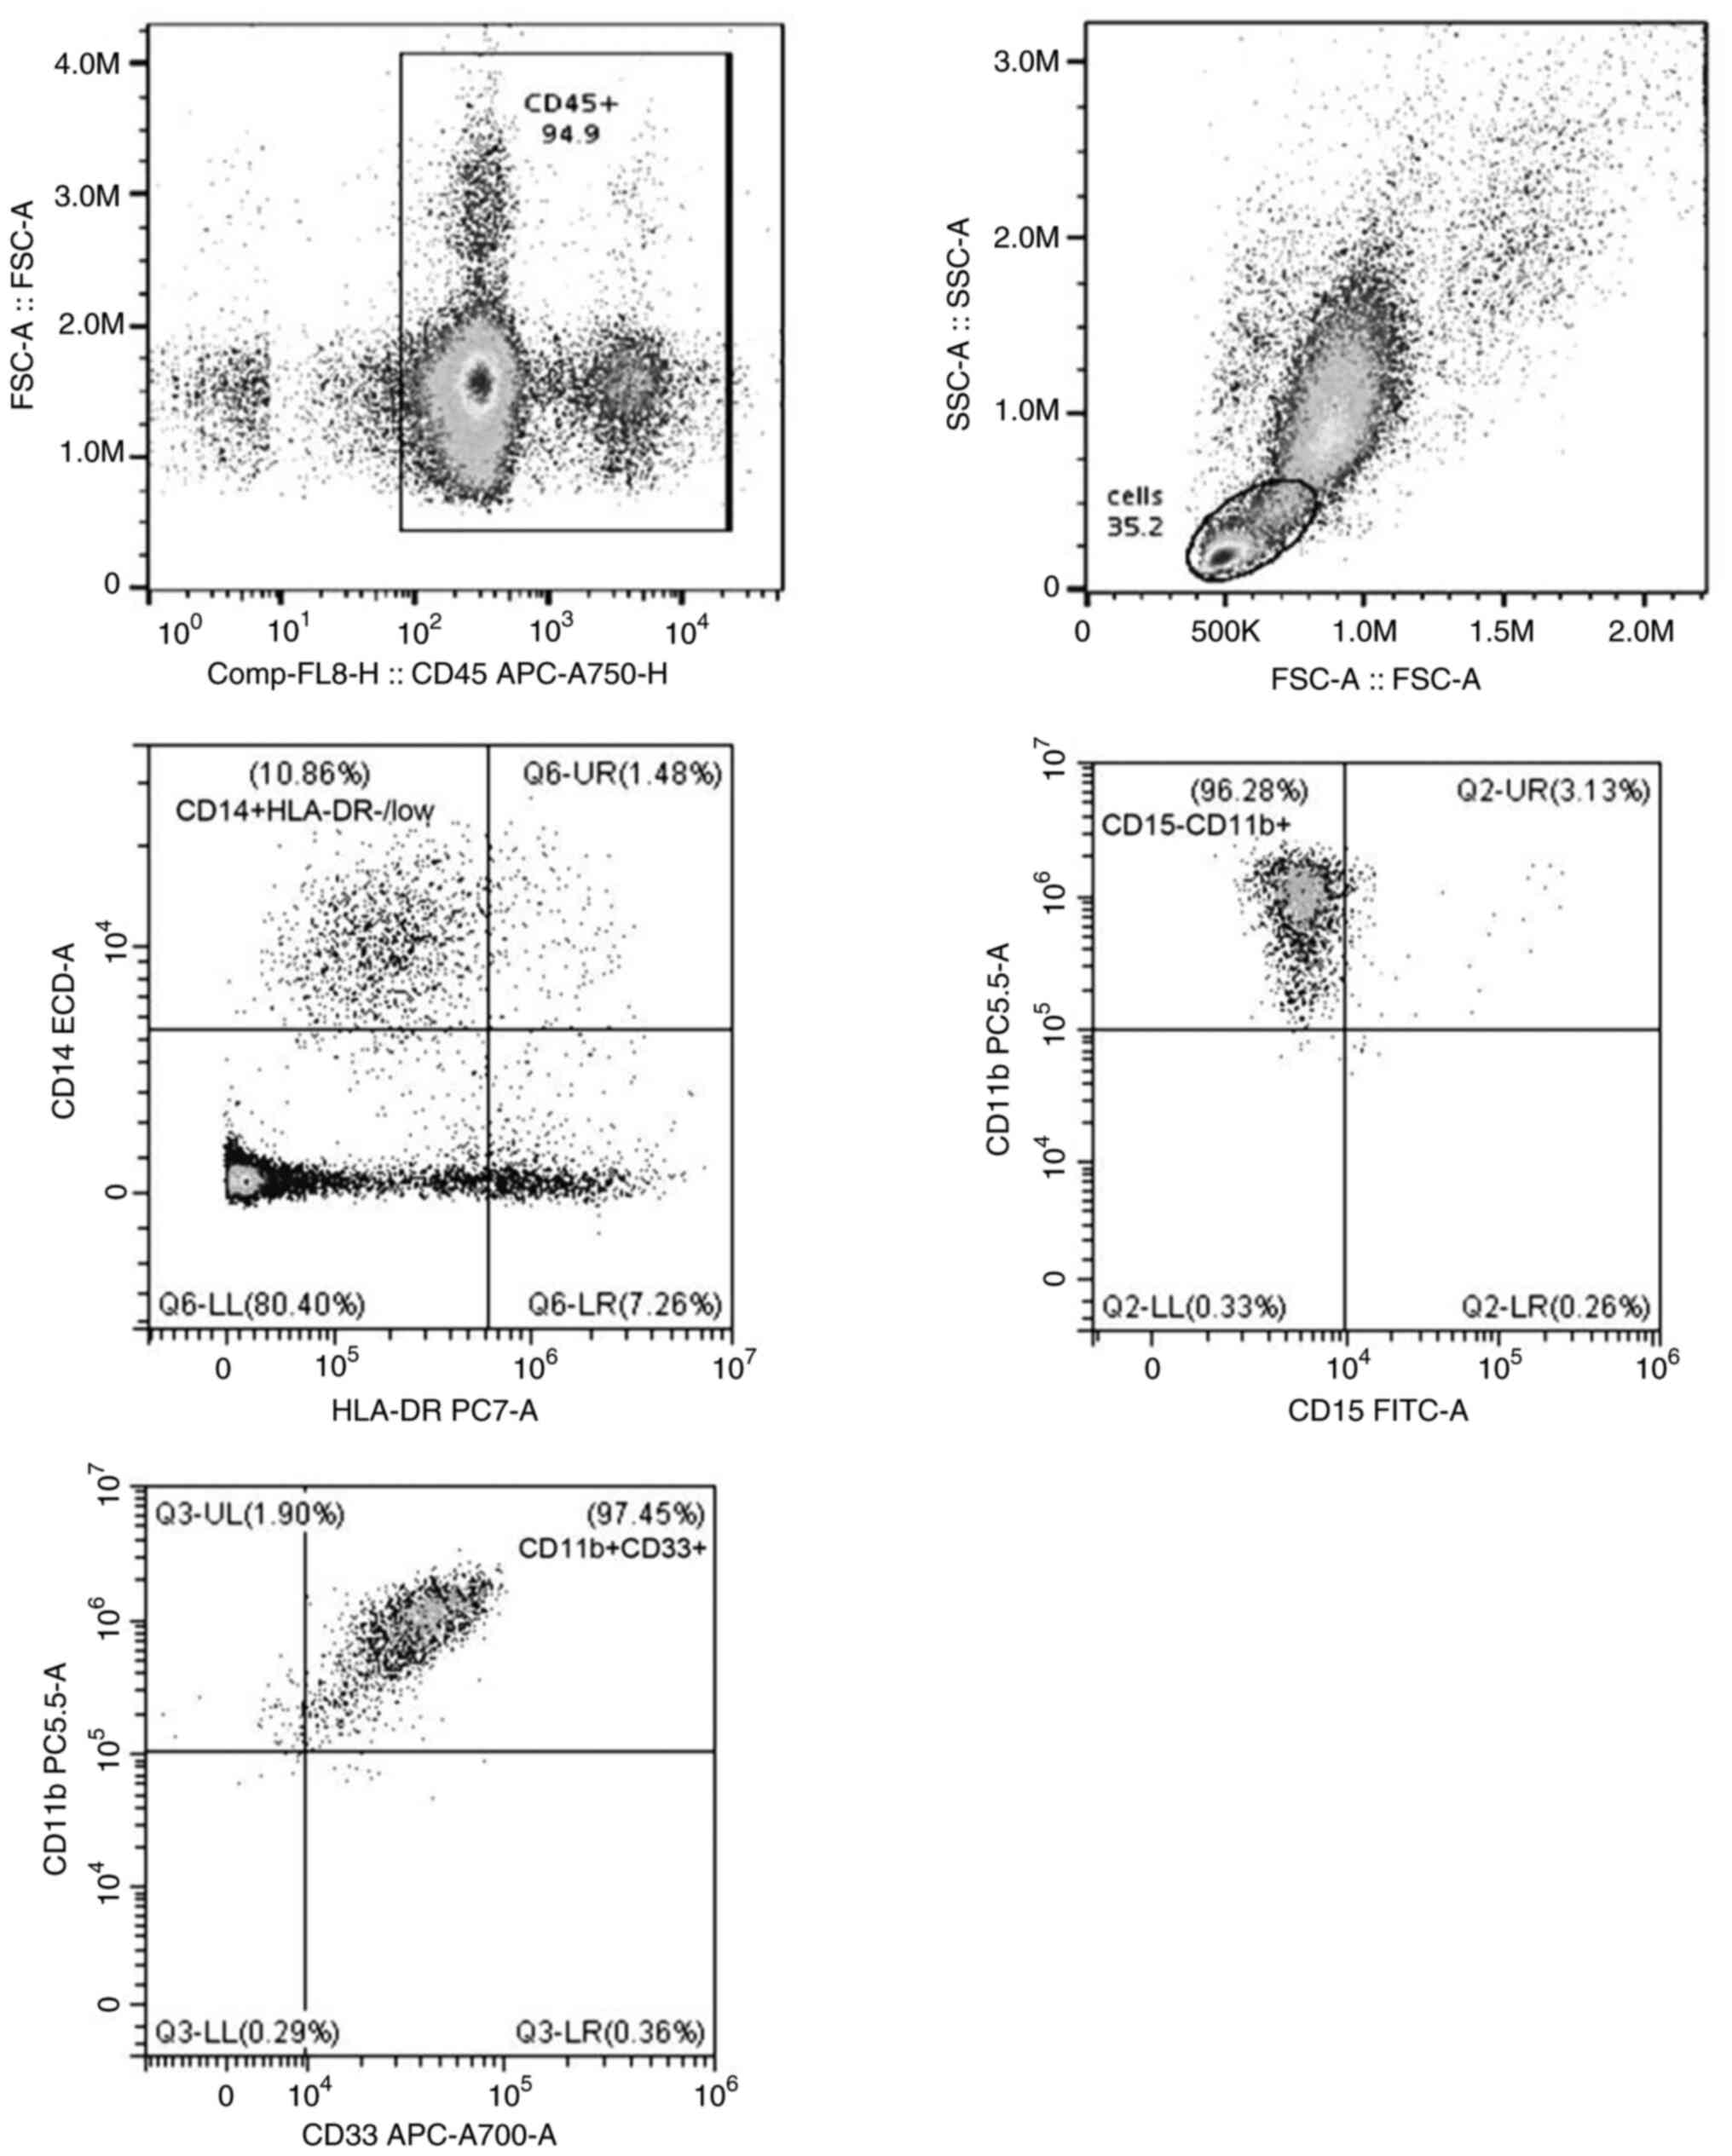
Immunophenotyping of MDSC subsets by
flow cytometry
MDSC subsets, M-MDSCs
(CD14+CD15-CD11b+CD33+HLA-DR-/low)
and G-MDSCs
(CD15+CD33+CD11b+CD14-HLA-DR-/low)
were identified by FACS using a CytoFLEX (Beckman Coulter, Inc.)
with a panel of fluorescent-labeled monoclonal antibodies (all
eBioscience; Thermo Fisher Scientific, Inc.) as follows: Anti-CD15
(cat. no. 11-0159-42), anti-CD33 (cat. no. 56-0338-42), anti-CD14
(cat. no. 61-0149-42), anti-CD45 (cat. no. 47-0459-42), anti-CD11b
(cat. no. 46-0118-42) and anti-HLA-DR (cat. no. 25-9952-42). The
frequency of cells expressing PD-2 and PD-1 was determined in MDSC
subsets by flow cytometry using fluorescent-labeled monoclonal
antibodies CD274-APC (cat. no. 17-5983-42, eBioscience, Thermo
Fisher Scientific, Inc.) and CD273-PE (12-5888-42, eBioscience,
Thermo Fisher Scientific, Inc.), allowing the identification of
PD-L1+G-MDSCs, PD-L1+M-MDSCs,
PD-L2+G-MDSCs and PD-L2+M-MDSCs. Samples were
added to 100 µl PBS, and the cell precipitates were blown and mixed
well. A total of 5 µl antibodies was added according to the
manufacturer's instructions, blown and mixed well. They were
incubated at 4˚C for 30min. CytExpert for DxFLEX version 1.0
(Beckman Coulter, Inc.) was used for flow cytometry analysis.
In vitro co-culture
PBMCs were isolated from leukocytes of patients with
lung malignancy and healthy controls. M-MDSCs
(CD14+CD15-CD11b+CD33+HLA-DR-/low)
and G-MDSCs
(CD15+CD33+CD11b+CD14-HLA-DR-/low)
were independently isolated and purified (>90%) by flow
cytometry as aforementioned. Naive CD4+T cells were
isolated from peripheral blood using a commercial kit (cat. no.
130-094-131; Miltenyi Biotec GmbH) according to the manufacturer's
instructions. The purity of naive T cells
(CD45RA+CD4+CCR7+) was verified by
flow cytometry as aforementioned. M-MDSCs and G-MDSCs, sourced from
leukocytes of lung malignancy and healthy control were co-cultured
with naive CD4+T cells in 96-well plate,
2.5x10⁵ cells/well, in RPMI-1640 (Invitrogen, Carlsbad,
CA, USA) containing 10% fetal bovine serum (FBS, Hyclone, Logan,
UT, USA) in a 5% CO2 humid atmosphere at 37˚C. Soluble
anti-CD3 (1 mg/ml; cat. no. 16-0037-81; eBioscience; Thermo Fisher
Scientific, Ind.) and anti-CD28 (1 mg/ml; cat. no. 16-0289-81;
eBioscience; Thermo Fisher Scientific, Inc.) in a CO2
incubator at 37˚C for 4 h were added to achieve T cell receptor
(TCR) stimulation via the TCR/CD3 complex. The cells were cultured
in RPMI-1640 supplemented with 10% FBS in a 5% CO2 humid
atmosphere at 37˚C for 5 days. The proliferation and apoptosis of T
cells, as well as differentiation of Tregs, were examined by using
flow cytometry as aforementioned.
Statistical analysis
GraphPad Prism 8.0 software (GraphPad Software,
Inc.; Dotmatics) was used to analyze data. Experiments were
performed with three replicates in at least three independent
experiments; data are presented as the mean ± standard deviation.
For the data with normal distribution, one-way analysis of variance
followed by Tukey's post hoc analysis or unpaired t test were
performed for multiple and two group comparisons, respectively.
Pearson's correlation analysis was used to evaluate the
relationship of T cell and MDSC subsets. Categorical variables are
expressed as proportions and analyzed using χ2 test.
P<0.05 was considered to indicate a statistically significant
difference.
Results
Demographic and clinical
characteristics of the subjects
The 102 lung malignancy cases were classified as
follows: Stage I (n=13), II (n=16), III (n=18) and IV (n=55);
squamous cell carcinoma (n=35), adenocarcinoma (n=50), large cell
carcinoma (n=7) and SCLC (n=10; data not shown). A total of 49
cases exhibited distant metastasis and 41 were non-smokers. Among
these healthy individuals, there were 12 non-smokers and 22
smokers. Lung malignancy cases and healthy individuals were age-,
sex- and smoking-matched.
Frequency of peripheral blood T cell
subsets in lung cancer
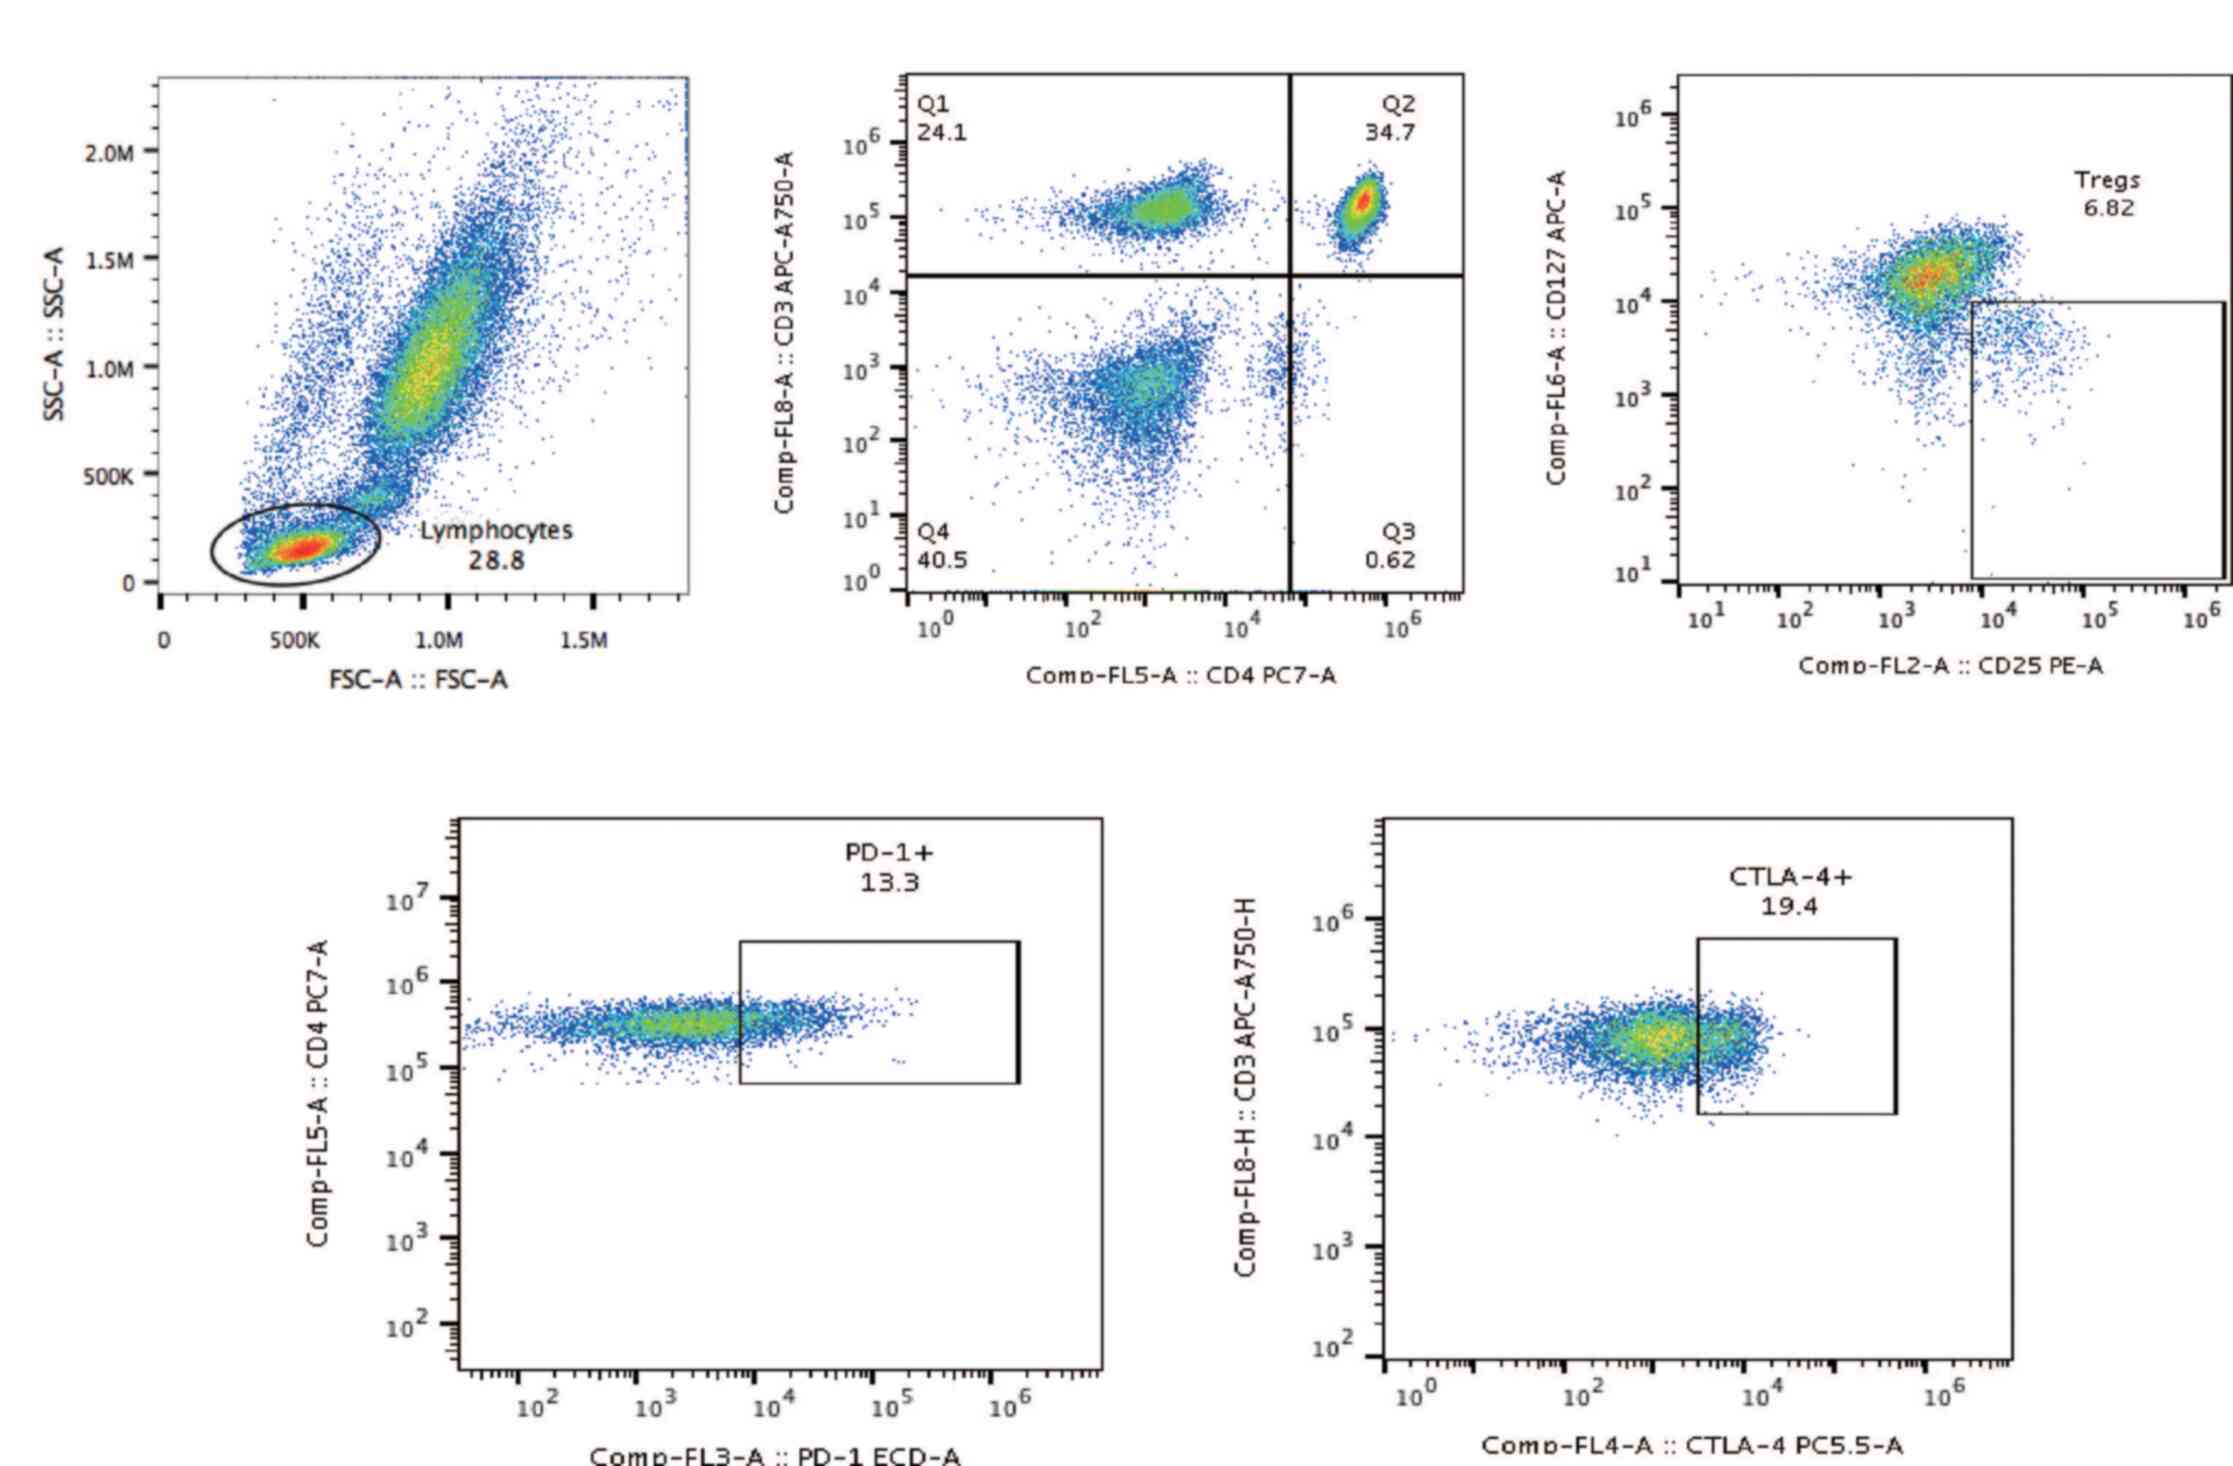
The strategy for flow cytometric analysis to
identify T cell subpopulations in the circulation is presented in
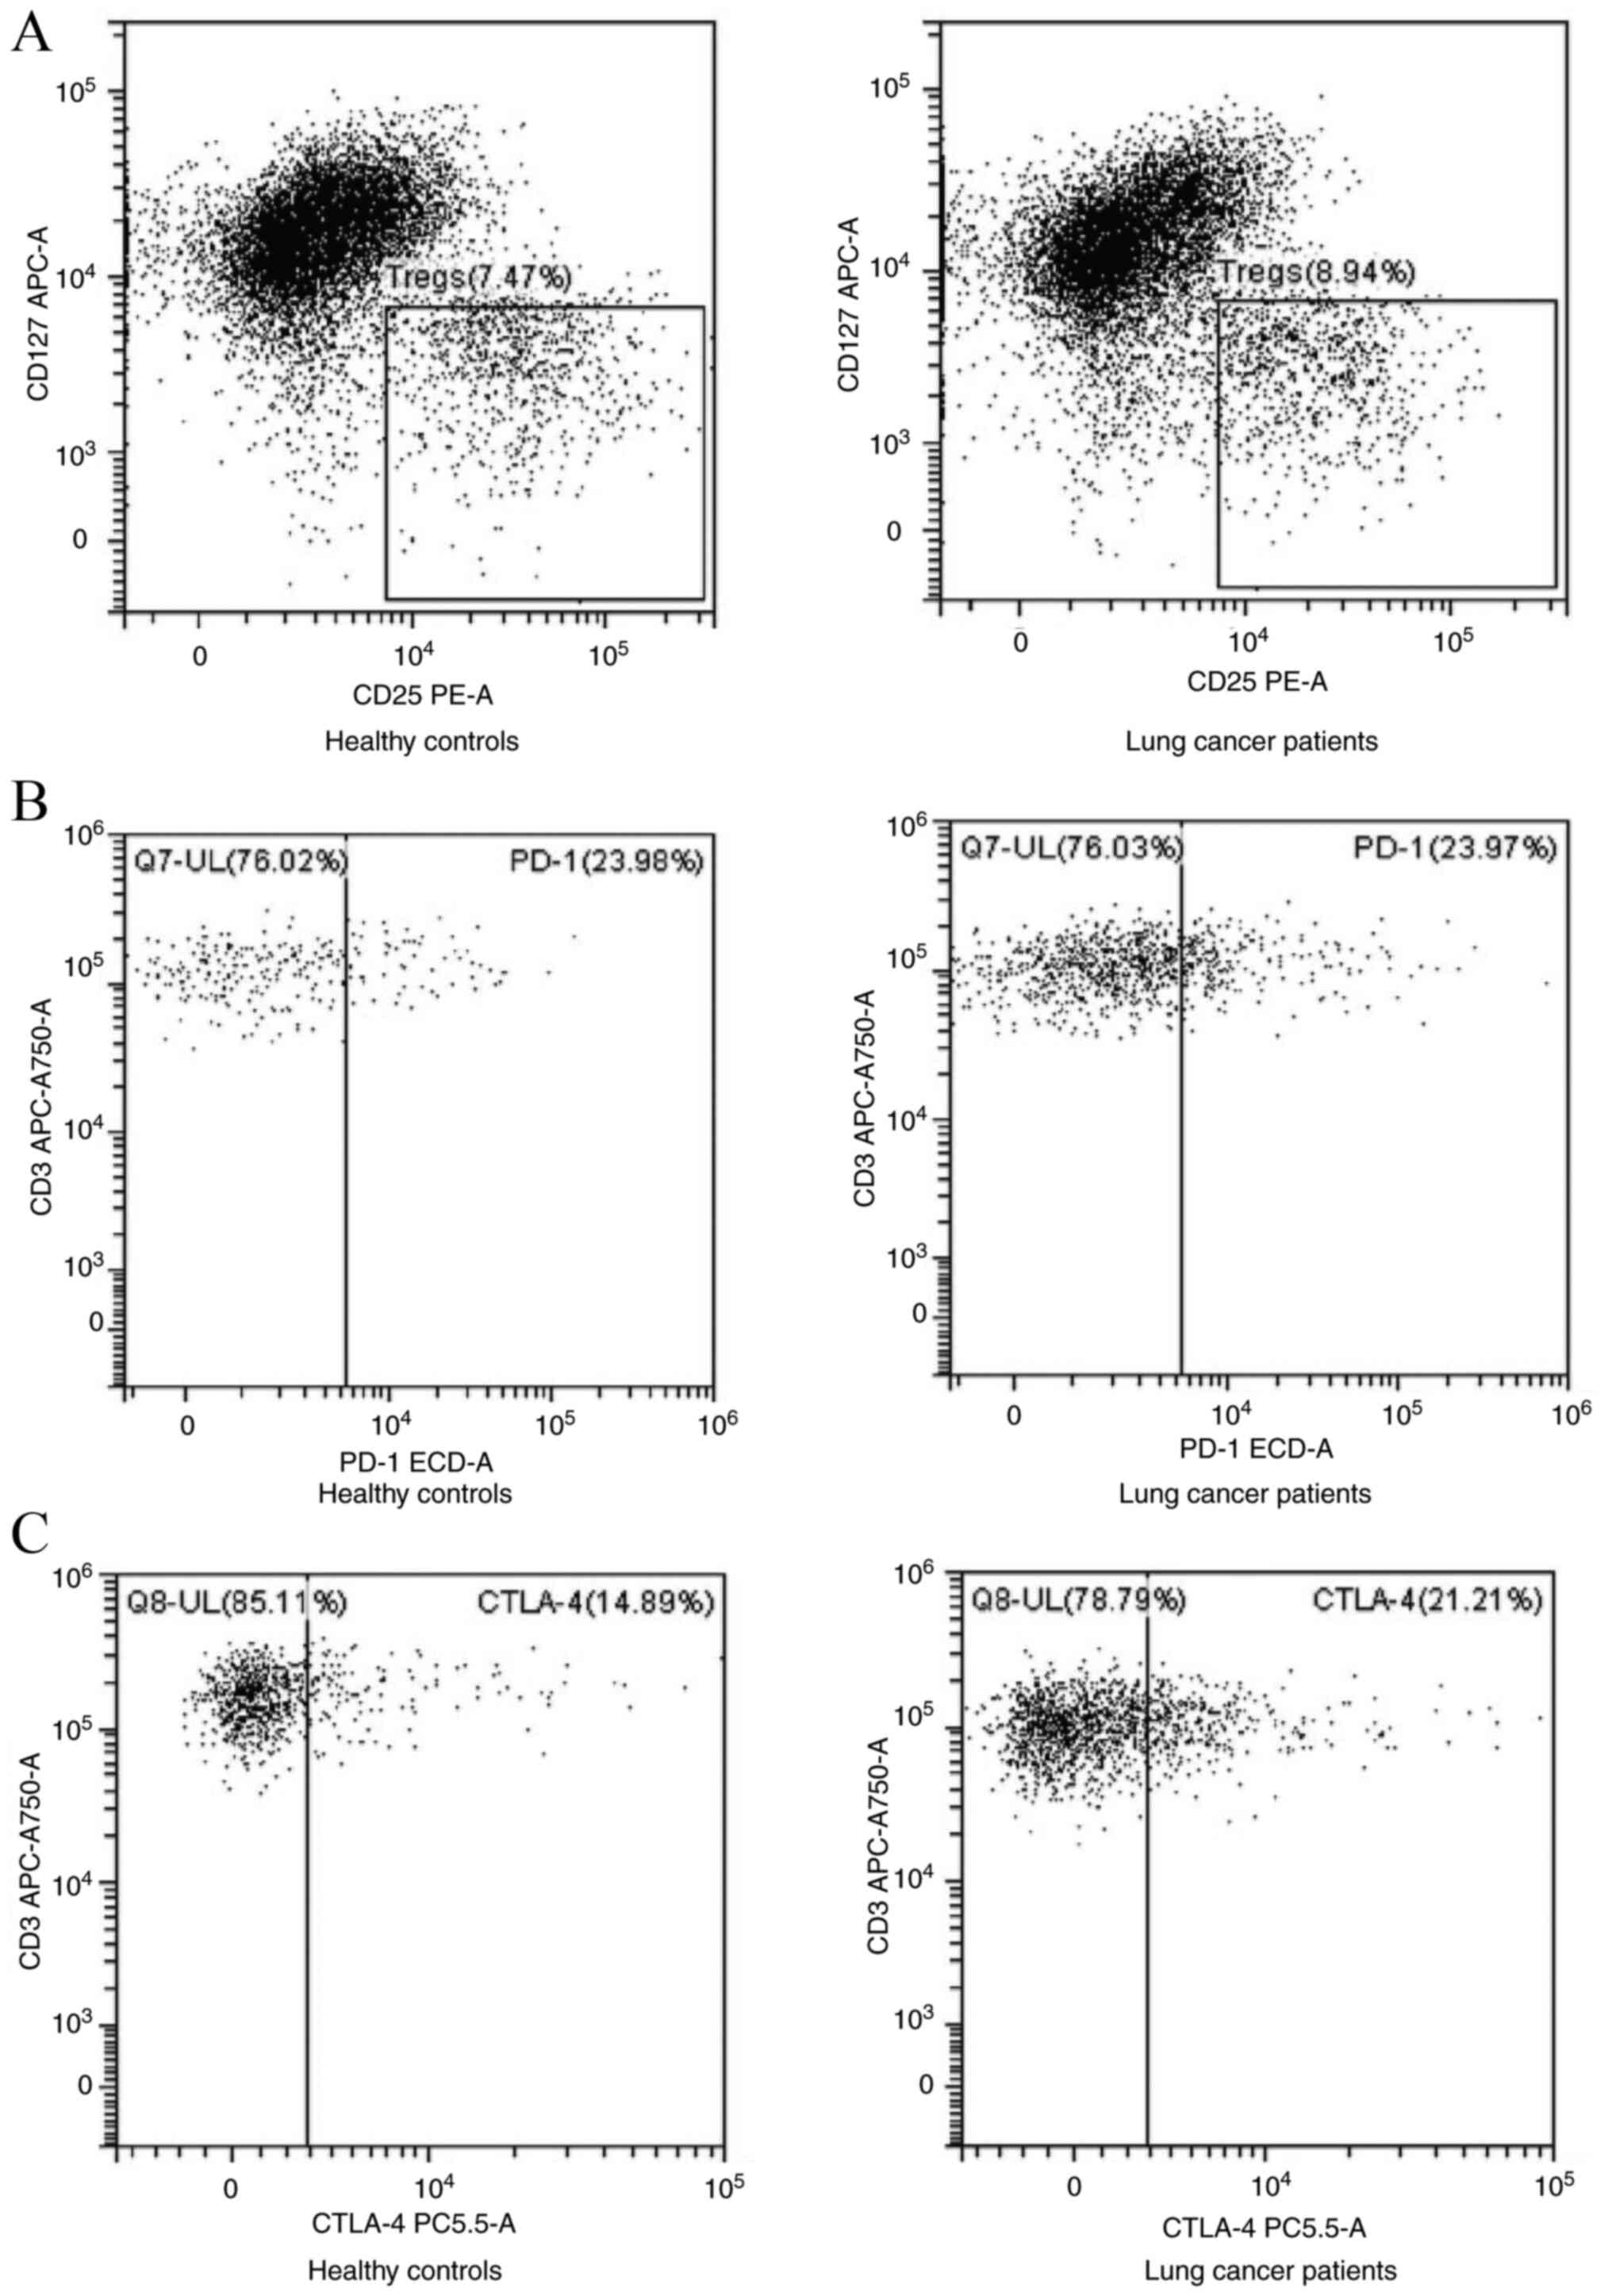
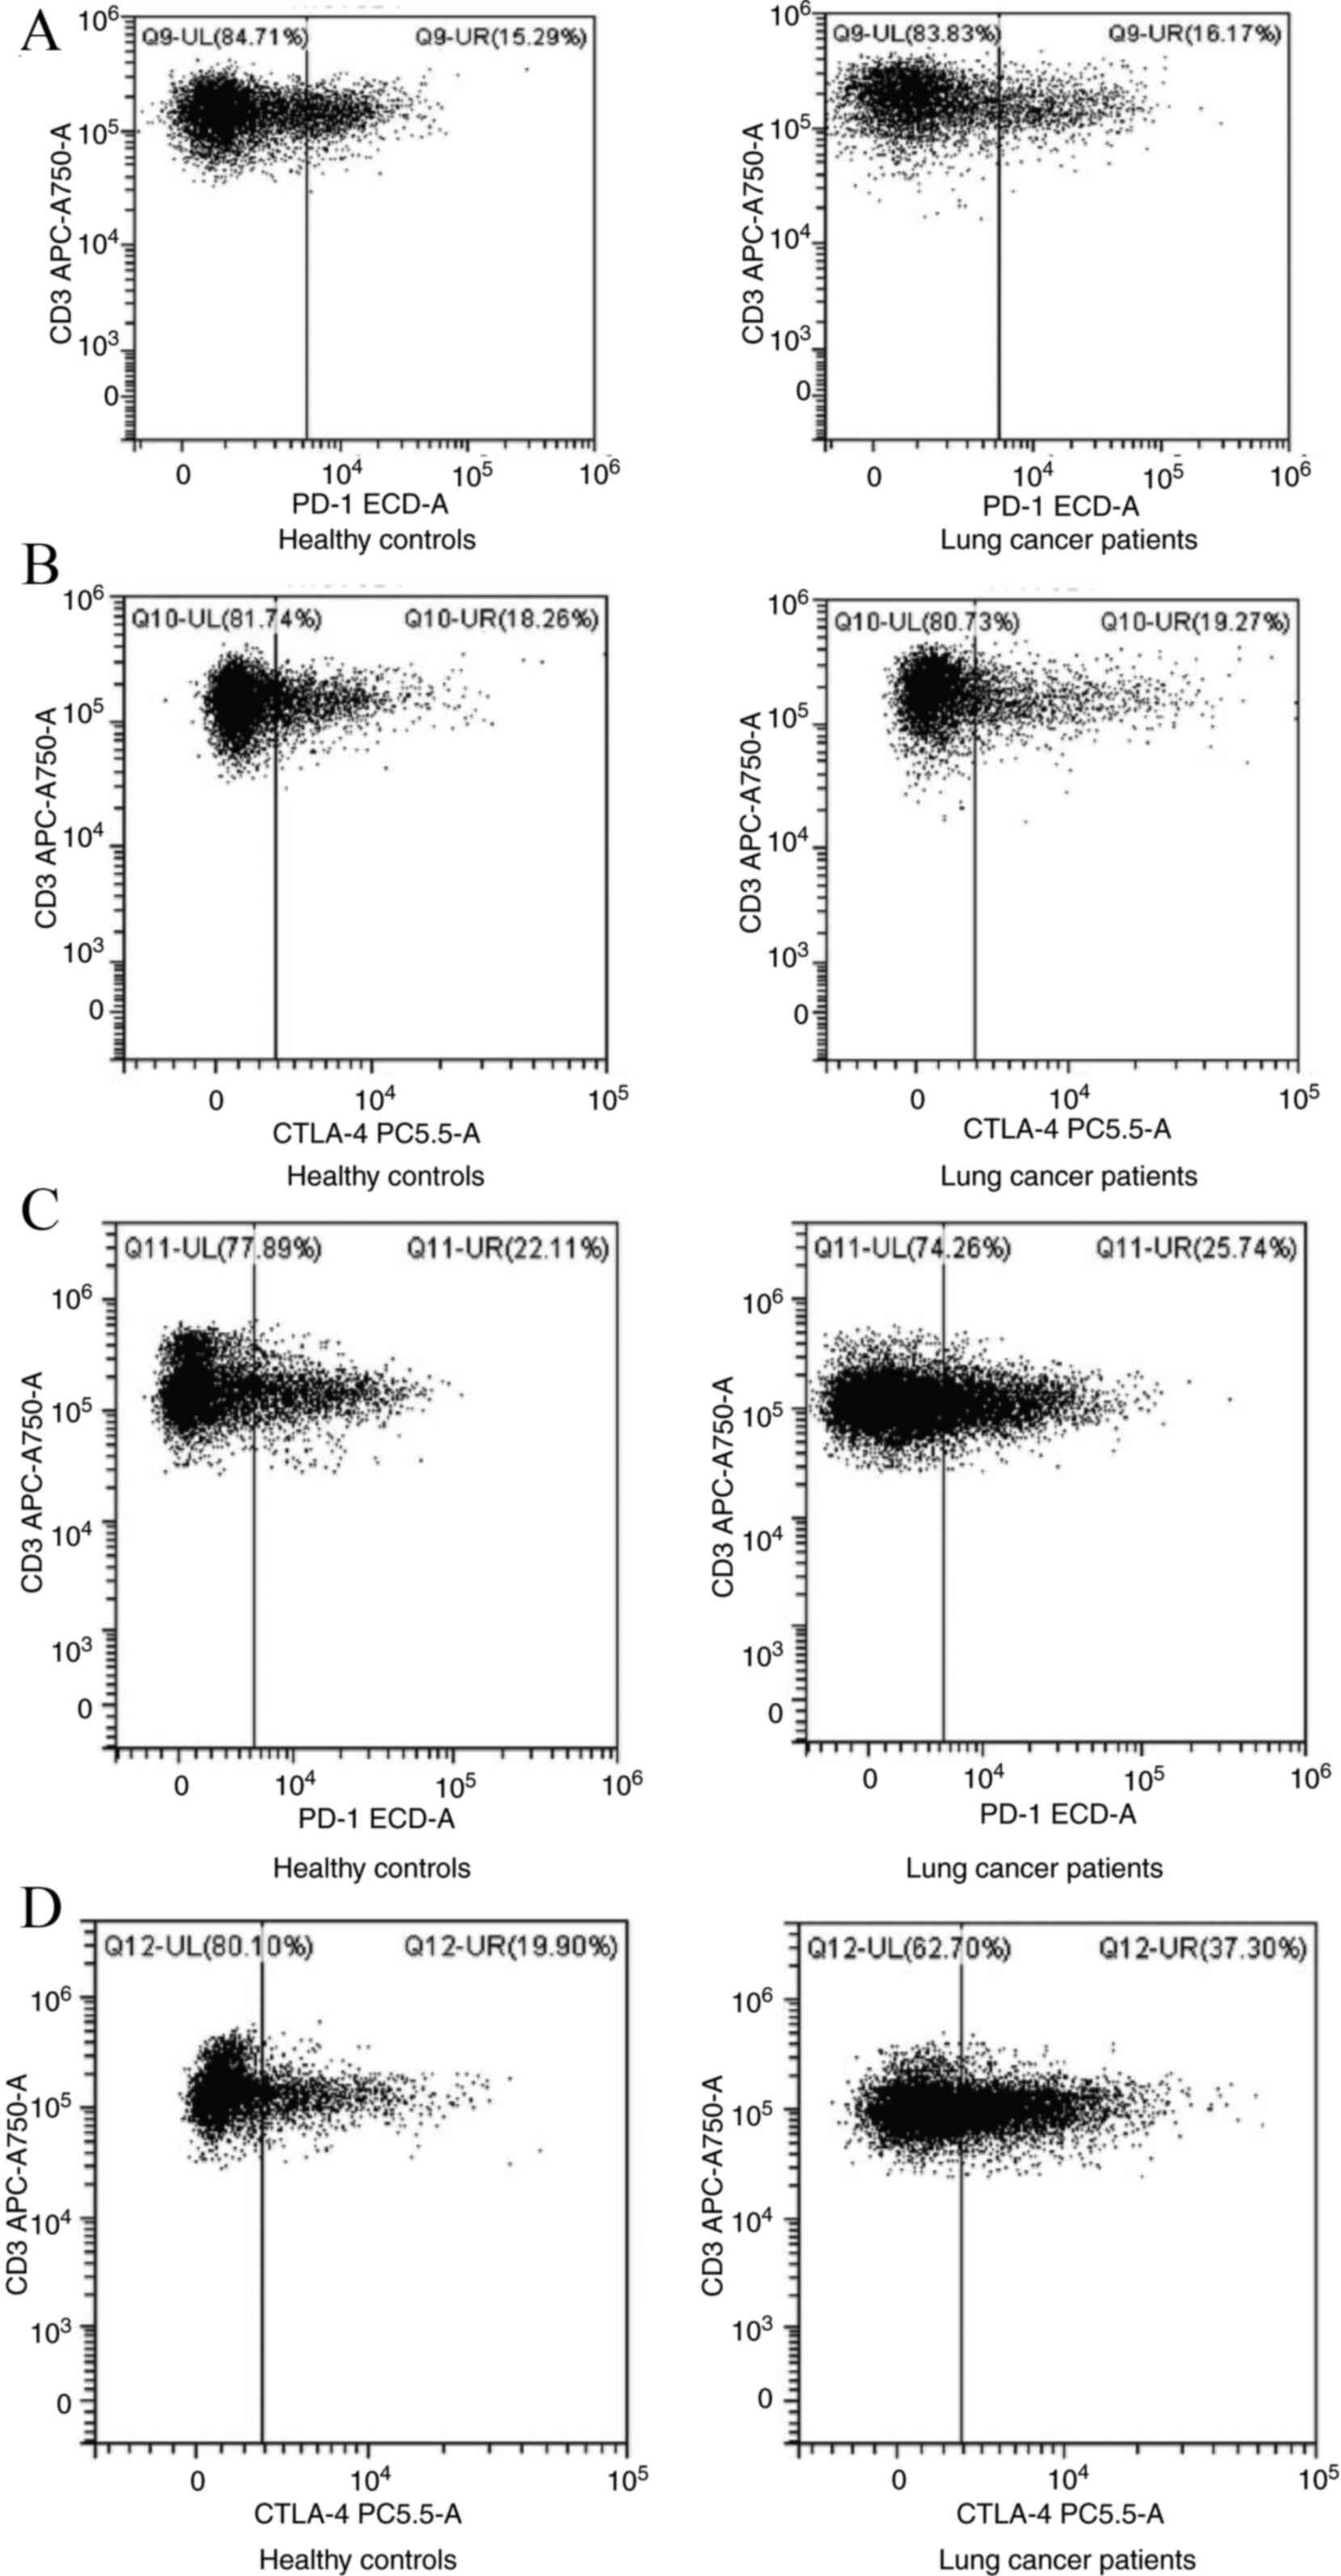
Fig. 1. Flow cytometric analyses of
PD-1+CD8+ T cells, Tregs,
PD-1+Tregs, CTLA-4+CD4+ T cells,
CTLA-4+Tregs, and PD-1+CD4+ and
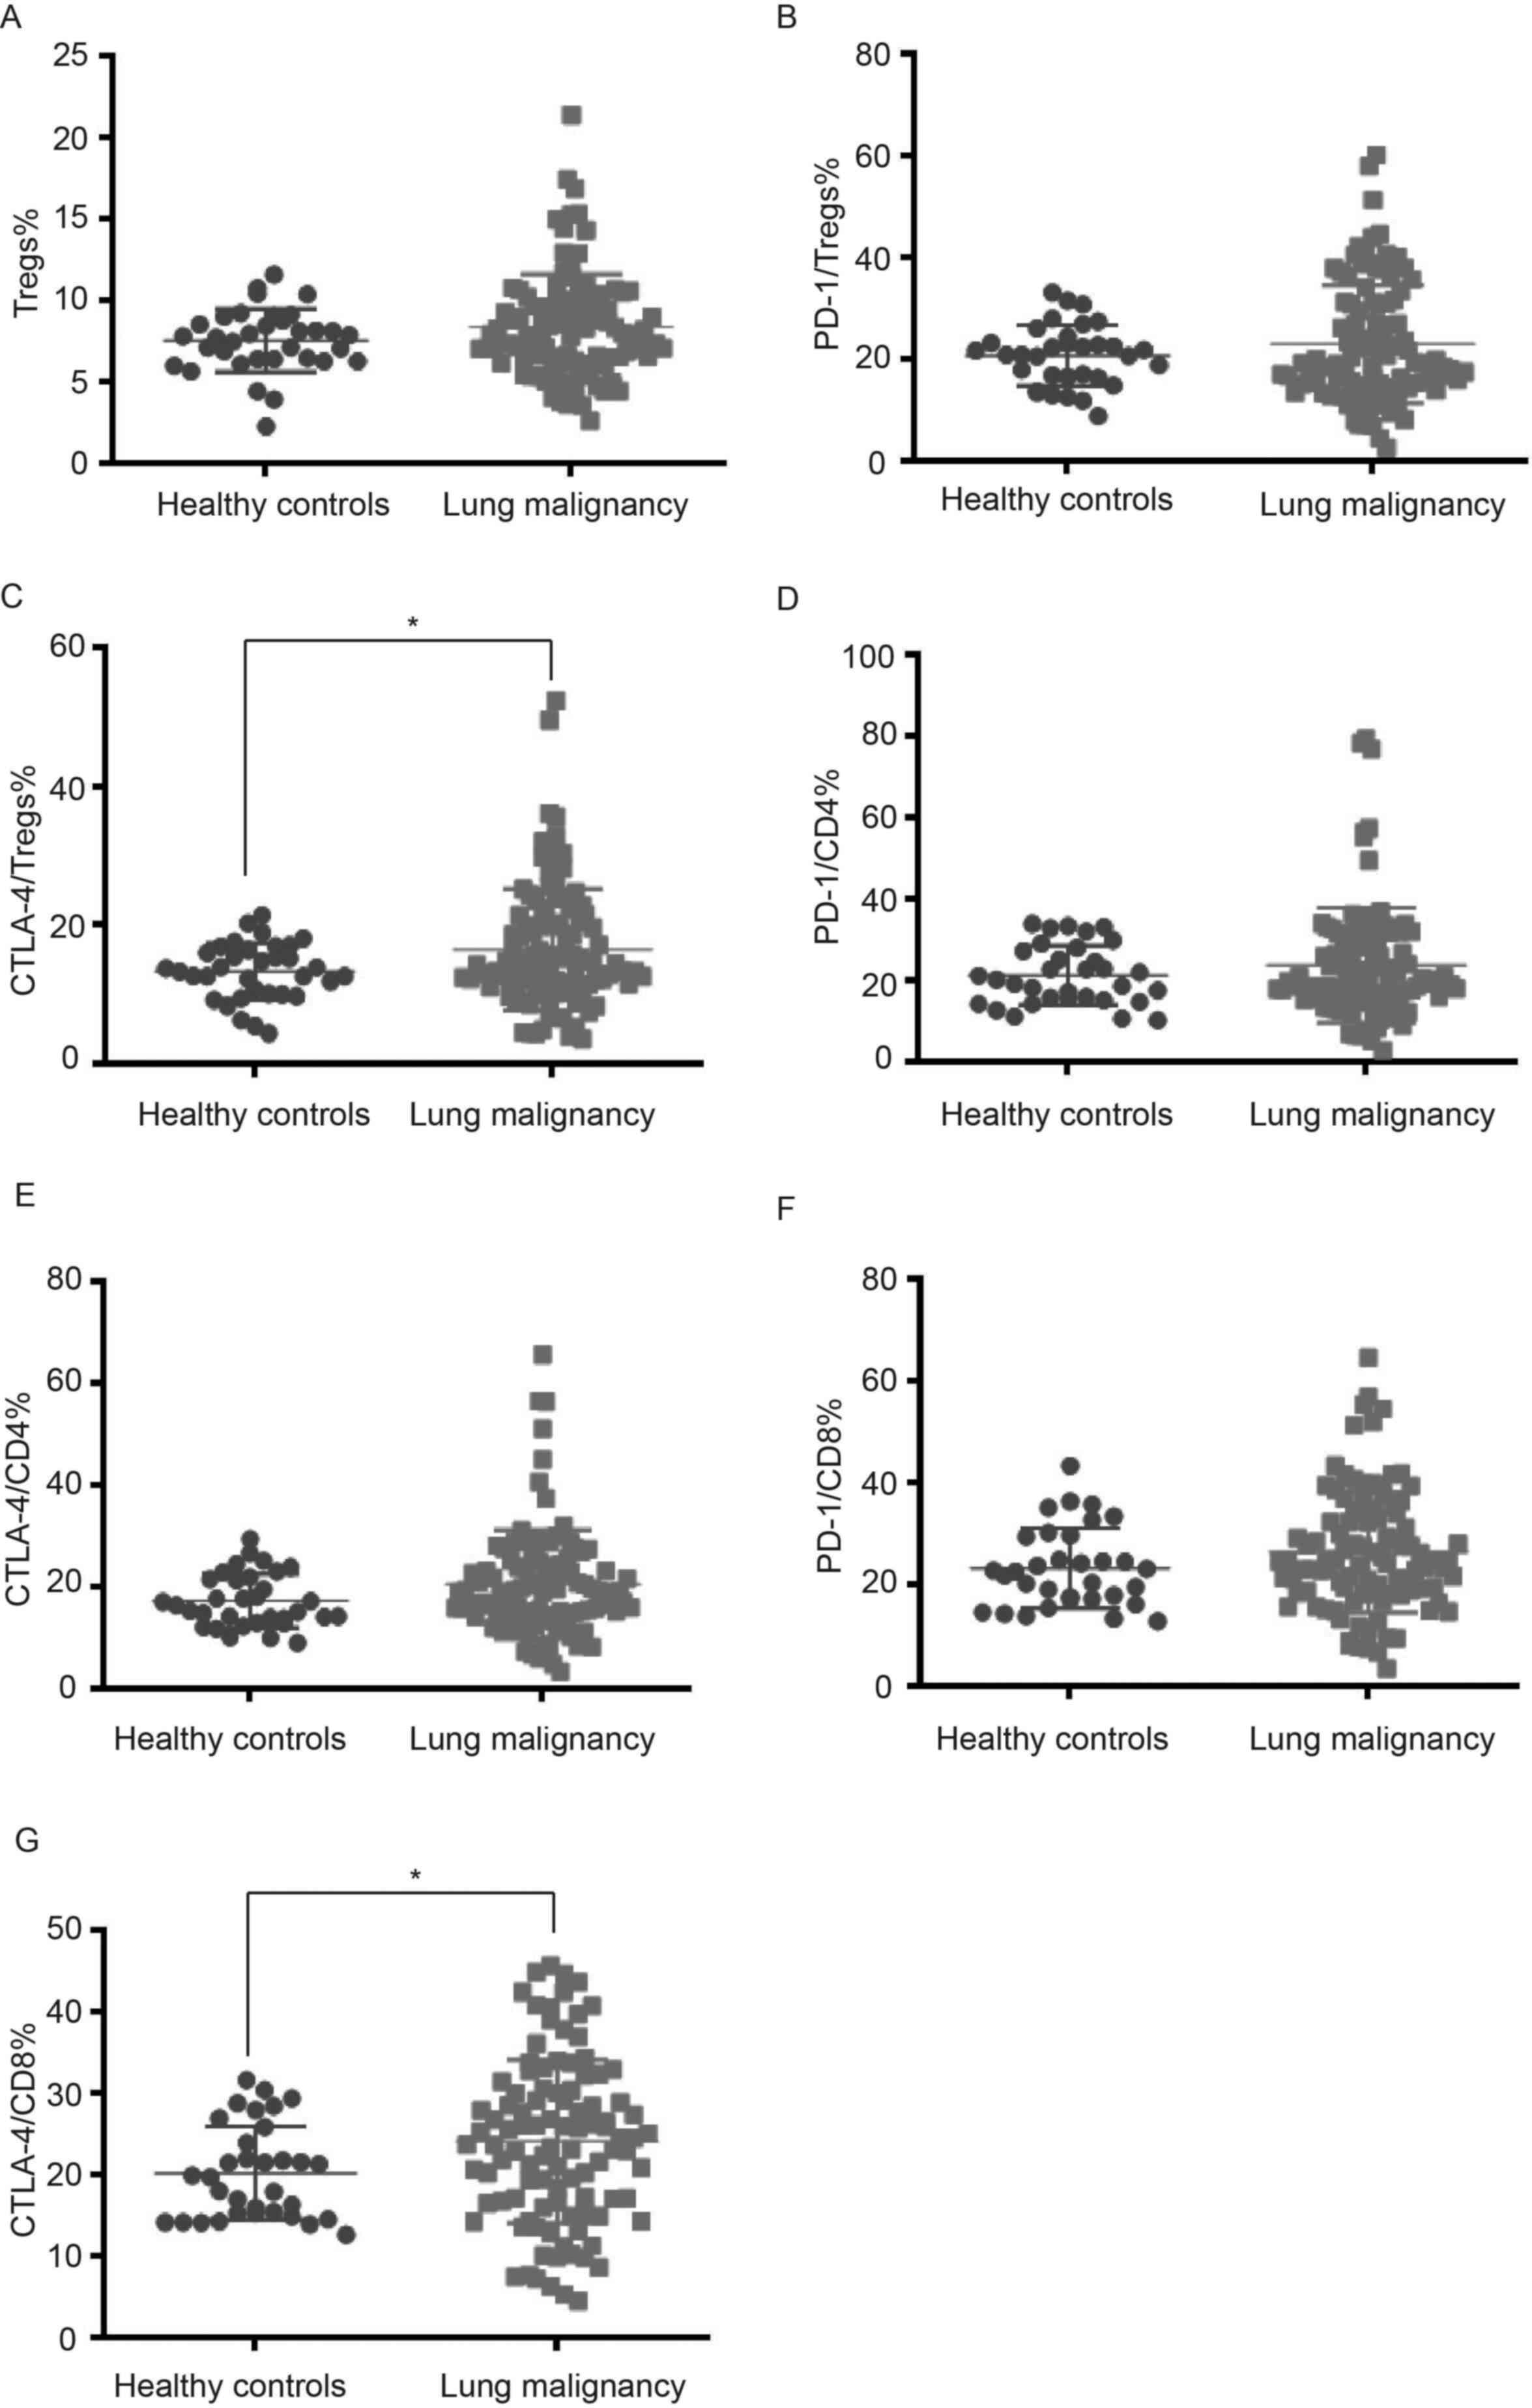
CTLA-4+CD8+ T cells are shown in Figs. 2 and 3. There were no notable differences
concerning the frequencies of Tregs, PD-1+Tregs and
PD-1+CD4+, CTLA-4+CD4+
and PD-1+CD8+ T cells in the peripheral blood
of patients with lung cancer and healthy controls. However, there
were higher frequencies of peripheral CTLA-4+Tregs and
CTLA-4+CD8+ T cells in lung malignancy cases
compared with healthy individuals (P<0.05; Fig. 4; Table
I).
 | Table IFrequency (%) of peripheral blood T
cell subsets in the peripheral blood between patients with lung
cancer and healthy controls. |
Table I
Frequency (%) of peripheral blood T
cell subsets in the peripheral blood between patients with lung
cancer and healthy controls.
| T cell subset | Healthy controls
(n=34) | Lung cancer
(n=102) | P-value |
|---|
| Tregs | 7.55±1.94 | 8.38±3.24 | 0.161 |
|
PD-1+Tregs | 20.38±6.09 | 22.97±11.62 | 0.216 |
|
CTLA-4+Tregs | 13.31±4.08 | 16.43±8.77 | 0.047a |
|
PD-1+CD4 | 21.02±7.21 | 23.68±14.10 | 0.295 |
|
CTLA-4+CD4 | 17.25±5.16 | 20.47±10.67 | 0.093 |
|
PD-1+CD8 | 23.12±7.71 | 26.27±11.84 | 0.149 |
|
CTLA-4+CD8 | 19.98±5.74 | 24.06±10.05 | 0.026a |
Association between clinical variables
and the frequencies of CTLA-4+Tregs and
CTLA-4+CD8+ T cells in lung cancer
The present study investigated whether
CTLA-4+Tregs and CTLA-4+CD8+ T
cells were associated with clinical variables of cases with lung
malignancy. A lower frequency of CTLA-4+CD8+
T cells was found in cases at stage III + IV compared with those at
stage I + II (P=0.009; Table II),
indicating the proportion of CTLA-4+CD8+ T
cells was associated with TNM stage. However, frequencies of
CTLA-4+Tregs and CTLA-4+CD8+ T
cells were not significantly associated with age, sex, smoking
status, histological type and distant metastasis; frequency of
CTLA-4+Tregs was not associated with TNM stage
(P>0.05).
| Table IIAssociation between clinical
variables of patients with lung cancer and the frequencies of
CTLA-4+Tregs and CTLA-4+CD8+ T
cells in the peripheral blood. |
Table II
Association between clinical
variables of patients with lung cancer and the frequencies of
CTLA-4+Tregs and CTLA-4+CD8+ T
cells in the peripheral blood.
| | CTLA4/Tregs | CTLA4/CD8 |
|---|
| Clinical
variable | n | Frequency, % | P-value | Frequency, % | P-value |
|---|
| Age, years | | | 0.766 | | 0.430 |
|
≤65 | 45 | 16.11±8.37 | | 24.95±11.08 | |
|
>65 | 57 | 16.68±9.13 | | 23.36±9.19 | |
| Sex | | | 0.354 | | 0.508 |
|
Male | 71 | 15.90±8.28 | | 23.62±9.46 | |
|
Female | 31 | 17.66±9.84 | | 25.06±11.39 | |
| Smoking status | | | 0.893 | | 0.807 |
|
Smoker | 61 | 16.53±8.45 | | 23.86±10.12 | |
|
Non-smoker | 41 | 16.29±9.33 | | 24.36±10.05 | |
| TNM stage | | | 0.628 | | 0.009a |
|
I + II | 29 | 15.76±8.67 | | 28.14±7.13 | |
|
III +
IV | 73 | 16.70±8.85 | | 22.44±10.60 | |
| Histological
type | | | 0.992 | | 0.756 |
|
Squamous
cell carcinoma | 35 | 16.22±7.80 | | 24.22±10.07 | |
|
Adenocarcinoma | 50 | 16.53±9.80 | | 23.60±10.49 | |
|
Large cell
carcinoma | 7 | 16.99±7.47 | | 24.79±11.81 | |
|
Small cell
lung cancer | 10 | 17.08±7.93 | | 27.41±7.87 | |
| Distant
metastasis | | | 0.279 | | 0.482 |
|
Yes | 49 | 17.41±9.32 | | 23.33±10.45 | |
|
No | 53 | 15.52±8.21 | | 24.74±9.71 | |
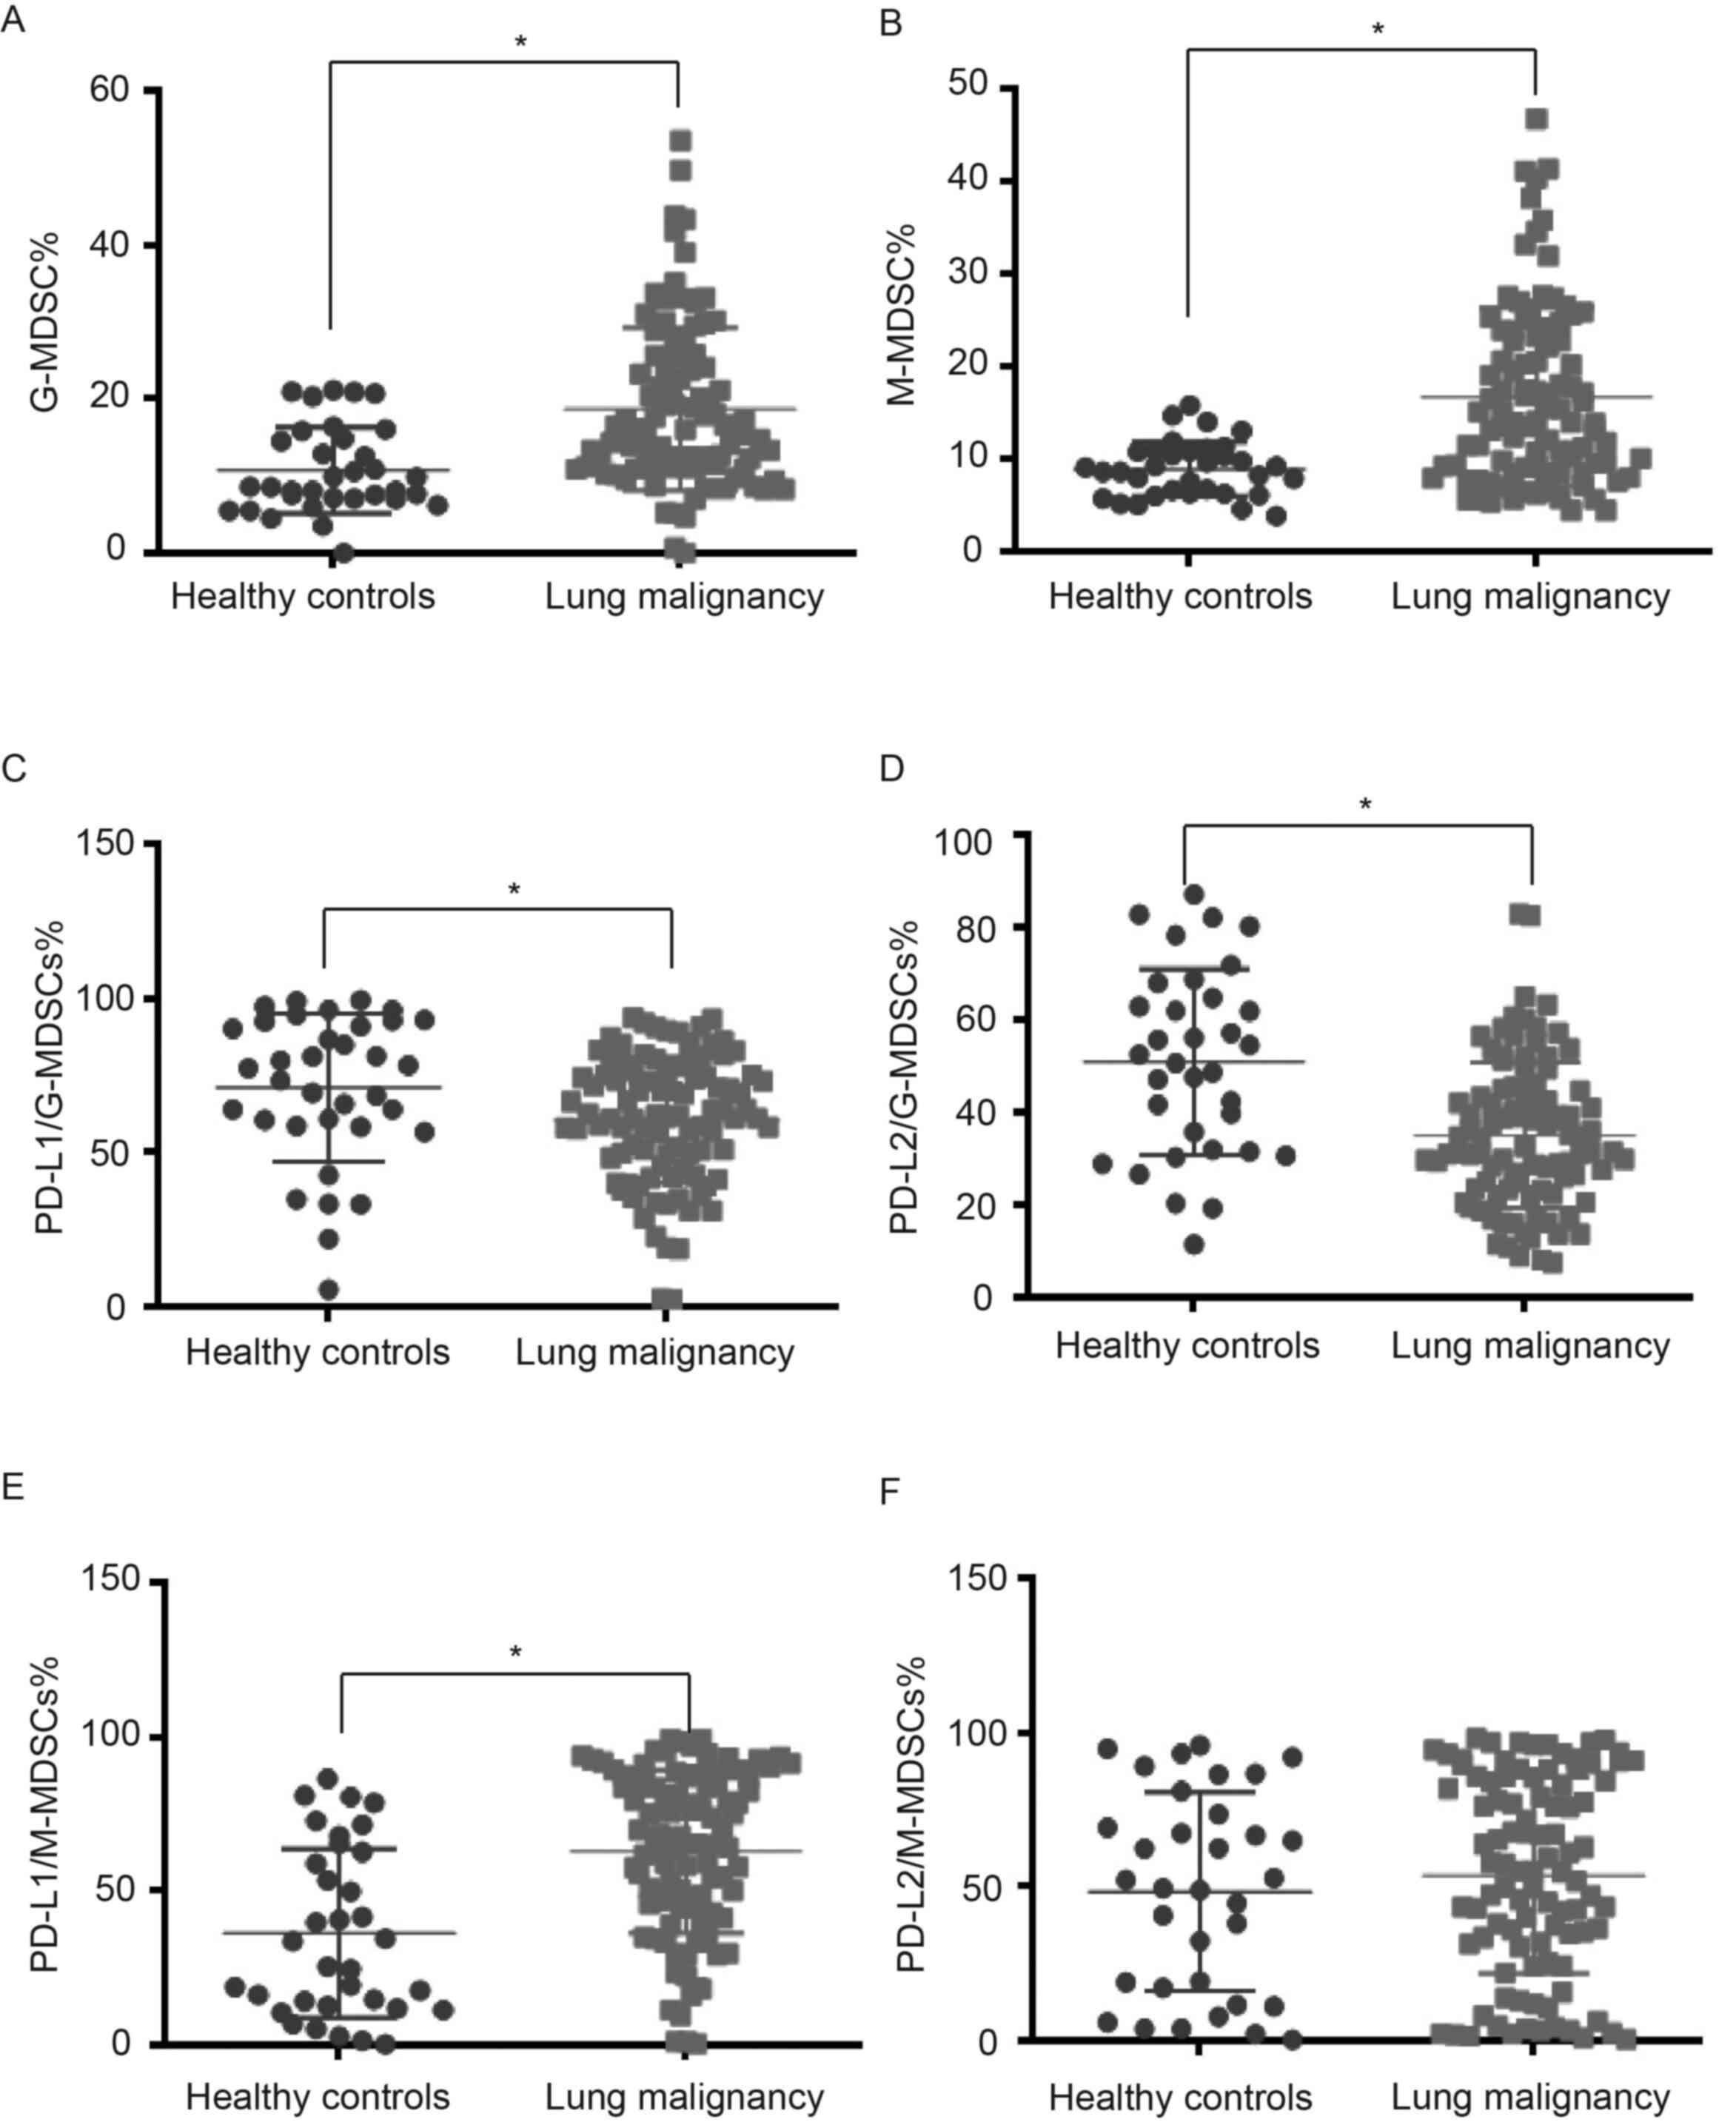
Frequencies of peripheral blood MDSC
subsets in lung cancer
The strategies of flow cytometric analyses to
identify G-MDSCs and M-MDSCs in the circulation are shown in
Figs. 5 and 6. A greater diversity of G-MDSC and M-MDSC
subpopulations was noted in lung malignancy cases compared with
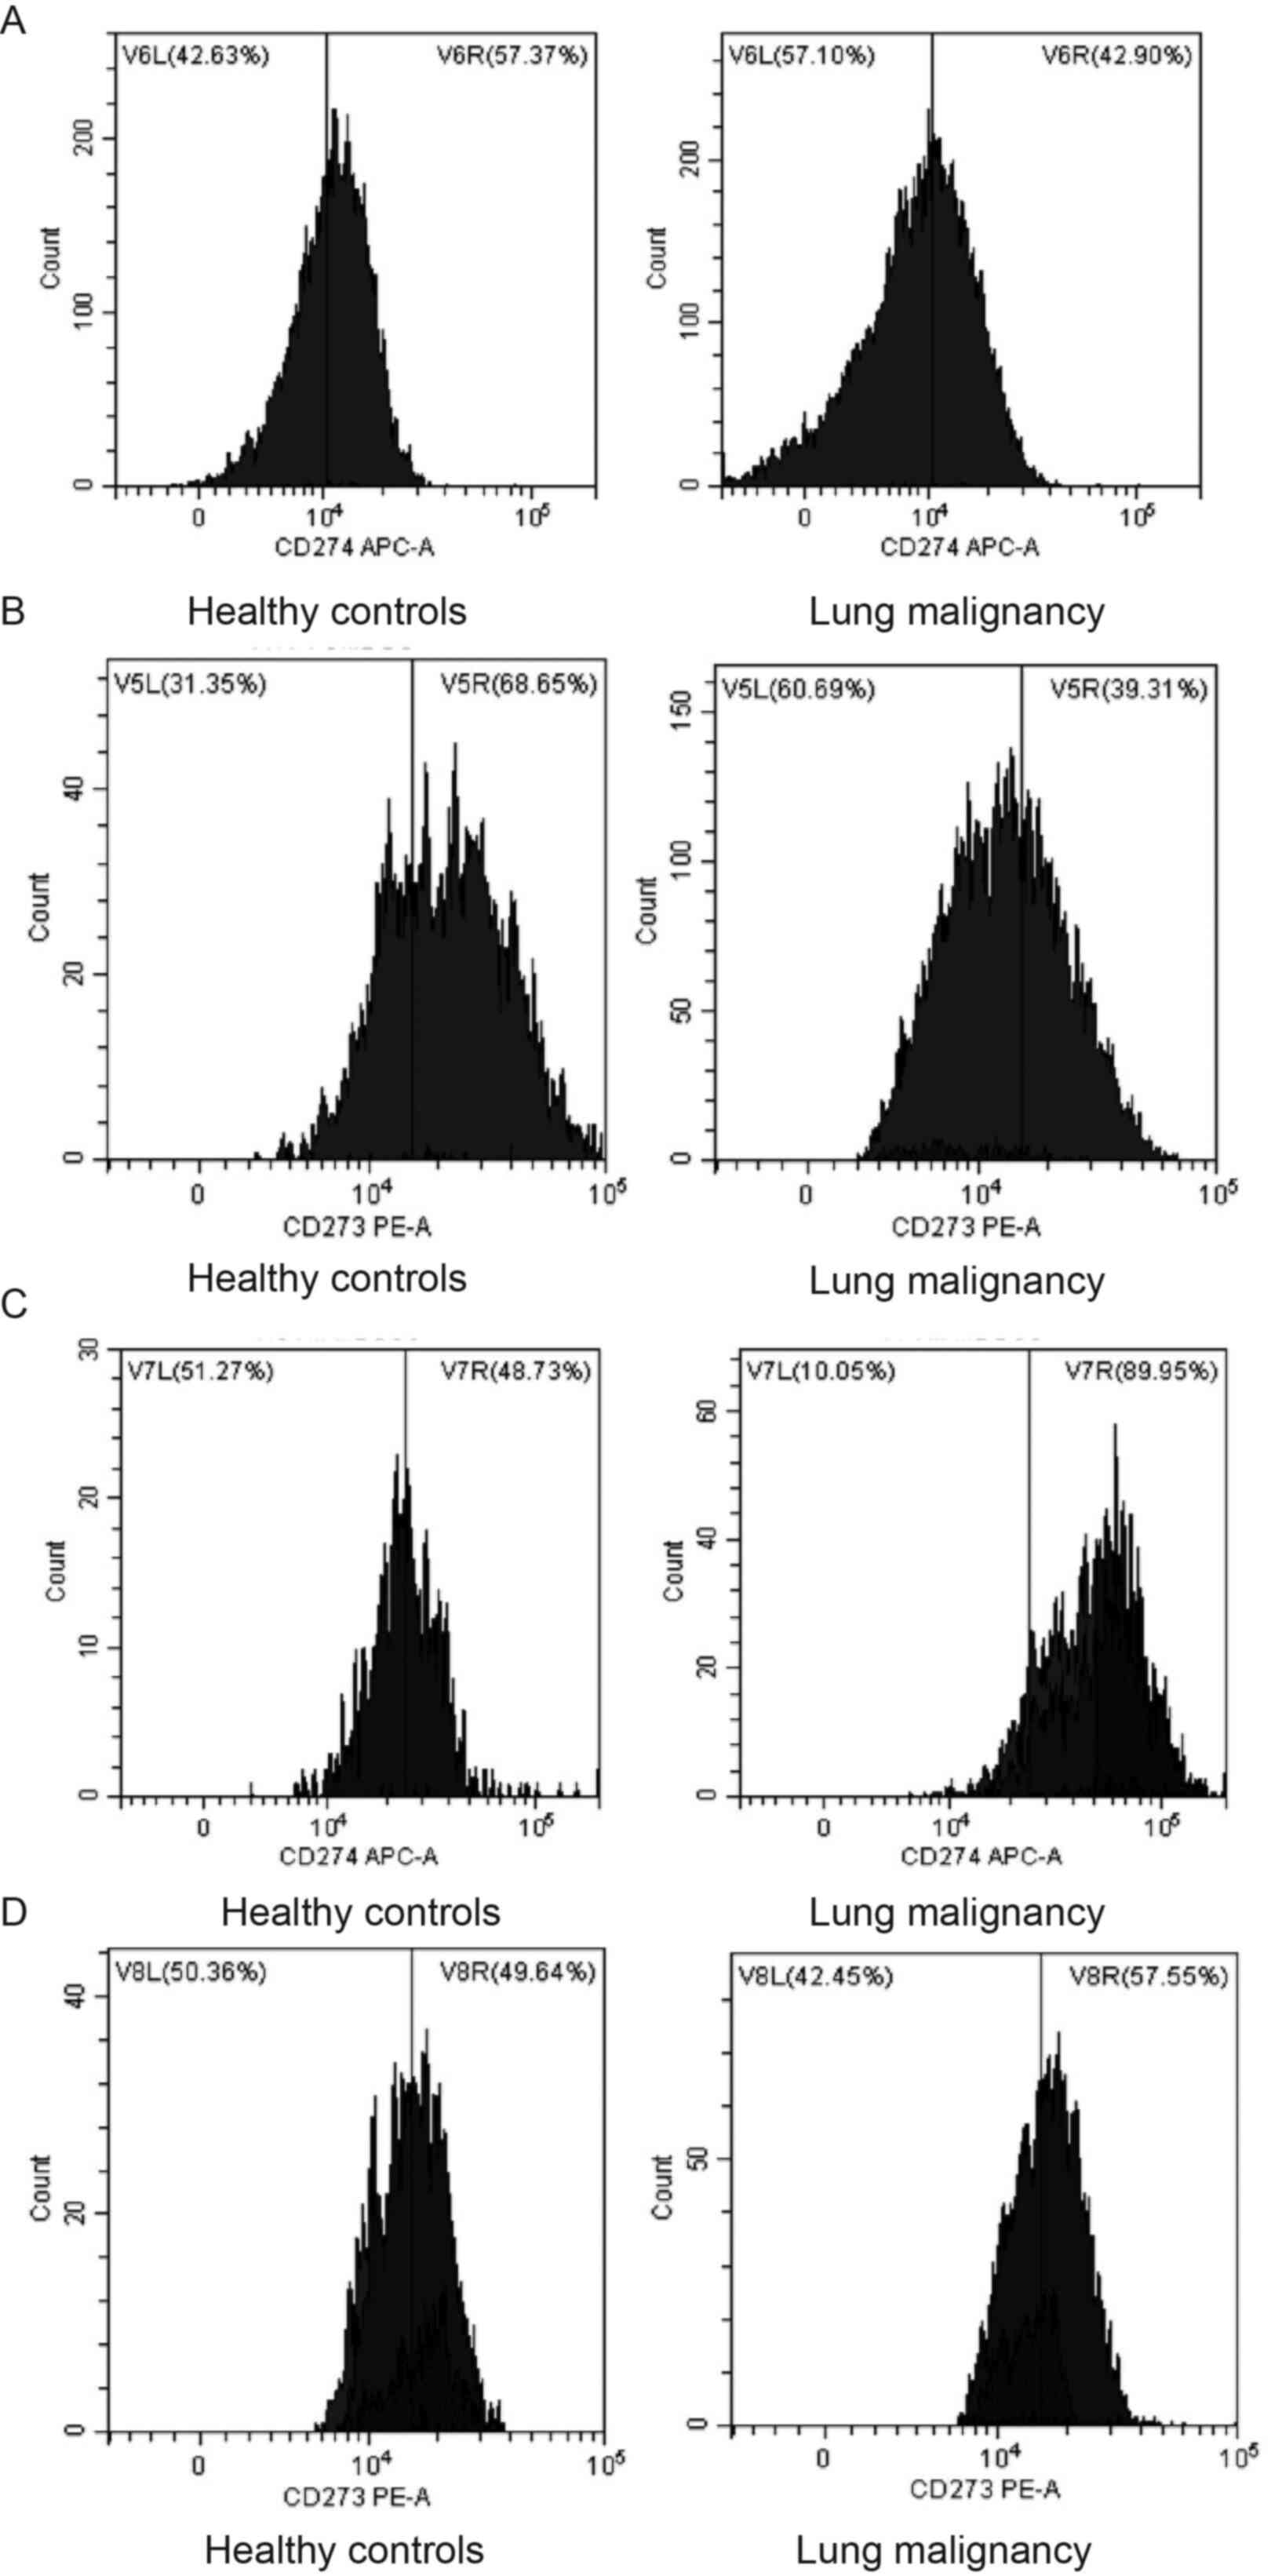
healthy individuals (P<0.001; Table III). To study interaction between
MDSC subsets, PD-L1 and PD-L2 in lung malignancy, flow cytometry
was used to sort G-MDSCs and M-MDSCs expressing either PD-L1 or
PD-L2 in lung malignancy cases and healthy controls (Figs. 7 and 8). The cases with lung malignancy
exhibited lower frequencies of PD-L1+G-MDSCs (P=0.013)
and PD-L2+G-MDSCs (P<0.001) in the peripheral blood
than the healthy controls. Additionally, there was a higher
frequency of PD-L1+M-MDSCs in peripheral blood of lung
malignancy cases than healthy controls (P<0.001). However,
significant differences were not found in PD-L2+M-MDSCs
between lung malignancy cases and healthy controls (P=0.406).
| Table IIIFrequencies (%) of peripheral blood
MDSC subsets in the peripheral blood between patients with lung
cancer and healthy controls. |
Table III
Frequencies (%) of peripheral blood
MDSC subsets in the peripheral blood between patients with lung
cancer and healthy controls.
| MDSC subset | Healthy controls
(n=34) | Lung cancer
(n=102) | P-value |
|---|
| G-MDSCs | 10.71±5.60 | 18.65±10.52 |
<0.001a |
|
PD-L1+G-MDSCs | 71.18±24.30 | 60.49±20.30 | 0.013a |
|
PD-L2+G-MDSCs | 50.84±20.08 | 35.03±15.77 |
<0.001a |
| M-MDSCs | 8.91±2.96 | 16.68±9.63 |
<0.001a |
|
PD-L1+M-MDSCs | 36.21±27.42 | 62.75±26.48 |
<0.001a |
|
PD-L2+M-MDSCs | 48.35±32.14 | 53.62±31.85 | 0.406 |
Association between clinical variables
and frequency of peripheral blood MDSC subsets in lung
malignancy
The present study investigated whether peripheral
blood MDSC subsets were associated with clinical variables of
patients with lung cancer. Patients with distant metastasis
exhibited higher frequencies of G-MDSCs and M-MDSCs in peripheral
blood when compared with those without distant metastasis
(P<0.001; Table IV), suggesting
the frequency of peripheral G-MDSCs and M-MDSCs was associated with
the occurrence of distant metastasis in lung malignancy.
Additionally, there was a lower frequency of peripheral
PD-L1+M-MDSCs in cases with distant metastasis when
compared with those without (P=0.020; Table V), suggesting the frequency of
PD-L1+M-MDSCs in peripheral blood was associated with
the occurrence of distant metastasis in lung cancer.
| Table IVAssociation between clinical
variables of patients with lung cancer and the frequencies of
peripheral blood MDSC subsets. |
Table IV
Association between clinical
variables of patients with lung cancer and the frequencies of
peripheral blood MDSC subsets.
| | G-MDSC | M-MDSC |
|---|
| Clinical
variable | n | Frequency, % | P-value | Frequency, % | P-value |
|---|
| Age, years | | | 0.201 | | 0.211 |
|
≤65 | 45 | 17.26±9.52 | | 15.22±8.40 | |
|
>65 | 57 | 19.86±10.79 | | 17.62±10.39 | |
| Sex | | | 0.879 | | 0.878 |
|
Male | 71 | 18.80±10.67 | | 16.64±9.90 | |
|
Female | 31 | 18.46±9.46 | | 16.32±8.98 | |
| Smoking status | | | 0.261 | | 0.857 |
|
Smoker | 61 | 19.63±10.94 | | 16.40±9.71 | |
|
Non-smoker | 41 | 17.29±9.11 | | 16.75±9.49 | |
| TNM stage | | | 0.009a | | 0.104 |
|
I + II | 29 | 14.52±7.14 | | 14.10±8.31 | |
|
III +
IV | 73 | 20.37±10.88 | | 17.52±9.93 | |
| Histological
type | | | 0.187 | | 0.447 |
|
Squamous
cell carcinoma | 35 | 20.13±10.76 | | 18.28±11.18 | |
|
Adenocarcinoma | 50 | 16.91±8.57 | | 15.27±8.43 | |
|
Large cell
carcinoma | 7 | 23.94±15.21 | | 14.99±6.66 | |
|
Small cell
lung cancer | 10 | 16.24±8.32 | | 18.82±12.04 | |
| Distant
metastasis | | |
<0.001a | |
<0.001a |
|
Yes | 49 | 22.29±10.69 | | 20.18±10.55 | |
|
No | 53 | 15.24±8.62 | | 13.04±7.03 | |
| Table VAssociation between clinical
variables of patients with lung cancer and frequencies of
PD-L1+ and PD-L2+G-MDSCs and
PD-L1+M-MDSCs in the peripheral blood. |
Table V
Association between clinical
variables of patients with lung cancer and frequencies of
PD-L1+ and PD-L2+G-MDSCs and
PD-L1+M-MDSCs in the peripheral blood.
| |
PD-L1+G-MDSC |
PD-L2+G-MDSC |
PD-L1+M-MDSC |
|---|
| Clinical
variable | n | Frequency, % | P-value | Frequency, % | P-value | Frequency, % | P-value |
|---|
| Age, years | | | 0.580 | | 0.078 | | 0.414 |
|
≤65 | 45 | 61.74±20.36 | | 32.43±12.60 | | 64.86±26.58 | |
|
>65 | 57 | 59.47±20.59 | | 37.95±17.51 | | 60.53±26.38 | |
| Sex | | | 0.300 | | 0.960 | | 0.240 |
|
Male | 71 | 59.05±21.13 | | 34.97±16.39 | | 60.37±27.01 | |
|
Female | 31 | 63.64±18.68 | | 35.14±14.58 | | 67.09±24.90 | |
| Smoking status | | | 0.827 | | 0.228 | | 0.951 |
|
Smoker | 61 | 60.85±20.55 | | 36.55±17.23 | | 62.34±26.73 | |
|
Non-smoker | 41 | 59.94±20.45 | | 32.70±13.11 | | 62.67±26.30 | |
| TNM stage | | | 0.403 | | 0.238 | | 0.084 |
|
I + II | 29 | 63.16±19.27 | | 32.12±16.23 | | 69.57±24.79 | |
|
III +
IV | 73 | 59.39±20.90 | | 36.22±15.54 | | 59.55±26.70 | |
| Histological
type | | | 0.472 | | 0.139 | | 0.237 |
|
Squamous
cell carcinoma | 35 | 57.94±20.89 | | 34.26±15.07 | | 58.73±26.83 | |
|
Adenocarcinoma | 50 | 60.55±20.62 | | 32.70±14.12 | | 61.69±25.71 | |
|
Large cell
carcinoma | 7 | 71.43±14.42 | | 43.63±19.78 | | 80.87±24.09 | |
|
Small cell
lung cancer | 10 | 60.67±21.54 | | 42.41±20.37 | | 65.26±28.29 | |
| Distant
metastasis | | | 0.296 | | 0.088 | | 0.020a |
|
Yes | 49 | 58.32±22.63 | | 37.75±16.75 | | 56.31±29.00 | |
|
No | 53 | 62.56±18.03 | | 32.42±14.47 | | 68.39±22.43 | |
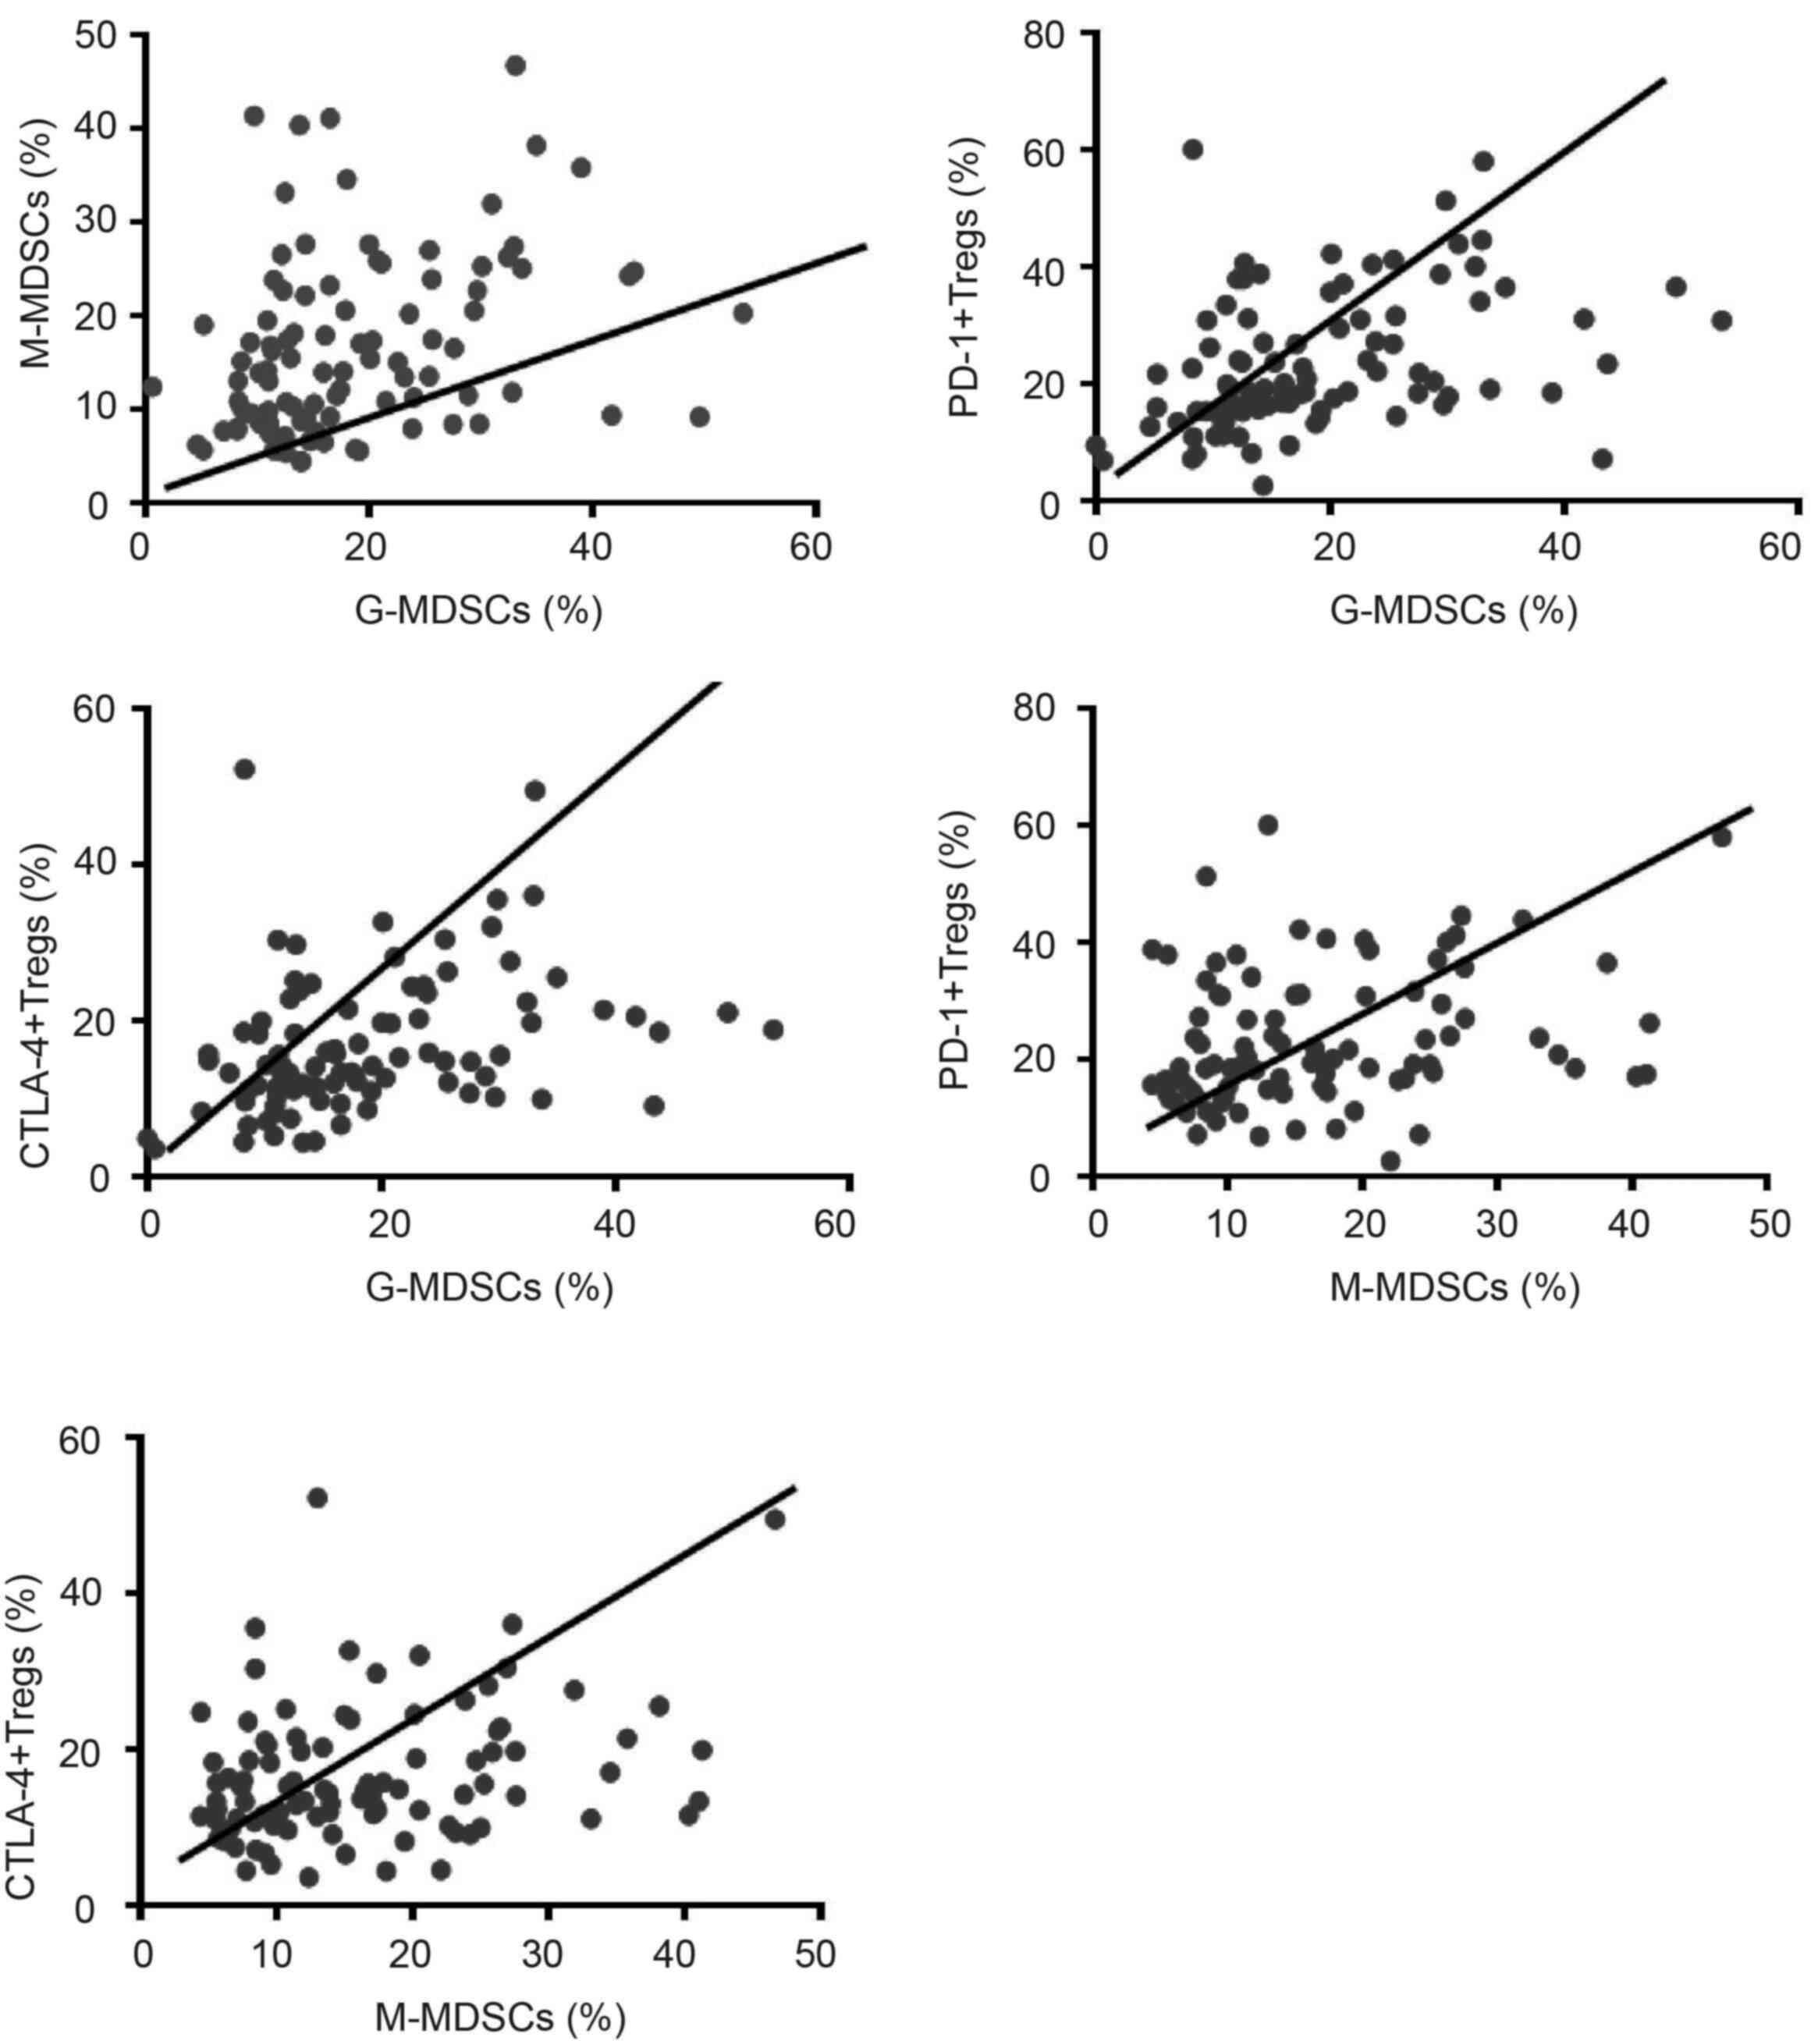
Correlation between frequencies of
peripheral blood MDSC and T cell subsets in lung malignancy
Next, the present study investigated correlation
between frequency of peripheral blood MDSC and T cell subsets and
in lung cancer. First, a positive correlation was noted between
frequencies of G-MDSCs and M-MDSCs (r=0.325, P=0.001; Fig. 9). In addition, G-MDSC populations
shared a positive correlation with the proportion of Tregs
expressing PD-1 (r=0.385, P<0.001) and CTLA-4+
(r=0.337, P<0.001). Likewise, the frequency of M-MDSCs exhibited
a positive correlation with the proportion of Tregs expressing PD-1
(r=0.265, P=0.01) and CTLA-4+ (r=0.284, P<0.005).
However, no further correlation was observed between other T cell
and MDSC subsets in lung cancer.
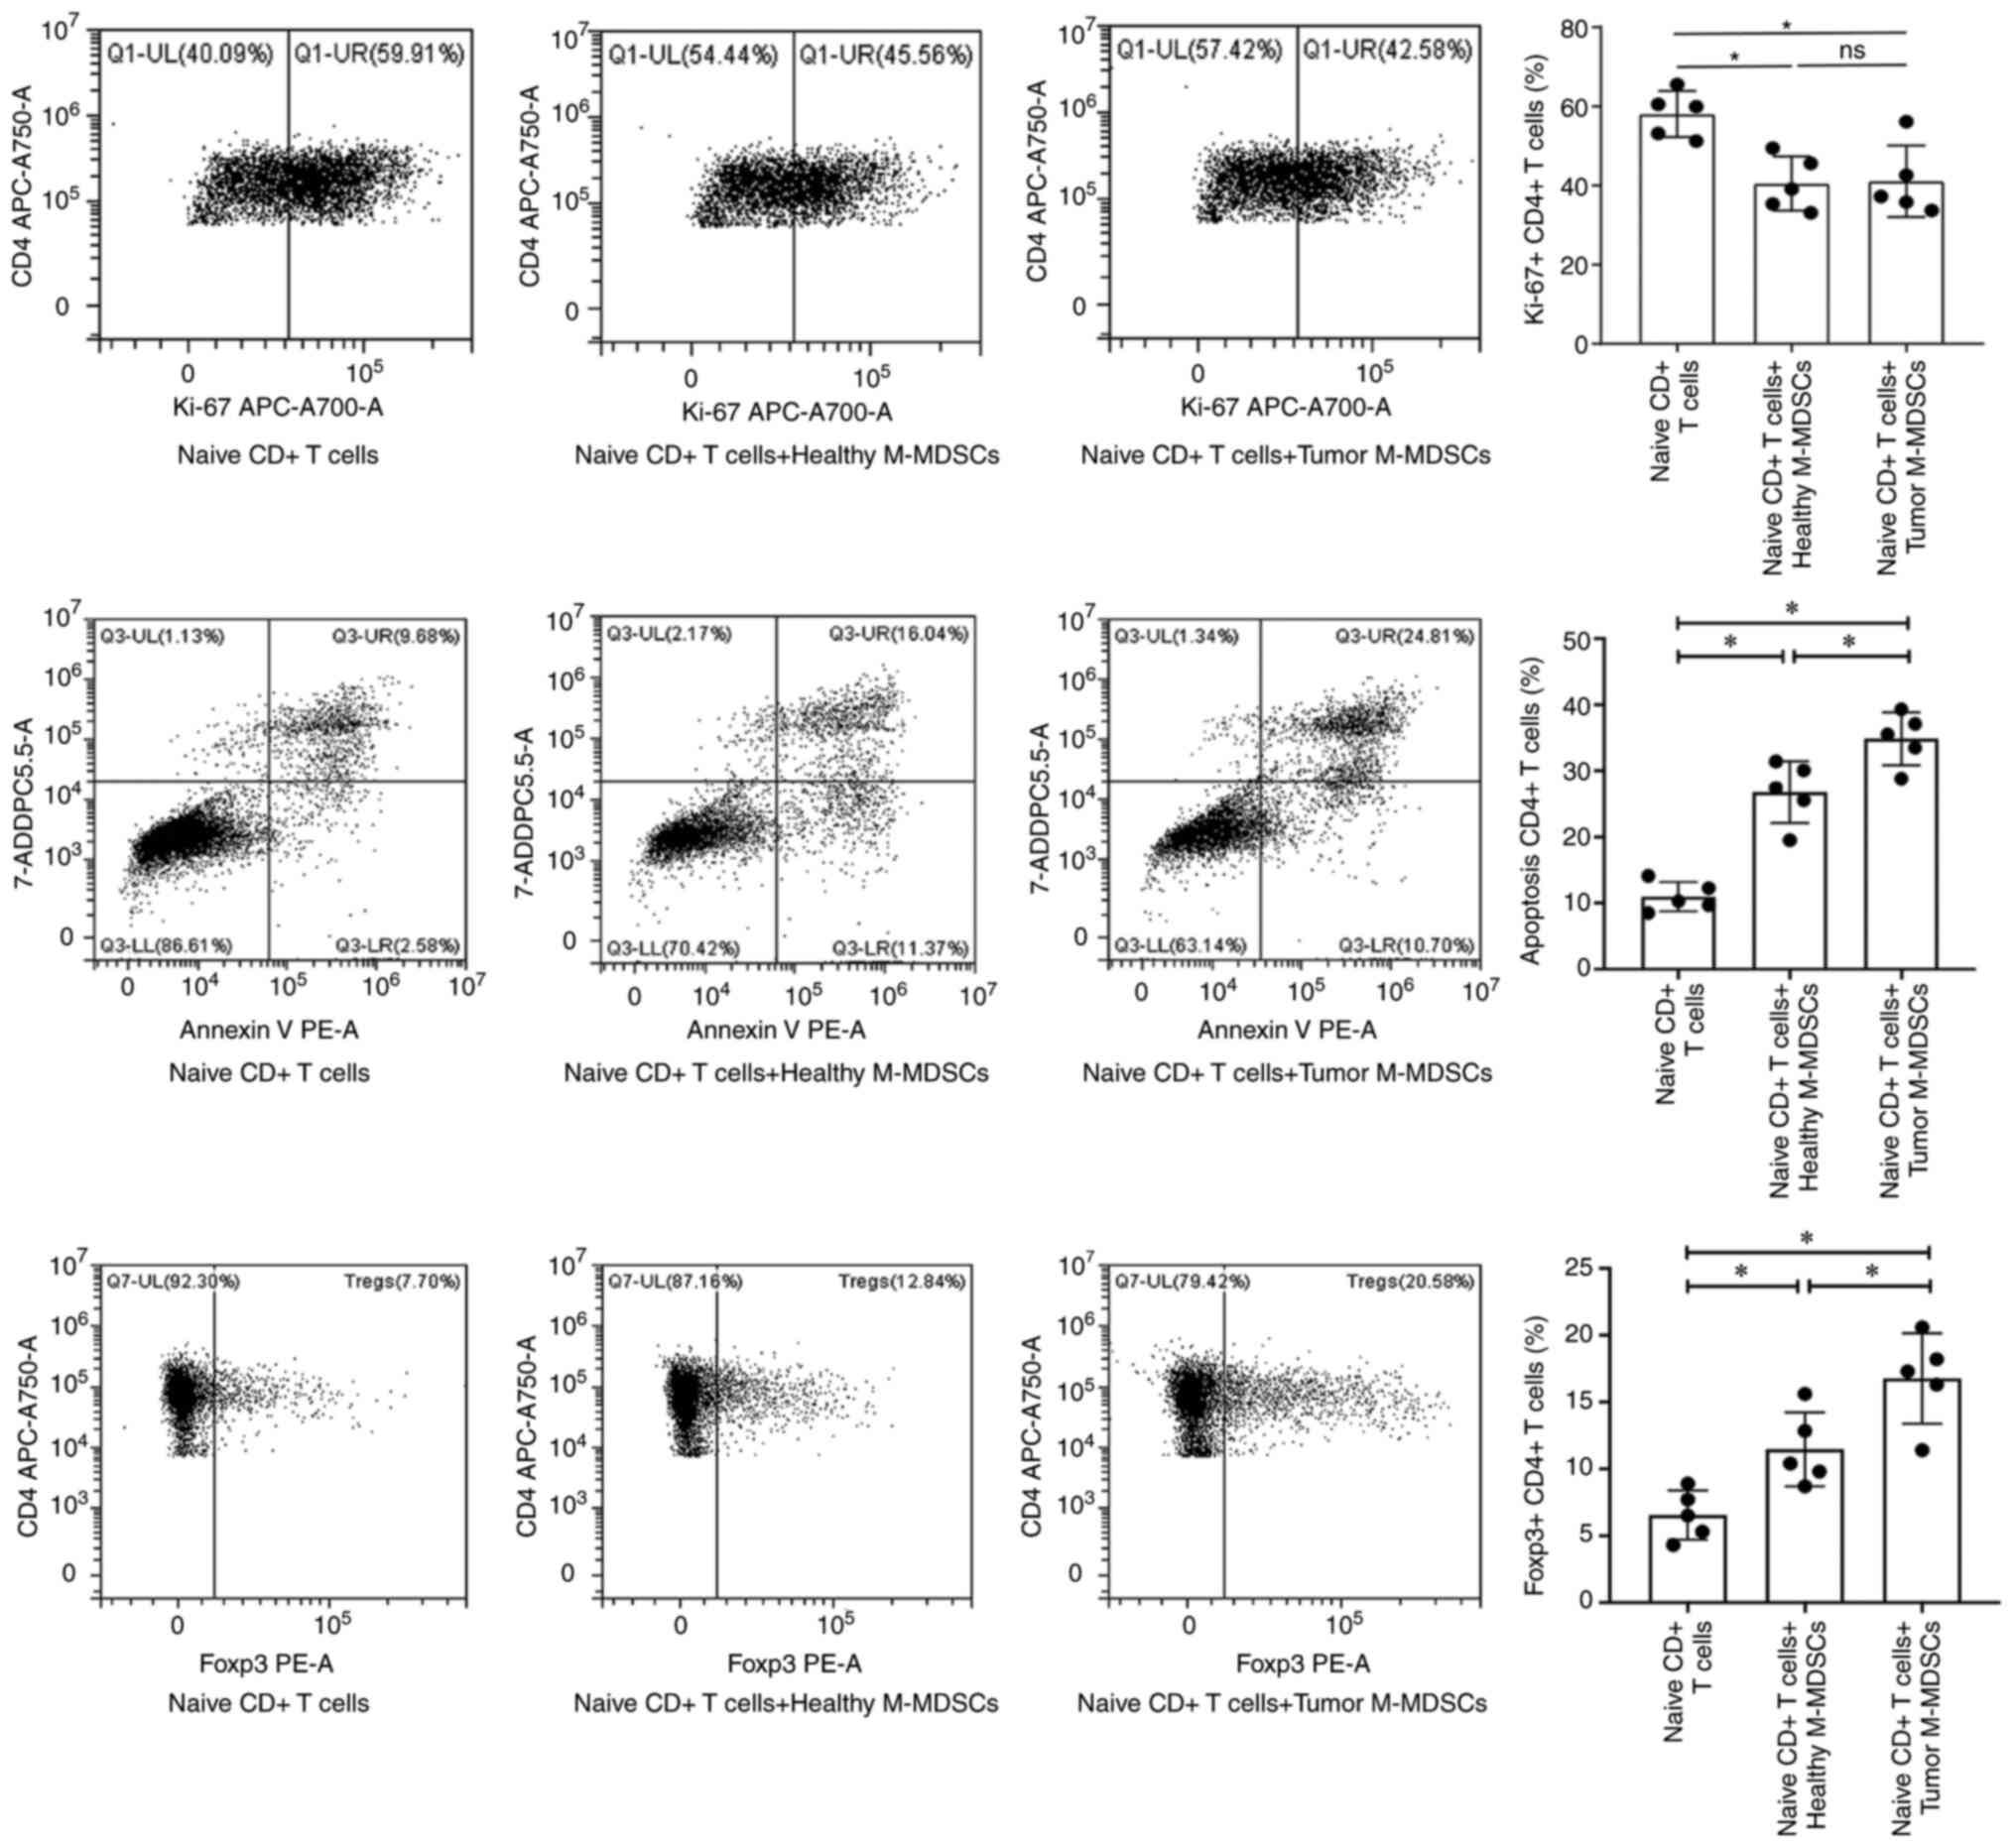
M-MDSCs in lung malignancy enhance
naive T cell apoptosis and promote Treg subset differentiation
To investigate the effects of MDSC subsets derived
from lung malignancy and healthy controls on naive T cell
proliferation and apoptosis, as well as Treg differentiation, MDSC
subsets were co-cultured with naive T cells. Results of flow
cytometry demonstrated that G-MDSCs derived from lung malignancy
and healthy controls exerted no significant effects on naive T-cell
proliferation and apoptosis, as well as Treg differentiation (data
not shown). However, compared with M-MDSCs of healthy controls,
M-MDSCs from patients with lung malignancy did not notably affect
naive T cell proliferation (Fig.
10A and B), but enhanced naive
T cell apoptosis (Fig. 10C and
D) and promoted Treg subset
differentiation (Fig. 10E and
F).
Discussion
The immunopathological role of MDSCs in infectious
disease, inflammation and cancer by affecting T cells has been
reported previously (23-25).
The present study demonstrated that circulating frequencies of
CTLA-4+Tregs and CTLA-4+CD8+ T
cells are increased in lung cancer, accumulation of M-MDSC and
G-MDSC occurs in cases with lung malignancy and frequencies of
G-MDSCs and M-MDSCs in the peripheral blood were associated with
lung malignancy metastasis and positively correlated with the
proportions of CTLA-4+ and PD-1+Tregs. These
results demonstrated impaired host tumor immunosurveillance in lung
cancer as MDSCs could bind to PD-1 on Treg by expressing PD-L2 and
PD-L1 and induce Treg expansion.
Tregs induce immunosuppression via
contact-dependent, including the expression of PD-1, neuropilin 1,
CTLA-4, lymphocyte-activation protein 3 and PD-L1, or -independent
mechanisms, such as secretion of immunosuppressive molecules
(26). Accumulation of
immunosuppressive Tregs in lung tumor and systemic expansion
enhances tumor evasion, thus contributing to progression of
numerous types of malignancy, such as lung (27), breast (28), ovary (29) and prostate cancer (30). The present study showed no notable
difference in populations of peripheral blood Tregs,
CTLA-4+CD4+ T cells, PD-1+Tregs
and PD-1+CD4+ and
PD-1+CD8+ T cells between lung cancer cases
and healthy controls. Kumagai et al (31) showed a profound reactivation of
effector PD-1+CD8+ T cells rather than
PD-1+ Treg cells by PD-1 blockade is necessary for tumor
regression, which is not consistent with the present results. The
aforementioned study focused on Tregs and CD8+ T cells
in the tumor microenvironment rather than in the circulation. Wu
et al (32) identified a
high population of Tregs expressing PD-L1 in the tumor
microenvironment of lung cancer and frequency of
PD-L1+Tregs was higher in cancer tissues than in normal
tissue and blood, suggesting levels of these cells vary between the
tumor microenvironment and circulation. However, it is unknown
which immunosuppressive molecule is responsible for inducing the
function of circulating Tregs in lung malignancy and whether Tregs
have tumor microenvironment- or circulation-dependent phenotype?
The present study observed higher frequencies of peripheral
CTLA-4+Tregs and CTLA-4+CD8+ T
cells in lung cancer cases compared with healthy controls,
suggesting that CTLA-4 may be the immunosuppressive molecule that
induces function of circulating Tregs in lung cancer. CTLA-4 is a
protein receptor that maintains peripheral tolerance by suppressing
T cell activation and proliferation, thus inhibiting the immune
system (33). CTLA-4 in Tregs could
remove CD80/CD86 from the antigen-presenting cells and function in
a cell-extrinsic fashion, thus preventing further priming of other
T cells (34). Studies have
identified CTLA-4 molecules as a strong inductor of Treg function
(35,36). Additionally, combination of
anti-PD-1/PD-L1 + anti-CTLA-4 immune-checkpoint inhibitors
contributes to better survival compared with single-agent
immunotherapy (37). Compared with
stage I + II, the present study found a lower frequency of
circulating CTLA-4+CD8+ T cells in patients
with stage III + IV lung cancer. Similarly, Erfani et al
(38) found an increase in
circulating CD8+ T cells expressing SurCTLA-4 instead of
CD4+ T cells expressing SurCTLA-4 in NSCLC compared with
health controls. Therefore, CD8+ T cells and Tregs
expressing CTLA-4 might be novel immunotherapeutic targets for lung
cancer.
MDSCs contribute to the immune tolerance of tumor
cells by attracting Tregs into tumor sites and inhibiting
proliferation of T cells (39).
Here, a higher diversity of peripheral blood G-MDSC and M-MDSC
populations was noted in lung cancer cases compared with healthy
individuals. In vitro co-culture assay demonstrated M-MDSCs
of lung malignancy enhanced naive T cell apoptosis and promoted
Treg subset differentiation compared with M-MDSCs of healthy
controls. Recruitment of MDSCs is regulated by a series of
cytokines, such as IL-1β, vascular endothelial growth factor,
prostaglandin E2, IL-6, granulocyte macrophage colony stimulating
factor and S100A8/A9(40). Most of
the aforementioned cytokines activate the JAK/STAT3 signaling
pathway to mediate the amplification and aggregation of MDSCs
(41). In this event, MDSCs are
recruited, migrate and expand ~10 times in the circulation and
tumor environment. Yamauchi et al (42) detected a significant increase in
frequency of circulating M-MDSCs in patients with NSCLC compared
with healthy donors. Additionally, Li et al (43) demonstrated increased abundance of
G-MDSCs locally within the tumor microenvironment and systemically
in peripheral blood and spleen in a Live kinase B1-deficient murine
model of NSCLC. Here, increased frequencies of peripheral blood
G-MDSCs and M-MDSCs were observed in distant metastasis, suggesting
two MDSC subsets were correlated with lung cancer metastasis.
Lung-derived G-MDSCs harvested from tumor-bearing animals promote
proliferation of disseminated cancer cells at metastatic sites.
Tumor-infiltrated M-MDSCs induce dissemination of cancer cells by
eliciting epithelial-to-mesenchymal transition/cancer stem cell
phenotype (44). Hypoxia is a
hallmark of the tumor microenvironment and contributes to tumor
progression. Hypoxia triggers a rapid, notable selective
upregulation of PD-L1 on MDSCs in tumor-bearing mice, inducing
immunosuppressive function of MDSCs (45). MDSC-induced release of PD-L1 is also
modulated by IFN-γ, which activates phosphorylated STAT1 to
directly modulate IFN regulatory factor-1 (IRF1) transcription.
IRF1 activation leads to PD-L1 expression in MDSCs by directly
binding to an IRF-binding consensus element (46). Here, compared with controls, lung
malignancy cases exhibited lower frequencies of PD-L1+
and PD-L2+G-MDSCs, but a high frequency of
PD-L1+M-MDSCs in the peripheral blood. Rather than
G-MDSCs, M-MDSCs bind with PD-1 on the surface of Tregs and promote
differentiation of initial CD4+ T cells into Tregs;
frequencies of M-MDSCs were positively correlated with proportions
of CTLA-4+ and PD-1+Tregs. These findings
support the hypothesis that notable accumulation of MDSC subsets is
involved in lung cancer occurrence and progression as M-MDSCs bind
to PD-1 on Tregs by expressing PD-L1 and PD-L2 on the surface and
induce Treg expansion.
There were several limitations in the present study.
Firstly, the mechanism behind the contribution of G-MDSCs to lung
cancer should be further investigated, since a higher diversity of
peripheral blood G-MDSC and M-MDSC populations was noted in cases
with lung cancer compared with healthy controls. Secondly, since
MDSCs are more likely to accumulate systemically in the spleen
(47), more locations, such as
cancerous lung tissue and spleen in lung cancer, should be used to
characterize the frequencies of T cell subsets and MDSC subset.
Future clinical studies and cell and animal models should be
performed to demonstrate M-MDSC promotion of Tregs by PD-1/PD-L1/2
interaction.
In conclusion, CTLA-4+Tregs, M-MDSCs,
CTLA-4+CD8+ T cells and G-MDSCs accumulated
in lung cancer. MDSCs promote Treg expansion by binding surface
molecule PD-1, which is involved in lung cancer occurrence and
progression. Collectively, these findings suggested a contributing
role for MDSCs and Tregs in immunopathogenesis of lung cancer and
these may be potential targets to design host-directed therapies
for patients with lung cancer.
Acknowledgements
Not applicable.
Funding
Funding: The present study was supported by the Natural Sciences
Foundation of China (grant no. 81900021) and Beijing Clinical
Specialty (grant no. XKB2022B1002).
Availability of data and materials
The datasets used and/or analyzed during the current
study are available from the corresponding author on reasonable
request.
Authors' contributions
MQZ and XDM designed the study. YHW interpreted the
data and wrote the manuscript. JQZ, LL and WSX analyzed data. LL
and WSX confirm the authenticity of all the raw data. All authors
have read and approved the final manuscript.
Ethics approval and consent to
participate
The study was approved by the Ethical Committee of
Beijing Tsinghua Changgung Hospital (approval no. 18190-0-01). All
recruited patients signed informed consent.
Patient consent for publication
Not applicable.
Competing interests
The authors declare that they have no competing
interests.
References
|
1
|
Siegel RL, Miller KD, Fuchs HE and Jemal
A: Cancer statistics, 2021. CA Cancer J Clin. 71:7–33.
2021.PubMed/NCBI View Article : Google Scholar
|
|
2
|
Sung H, Ferlay J, Siegel RL, Laversanne M,
Soerjomataram I, Jemal A and Bray F: Global cancer statistics 2020:
GLOBOCAN estimates of incidence and mortality worldwide for 36
cancers in 185 countries. CA Cancer J Clin. 71:209–249.
2021.PubMed/NCBI View Article : Google Scholar
|
|
3
|
Schneider F and Dacic S: Histopathologic
and molecular approach to staging of multiple lung nodules. Transl
Lung Cancer Res. 6:540–549. 2017.PubMed/NCBI View Article : Google Scholar
|
|
4
|
Rudin CM, Brambilla E, Faivre-Finn C and
Sage J: Small-cell lung cancer. Nat Rev Dis Primers.
7(3)2021.PubMed/NCBI View Article : Google Scholar
|
|
5
|
Suresh K, Naidoo J, Lin CT and Danoff S:
Immune checkpoint immunotherapy for non-small cell lung cancer:
Benefits and pulmonary toxicities. Chest. 154:1416–1423.
2018.PubMed/NCBI View Article : Google Scholar
|
|
6
|
Law AMK, Valdes-Mora F and Gallego-Ortega
D: Myeloid-derived suppressor cells as a therapeutic target for
cancer. Cells. 9(561)2020.PubMed/NCBI View Article : Google Scholar
|
|
7
|
Gabrilovich DI: Myeloid-derived suppressor
cells. Cancer Immunol Res. 5:3–8. 2017.PubMed/NCBI View Article : Google Scholar
|
|
8
|
Hegde S, Leader AM and Merad M: MDSC:
Markers, development, states, and unaddressed complexity. Immunity.
54:875–884. 2021.PubMed/NCBI View Article : Google Scholar
|
|
9
|
Talmadge JE and Gabrilovich DI: History of
myeloid-derived suppressor cells. Nat Rev Cancer. 13:739–752.
2013.PubMed/NCBI View Article : Google Scholar
|
|
10
|
Cassetta L, Baekkevold ES, Brandau S,
Bujko A, Cassatella MA, Dorhoi A, Krieg C, Lin A, Loré K, Marini O,
et al: Deciphering myeloid-derived suppressor cells: Isolation and
markers in humans, mice and non-human primates. Cancer Immunol
Immunother. 68:687–697. 2019.PubMed/NCBI View Article : Google Scholar
|
|
11
|
Tao J, Han D, Gao S, Zhang W, Yu H, Liu P,
Fu R, Li L and Shao Z: CD8+ T cells exhaustion induced
by myeloid-derived suppressor cells in myelodysplastic syndromes
patients might be through TIM3/Gal-9 pathway. J Cell Mol Med.
24:1046–1058. 2020.PubMed/NCBI View Article : Google Scholar
|
|
12
|
Condamine T and Gabrilovich DI: Molecular
mechanisms regulating myeloid-derived suppressor cell
differentiation and function. Trends Immunol. 32:19–25.
2011.PubMed/NCBI View Article : Google Scholar
|
|
13
|
Chang AL, Miska J, Wainwright DA, Dey M,
Rivetta CV, Yu D, Kanojia D, Pituch KC, Qiao J, Pytel P, et al:
CCL2 produced by the glioma microenvironment is essential for the
recruitment of regulatory T cells and myeloid-derived suppressor
cells. Cancer Res. 76:5671–5682. 2016.PubMed/NCBI View Article : Google Scholar
|
|
14
|
Togashi Y, Shitara K and Nishikawa H:
Regulatory T cells in cancer immunosuppression-implications for
anticancer therapy. Nat Rev Clin Oncol. 16:356–371. 2019.PubMed/NCBI View Article : Google Scholar
|
|
15
|
Adair PR, Kim YC, Zhang AH, Yoon J and
Scott DW: Human tregs made antigen specific by gene modification:
The power to treat autoimmunity and antidrug antibodies with
precision. Front Immunol. 8(1117)2017.PubMed/NCBI View Article : Google Scholar
|
|
16
|
Ohue Y and Nishikawa H: Regulatory T
(Treg) cells in cancer: Can Treg cells be a new therapeutic target?
Cancer Sci. 110:2080–2089. 2019.PubMed/NCBI View Article : Google Scholar
|
|
17
|
Park HJ, Park JS, Jeong YH, Son J, Ban YH,
Lee BH, Chen L, Chang J, Chung DH, Choi I and Ha SJ: PD-1
upregulated on regulatory T cells during chronic virus infection
enhances the suppression of CD8+ T cell immune response via the
interaction with PD-L1 expressed on CD8+ T cells. J Immunol.
194:5801–5811. 2015.PubMed/NCBI View Article : Google Scholar
|
|
18
|
Lee-Chang C, Rashidi A, Miska J, Zhang P,
Pituch KC, Hou D, Xiao T, Fischietti M, Kang SJ, Appin CL, et al:
Myeloid-derived suppressive cells promote B cell-mediated
immunosuppression via transfer of PD-L1 in glioblastoma. Cancer
Immunol Res. 7:1928–1943. 2019.PubMed/NCBI View Article : Google Scholar
|
|
19
|
Cai J, Wang D, Zhang G and Guo X: The role
Of PD-1/PD-L1 axis in Treg development and function: implications
for cancer immunotherapy. Onco Targets Ther. 12:8437–8445.
2019.PubMed/NCBI View Article : Google Scholar
|
|
20
|
Travis WD, Brambilla E, Nicholson AG,
Yatabe Y, Austin JHM, Beasley MB, Chirieac LR, Dacic S, Duhig E,
Flieder DB, et al: The 2015 World Health Organization
classification of lung tumors: Impact of genetic, clinical and
radiologic advances since the 2004 classification. J Thorac Oncol.
10:1243–1260. 2015.PubMed/NCBI View Article : Google Scholar
|
|
21
|
Lababede O, Meziane M and Rice T: Seventh
edition of the cancer staging manual and stage grouping of lung
cancer: Quick reference chart and diagrams. Chest. 139:183–189.
2011.PubMed/NCBI View Article : Google Scholar
|
|
22
|
Scrimini S, Pons J, Agustí A, Soriano JB,
Cosio BG, Torrecilla JA, Núñez B, Córdova R, Iglesias A, Jahn A, et
al: Differential effects of smoking and COPD upon circulating
myeloid derived suppressor cells. Respir Med. 107:1895–1903.
2013.PubMed/NCBI View Article : Google Scholar
|
|
23
|
Schrijver IT, Théroude C and Roger T:
Myeloid-derived suppressor cells in sepsis. Front Immunol.
10(327)2019.PubMed/NCBI View Article : Google Scholar
|
|
24
|
Salminen A, Kauppinen A and Kaarniranta K:
Myeloid-derived suppressor cells (MDSC): An important partner in
cellular/tissue senescence. Biogerontology. 19:325–339.
2018.PubMed/NCBI View Article : Google Scholar
|
|
25
|
Sivagnanalingam U, Beatty PL and Finn OJ:
Myeloid derived suppressor cells in cancer, premalignancy and
inflammation: A roadmap to cancer immunoprevention. Mol Carcinog.
59:852–861. 2020.PubMed/NCBI View Article : Google Scholar
|
|
26
|
Vignali DAA, Collison LW and Workman CJ:
How regulatory T cells work. Nat Rev Immunol. 8:523–532.
2008.PubMed/NCBI View Article : Google Scholar
|
|
27
|
Marshall EA, Ng KW, Kung SH, Conway EM,
Martinez VD, Halvorsen EC, Rowbotham DA, Vucic EA, Plumb AW,
Becker-Santos DD, et al: Emerging roles of T helper 17 and
regulatory T cells in lung cancer progression and metastasis. Mol
Cancer. 15(67)2016.PubMed/NCBI View Article : Google Scholar
|
|
28
|
Plitas G, Konopacki C, Wu K, Bos PD,
Morrow M, Putintseva EV, Chudakov DM and Rudensky AY: Regulatory T
cells exhibit distinct features in human breast cancer. Immunity.
45:1122–1134. 2016.PubMed/NCBI View Article : Google Scholar
|
|
29
|
Toker A, Nguyen LT, Stone SC, Yang SYC,
Katz SR, Shaw PA, Clarke BA, Ghazarian D, Al-Habeeb A, Easson A, et
al: Regulatory T cells in ovarian cancer are characterized by a
highly activated phenotype distinct from that in melanoma. Clin
Cancer Res. 24:5685–5696. 2018.PubMed/NCBI View Article : Google Scholar
|
|
30
|
Erlandsson A, Carlsson J, Lundholm M, Fält
A, Andersson SO, Andrén O and Davidsson S: M2 macrophages and
regulatory T cells in lethal prostate cancer. Prostate. 79:363–369.
2019.PubMed/NCBI View Article : Google Scholar
|
|
31
|
Kumagai S, Togashi Y, Kamada T, Sugiyama
E, Nishinakamura H, Takeuchi Y, Vitaly K, Itahashi K, Maeda Y,
Matsui S, et al: The PD-1 expression balance between effector and
regulatory T cells predicts the clinical efficacy of PD-1 blockade
therapies. Nat Immunol. 21:1346–1358. 2020.PubMed/NCBI View Article : Google Scholar
|
|
32
|
Wu SP, Liao RQ, Tu HY, Wang WJ, Dong ZY,
Huang SM, Guo WB, Gou LY, Sun HW, Zhang Q, et al: Stromal
PD-L1-positive regulatory T cells and PD-1-positive CD8-positive T
cells define the response of different subsets of non-small cell
lung cancer to PD-1/PD-L1 blockade immunotherapy. J Thorac Oncol.
13:521–532. 2018.PubMed/NCBI View Article : Google Scholar
|
|
33
|
Gattinoni L, Ranganathan A, Surman DR,
Palmer DC, Antony PA, Theoret MR, Heimann DM, Rosenberg SA and
Restifo NP: CTLA-4 dysregulation of self/tumor-reactive CD8+ T-cell
function is CD4+ T-cell dependent. Blood. 108:3818–3823.
2006.PubMed/NCBI View Article : Google Scholar
|
|
34
|
Lang C, Wang J and Chen L: CD25-expressing
Th17 cells mediate CD8+ T cell suppression in CTLA-4
dependent mechanisms in pancreatic ductal adenocarcinoma. Exp Cell
Res. 360:384–389. 2017.PubMed/NCBI View Article : Google Scholar
|
|
35
|
Walker LSK: Treg and CTLA-4: Two
intertwining pathways to immune tolerance. J Autoimmun. 45:49–57.
2013.PubMed/NCBI View Article : Google Scholar
|
|
36
|
Krummey SM and Ford ML: Braking bad: Novel
mechanisms of CTLA-4 inhibition of T cell responses. Am J
Transplant. 14:2685–2690. 2014.PubMed/NCBI View Article : Google Scholar
|
|
37
|
Chae YK, Arya A, Iams W, Cruz MR, Chandra
S, Choi J and Giles F: Current landscape and future of dual
anti-CTLA4 and PD-1/PD-L1 blockade immunotherapy in cancer; lessons
learned from clinical trials with melanoma and non-small cell lung
cancer (NSCLC). J Immunother Cancer. 6(39)2018.PubMed/NCBI View Article : Google Scholar
|
|
38
|
Erfani N, Mehrabadi SM, Ghayumi MA,
Haghshenas MR, Mojtahedi Z, Ghaderi A and Amani D: Increase of
regulatory T cells in metastatic stage and CTLA-4 over expression
in lymphocytes of patients with non-small cell lung cancer (NSCLC).
Lung Cancer. 77:306–311. 2012.PubMed/NCBI View Article : Google Scholar
|
|
39
|
Kumar V, Patel S, Tcyganov E and
Gabrilovich DI: The nature of myeloid-derived suppressor cells in
the tumor microenvironment. Trends Immunol. 37:208–220.
2016.PubMed/NCBI View Article : Google Scholar
|
|
40
|
Sinha P, Okoro C, Foell D, Freeze HH,
Ostrand-Rosenberg S and Srikrishna G: Proinflammatory S100 proteins
regulate the accumulation of myeloid-derived suppressor cells. J
Immunol. 181:4666–4675. 2008.PubMed/NCBI View Article : Google Scholar
|
|
41
|
Guha P, Gardell J, Darpolor J, Cunetta M,
Lima M, Miller G, Espat NJ, Junghans RP and Katz SC: STAT3
inhibition induces Bax-dependent apoptosis in liver tumor
myeloid-derived suppressor cells. Oncogene. 38:533–548.
2019.PubMed/NCBI View Article : Google Scholar
|
|
42
|
amauchi Y, Safi S, Blattner C, Rathinasamy
A, Umansky L, Juenger S, Warth A, Eichhorn M, Muley T, Herth FJF,
et al: Circulating and tumor myeloid-derived suppressor cells in
resectable non-small cell lung cancer. Am J Respir Crit Care Med.
198:777–787. 2018.PubMed/NCBI View Article : Google Scholar
|
|
43
|
Li R, Salehi-Rad R, Crosson W, Momcilovic
M, Lim RJ, Ong SL, Huang ZL, Zhang T, Abascal J, Dumitras C, et al:
Inhibition of granulocytic myeloid-derived suppressor cells
overcomes resistance to immune checkpoint inhibition in
LKB1-deficient non-small cell lung cancer. Cancer Res.
81:3295–3308. 2021.PubMed/NCBI View Article : Google Scholar
|
|
44
|
Ouzounova M, Lee E, Piranlioglu R, El
Andaloussi A, Kolhe R, Demirci MF, Marasco D, Asm I, Chadli A,
Hassan KA, et al: Monocytic and granulocytic myeloid derived
suppressor cells differentially regulate spatiotemporal tumour
plasticity during metastatic cascade. Nat Commun.
8(14979)2017.PubMed/NCBI View Article : Google Scholar
|
|
45
|
Noman MZ, Desantis G, Janji B, Hasmim M,
Karray S, Dessen P, Bronte V and Chouaib S: PD-L1 is a novel direct
target of HIF-1α, and its blockade under hypoxia enhanced
MDSC-mediated T cell activation. J Exp Med. 211:781–790.
2014.PubMed/NCBI View Article : Google Scholar
|
|
46
|
Lu C, Redd PS, Lee JR, Savage N and Liu K:
The expression profiles and regulation of PD-L1 in tumor-induced
myeloid-derived suppressor cells. Oncoimmunology.
5(e1247135)2016.PubMed/NCBI View Article : Google Scholar
|
|
47
|
Eckert I, Ribechini E and Lutz MB: In
vitro generation of murine myeloid-derived suppressor cells,
analysis of markers, developmental commitment, and function.
Methods Mol Biol. 2236:99–114. 2021.PubMed/NCBI View Article : Google Scholar
|