Introduction
Colorectal cancer (CRC) is the third most common
diagnosed cancer and the most common cancer of the gastrointestinal
tract. It is also the second leading causes of cancer-related
deaths worldwide, with ~1.93 million new cases and 0.90 million
deaths estimated in 2022, accounting for 9.6 and 9.3% of all cancer
cases and deaths, respectively (1).
In China from 2000 to 2019, the incidence of CRC has been
increasing approximately doubled among male patients, rising at an
average of 2.8% per year, and the annual increase among women was
smaller at 1.4% (2,3). CRC is heterogeneous, and its
carcinogenesis may be associated with genetic and epigenomic
alterations and environmental and lifestyle factors (4). Early diagnosis of CRC is key for the
survival of patients with CRC. The overall 5-year survival rate of
patients with CRC is 65%; however, this rate increases to 94% if
diagnoses are made in early (stage I and stage II) and localized
stages (5). By contrast, the 5-year
survival rate for patients with CRC with distant metastases is only
12-13% (6,7). Detection methods for the early
diagnosis of CRC are needed to improve therapeutic outcomes.
Although colonoscopy is an important and widely used for the
detection of CRC, its invasion nature limits its use in certain
patients and its accuracy depends on the skill level and experience
of the endoscopist; False-negative colonoscopy findings have been
reported in certain patients (8).
More accurate and less invasive screening methods are therefore
needed for CRC detection. Novel biomarkers are considered promising
diagnostic tools for the detection of cancer (9).
Extracellular vesicles (EVs) are key mediators of
intercellular communication. EVs are cell-derived, membrane-bound
vesicles that transport bioactive molecules between cells. Based on
their origin, size, release pathways, content and function, EVs are
generally classified into three primary subtypes: Microvesicles,
apoptotic bodies and exosomes (10). Studies have shown that exosomes are
involved in the pathogenesis of CRC, including the proliferation,
progression and chemoresistance of CRC cells (11,12).
Exosomes are small lipid bilayer membrane vesicles, ranging in size
from 30 to 150 nm and are secreted by almost all cell types
(10). They are present in internal
cell spaces and various body fluids, including plasma, urine,
cerebral spinal fluid, breast milk, tears, saliva and gastric acid
(13). Exosomes are key components
of cell signaling and intercellular communication within the tumor
microenvironment (TME) (14). They
contain bioactive molecules, such as DNA, RNA, protein and lipids,
but do not contain cell organelles (15). Previous studies have focused mainly
on exosomes derived from body fluid samples or cell lines (16,17).
Interest in tissue-derived exosomes has increased, as they can be
isolated directly from tumor tissue sources and may better reflect
the bioactivity of tumor cells within the TME (18,19).
The present study followed the terminology
recommended by the International Society for Extracellular
Vesicles, which states that the subcellular origin of exosomes
should be demonstrated (20).
Therefore, the EVs isolated in this study were described as
‘exosome-enriched EVs’. The term ‘exosome’ was used only for
general description, as it remains widely used in even when the
subcellular origin has not been confirmed (21,22).
In this exploratory study, the mRNA profiles of exosome-enriched EV
were analyzed. The candidate key genes were validated by the models
of multiple logistic regression (LR) and a support vector machine
(SVM) with the external CRC exosomal RNA database exoRBase
(exorbase.org/). These findings may provide a
novel platform for understanding TME interactions.
Materials and methods
Patients and tissue samples
From June 2023 to January 2024, the paired CRC and
adjacent normal tissue (NC; ≥5 cm away from the tumor margin) were
collected from nine patients (age range was 46-80 years old, with 6
males and 3 females) with CRC who received surgical treatment at
the Beijing Rehabilitation Hospital of Capital Medical University
(Beijing, China). The inclusion criteria were as follows: Aged
>18 years, histopathological diagnosis of CRC (adenocarcinoma),
no past medical history of other cancer, no implemented
chemotherapy, no immunosuppressive treatment, no preoperative
radiotherapy and no other associated somatic disease requiring
chronic therapy before surgery. All participants in this study
provided written informed consent. The present study was approved
by the ethics committee of Beijing Rehabilitation Hospital of
Capital Medical University (approval no. 2021bkky-149).
Isolation of exosome-enriched EVs from
tissue
Following surgical resection, the tissue samples
were immediately stored at -80˚C until use for exosome-enriched EV
analysis. Exosome-enriched EVs were isolated from tissue as
described by Vella et al (23), with slight modification. The
dissociation mixture was prepared using a Miltenyi Human Tumor
Dissociation kit (Miltenyi Biotec, cat. no. 130-095-929). Enzymes
R, H and A were resuspended according to the manufacturer's
instructions. The dissociation mixture containing 2.2 ml RPMI-1640
culture medium (Corning, Inc.), 50.0 µl enzyme, R, 100.0 µl enzyme
H and 12.5 µl enzyme A was prepared immediately before use.
A small piece of tissue (~200 mg) was weighed,
sectioned (300 µm thickness) on dry ice and incubated in the
dissociation mixture for 10-15 min at 37˚C. The dissociated tissue
was gently filtered twice through a 70 µm filter to remove residual
tissue. The suspension was centrifuged at 300 x g for 10 min at
4˚C, and the supernatant was transferred to a fresh tube and
centrifuged at 2,000 x g for 10 min at 4˚C. The cell-free
supernatant was centrifuged at 10,000 x g for 20 min at 4˚C, then
filtered through a 0.22 µm filter to remove cell debris.
The suspension was then processed by
ultracentrifugation (UC) at 150,000 x g for 2 h at 4˚C. Size
exclusion chromatography (SEC) was used for separation. The pellet
was resuspended in 1 ml PBS and further purified via
Exosupur® columns (13.14x0.81 cm; cat. no. ES9P14e,
Echobiotech). The run duration was 30 min at room temperature.
Fractions 1-5 were collected and concentrated to 200 µl with 100
kDa molecular weight cut-off Amicon® Ultra spin filters
(Merck KGaA). No EV-depleted reagents were used during the
isolation of exosome-enriched EVs from tissue.
Measurement of the size distribution
and particle concentration of exosome-enriched EVs
The size distribution and particle concentration of
the exosome-enriched EVs were measured using a nanoflow cytometer
(N30E Nanoflow Analyzer, NanoFCM Inc.). The side scatter intensity
(SSI) was measured by loading standard polystyrene nanoparticles
(250 nm) into the nanoflow cytometer. The isolated exosome-enriched
EV sample was diluted with PBS to 1-10 ng/µl and loaded into the
nanoflow cytometer to measure the SSI. Concentration was calculated
as the ratio of the SSI concentration to the particle concentration
of the standard polystyrene nanoparticles.
For size measurement of the EVs, mixed-size standard
silica nanoparticles (68,91,113 and 155 nm) were loaded into the
nanoflow cytometer to generate a standard curve, followed by
loading of the exosome-enriched EV sample. The size distribution
was calculated according to the standard curve.
Transmission electron microscopy
(TEM)
TEM (H-7650, Hitachi Ltd.) was used to observe
exosome-enriched EVs. A total of 10 µl exosome-enriched EV mixture
was placed on a copper mesh (BZ110223a, Zhongjingkeyi Technology
Inc.) and incubated at room temperature for 1 min. Following
washing with sterile distilled water, the exosome-enriched EVs were
stained with a uranyl acetate (cat. no. TX89992, Yi Xin Biology)
solution for 1 min. The sample was dried for 2 min under
incandescent light. The copper mesh was imaged via TEM.
Exosome-enriched EV protein
characterization via western blot analysis
Total protein was extracted from the supernatant
fraction and tissue samples using RIPA buffer (cat. no. CW2333S,
Jiangsu CoWin Biotech Co., Ltd.) containing protease inhibitor
P6730 (Beijing Solarbio Science & Technology Co., Ltd.). The
supernatant was obtained on ice for 20 min and then centrifuged at
16,100 x g for 10 min at 4˚C. The protein concentration was
measured using the BCA method. Based on particle concentration and
total protein concentration, the particle-to-protein ratio of
exosome-enriched EV sample was calculated as 2.04x10⁸
particles/µg. A total of 30 µg protein from isolated
exosome-enriched EV was denatured, resolved on 8-10% SDS-PAGE gels
and transferred onto PVDF membranes. The same amount of protein
from CRC tissue lysate was loaded as negative control for
endoplasmic reticulum marker calnexin for contamination assessment.
The PVDF membranes were blocked with 5% non-fat milk for 60 min at
room temperature and then incubated with primary antibodies at 4˚C
overnight as follows: ALG-2-interacting protein X (Alix; cat. no.
sc-53540; Santa Cruz Biotechnology, Inc.), CD9 (cat. no.
60232-1-Ig; ProteinTech Group, Inc.), HSP70 (cat. no. ab181606; all
1:1,000; Abcam) and calnexin (cat. no. 10427-2-AP; 1:500;
ProteinTech Group, Inc.). The HRP-conjugated goat anti-rabbit IgG
(H+L; cat. no. SA00001-1; 1:5,000; ProteinTech Group, Inc.) was
used as the secondary antibody after hybridization for 1 h at room
temperature. The protein band was visualized after incubating with
ECL reagent (cat. no. PE0010, Beijing Solarbio Science &
Technology Co., Ltd.) and the image was captured using Tianneng
Chemiluminescence Gel Imaging System (Tanon-5200 Multi, Shanghai
Tanon Life Science Co., Ltd.).
RNA isolation and quality
analysis
Total RNA was extracted from tissue exosome-enriched
EVs using Exosome RNA Purification kit (cat. no. 5202050, Simgen
Biotech) according to the manufacturer's protocol. Nucleotide
length was paired-end 150 bp. NovaSeq 6000 SP Reagent kit (150
cycles; cat. no. 20028312; Illumina Inc.) was used for the
sequencing. Final library loading concentration was 10-15 nmol/l.
Raw bcl files were converted to FASTQ format using bcl2fastq
software (v2.20, Illumina Inc., USA), TopHat2/Bowtie2 (https://tophat.com/ and https://bowtie-bio.sourceforge.net/bowtie2/index.shtml)
for genome alignment, StringTie (https://ccb.jhu.edu/software/stringtie/index.shtml)
for gene expression quantification (FPKM) and R (v4.1.3, https://www.r-project.org/), prcomp function for PCA.
The RNA concentration and purity were evaluated using the Qubit
microRNA Assay kit, a Qubit fluorometer (Thermo Fisher Scientific,
Inc.; cat. no. Q32851) and an RNA Nano 6000 Assay kit with an
Agilent Bioanalyzer 2100 System (Agilent Technologies, Inc.) (cat.
no. 5067-1511).
Library preparation and
sequencing
For the mRNA libraries, a total of 4.5 ng RNA/sample
was used as input material for the RNA sample preparations. The
sequencing libraries were generated using a SMARTer stranded total
RNA-Seq kit V2 (Takara Bio, Inc.) (cat. no. 634413) according to
the manufacturer's instructions. Finally, library quality was
assessed via the Agilent Bioanalyzer 2100 and quantitative PCR
using SYBR Green I, KAPA Library Quantification kit (cat. no.
07960140001, Roche Diagnostics). Primer sequences were as follows:
(5'-3'): Forward primer (P5): AATGATACGGCGACCACCGA Reverse primer
(P7): CAAGCAGAAGACGGCATACG. Thermocycling conditions: Initial
denaturation at 95˚C for 3 min; followed by 40 cycles of 95˚C for
10 sec, 60˚C for 30 sec; quantification method: Library molar
concentration was determined using the standard curve method
generated from serially diluted reference DNA. Clustering of the
index-coded samples was performed on an acBot Cluster Generation
System using TruSeq PE Cluster kitv3-cBot-HS (Illumina, Inc.; cat.
no. PE-401-3001) according to the manufacturer's instructions.
Following cluster generation, the library preparations were
sequenced on an Illumina NovaSeq 6000 platform, and paired-end
reads were generated by EchoBiotech Co. Ltd.
Data preprocessing and quantification
of mRNAs
Raw data reads in fastq format were processed
through in-house Perl scripts. After removing reads containing
adapters, reads containing poly-N sequences and low-quality reads
from the raw data, the clean reads were obtained. The percentage of
bases with Phred quality score ≥20, (Q20), ≥30 (Q30), GC content
and sequence duplication level of the clean data were calculated.
All downstream analyses were based on high-quality, clean data.
Paired-end clean reads were aligned to the reference genome GRCh38
(ncbi.nlm.nih.gov/projects/genome/assembly/grc/human/)
using TopHat2/Bowtie2 (tophat.com/;
bowtie-bio.sourceforge.net/bowtie2/index.shtml).
Mapped reads were used for the quantification of gene expression
and differential expression analysis.
StringTie (v2.2.1; ccb.jhu.edu/software/stringtie/index.shtml) was
used to estimate gene expression levels as fragments/kilobase of
exon/million mapped fragments (FPKM) for each sample. The FPKM
value was calculated based on the length of the fragments and the
number of reads mapped to each fragment. FPKM values were used for
expression quantification and visualization. Principal component
analysis (PCA) of RNA sequencing data was performed using the
‘prcomp’ function in R (R v4.1.3; r-project.org).
Pathway enrichment analysis
Gene Ontology (GO; geneontology.org/) (24) enrichment analysis of the target
genes of the differentially expressed mRNAs was performed using the
topGO R package (v2.52.0; bioconductor.org/packages/topGO/) (25). Kyoto Encyclopedia of Genes and
Genomes (KEGG) (26) integrates
genomic, chemical, and pathway information to facilitate the
functional interpretation of large-scale molecular data,
particularly through enrichment analysis of biological pathways;
(genome.jp/kegg/). clusterProfiler R package
(v4.6.1; bioconductor.org/packages//release/bioc/html/clusterProfiler.html
was used to test the statistical enrichment of differentially
expressed genes (DEGs) in KEGG pathways.
Gene expression profiles and phenotype groupings in
the CRC and NC groups were analyzed using Gene Set Enrichment
Analysis (GSEA). GSEA was performed using the msigdbr' R package
(version 7.5.1; gsea-msigdb.org/gsea/msigdb/) and Molecular Signatures
Database (MSigDB, v7.5.1; gsea-msigdb.org/gsea/msigdb/) (27), available via the GSEA website
(software.broadinstitute.org/gsea/index.jsp).
MSigDB 7.5.1) was used to identify potential enrichment items.
P<0.001 and false-discovery rate (FDR) <0.05 were considered
statistically significant. The Reactome database (reactome.org/) was used to analyze the gene set
enrichment.
Gene set variation analysis (GSVA) of exosomal
DEGs. GSVA is a non-parametric and unsupervised method to
evaluate the enrichment of transcriptome gene sets. By scoring the
gene sets, GSVA transforms gene-level alterations into
pathway-level changes and cell types to judge the biological
function of the sample. GSVA scores were calculated between the CRC
and NC groups using the R package limma (v3.50.3; bioconductor.org/packages//release/bioc/html/limma.html)
to identify differentially enriched functions and pathways. GSVA
was used to calculate a signaling pathway variation score for each
sample using the GSVA R package (v1.42.0) (https://bioconductor.org/packages//release/bioc/html/GSVA.html)
(28), with P<0.05 considered to
indicate a statistically significant difference.
Weighted gene correlation network
analysis (WGCNA)
Exosome mRNA co-expression networks were constructed
using the WGCNA package in R (V1.72.1) (29). After the expression data were
filtered with transcript per million >1 and coefficient of
variation >0.5, the remaining mRNAs were used for WGCNA. A soft
threshold was chosen to build a network. The adjacency matrix was
set to a continuous value from 0-1, thus, the network conformed to
a power-law distribution and more closely resembled an actual
biological network. The block modules were used to build a
scale-free network, and module partition analysis was to identify
co-expression modules, which were used to group genes with similar
expression patterns. The dynamic tree cutting algorithm was used to
determine the module by dividing the cluster tree into branches and
assigning colors. The module eigengenes (ME) was used to summarize
the gene expression associated with all modules.
To identify clinically meaningful modules, the
correlation between modules and clinical trait was analyzed. For
analysis, two methods were used to identify key modules in the
network. In the first method, the Pearson correlation coefficient
between the ME of each module and clinical feature was calculated,
thereby identifying modules that were significantly correlated with
the features (P<0.05). In the second method, the Pearson
correlation coefficient [gene significance (GS)] between the
expression of each gene and each clinical trait was calculated; the
average absolute value of GS for all genes within the module was
calculated. The larger the absolute value, the stronger the
correlation between the module and clinical trait.
Screening and validation of key
genes
Candidate key genes were selected from the known
mRNAs according to the following criteria: An absolute value of
log2 FC value >1, an average FPKM value >10, an
area under the curve (AUC) value >0.8 and expression levels
>0 in 13 samples. The direction of regulation was consistent
with The Cancer Genome Atlas (TCGA) RNA expression analysis data
for rectum adenocarcinoma (READ) colon adenocarcinoma and the genes
belonged to the dark olive green and cyan WGCNA modules. Candidate
key genes were analyzed using the Wilcoxon test with data from
TCGA-READ (cancer.gov/tcga) (30). The overlapping genes were
subsequently subjected to protein-protein interaction (PPI)
analysis STRING (v12.0) (https://string-db.org/).
Following univariate logistic regression analysis,
candidate key genes with statistical significance (P≤0.05) were
selected. Their diagnostic performance was evaluated using an
independent CRC cohort from the exoRBase database (Version 2.0;
exorbase.org:8080/exoRBaseV2/download/toIndex
(31), which contains exosomal RNA
profiles from patients with CRC and healthy controls.
The exoRBase dataset was randomly divided into a
training set (70%, CRC, n=25, healthy controls, n=83, total, n=108)
and an independent testing set (30%, CRC, n=11, healthy controls,
n=36, total, n=47). Candidate molecular panels comprising 3-14
genes were systematically evaluated using the training set alone.
Feature selection was embedded within a nested three-fold
cross-validation workflow: Feature screening, panel performance
ranking and hyperparameter tuning were independently conducted
within each fold of the training cohort. The independent testing
set was excluded from all feature selection and model optimization
procedures and reserved for final external validation to completely
avoid data leakage.
For each candidate panel, both SVM and LR models
were independently constructed. LR models were developed using the
lrm function from the R rms package (v6.8.0) (hbiostat.org/r/rms/), with maximum likelihood
estimation adopted for model fitting to generate predicted
probabilities for diagnostic evaluation. SVM models were
implemented using LIBSVM (v3.23; csie.ntu.edu.tw/~cjlin/libsvm/) (32) using a C-support vector
classification (C-SVC) classifier, employing a radial basis
function (RBF) kernel. In this formulation, C is the penalty
parameter that balances margin maximization against training error
minimization, and γ is the RBF kernel coefficient that controls the
kernel's width. Both hyperparameters were optimized within a nested
cross-validation framework. Platt sigmoid scaling was applied to
obtain probabilistic outputs from the SVM models to align with the
LR probability prediction format.
For each candidate panel, the average performance
across the three cross-validation folds was calculated, including
the AUC, precision, recall, F1 score, which is a standard
statistical metric calculated as the harmonic mean of precision and
recall, and Matthews correlation coefficient. Candidate panels were
ranked primarily according to the mean AUC, with the remaining
metrics serving as complementary criteria to select the optimal
molecular signature for each algorithm. The 95% confidence
intervals (CIs) of the AUC values for both models were computed
using the DeLong method (33).
The final optimized SVM and LR models were validated
using the independent testing set. Receiver operating
characteristic (ROC) curves and confusion matrices were generated
to assess overall predicting performance. Bootstrap-corrected
calibration curves of the independent testing set (based on 100
bootstrap replicates) were plotted to evaluate the calibration
degree of both models. For the LR model, a diagnostic nomogram was
constructed and Shapley Additive Explanations (SHAP) analysis was
performed to quantify the contribution weight and importance
ranking of each molecule in the final prediction model.
Statistical analysis
All data are presented as the mean ± SD. Data
analysis was performed using R (version v4.1.3) (34) and differential expression between
CRC and NC was analyzed using a paired design in limma package
(v3.50.3; bioconductor.org/packages/release/bioc/html/limma.html).
Raw read counts were normalized using the Trimmed Mean of M-values
method, followed by variance modeling with the voom function in the
limma package. A paired design matrix was incorporated into the
linear model to account for matched sample pairs. Differentially
expressed genes were identified using thresholds of P≤0.05 and
|log2 fold change|≥0.58. The Benjamini-Hochberg
procedure was applied to calculate FDR-adjusted P-values for all
genes, but it was not used for screening differentially expressed
molecules. P<0.05 was considered to indicate a statistically
significant difference. A Wilcoxon test was performed for PPI
network analysis and to analyzed the expression levels of all genes
in patients with CRC were significantly different from those in
healthy individuals in TCGA-READ dataset.
Results
Characterization of exosome-enriched
EV
Exosome-enriched EV were isolated from tissue of
patients with CRC (Table I) using
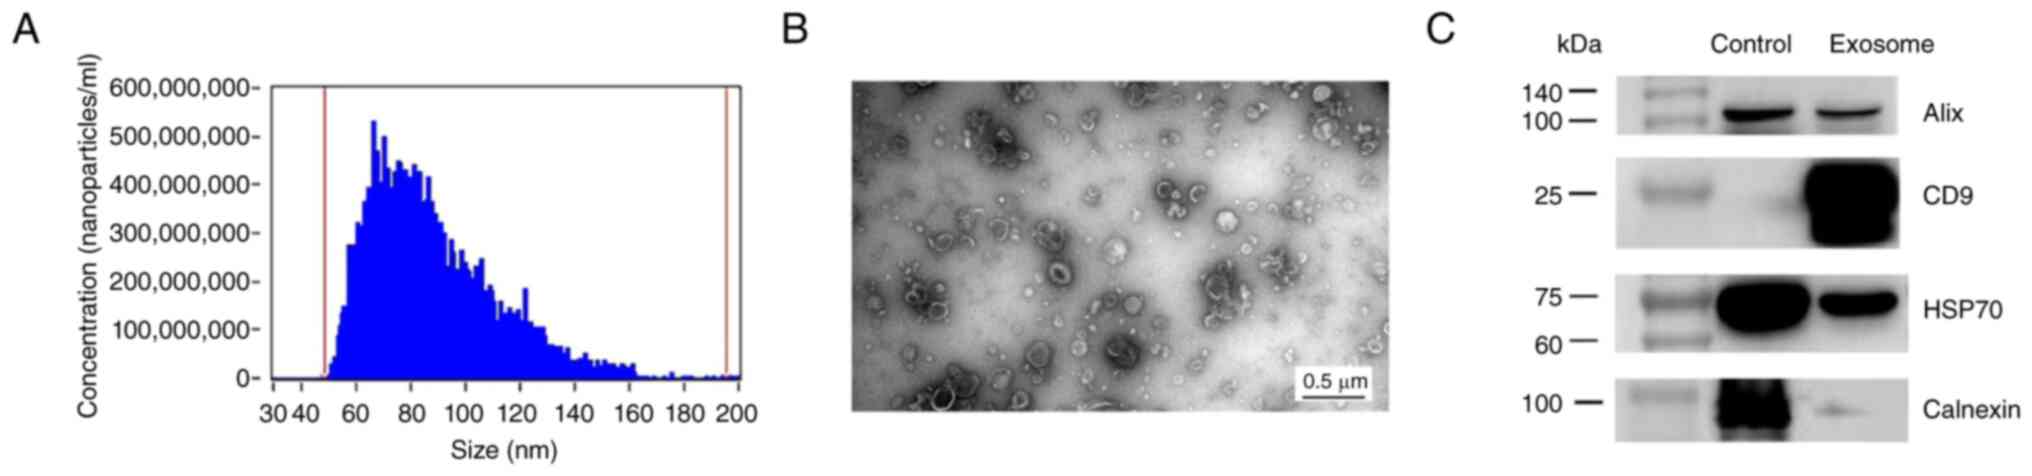
UC, SEC and ultrafiltration. Firstly, Nanoflow cytometry showed
that most particles from both the CRC and NC groups were within the
expected size range of exosome-enriched EV sizes, with the highest
peak observed at 70 nm (Fig. 1A).
TEM was used to assess the morphology and size of exosome-enriched
EV from both CRC and NC tissue. The exosome-enriched EV showed a
typical cup-shaped morphology, with lipid membrane-bound particles
ranging from 50-150 nm in size (Fig.
1B). Western blotting showed the expression of commonly used
exosomal markers, including CD9, HSP70 and Alix, in the extracted
exosome-enriched EV, whereas the expression of the negative exosome
marker calnexin was detected only in the supernatant fraction
(Figs. 1C and S1A-D). Together, these morphological
features, biomarker expression and size distribution indicated the
successful extraction of exosome-enriched EVs, consistent with
previous reports (10,35).
 | Table ICharacteristics of patients with
colorectal cancer. |
Table I
Characteristics of patients with
colorectal cancer.
| Patient no. | Sex | Age, years | Tumor location | Differentiation
grade | Stage |
|---|
| 1 | Female | 46 | Rectum | Middle-low | II |
| 2 | Male | 54 | Descending
colon | Middle-low | III |
| 3 | Male | 69 | Transverse
colon | Middle-low | II |
| 4 | Female | 61 | Ascending
colon | High | II |
| 5 | Male | 71 | Ascending
colon | Middle-low | III |
| 6 | Male | 80 | Sigmoid colon | Middle-low | III |
| 7 | Female | 60 | Ascending
colon | High | III |
| 8 | Male | 49 | Sigmoid colon | Middle-low | III |
| 9 | Male | 66 | Ascending
colon | Middle-low | II |
Identification of exosomal mRNA
profiles in CRC and NC tissue
Bowtie software was used to identify the mRNA
expression patterns in the exosome-enriched EV from the CRC
compared with NC tissue. A total of 9,426 mRNAs were detected in
the two groups. Using the limma R package, 814 DEGs were
identified, including 479 up- and 335 downregulated mRNAs in CRC
(Fig. 2A). The heatmap showed mRNA
DEGs from individual pairwise comparisons between CRC and NC, all
of which were statistically significant (Fig. 2B). PCA of the DEGs was performed to
assess differences between the paired CRC and NC samples. A
separation tendency indicated differences in mRNA levels between
the CRC and NC groups (Fig. 2C).
The P-values, corrected FDRs and fold-changes for all genes were
summarized in Table SI.
Functional enrichment of DEGs
GO and KEGG analyses were performed on these DEGs.
The most significantly enriched biological processes (BPs) were
associated with ‘cell division’, ‘protein stabilization’, ‘rRNA
processing’ and ‘translational initiation’. At the cellular
component (CC) level, the significant terms included ‘membrane’,
‘nucleolus’, ‘cytosol’, ‘extracellular exosome’, ‘nucleoplasm’ and
‘focal adhesion’. For molecular function (MF), ‘RNA binding’,
‘structural constituent of ribosome’, ‘collagen binding’, ‘protein
kinase binding’ and ‘unfolded protein binding’ were among the
significantly enriched items (Fig.
3).
KEGG pathway analysis showed that the most commonly
enriched pathways were associated with ‘cell cycle’, ‘focal
adhesion’, ‘ribosome’, ‘RNA transport’, ‘transcriptional
misregulation in cancer’, ‘oxidative phosphorylation’, ‘PI3K-Akt
signaling pathway’, ‘Wnt signaling pathway’, ‘Hippo signaling
pathway’, ‘Ras signaling pathway’, ‘MAPK signaling pathway’ and
‘chemokine signaling pathway’. Other enriched pathways included
‘carbon metabolism’, ‘purine metabolism’, ‘biosynthesis of amino
acids’ and ‘protein digestion and absorption’ (Fig. 4). These pathways are key for the
development and progression of CRC (36,37).
GSEA was performed on the entire transcriptome to
validate the functional enrichment results. The GSEA results were
similar to those of the GO and KEGG enrichment analyses of the
DEGs. The enriched GO terms included ‘chromosome segregation’ and
mitotic nuclear division for BP, ‘chromosomal region’, ‘condensed
chromosome’ and ‘protein/DNA complex’ for CC and ‘catalytic
activity acting on a nucleic acid’, ‘catalytic activity acting on a
tRNA’ and ‘tRNA methyltransferase activity’ for MF (Fig. S2A-C). The enriched KEGG terms
included ‘cell cycle’ and ‘DNA replication’. In the Reactome, the
enriched genes were associated with ‘DNA replication’ and cell
cycle mitotic (Fig. S3A and
B).
GSVA of exosomal DEGs
Using hallmark gene sets, GSVA showed that the
changes in signaling pathway enrichment in exosome-enriched EV were
associated with ‘oxidative phosphorylation’, ‘unfolded protein
response’, ‘E2F targets’, ‘G2M checkpoint’, ‘WNT-beta-catenin
signaling’, ‘NOTCH signaling’, ‘mTORC1 signaling’, ‘KRAS signaling
DN’, ‘MYC targets V2’ and ‘DNA repair’ (Fig. S4A). The enriched GO and KEGG terms
included ‘cell cycle’, ‘DNA replication’, ‘TORC1 complex’, ‘tRNA
transport’, ‘regulation of mitochondrial translation’, ‘SUMO ligase
complex’, ‘pentose phosphate pathway’, ‘glyoxylate and
dicarboxylate metabolism’ and ‘intestinal immune network for IgA
production’ (Fig. S4B and C).
Identification of candidate key genes
associated with CRC progression by WGCNA
Sample dendrograms and trait heatmaps were
constructed. The best soft threshold power (β) was selected as 9 to
build the scaleless network. A total of 27 modules were identified
via average hierarchical clustering and dynamic tree clipping. A
better result was obtained using the merged module tree (Fig. 5). The matrix with the module-trait
associations and corresponding P-values are shown in a heatmap
(Fig. 6). The cyan (r=0.64,
P=0.004) and dark olive green module (r=0.65, P=0.003) demonstrated
the greatest correlations with BPs, such as ‘cell cycle’,
‘metabolism of RNA’, protein catabolic process’, ‘cellular response
to chemical stress’ and ‘miRNA targeted genes in lymphocytes
(Fig. S5A and B). In total, 21 candidate key genes were
obtained from the intersection with the cyan module or dark olive
green module identified by WGCNA.
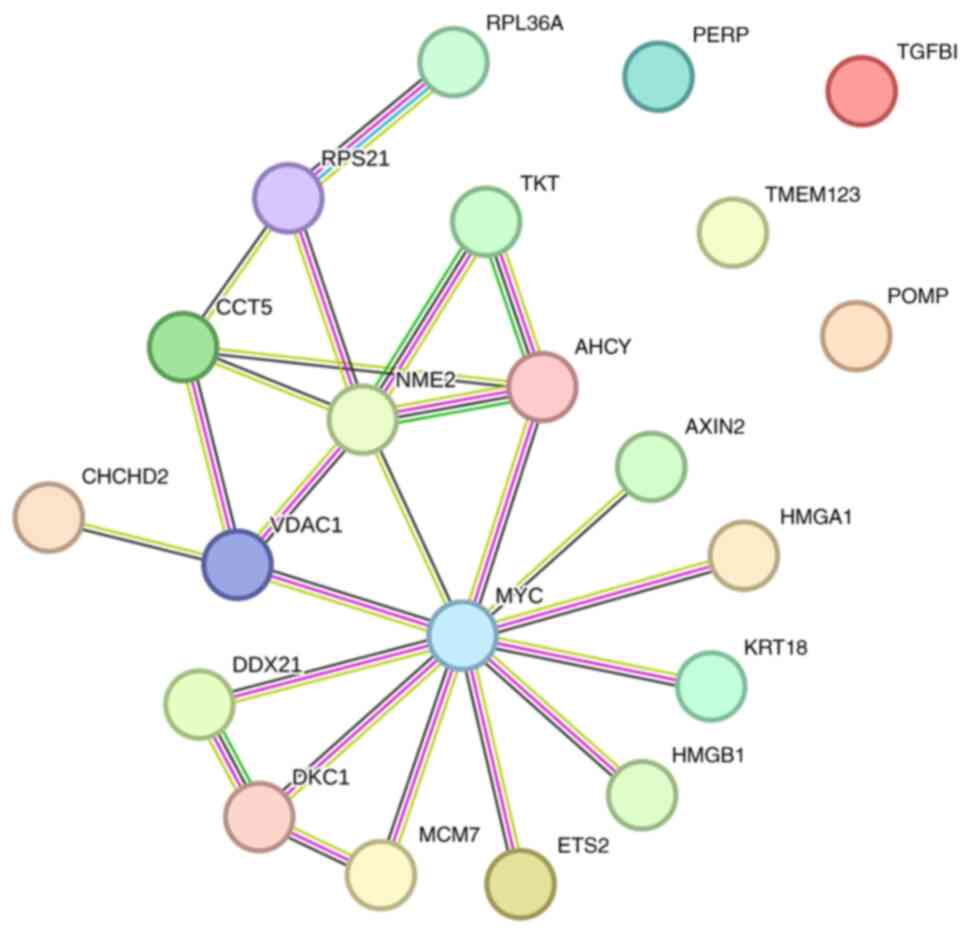
The PPI network was plotted according to the
analysis of the STRING database. In total, four proteins did not
interact with other proteins, whereas MYC was the most highly
expressed gene, followed by NME2 (non-metastatic cells 2), VDAC1
(voltage dependent anion channel 1), CCT5 (chaperonin containing
TCP1 subunit 5) and DKC1 (dyskerin pseudouridine synthase 1)
(Fig. 7).
Validation of the candidate key genes
with the external exosomal RNA data of exoRBase
Wilcoxon analysis revealed that the expression
levels of all 21 genes in patients with CRC (n=650) were
significantly different from those in healthy individuals (n=51) in
TCGA-READ dataset (Table II).
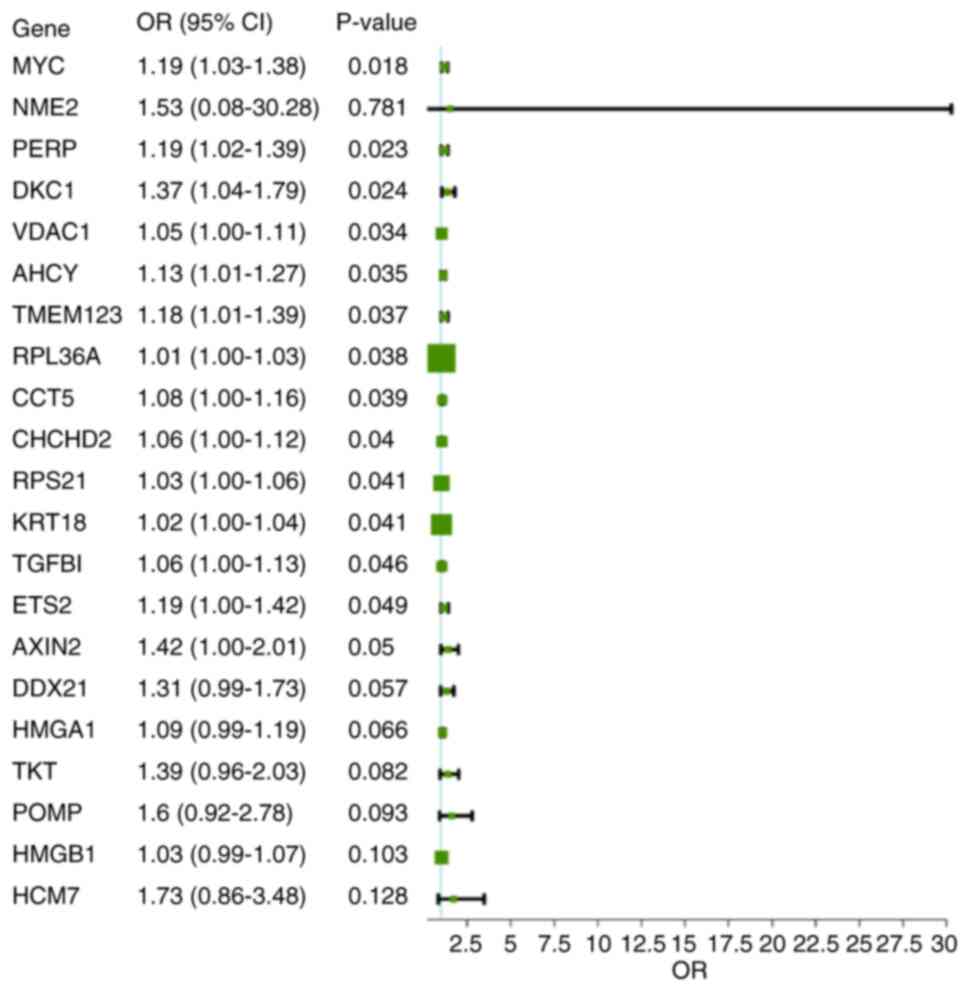
Following univariate logistic regression analysis, 14 candidate key
genes were identified for validation with external exosomal RNA
data from exoRBase (n=108). These genes included PERP (p53 effector
related to PMP-22 (PERP), MYC, DKC1, VDAC1, AHCY
(adenosylhomocysteinase), TMEM123 (transmembrane protein 123),
RPL36A (ribosomal protein L36a), CCT5, CHCHD2
(coiled-coil-helix-coiled-coil-helix domain containing 2), RPS21
(ribosomal protein S21), KRT18 (keratin 18), TGFBI (transforming
growth factor beta induced), ETS2 (ETS proto-oncogene 2) and AXIN2
(axin 2) (Fig. 8). LR was conducted
on the same data from the exoRBase. The confusion matrix analysis
showed relatively high efficiency in the test set (n=47). The ROC
analysis confirmed the predictive power of the model in both the
training (AUC=0. 890, 95% CI: 0.828-0.959) and the test set (AUC=0.
932, 95% CI: 0.818-0.962; Fig.
9A-D). The calibration curves of LR are shown in Fig. 10. A nomogram showed that the
expression levels of VDAC1, RPL36A, AXIN2 and AHCY had the greatest
difference between CRC and healthy samples (Fig. 11).
| Table IIRelative expression levels of 21
candidate key genes in The Cancer Genome Atlas-rectum
adenocarcinoma and colon adenocarcinoma. |
Table II
Relative expression levels of 21
candidate key genes in The Cancer Genome Atlas-rectum
adenocarcinoma and colon adenocarcinoma.
| Gene | Colorectal cancer
(n=650) | Healthy (n=51) |
|---|
| AHCY | 130.0 | 37.3 |
| CHCHD2 | 307.5 | 196.0 |
| KRT18 | 441.3 | 219.7 |
| PERP | 131.5 | 50.2 |
| TGFBI | 144.3 | 13.7 |
| DKC1 | 41.8 | 13.8 |
| POMP | 125.3 | 60.0 |
| MYC | 62.5 | 14.6 |
| HMGA1 | 248.9 | 86.0 |
| CCT5 | 46.8 | 24.5 |
| TMEM123 | 92.6 | 53.7 |
| ETS2 | 121.2 | 58.4 |
| TKT | 55.1 | 23.0 |
| DDX21 | 41.1 | 17.0 |
| MCM7 | 66.1 | 25.3 |
| AXIN2 | 32.9 | 5.3 |
| RPS21 | 951.5 | 354.4 |
| HMGB1 | 44.7 | 27.7 |
| VDAC1 | 133.3 | 95.3 |
| RPL36A | 1.1 | 0.3 |
| NME2 | 3.2 | 0.2 |
To validate the candidate key genes using exoRBase
data, a SVM analysis model was established. Following 3-fold cross
validation on the training set, a nine-molecule panel was selected,
comprising VDAC1, MYC, ETS2, DKC1, AHCY, RPL36A, TMEM123, PERP and
KRT18. The confusion matrix analysis showed relatively high
efficiency of the test set. ROC analysis showed an AUC of 0.948
(95% CI: 0.883-1.000) in the training set and 0.881 (95% CI:
0.767-0.996) in the test set (Fig.
12A-D). The calibration curves of LR are shown in Fig. 13. SHAP values were calculated to
assess the contribution of each gene to the model; VDAC, MYC and
ETS2 were the top three contributors (Fig. 14).
Discussion
The present exploratory study analyzed exosomal
mRNA. Analysis of tissue-derived exosome-enriched EV enabled
comparison of exosome components from tumor and adjacent NC tissue.
These exosome-enriched EVs are present in the extracellular
interstitium and function as mediators of intercellular signal
transduction. They may therefore more accurately reflect the
pathophysiological characteristics and behavior of cells compared
with exosomes derived from body fluid samples or cell lines
(19).
Transcriptomic analysis identified 814
differentially expressed mRNAs between CRC and normal tissue
exosome-enriched EV, suggesting that the mRNA cargo of
exosome-enriched EVs is markedly altered during CRC progression
(38). Exosomes play important
roles in the TME by modulating immune responses, supporting
metastasis and influencing angiogenesis, EMT, metabolic
reprogramming and drug resistance (39,40).
Functional enrichment analysis revealed that these differentially
expressed mRNAs were primarily associated with ‘cell cycle’,
protein synthesis and signal transduction, including the
PI3K/AKT/mTOR, Wnt/β-catenin and MAPK signaling pathways. These
pathways drive CRC proliferation, survival and metastasis,
supporting the biological relevance of the present findings
(7,37,40).
Similar enrichment of pathways involved in ribosome biogenesis,
‘DNA replication’ and focal adhesion indicates that exosomal mRNAs
may reflect the active metabolic and proliferative state of CRC
cells (42).
GSEA and GSVA confirmed that transcriptional
dysregulation in CRC-derived exosome-enriched EV extended beyond
classical oncogenic signaling, with alterations in mitochondrial
activity, oxidative phosphorylation and mTORC1-mediated translation
control. These findings suggested that the exosomal mRNA cargo
influences both metabolic reprogramming and stress response
mechanisms within the TME (40).
NOTCH and KRAS signaling and MYC are key players in the
pathophysiogenesis of CRC (37,43,44).
The regulatory and metabolic functions of MTORC1 signaling are
associated with cancer cell proliferation (45). Cancer cells require substantial
energy for proliferation, and their competition with neighboring
tissue for substances may contribute to metabolic abnormality in
these tissues (46). In addition,
metabolic changes in surrounding cells may be influenced by
secretions produced through metabolic activity within the TME
(47).
WGCNA and univariate logistic regression identified
14 candidate key genes associated with pathogenesis of CRC, namely
PERP, MYC, DKC1, VDAC1, AHCY, TMEM123, RPL36A, CCT5, CHCHD2, RPS21,
KRT18, TGFBI, ETS2 and AXIN2. WGCNA was exploratory because of the
small sample size. Using external datasets from exoRBase, these key
exosomal mRNAs were validated in predictive modeling via logistic
regression analyses and SVM. exoRBase is a repository of human
biofluid exosomal RNA data, whereas the data in the present study
were tissue-derived. Tissue-derived exosomes differ from
biofluid-derived exosomes in both source and composition (19). Therefore, differences between
biofluid and tissue-derived exosomes may affect the accuracy of the
validation.
The majority of proteins encoded by the candidate
key genes are reported to be involved in CRC tumorigenesis
(48). Notably, PERP is a plasma
membrane protein involved in p53-mediated apoptosis, desmosomal
cell-cell adhesion and stratified epithelial integrity (49) and it plays a role in the biological
process of CRC (50,51). MYC and AXIN2 are classical
regulators of Wnt/β-catenin signaling (52,53), a
well-established key pathway for CRC. MYC is involved in the
carcinogenesis of numerous types of cancer, including CRC (54). c-MYC, a member of MYC family, is
associated with resistance to EGFR inhibitors in CRC (55). DKC1, a key enzyme involved in
ribosomal RNA modification, promotes colon cancer progression by
regulating ribosomal proteins and the RAS/RAF/MEK/ERK signaling
pathway (56). VDAC1 is critical
for mitochondrial metabolism and apoptosis regulation, supporting
its mechanistic importance in CRC tumorigenesis (57). AHCY regulates intercellular
transmethylation and may be a therapeutic target in CRC (58). TMEM123 is a key player in immune
surveillance in CRC (59). CCT5 is
involved in protein folding, stability and cell structure
maintenance. CCT5 serves as a prognostic biomarker for CRC
(60,61). KRT18 is an oncogene for CRC
(62). TGFBI is an extracellular
protein that regulates cell adhesion and serves a significant role
in cancer progression (63). ETS2
encodes a transcription factor that regulates genes involved in
development and apoptosis and is involved in CRC tumorigenesis
(64). RPL36A is a component of the
ribosomal protein complex. It is significantly upregulated in CRC
tissue and associated with poor prognosis, likely through the
suppression of the MYC and MAPK/ERK pathways (65).
To the best of our knowledge, there are no reports
showing that RPS21 and CHCHD2 are associated with CRC. RPS21 serves
a role in protein synthesis (66).
CHCHD2 is a mitochondrial function-associated protein and is mainly
involved in physiological processes such as cell migration,
antioxidant stress and apoptosis regulation (67). Therefore, the biological relevance
of RPS21 or CHCHD2 with tumorigenesis of CRC should be further
explored based on the findings of the present study.
Taken together, these findings indicate that
exosomal mRNAs in CRC tissue carry distinct molecular signatures
reflective of tumor biology, immune modulation and oncogenic
signaling. These findings highlight the potential of tissue-derived
exosomal transcriptomics as a novel platform for understanding TME
interactions. However, the present study has several limitations,
including its small sample size and lack of additional RT-qPCR
verification and functional validation of key candidate genes.
Future studies with larger cohorts and mechanistic investigations
are needed to establish the causal roles of these exosomal mRNAs in
CRC development and to explore their utility in non-invasive
diagnostic settings, such as plasma exosome analysis. Furthermore,
biological replicate validation for western blotting was not
performed in the present study. This is a technical limitation as
it does not account for biological variation across samples, which
may limit the generalizability and robustness of the protein
expression data. Another technical limitation is that total
membrane protein staining was not conducted to verify the sample
loading uniformity. Replicate validation for western blotting and
total protein staining are required to strengthen data reliability
validation and loading consistency.
In conclusion, the present exploratory study
provides a detailed profile of tissue exosomal mRNAs in patients
with CRC. These findings may expand understanding of CRC exosome
biology and provide a foundation for validation in larger
experimental studies.
Supplementary Material
Uncropped western blot images. (A)
Alix, MW, 97/80 kDa. (B) CD9, MW, 23-27 kDa. (C) HSP70, MW, 70 kDa.
(D) Calnexin, MW, 90 kDa. MW, molecular weight; Alix,
apoptosis-linked gene 2-interacting protein X; HSP70, heat shock
protein 70 kDa.
Gene Set Enrichment Analysis of the
entire exosomal transcriptome on Gene Ontology items. (A)
Biological processes. (B) Cellular components. (C) Molecular
functions. P<0.001, FDR <0.05.
Gene Set Enrichment Analysis of the
entire exosomal transcriptome on KEGG and Reactome database. (A)
KEGG enrichment analysis. (B) Analysis of the Reactome database.
P<0.001, FDR <0.05. KEGG, Kyoto Encyclopedia of Genes and
Genomes.
Gene set variation analysis of
differentially expressed genes. (A) Hallmark gene set analysis. (B)
Gene Ontology and (C) Kyoto Encyclopedia of Genes and Genomes term
analysis. P<0.05. NC, normal control; CRC, colorectal
cancer.
Modules with significant correlations
with biological processes of colorectal cancer. Based on Gene
Ontology, (A) cyan and (B) dark olive green modules were
significantly correlated with biological processes of colorectal
cancer.
Paired limma difference analysis on
mRNA.
Acknowledgements
The authors would like to thank Dr Weimei Shi and Dr
Hongyu Liu from Beijing Echobiotech Co., Ltd. (Beijing, China), for
their technical help.
Funding
Funding: The present study was supported by the Scientific
Research Fund of Beijing Rehabilitation Hospital, Capital Medical
University (grant nos. 2023-10, 2025-21 and 2025-22) and the
Scientific Research Fund of Beijing Anorectal Society (grant no.
2020ABCP002).
Availability of data and materials
The data generated in the present study may be found
in the Genome Sequence Archive in National Genomics Data Center,
China National Center for Bioinformation under accession number
HRA016508 or at the following URL: ngdc.cncb.ac.cn/gsa-human.
Authors' contributions
QG, CBK, HYS and XWL designed the study. XWL, MX,
FYS, JZ, MQZ, YW, DYD and JFS performed the experiments. QG, CBK,
YMK, DYD, YW and XWL analyzed the data. QG, CBK, XWL and HYS wrote
the manuscript. QG and YMK revised the manuscript. QG, CBK, YMK and
XWL confirm the authenticity of all the raw data. All authors have
read and approved the final manuscript.
Ethics approval and consent to
participate
All procedures used in this research were approved
by the Ethics Committee of Beijing Rehabilitation Hospital,
Beijing, China (approval no. 2021bkky-149). Written informed
consent was obtained from all participants. All methods were
performed in this study were in accordance with the Declaration of
Helsinki.
Patient consent for publication
Not applicable.
Competing interests
The authors declare that they have no competing
interests.
References
|
1
|
Sung H, Filho AM, Laversanne M, Ferlay J,
Siegel RL, Soerjomataram I, Jemal A and Bray F: Global cancer
statistics 2024: GLOBOCAN estimates of incidence and mortality
worldwide for 34 cancers in 186 countries. CA Cancer J Clin.
76(e70090)2026.PubMed/NCBI View Article : Google Scholar
|
|
2
|
Xia C, Dong X, Li H, Cao M, Sun D, He S,
Yang F, Yan X, Zhang S, Li N and Chen W: Cancer statistics in China
and United States, 2022: Profiles, trends, and determinants. Chin
Med J (Engl). 135:584–590. 2022.PubMed/NCBI View Article : Google Scholar
|
|
3
|
Xia C, Li H, Wu C and Chen W: Cancer
burden and control in China: Landscape, trends and challenges. Nat
Rev Clin Oncol. 23:694–711. 2026.PubMed/NCBI View Article : Google Scholar
|
|
4
|
Ionescu VA, Gheorghe G, Bacalbasa N,
Chiotoroiu AL and Diaconu C: Colorectal cancer: From risk factors
to oncogenesis. Medicina (Kaunas). 59(1646)2023.PubMed/NCBI View Article : Google Scholar
|
|
5
|
Saad El Din K, Loree JM, Sayre EC, Gill S,
Brown CJ, Dau H and De Vera MA: Trends in the epidemiology of
young-onset colorectal cancer: A worldwide systematic review. BMC
Cancer. 20(288)2020.PubMed/NCBI View Article : Google Scholar
|
|
6
|
Wu X, Lin H and Li S: Prognoses of
different pathological subtypes of colorectal cancer at different
stages: A population-based retrospective cohort study. BMC
Gastroenterol. 19(164)2019.PubMed/NCBI View Article : Google Scholar
|
|
7
|
Housini M, Dariya B, Ahmed N, Stevens A,
Fiadjoe H, Nagaraju GP and Basha R: Colorectal cancer: Genetic
alterations, novel biomarkers, current therapeutic strategies and
clinical trials. Gene. 892(147857)2024.PubMed/NCBI View Article : Google Scholar
|
|
8
|
Kanth P and Inadomi JM: Screening and
prevention of colorectal cancer. BMJ. 374(n1855)2021.PubMed/NCBI View Article : Google Scholar
|
|
9
|
Hoseini SH, Enayati P, Nazari M,
Babakhanzadeh E, Rastgoo M and Sohrabi NB: Biomarker profile of
colorectal cancer: Current findings and future perspective. J
Gastrointest Cancer. 55:497–510. 2024.PubMed/NCBI View Article : Google Scholar
|
|
10
|
Doyle LM and Wang MZ: Overview of
extracellular vesicles, their origin, composition, purpose, and
methods for exosome isolation and analysis. Cells.
8(727)2019.PubMed/NCBI View Article : Google Scholar
|
|
11
|
Glass SE and Coffey RJ: Recent advances in
the study of extracellular vesicles in colorectal cancer.
Gastroenterology. 163:1188–1197. 2022.PubMed/NCBI View Article : Google Scholar
|
|
12
|
Dang Y, Zhang S, Wang Y, Zhao G, Chen C
and Jiang W: State-of-the-art: Exosomes in colorectal cancer. Curr
Cancer Drug Targets. 22:2–17. 2022.PubMed/NCBI View Article : Google Scholar
|
|
13
|
Singh S, Paul D, Nath V and A R: Exosomes:
Current knowledge and future perspectives. Tissue Barriers.
12(2232248)2024.PubMed/NCBI View Article : Google Scholar
|
|
14
|
Yao J, Chen Y and Lin Z: Exosomes:
Mediators in microenvironment of colorectal cancer. Int J Cancer.
153:904–917. 2023.PubMed/NCBI View Article : Google Scholar
|
|
15
|
Lotvall J and Valadi H: Cell to cell
signalling via exosomes through esRNA. Cell Adh Migr. 1:156–158.
2007.PubMed/NCBI View Article : Google Scholar
|
|
16
|
Möller A and Lobb RJ: The evolving
translational potential of small extracellular vesicles in cancer.
Nat Rev Cancer. 20:697–709. 2020.PubMed/NCBI View Article : Google Scholar
|
|
17
|
Yu W, Hurley J, Roberts D, Chakrabortty
SK, Enderle D, Noerholm M, Breakefield XO and Skog JK:
Exosome-based liquid biopsies in cancer: Opportunities and
challenges. Ann Oncol. 32:466–477. 2021.PubMed/NCBI View Article : Google Scholar
|
|
18
|
Milane L, Singh A, Mattheolabakis G,
Suresh M and Amiji MM: Exosome mediated communication within the
tumor microenvironment. J Control Release. 219:278–294.
2015.PubMed/NCBI View Article : Google Scholar
|
|
19
|
Li SR, Man QW, Gao X, Lin H, Wang J, Su
FC, Wang HQ, Bu LL, Liu B and Chen G: Tissue-derived extracellular
vesicles in cancers and non-cancer diseases: Present and future. J
Extracell Vesicles. 10(e12175)2021.PubMed/NCBI View Article : Google Scholar
|
|
20
|
Théry C, Witwer KW, Aikawa E, Alcaraz MJ,
Anderson JD, Andriantsitohaina R, Antoniou A, Arab T, Archer F,
Atkin-Smith GK, et al: Minimal information for studies of
extracellular vesicles 2018 (MISEV2018): A position statement of
the international society for extracellular vesicles and update of
the MISEV2014 guidelines. J Extracell Vesicles.
7(1535750)2018.PubMed/NCBI View Article : Google Scholar
|
|
21
|
Lundy DJ, Szomolay B and Liao CT: Systems
approaches to cell culture-derived extracellular vesicles for acute
kidney injury therapy: Prospects and challenges. Function (Oxf).
5(zqae012)2024.PubMed/NCBI View Article : Google Scholar
|
|
22
|
Wellington VNA and Singh S: Role of
exosomes in gastrointestinal physiology and pathophysiology. Front
Immunol. 16(1717977)2026.PubMed/NCBI View Article : Google Scholar
|
|
23
|
Vella LJ, Scicluna BJ, Cheng L, Bawden EG,
Masters CL, Ang CS, Willamson N, McLean C, Barnham KJ and Hill AF:
A rigorous method to enrich for exosomes from brain tissue. J
Extracell Vesicles. 6(1348885)2017.PubMed/NCBI View Article : Google Scholar
|
|
24
|
Ashburner M, Ball CA, Blake JA, Botstein
D, Butler H, Cherry JM, Davis AP, Dolinski K, Dwight SS, Eppig JT,
et al: Gene ontology: Tool for the unification of biology. The gene
ontology consortium. Nat Genet. 25:25–29. 2000.PubMed/NCBI View Article : Google Scholar
|
|
25
|
Alexa A, Rahnenführer J and Lengauer T:
Improved scoring of functional groups from gene expression data by
decorrelating GO graph structure. Bioinformatics. 22:1600–1607.
2006.PubMed/NCBI View Article : Google Scholar
|
|
26
|
Kanehisa M, Goto S, Kawashima S, Okuno Y
and Hattori M: The KEGG resource for deciphering the genome.
Nucleic Acids Res. 32 (Database Issue):D277–D280. 2004.PubMed/NCBI View Article : Google Scholar
|
|
27
|
Subramanian A, Tamayo P, Mootha VK,
Mukherjee S, Ebert BL, Gillette MA, Paulovich A, Pomeroy SL, Golub
TR, Lander ES and Mesirov JP: Gene set enrichment analysis: A
knowledge-based approach for interpreting genome-wide expression
profiles. Proc Natl Acad Sci USA. 102:15545–15550. 2005.PubMed/NCBI View Article : Google Scholar
|
|
28
|
Hänzelmann S, Castelo R and Guinney J:
GSVA: Gene set variation analysis for microarray and RNA-seq data.
BMC Bioinformatics. 14(7)2013.PubMed/NCBI View Article : Google Scholar
|
|
29
|
Langfelder P and Horvath S: WGCNA: An R
package for weighted correlation network analysis. BMC
Bioinformatics. 9(559)2008.PubMed/NCBI View Article : Google Scholar
|
|
30
|
Cancer Genome Atlas Network. Comprehensive
molecular characterization of human colon and rectal cancer.
Nature. 487:330–337. 2012.PubMed/NCBI View Article : Google Scholar
|
|
31
|
Li S, Li Y, Chen B, Zhao J, Yu S, Tang Y,
Zheng Q, Li Y, Wang P, He X and Huang S: exoRBase: A database of
circRNA, lncRNA and mRNA in human blood exosomes. Nucleic Acids
Res. 46 (D1):D106–D112. 2018.PubMed/NCBI View Article : Google Scholar
|
|
32
|
Chang CC and Lin CJ: LIBSVM: A library for
support vector machines. ACM Trans Intell Syst Technol. 2:1–27.
2011.
|
|
33
|
DeLong ER, DeLong DM and Clarke-Pearson
DL: Comparing the areas under two or more correlated receiver
operating characteristic curves: A nonparametric approach.
Biometrics. 44:837–845. 1988.PubMed/NCBI
|
|
34
|
Robinson MD, McCarthy DJ and Smyth GK:
edgeR: A bioconductor package for differential expression analysis
of digital gene expression data. Bioinformatics. 26:139–140.
2010.PubMed/NCBI View Article : Google Scholar
|
|
35
|
Li T, Zhou T, Wu J, Lv H, Zhou H, Du M,
Zhang X, Wu N, Gong S, Ren Z, et al: Plasma exosome-derived
circGAPVD1 as a potential diagnostic marker for colorectal cancer.
Transl Oncol. 31(101652)2023.PubMed/NCBI View Article : Google Scholar
|
|
36
|
Glaviano A, Foo ASC, Lam HY, Yap KCH,
Jacot W, Jones RH, Eng H, Nair MG, Makvandi P, Geoerger B, et al:
PI3K/AKT/mTOR signaling transduction pathway and targeted therapies
in cancer. Mol Cancer. 22(138)2023.PubMed/NCBI View Article : Google Scholar
|
|
37
|
Abedizadeh R, Majidi F, Khorasani HR,
Abedi H and Sabour D: Colorectal cancer: A comprehensive review of
carcinogenesis, diagnosis, and novel strategies for classified
treatments. Cancer Metastasis Rev. 43:729–753. 2024.PubMed/NCBI View Article : Google Scholar
|
|
38
|
Liu J, Ren L, Li S, Li W, Zheng X, Yang Y,
Fu W, Yi J, Wang J and Du G: The biology, function, and
applications of exosomes in cancer. Acta Pharm Sin B. 11:2783–2797.
2021.PubMed/NCBI View Article : Google Scholar
|
|
39
|
Han J, Ma S, Zhao Y, Wang B, Ding S and Hu
Y: The function, underlying mechanism and clinical potential of
exosomes in colorectal cancer. Front Biosci (Landmark Ed).
28(302)2023.PubMed/NCBI View Article : Google Scholar
|
|
40
|
Jin K, Lan H, Han Y and Qian J: Exosomes
in cancer diagnosis based on the latest evidence: Where are we? Int
Immunopharmacol. 142(113133)2024.PubMed/NCBI View Article : Google Scholar
|
|
41
|
Leiphrakpam PD and Are C: PI3K/Akt/mTOR
Signaling pathway as a target for colorectal cancer treatment. Int
J Mol Sci. 25(3178)2024.PubMed/NCBI View Article : Google Scholar
|
|
42
|
Akter A, Kamal T, Akter S, Auwal A and
Islam F: Exosomes: A potential tool in the diagnosis, prognosis and
treatment of patients with colorectal cancer. Future Oncol.
21:2347–2365. 2025.PubMed/NCBI View Article : Google Scholar
|
|
43
|
Tyagi A, Sharma AK and Damodaran C: A
review on notch signaling and colorectal cancer. Cells.
9(1549)2020.PubMed/NCBI View Article : Google Scholar
|
|
44
|
Zhu G, Pei L, Xia H, Tang Q and Bi F: Role
of oncogenic KRAS in the prognosis, diagnosis and treatment of
colorectal cancer. Mol Cancer. 20(143)2021.PubMed/NCBI View Article : Google Scholar
|
|
45
|
Szwed A, Kim E and Jacinto E: Regulation
and metabolic functions of mTORC1 and mTORC2. Physiol Rev.
101:1371–1426. 2021.PubMed/NCBI View Article : Google Scholar
|
|
46
|
Vaghari-Tabari M, Ferns GA, Qujeq D,
Andevari AN, Sabahi Z and Moein S: Signaling, metabolism, and
cancer: An important relationship for therapeutic intervention. J
Cell Physiol. 236:5512–5532. 2021.PubMed/NCBI View Article : Google Scholar
|
|
47
|
O'Sullivan D, Sanin DE, Pearce EJ and
Pearce EL: Metabolic interventions in the immune response to
cancer. Nat Rev Immunol. 19:324–335. 2019.PubMed/NCBI View Article : Google Scholar
|
|
48
|
Li Q, Geng S, Luo H, Wang W, Mo YQ, Luo Q,
Wang L, Song GB, Sheng JP and Xu B: Signaling pathways involved in
colorectal cancer: Pathogenesis and targeted therapy. Signal
Transduct Target Ther. 9(266)2024.PubMed/NCBI View Article : Google Scholar
|
|
49
|
Roberts O and Paraoan L: PERP-ing into
diverse mechanisms of cancer pathogenesis: Regulation and role of
the p53/p63 effector PERP. Biochim Biophys Acta Rev Cancer.
1874(188393)2020.PubMed/NCBI View Article : Google Scholar
|
|
50
|
Li XL, Zhou J, Chen ZR and Chng WJ: P53
mutations in colorectal cancer-molecular pathogenesis and
pharmacological reactivation. World J Gastroenterol. 21:84–93.
2015.PubMed/NCBI View Article : Google Scholar
|
|
51
|
Zhang GL, Pan LL, Huang T and Wang JH: The
transcriptome difference between colorectal tumor and normal
tissues revealed by single-cell sequencing. J Cancer. 10:5883–5890.
2019.PubMed/NCBI View Article : Google Scholar
|
|
52
|
Cheng LZ, Huang DL, Tang ZR, Zhang JH,
Xiong T, Zhou C, Zhang NX, Fu R, Cheng YX and Wu ZQ:
Pharmacological targeting of Axin2 suppresses cell growth and
metastasis in colorectal cancer. Br J Pharmacol. 180:3071–3091.
2023.PubMed/NCBI View Article : Google Scholar
|
|
53
|
Rennoll S and Yochum G: Regulation of MYC
gene expression by aberrant Wnt/β-catenin signaling in colorectal
cancer. World J Biol Chem. 6:290–300. 2015.PubMed/NCBI View Article : Google Scholar
|
|
54
|
Norollahi SE, Foumani MG, Pishkhan MK,
Shafaghi A, Alipour M, Jamkhaneh VB, Marghoob MN and Vahidi S: DNA
methylation profiling of MYC, SMAD2/3 and DNMT3A in colorectal
cancer. Oman Med J. 36(e315)2021.PubMed/NCBI View Article : Google Scholar
|
|
55
|
Strippoli A, Cocomazzi A, Basso M, Cenci
T, Ricci R, Pierconti F, Cassano A, Fiorentino V, Barone C, Bria E,
et al: c-MYC expression is a possible keystone in the colorectal
cancer resistance to EGFR inhibitors. Cancers (Basel).
12(638)2020.PubMed/NCBI View Article : Google Scholar
|
|
56
|
Kan G, Wang Z, Sheng C, Chen G, Yao C, Mao
Y and Chen S: Dual inhibition of DKC1 and MEK1/2 synergistically
restrains the growth of colorectal cancer cells. Adv Sci (Weinh).
8(2004344)2021.PubMed/NCBI View Article : Google Scholar
|
|
57
|
Hu A, Wang H, Xu Q, Pan Y, Jiang Z, Li S,
Qu Y, Hu Y, Wu H and Wang X: A novel CPT1A covalent inhibitor
modulates fatty acid oxidation and CPT1A-VDAC1 axis with
therapeutic potential for colorectal cancer. Redox Biol.
68(102959)2023.PubMed/NCBI View Article : Google Scholar
|
|
58
|
Vande Voorde J, Steven RT, Najumudeen AK,
Ford CA, Dexter A, Gonzalez-Fernandez A, Nikula CJ, Xiang Y, Ford
L, Maneta Stavrakaki S, et al: Metabolic profiling stratifies
colorectal cancer and reveals adenosylhomocysteinase as a
therapeutic target. Nat Metab. 5:1303–1318. 2023.PubMed/NCBI View Article : Google Scholar
|
|
59
|
Pesce E, Cordiglieri C, Bombaci M,
Eppenberger-Castori S, Oliveto S, Manara C, Crosti M, Ercan C, Coto
M, Gobbini A, et al: TMEM123 a key player in immune surveillance of
colorectal cancer. Front Immunol. 14(1194087)2023.PubMed/NCBI View Article : Google Scholar
|
|
60
|
Guan B, Xu M, Zheng R, Guan G and Xu B:
Novel biomarkers to predict treatment response and prognosis in
locally advanced rectal cancer undergoing neoadjuvant
chemoradiotherapy. BMC Cancer. 23(1099)2023.PubMed/NCBI View Article : Google Scholar
|
|
61
|
Zhang Y, Zhao W, Wu L, Ai T, He J, Chen Z,
Wang C, Wang H, Zhou R, Liu C and Zhao L: Inhibition of
CCT5-mediated asparagine biosynthesis and anti-PD-L1 produce
synergistic antitumor effects in colorectal cancer. Acta Pharm Sin
B. 15:2480–2497. 2025.PubMed/NCBI View Article : Google Scholar
|
|
62
|
Zhang J, Hu S and Li Y: KRT18 is
correlated with the malignant status and acts as an oncogene in
colorectal cancer. Biosci Rep. 39(BSR20190884)2019.PubMed/NCBI View Article : Google Scholar
|
|
63
|
Zhu J, Chen X, Liao Z, He C and Hu X:
TGFBI protein high expression predicts poor prognosis in colorectal
cancer patients. Int J Clin Exp Pathol. 8:702–710. 2015.PubMed/NCBI
|
|
64
|
Chen Y, Ying Y, Wang M, Ma C, Jia M, Shi
L, Wang S, Zheng X, Chen W and Shu XS: A distal super-enhancer
activates oncogenic ETS2 via recruiting MECOM in inflammatory bowel
disease and colorectal cancer. Cell Death Dis. 14(8)2023.PubMed/NCBI View Article : Google Scholar
|
|
65
|
Shi J, Yang Y, Chen F, Zhou L, Wei H, Dong
F, Wang X, Shan Y and Chen T: RPL36A activates ERK pathway and
promotes colorectal cancer growth. Transl Oncol.
51(102170)2025.PubMed/NCBI View Article : Google Scholar
|
|
66
|
Kenmochi N, Kawaguchi T, Rozen S, Davis E,
Goodman N, Hudson TJ, Tanaka T and Page DC: A map of 75 human
ribosomal protein genes. Genome Res. 8:509–523. 1998.PubMed/NCBI View Article : Google Scholar
|
|
67
|
Kee TR, Espinoza Gonzalez P, Wehinger JL,
Bukhari MZ, Ermekbaeva A, Sista A, Kotsiviras P, Liu T, Kang DE and
Woo JA: Mitochondrial CHCHD2: Disease-associated mutations,
physiological functions, and current animal models. Front Aging
Neurosci. 13(660843)2021.PubMed/NCBI View Article : Google Scholar
|