Introduction
Renal cell carcinomas (RCCs) account for 2–3% of all
malignancies (1,2). Surgical resection is the first choice
of treatment for RCC at an early stage. However, when patients
present at an advanced stage or have local recurrence or distant
metastasis to other organs, immunotherapy, chemotherapy and
radiation therapy are applied, although the response rates are
poor. Recently, new molecular targeted agents, such as sunitinib
and sorafenib, have been developed and are widely used (3–7).
Although these drugs have demonstrated a better clinical response
than previously used treatments, serious adverse reactions, such as
fatigue, mucositis, hand-foot syndrome, diarrhea and hypertension,
are often observed and become the cause of discontinuation of the
drug administration.
Monotherapy or combination therapy of interleukin
(IL)-2 and interferon (IFN)-α has been relatively widely applied
for the treatment of advanced kidney cancers. In Japan, to reduce
the risk of adverse reactions, the dose of IL-2 is lower than that
used in other countries (8–11).
While the response rate of monotherapy is as low as 10–20%, that of
combination therapy is slightly better, 20–25% (12–17).
However, the rate of adverse reactions associated with this
combination therapy appears to be lower than recently developed
molecular targeting drugs (18,19).
Hence, we aimed to define a subset of patients who expect to show a
favorable response to this therapy through gene expression profiles
of metastatic RCCs, after enrichment of the cancer cells with laser
microbeam microdissection technology. In the present study, two
antigen-presentation-associated molecules were identified that may
predict response to IL-2 and IFN-α combination therapy for
metastatic RCC. In addition, this finding may be useful for
improving the drug response rate, for contributing to the
improvement of the quality of life and prognosis of patients, and
reducing unnecessary medical costs to non-responders.
Materials and methods
Patients and tissue samples
Tissue samples from surgically resected RCC and
corresponding clinical information were obtained from 21 hospitals
(Tokyo University, Okayama University, Sapporo Medical University,
Kobe University, Nihon University, Kanazawa University, Isezaki
City Hospital, Shinshu University, Kyushu University, Kyoto
Prefectural University of Medicine, Osaka Medical Center for Cancer
and Cardiovascular Diseases, Hamamatsu Medical University, Sendai
Social Insurance Hospital, Iwate Medical University, Okayama
Medical Center, Nagoya City University, Tokushima University, Gifu
Prefectural General Medical Center, Tokyo Medical University, Tokyo
Medical and Dental University, and Tokyo Women’s Medical University
Medical Center East, Japan) after each patient provided written
informed consent. A total of 42 cancer samples (11 women and 31
men; median age 62.5 years; range 25–75) (Table I) that had been histologically
confirmed as RCC, were selected for this study. The clinical stage
of each patient was assessed according to the Union International
Centre Cancer tumor node metastasis classification. Corresponding
normal tissue was also obtained from the distant region of the
cancer lesion in the resected kidney tissue. These samples were
immediately embedded in TissueTek OCT compound (Sakura, Tokyo,
Japan), frozen and stored at −80°C. The frozen tissues were sliced
into 8-μm sections using a cryostat (Sakura) and then stained with
H&E for histological examination.
 | Table I.Clinicopathological features of
patients with renal cell carcinoma. |
Table I.
Clinicopathological features of
patients with renal cell carcinoma.
| ID | Gender | Age | Histological
type | Response | Group | Prediction |
|---|
| KIS-020 | M | 63 | Clear cell
carcinoma | PR | Responder | Learning |
| KIS-021 | F | 71 | Clear cell
carcinoma | PR | Responder | Learning |
| KIS-028 | M | 71 | Clear cell
carcinoma | PR | Responder | Learning |
| KIS-034 | M | 55 | Clear cell
carcinoma | PR | Responder | Learning |
| KIS-035 | F | 74 | Clear cell
carcinoma | PR | Responder | Learning |
| KIS-038 | M | 63 | Clear cell
carcinoma | PR | Responder | Learning |
| KIS-044 | M | 66 | Clear cell
carcinoma | CR | Responder | Learning |
| KIS-050 | M | 60 | Clear cell
carcinoma | PR | Responder | Learning |
| KIS-058 | M | 56 | Clear cell
carcinoma | PR | Responder | Learning |
| KIS-061 | M | 65 | Clear cell
carcinoma | CR | Responder | Learning |
| KIS-001 | M | 69 | Clear cell
carcinoma | NC | Non-responder | Learning |
| KIS-005 | M | 25 | Combined type
(cyst-associated and papillary renal cell carcinoma) | PD | Non-responder | Learning |
| KIS-006 | M | 44 | Clear cell
carcinoma | PD | Non-responder | Learning |
| KIS-007 | M | 71 | Clear cell
carcinoma | PD | Non-responder | Learning |
| KIS-008 | M | 67 | Clear cell
carcinoma | PD | Non-responder | Learning |
| KIS-016 | F | 67 | Clear cell
carcinoma | NC | Non-responder | Learning |
| KIS-026 | M | 64 | Clear cell
carcinoma | NC | Non-responder | Learning |
| KIS-032 | M | 60 | Clear cell
carcinoma | NC | Non-responder | Learning |
| KIS-040 | F | 68 | Clear cell
carcinoma | PD | Non-responder | Learning |
| KIS-046 | M | 51 | Clear cell
carcinoma | PD | Non-responder | Learning |
| KIS-048 | M | 67 | Clear cell
carcinoma | PD | Non-responder | Learning |
| KIS-049 | F | 51 | Clear cell
carcinoma | NC | Non-responder | Learning |
| KIS-051 | M | 73 | Clear cell
carcinoma | NC | Non-responder | Learning |
| KIS-052 | F | 71 | Combined type
(clear cell, granular cell and spindle cell carcinoma) | PD | Non-responder | Learning |
| KIS-057 | F | 60 | Clear cell
carcinoma | PD | Non-responder | Learning |
| KIS-059 | M | 60 | Clear cell
carcinoma | NC | Non-responder | Learning |
| KIS-060 | M | 56 | Clear cell
carcinoma | NC | Non-responder | Learning |
| KIS-066 | M | 61 | Clear cell
carcinoma | NC | Non-responder | Learning |
| KIS-012 | M | 62 | Clear cell
carcinoma | PR | Responder | Test |
| KIS-029 | F | 57 | Clear cell
carcinoma | PR | Responder | Test |
| KIS-043 | M | 64 | Clear cell
carcinoma | PR | Responder | Test |
| KIS-045 | M | 62 | Papillary renal
cell carcinoma | PR | Responder | Test |
| KIS-065 | F | 39 | Combined type
(clear cell carcinoma and spindle cell carcinoma) | PR | Responder | Test |
| KIS-003 | F | 56 | Clear cell
carcinoma | NC | Non-responder | Test |
| KIS-004 | M | 58 | Clear cell
carcinoma | MR | Non-responder | Test |
| KIS-015 | M | 40 | Clear cell
carcinoma | NC | Non-responder | Test |
| KIS-023 | M | 71 | Clear cell
carcinoma | MR | Non-responder | Test |
| KIS-030 | F | 51 | Clear cell
carcinoma | NC | Non-responder | Test |
| KIS-033 | M | 72 | Clear cell
carcinoma | PD | Non-responder | Test |
| KIS-047 | M | 76 | Clear cell
carcinoma | MR | Non-responder | Test |
| KIS-056 | M | 69 | Clear cell
carcinoma | MR | Non-responder | Test |
| KIS-064 | M | 61 | Clear cell
carcinoma | PD | Non-responder | Test |
Preparation and analysis of RNA
Total RNA purified using the RNeasy Micro kit
(Qiagen, Germany) was quantified in a Nano Drop spectrophotometer
(ND 1000). The RNAs, whose ratios of OD 260/280 nm were between 1.7
and 2.0, were used for further analysis.
Microarray analysis
According to the protocol of the T7-Oligo(dT)
Promoter Primer kit and IVT Labeling kit (Affymetrix), RNAs were
reversely transcribed using oligo(dT) promoter primers with a T7
recognition site in the first-strand cDNA synthesis. Following
purification of the product of the double-strand cDNA after
second-strand cDNA synthesis, in vitro transcription (IVT)
reaction of biotinylated complementary RNA was carried out using T7
RNA polymerase. Labeled RNA was fragmented and hybridized to the
array named Affymetrix Human Genome U133 Plus 2.0. The arrays were
washed, stained and scanned using the GeneChip 3000 7G scanner
(Affymetrix). Signal intensities and the absolute call dataset were
generated with Affymetrix Gene Chip Operating Software (AGCC) using
the MAS5.0 algorithm.
Identification of genes associated with
the clinical response to the treatment
Treatment responses, in detail, evaluated according
to the Response Criteria for Urological Cancer Treatment (20), which are nearly identical to the
WHO criteria (21), are documented
in Tables I and II. We applied a random permutation test
to identify genes whose expression levels were significantly
different between the responder (clinical response: CR, complete
response or PR, partial response) and non-responder groups (MR,
minor response; NC, no change or PD, progressive disease);
favorable response or poor response was defined by the tumor
shrinkage rate of pulmonary metastasis.
| Table II.Clinical response and classification
of the two groups. |
Table II.
Clinical response and classification
of the two groups.
| Group | Clinical
response | No. of
patients |
|---|
| Responder | | |
| CR | 2 |
| PR | 13 |
| Non-responder | | |
| MR | 4 |
| NC | 12 |
| PD | 11 |
| Total | | 42 |
The mean (μ) and standard deviation (σ) were
calculated from the log-transformed relative expression ratios of
each gene in responder (r) and non-responder (n) cases. A
discrimination score (DS) for each gene was defined as follows: DS
= (μr-μn)/(σr+σn).
We performed permutation tests to evaluate the
ability of individual genes to distinguish between 10 samples in
the responders and 18 samples in the non-responders; samples were
randomly permutated between the two groups at 1,000,000 times.
Since the DS dataset of each gene showed a normal distribution, we
calculated a P-value for the user-defined grouping (22).
Quantitative RT-PCR
We identified 24 genes (Table III) that showed significantly
different levels of expression between the responder and
non-responder groups, based on microarray analysis, and
subsequently focused on two immunologically important genes,
HLA-DQA1 and HLA-DQB1. To examine the possibility of adapting our
prediction system for clinical use, we performed quantitative
real-time RT-PCR of the two genes and evaluated their expression
levels in all 42 samples by calculating relative expression ratios
of each sample. Extracted RNAs were reversely transcribed using the
SuperScript VILO cDNA Synthesis kit (Invitrogen) following the
supplier’s protocol. For the quantification of mRNA levels,
real-time quantitative PCR was performed with LightCycler 480
(Roche). The sequences of each primer and probe were as follows:
internal control (β2M), forward primer 5′-TAGGAGGGCTGGCAACTTAG-3′;
reverse primer 5′-CCAAGATGTTGATGTTGGATAAGA-3′; and TaqMan
Probe 5′-GGGAGCAG-3′; predictive gene1 (HLA-DQA1), forward primer
5′-ACTATTCTCTGGCCCGGTTT-3′; reverse primer
5′-TACCCCAGGCATGTCTTTGT-3′; and TaqMan probe 5′-CTCCTCCA-3′;
predictive gene2 (HLA-DQB1), forward primer
5′-AGCATTTTGGGGTGTCAAGT-3′; reverse primer
5′-ACACAGCACTCACCAAACCA-3′; and TaqMan probe
5′-CAGAGGAG-3′.
| Table III.List of 24 discriminating genes. |
Table III.
List of 24 discriminating genes.
| Accession no. | Symbol | P-value | Sign | Gene title |
|---|
| NM_004193 | GBF1 | 8.87E-07 | - | Golgi-specific
brefeldin A resistance factor 1 |
| NM_005575 | LNPEP | 1.49E-06 | + | Leucyl/cystinyl
aminopeptidase |
| NM_005923 | MAP3K5 | 3.47E-06 | + | Mitogen-activated
protein kinase kinase kinase 5 |
| AW452656 | ----- | 6.95E-06 | - | cDNA FLJ37989 fis,
clone CTONG2011676 |
| NM_007081 | RABL2B | 1.36E-05 | - | RAB, member of RAS
oncogene family-like 2B |
| X63381 | MEF2A | 2.26E-05 | + | Myocyte enhancer
factor 2A |
| AK093779 | LOC399900 | 2.45E-05 | - | Hypothetical gene
supported by AK093779 |
| X00452 | HLA-DQA1 | 2.83E-05 | + | Major
histocompatibility complex, class II, DQ α1 |
| AK023514 | TDP1 | 3.76E-05 | + | Tyrosyl-DNA
phosphodiesterase 1 |
| NM_018835 | RC3H2 | 3.99E-05 | + | Ring finger and
CCCH-type zinc finger domain 2 |
| AL096842 | MTUS1 | 4.05E-05 | + | Mitochondrial tumor
suppressor 1 |
| NM_007121 | NR1H2 | 5.80E-05 | - | Nuclear receptor
subfamily 1, group H, member 2 |
| AA131302 | ----- | 8.88E-05 | - | Transcribed locus,
weakly similar to NP_001039959.1 dynamin 1-like (Bos
taurus) |
| NM_003170 | SUPT6H | 1.16E-04 | - | Suppressor of Ty 6
homolog (S. cerevisiae) |
| NM_001190 | BCAT2 | 1.17E-04 | - | Branched chain
aminotransferase 2, mitochondrial |
| BF060747 | LOC130576 | 1.20E-04 | + | Hypothetical
protein LOC130576 |
| BC000580 | PH-4 | 1.57E-04 | - | Hypoxia-inducible
factor prolyl 4-hydroxylase |
| NM_024605 | ARHGAP10 | 1.91E-04 | + | Rho GTPase
activating protein 10 |
| BG231758 | ----- | 1.92E-04 | + | Transcribed locus,
strongly similar to NP_001025836.1 tuftelin interacting protein 11
(Gallus gallus) |
| AB029026 | TACC1 | 2.56E-04 | + | Transforming,
acidic coiled-coil containing protein 1 |
| M16276 | HLA-DQB1 | 2.66E-04 | + | Major
histocompatibility complex, class II, DQ β1 |
| NM_012463 | ATP6V0A2 | 3.51E-04 | + | ATPase, H+
transporting, lysosomal V0 subunit a2 |
| J03225 | TFPI | 3.61E-04 | + | Tissue factor
pathway inhibitor (lipoprotein-associated coagulation
inhibitor) |
| AJ011597 | BDNFOS | 4.45E-04 | - | Brain-derived
neurotrophic factor opposite strand |
PCR reactions were optimized for the number of
cycles to ensure product intensity within the logarithmic phase of
amplification.
Results
Laser microbeam microdissection (LMM) was carried
out to enrich cancer cell populations from each of 42 tumor tissues
from patients that had met the inclusion criteria of this clinical
trial as reported previously (21). To attempt to establish a prediction
method for clinical responses to IL-2 and IFN-α combination
therapy, we analyzed gene expression profiles of microdissected
renal cancer cells using an oligoDNA microarray consisting of
38,500 genes or ESTs. Analyzing 10 responders (CR or PR) and 18
non-responders (PD or NC), we identified 24 genes that showed
significantly different levels of expression between the responder
and non-responder groups according to the two following
definitions: i) expression information based on signal intensities
higher than the cutoff level in >60% of samples of at least one
group; ii) random permutation test P-values <0.0005 (Table III). Among the 24 genes selected,
the expression levels of 14 genes were higher in the responder
group, including two immunologically important genes, HLA-DQA1
(P=2.83E-05) and HLA-DQB1 (P=2.66E-04), that are known to be HLA
class II molecules having critical roles in antigen presentation.
Of the remaining 22 genes, three genes have also been implicated in
several roles in immunological responses: MAP3K5 (ASK1) is
suggested to be related to the natural immunity to the stress
response. TFPI is suggested to function as a negative regulator of
cytokine expression. In addition, NR4A2 has been identified as a
candidate target molecule for the treatment of multiple sclerosis,
one of the autoimmune diseases of the central nervous system.
Since IL-2 and IFN-α treatment is expected to
enhance patient immunity with the subsequent attack by immune cells
on cancer cells, these two HLA class II molecules were considered
to likely play key roles in clinical response. Hence, we focused on
these two molecules measuring the expression levels quantitatively
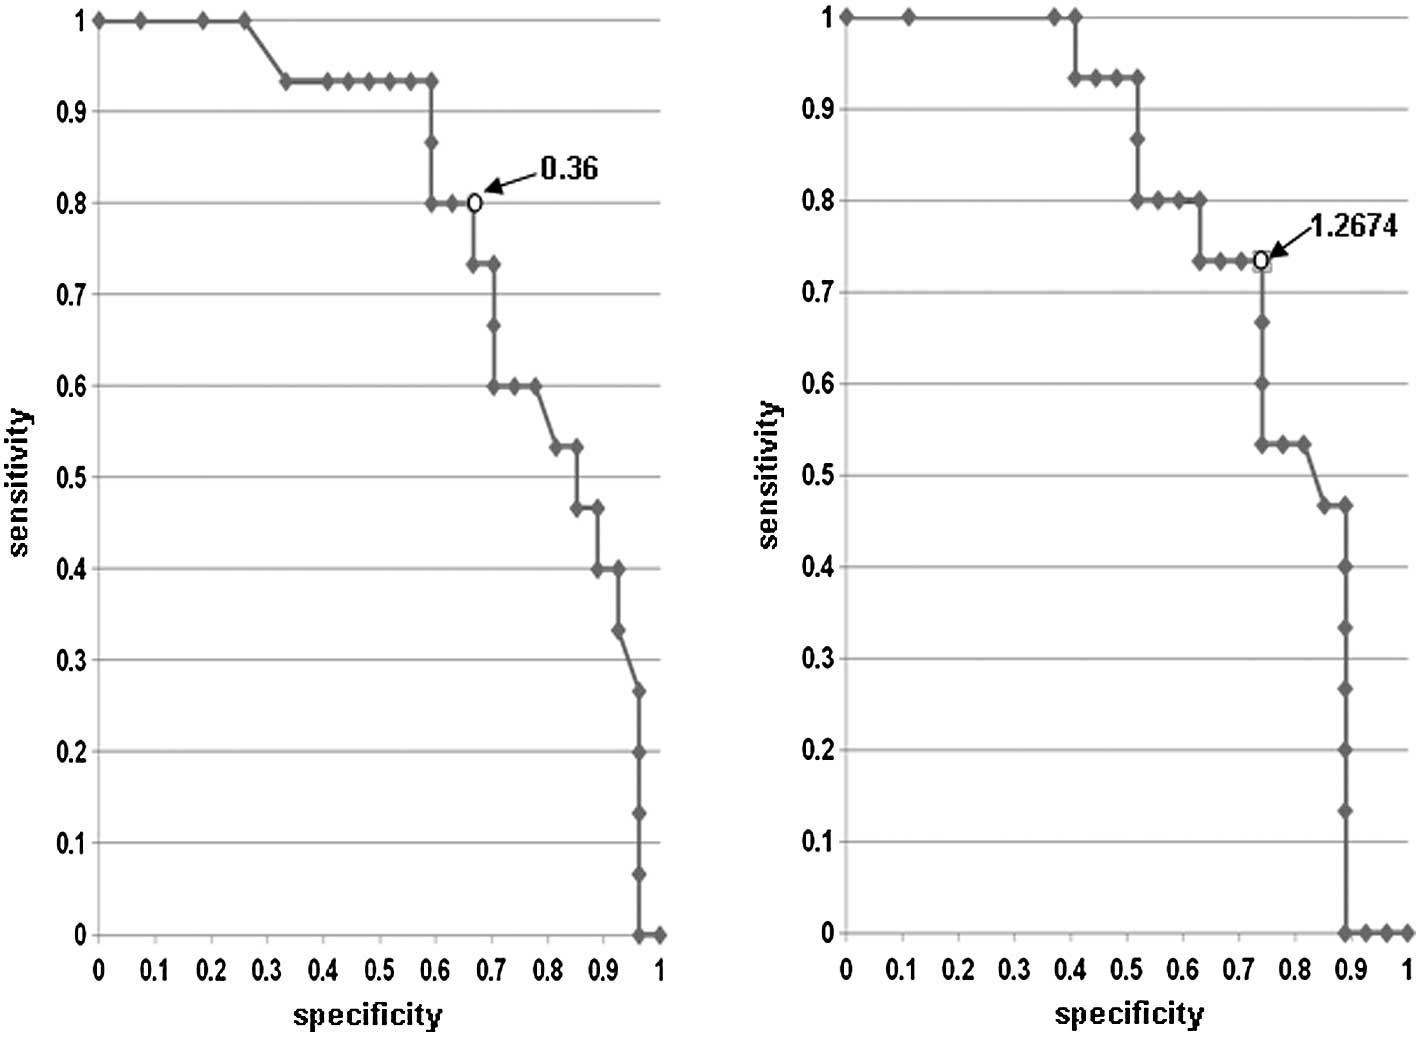
and comparing them to clinical response. We confirmed the
relativity of expression level and clinical response using the
receiver operating characteristic (ROC) curve, and the best cutoff
value for the expression level of each gene was determined
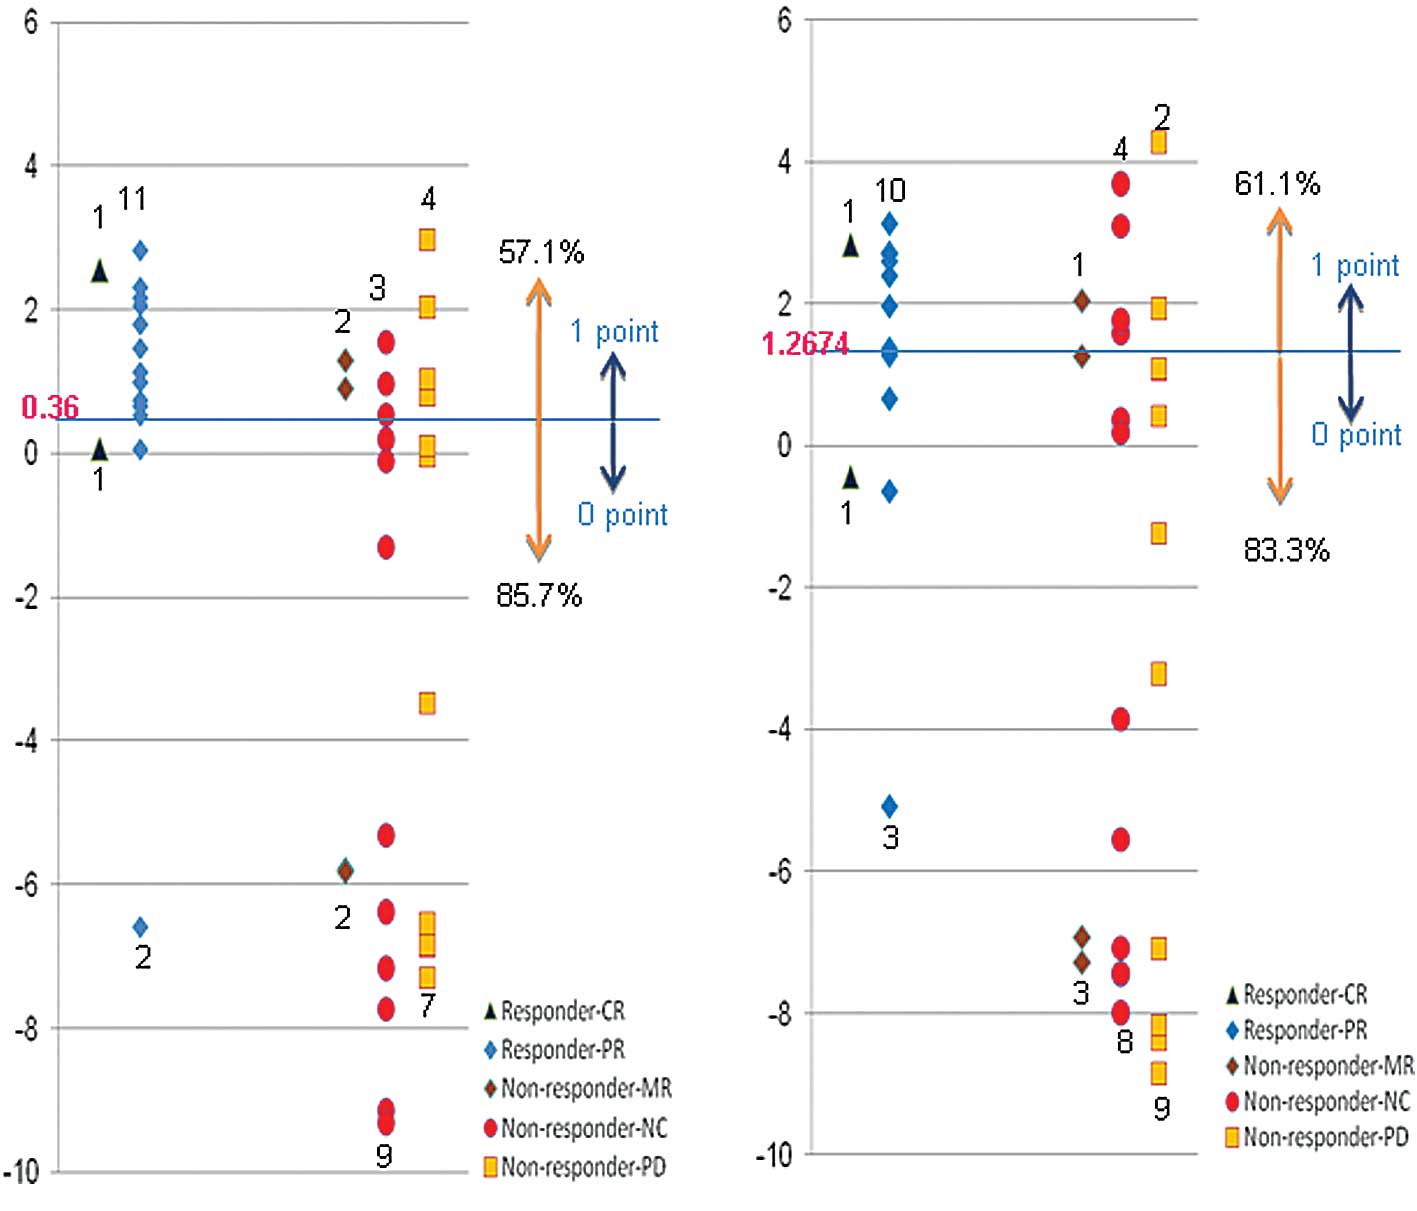
(Fig. 1). The results demonstrated
that IL-2 and IFN-α combination therapy showed poor response rates
of 85.7 and 83.3%, respectively, when the expression level of
HLA-DQA1 or HLA-DQB1 was lower than the cutoff value (Fig. 2). If patients having a lower
expression of these genes were excluded, than the rate of
effectiveness of this therapy is expected to be 57.1% in the case
of HLA-DQA1 and 61.1% in the case of HLA-DQB1, respectively.
However, since HLA-DQA1 and HLA-DQB1 are known to form a
heterodimer in the antigen presentation process, we hypothesized
that if either one was expressed lower than the cutoff level, the
tumor cells were unlikely to produce an HLA-class II molecule
sufficiently and were then unable to present the antigen(s)
effectively. Considering this hypothesis, if this treatment was
withheld to the patients whose tumors expressed a lower level of
either HLA-DQA1 or HLA-DQB1 than each cutoff value, than the
response rate could be expected to reach as high as 66.7% (Fig. 2, Table
IV).
| Table IV.Scoring-based expression pattern
1. |
Table IV.
Scoring-based expression pattern
1.
| Group | Score
|
|---|
| 0 | 1 | 2 |
|---|
| Non-responder
(n=27) (MR + PD + NC) | 16 | 6 | 5 |
| Responder (n=15)
(CR + PR) | 2 | 3 | 10 |
Discussion
To screen genes that may be associated with the
clinical response of advanced RCCs to IL-2 and IFN-α combination
therapy, oligo DNA microarray analysis was applied in combination
with LMM to obtain precise expression profile data of thousands of
genes simultaneously. The following random permutation test of
expression data identified 24 candidate genes that exhibited
significant differential expression between the ‘responder’ and
‘non-responder’ groups (Table
III). Since two immunologically important genes, HLA-DQA1 and
HLA-DQB1, were included in the set of 24 genes, the relative
expression levels were measured and then compared to clinical
responses by applying the ROC curve for these two genes (Figs. 1 and 2; Table
IV). As HLA-DQA1 and HLA-DQB1 are known to form a heterodimer,
we hypothesized that when either gene exhibited a low level of
expression in tumors, the antigen presentation from the tumor cells
for immunotherapy may be insufficient. When such patients were
excluded from this particular treatment, the rate of effectiveness
of this therapy was expected to improve to 65–70% (Table IV).
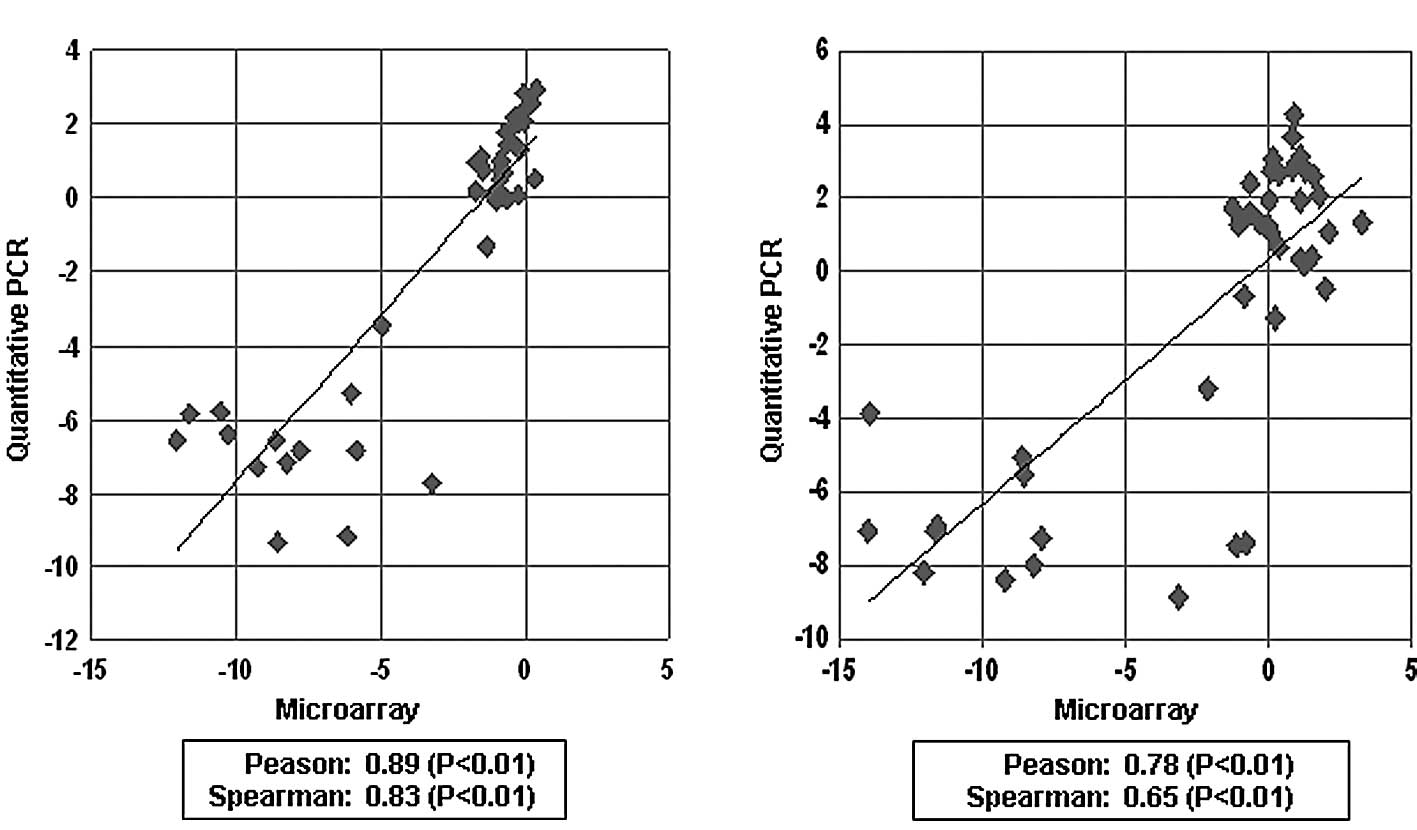
To further apply our prediction system in clinical
use, we attempted to establish the quantitative RT-PCR method. As a
result, the mRNA levels measured by the quantitative RT-PCR method
were found to be quite consistent to those obtained from the
microarray analysis with Pearson’s correlation coefficient and
Spearman’s rank-correlation coefficient of 0.89 and 0.83 for
HLA-DQA1, respectively, and 0.78 and 0.65 for HLA-DQB1,
respectively (Table V, Fig. 3).
| Table V.Scoring-based expression pattern
2. |
Table V.
Scoring-based expression pattern
2.
| Group | Score
|
|---|
| 0 | 1 | 2 |
|---|
| Non-responder
(n=27) (MR + PD + NC) | 16 | 6 | 5 |
| Responder (n=15)
(CR + PR) | 1 | 4 | 10 |
In conclusion, the expression levels of HLA-DQA1 and
HLA-DQB1 are reliable candidate markers for predicting the response
to IL-2 and IFN-α combination therapy for RCC and provide useful
information for the establishment of personalized treatment.
Acknowledgements
We thank Ms. Noriko Sudo for the data
and sample management, Ms. Noriko Ikawa for the preparation of the
samples by cryostat, Ms. Kyoko Kijima for the preparation of
materials and Drs Yataro Daigo, Koichi Matsuda, Ryuji Hamamoto, Ryo
Takata, Chikako Fukukawa, Yosuke Harada, Jae-Hyun Park, Masahiro
Ajiro, Suyoun Chung, Akira Togashi, Yasuo Mochiduki, Shinya Hayami,
Cho Hyuu-Soo, Goji Toyokawa, Masashi Takawa, Tadashi Kizaki,
Mitsuko Nakashima and Kazuma Kiyotani for the helpful discussion
and comments. This study was supported by Shionogi & Co.,
Ltd.
References
|
1.
|
Ferlay J, Bray F, Pisani P and Parkin DM:
GLOBOCAN 2002: Cancer Incidence, Mortality and Prevalence
Worldwide. IARC CancerBase No. 5, Version 2.0. IARC Press; Lyon:
2004
|
|
2.
|
Parkin DM, Bray F, Ferlay J and Pisani P:
Global cancer statistics, 2002. CA Cancer J Clin. 55:74–108. 2005.
View Article : Google Scholar
|
|
3.
|
Motzer RJ, Dror Michaelson M, Redman BG,
et al: Activity of SU11248, a multitargeted inhibitor of vascular
endothelial growth factor receptor and platelet-derived growth
factor receptor, in patients with metastatic renal cell carcinoma.
J Clin Oncol. 24:16–24. 2006. View Article : Google Scholar
|
|
4.
|
Motzer RJ, Rini BI, Bukowski RM, et al:
Sunitinib in patients with metastatic renal cell carcinoma. JAMA.
295:2516–2524. 2006. View Article : Google Scholar : PubMed/NCBI
|
|
5.
|
Motzer RJ, Hutson TE, Tomczak P, et al:
Sunitinib versus inter-feron alpha in metastatic renal-cell
carcinoma. N Engl J Med. 356:115–124. 2007. View Article : Google Scholar : PubMed/NCBI
|
|
6.
|
Escudier B, Eisen T, Stadler WM, et al:
Sorafenib in advanced clear-cell renal-cell carcinoma. N Engl J
Med. 356:125–134. 2007. View Article : Google Scholar : PubMed/NCBI
|
|
7.
|
Szcylik C, Demkow T, Staehler M, et al:
Randomized phase II trial of first-line treatment with sorafenib
versus interferon in patients with advanced renal cell carcinoma:
final results. J Clin Oncol. 25:50252007.
|
|
8.
|
Aso Y, Tazaki H, Umeda T and Marumo K: A
phase II study of S-6820 (recombinant interleukin-2) on renal cell
carcinoma (in Japanese). Biotherapy. 3:999–1007. 1989.
|
|
9.
|
Aso Y, Homma Y, Tazaki H, et al: A phase
II trial of S-6820 (recombinant interleukin-2) on renal cell
carcinoma refractory to interferon (in Japanese). Hinyokigeka.
8:75–86. 1995.
|
|
10.
|
Hayashi T, Miyagawa Y, Tsujimura A,
Nonomura N, Minami M and Okuyama A: A case of renal cell carcinoma
with multiple lung metastases refractory to interferon-α showing
complete remission by interleukin-2 monotherapy. Int J Urol.
13:805–808. 2006.PubMed/NCBI
|
|
11.
|
Kobayashi M, Ikeda H, Nukui A, et al:
Clinical outcome and prognostic survival factors in patients with
advanced renal cell carcinoma treated with very low-dose
interleukin-2, interferon-α and tegafur-uracil: a
single-institution experience. Int J Clin Oncol. 13:257–262.
2008.
|
|
12.
|
Wirth MP: Immunotherapy for metastatic
renal cell carcinoma. Urol Clin North Am. 20:283–295.
1993.PubMed/NCBI
|
|
13.
|
Horoszewicz JS and Murphy GP: An
assessment of the current use of human interferons in therapy of
urological cancers. J Urol. 142:1173–1180. 1989.PubMed/NCBI
|
|
14.
|
Bukowski RM: Natural history and therapy
of metastatic renal cell carcinoma: the role of interleukin-2.
Cancer. 80:1198–1220. 1997. View Article : Google Scholar : PubMed/NCBI
|
|
15.
|
Motzer RJ and Russo P: Systemic therapy
for renal cell carcinoma. J Urol. 163:408–417. 2000. View Article : Google Scholar : PubMed/NCBI
|
|
16.
|
Klapper JA, Downey SG, Smith FO, et al:
High-dose interleukin-2 for the treatment of metastatic renal cell
carcinoma: a retrospective analysis of response and survival in
patients treated in the Surgery Branch at the National Cancer
Institute between 1986 and 2006. Cancer. 113:293–301. 2008.
|
|
17.
|
Belldegrun AS, Klatte T, Shuch B, et al:
Cancer-specific survival outcomes among patients treated during the
cytokine era of kidney cancer (1989–2005): a benchmark for emerging
targeted cancer therapies. Cancer. 113:2457–2463. 2008.PubMed/NCBI
|
|
18.
|
Akaza H, Tsukamoto T, Onishi T, Miki T,
Kinouchi T and Naito S: A low-dose combination therapy of
interleukin-2 and interferon-α is effective for lung metastasis of
renal cell carcinoma: a multi-center open study. Int J Clin Oncol.
11:434–440. 2006.
|
|
19.
|
Akaza H, Kawai K, Tsukamoto T, et al:
Successful outcomes using combination therapy of interleukin-2 and
interferon-α for renal cell carcinoma patients with lung
metastasis. Jpn J Clin Oncol. 40:684–689. 2010.
|
|
20.
|
WHO Handbook for Reporting Results of
Cancer Treatment: WHO Offset Publication No. 48. World Health
Organization; Geneva: 1979
|
|
21.
|
Japanese Urological Association and
Japanese Society of Pathology: Response criteria for urological
cancer treatment. Jpn J Urol. 83:447–472. 1992.
|
|
22.
|
Golub TR, Slonim DK, Tamayo P, et al:
Molecular classification of cancer: class discovery and class
prediction by gene expression monitoring. Science. 286:531–537.
1999. View Article : Google Scholar : PubMed/NCBI
|