Introduction
Pancreatic cancer, the fourth most common cause of
cancer-related death, has a 5-year survival rate of 5% or less
(1). Surgical removal of the tumor
may improve survival, but survival remains poor even in optimally
resected patients. The optimum adjuvant therapy for resected cases
of pancreatic cancer is unclear. Surgical resection followed by
maintenance chemotherapy [using gemcitabine, as reported in the
CONKO-001 (2,3), or 5-FU with leucovorin (LV), also
known as folinic acid, as reported in the ESPAC-1 trial (4)] has been considered the most
beneficial strategy and is regarded as the standard of care for
improving survival in North America and Europe. Furthermore, the
ESPAC-3 (v2) trial showed that no significant survival differences
were observed between adjuvant 5-FU/LV and adjuvant gemcitabine
(5).
Chemotherapy is generally administered to patients
without knowledge of the genetic background of their disease, which
may affect drug efficacy. Considerable evidence has suggested that
the intratumor gene expression of drug-metabolizing enzymes or
angiogenic enzymes are useful predictors of treatment outcomes,
such as survival and the response to anticancer drugs. However, the
clinical significance of these biomarkers remains unclear.
Gemcitabine has a complex metabolic pathway, and
several mechanisms are thought to contribute to gemcitabine
cytotoxicity and/or chemoresistance. In a recent study, human
equilibrative nucleoside transporter-1 (hENT-1) was found to be the
major transporter of gemcitabine (6). In addition to being incorporated into
DNA, gemcitabine exerts its cytotoxicity by inhibiting
ribonucleotide reductase regulatory subunits M1 (RRM1) and M2
(RRM2) (7). Although the genes for
gemcitabine transport and metabolism are thought to be involved in
the mechanism of cellular resistance to gemcitabine, it is not
fully understood how gemcitabine influences its own transport and
metabolism during the process of acquired resistance.
S-1 is an oral fluoropyrimidine derivative
consisting of tegafur (FT) and two modulators,
5-chloro-2,4-dihydoxypyrimidine (CDHP) and potassium oxonate (Oxo),
in a molar ratio of 1:0.4:1. The antitumor effect is provided by
the 5-FU prodrug FT. CDHP competitively inhibits the 5-FU
degradative enzyme dihydropyrimidine dehydrogenase (DPD), resulting
in the retention of a prolonged concentration of 5-FU in the blood.
At present, S-1 is widely used to treat multiple types of cancer,
including gastric, colorectal, breast and head and neck cancers,
mainly in Japan. Very recently, the GEST study, a randomized phase
III study of gemcitabine plus S-1 vs. S-1 vs. gemcitabine in
unresectable advanced pancreatic cancer, demonstrated that S-1 was
confirmed to be non-inferior to gemcitabine with respect to overall
survival (8). As a predictive
marker for the treatment of S-1, certain reports indicate that the
status of thymidylate synthase (TS) gene expression is negatively
correlated with response to tumor and survival of patients with
gastric cancer (9,10).
In this study, we retrospectively examined
intratumoral mRNA levels of several genes, including several
potential prognostic factors (hENT-1, RRM1, RRM2, TS and DPD),
regulating factors of intracellular folate level [dihydrofolate
reductase (DHFR), folylpolyglutamate synthase (FPGS) and γ-glutamyl
hydrolase (GGH)] and growth factors [epidermal growth factor
receptor (EGFR) and vascular endothelial growth factor (VEGF)] in
patients with advanced pancreatic cancer who had received
gemcitabine or S-1 as an adjuvant chemotherapy.
Materials and methods
Patient population
We studied data on 79 cases of pancreatic cancer,
almost all of whom (96%) had T3 or T4 disease. All patients had
undergone curative surgical resection between June 2003 and June
2008 at the Department of Gastroenterology of our institution.
Sixty-three of the 79 patients had been treated with gemcitabine
(1,000 mg/m2/day on Days 1, 8 and 15 every 28 days),
while the remaining 16 patients had been treated with S-1 (twice
daily for 28 days, followed by a 2-week period of no treatment
every 6 weeks). The dose of S-1 was based on each patient's body
surface area (BSA) as follows: BSA <1.25 m2, 40 mg;
BSA 1.25–1.5 m2, 50 mg; and BSA >1.5 m2,
60 mg. None of the patients had received pre-operative neoadjuvant
chemotherapy, while 38 patients (48.1%) had received second-line
chemotherapy after relapse. All patients were Japanese; written
informed consent was obtained from each patient according to
institutional regulations.
Microdissection
Formalin-fixed, paraffin-embedded (FFPE) tumor
specimens were cut into serial sections with a thickness of 10
μm. For the pathological diagnosis, one slide was stained
with H&E and evaluated by a pathologist. Other sections were
stained using Nuclear Fast Red (American MasterTech Scientific
Inc., Lodi, CA, USA) to facilitate the visualization of the
histological features. All of the tumor samples were then subjected
to laser-captured microdissection (P.A.L.M. Microlaser Technologies
AG, Munich, Germany) to ensure that primarily the tumor cells were
dissected.
RNA isolation and cDNA synthesis
RNA was extracted and cDNA was prepared from each of
the samples as described previously (11).
Reverse transcription-PCR
The quantification of 10 genes plus an internal
reference gene (β-actin) was performed using a fluorescence-based
real-time detection method [ABI PRISM 7900 Sequence Detection
System (TaqMan); Applied Biosystems, Foster City, CA, USA], as
described previously (12). The
primers and probe sequences that were used are listed in Table I. The PCR reaction mixture
consisted of 1,200 nM of each primer, 200 nM of probe, 0.4 units of
AmpliTaq Gold Polymerase, 200 nM each of dATP, dCTP, dGTP and dTTP,
3.5 mM of MgCl2 and 1X TaqMan buffer A containing a
reference dye, for a final volume of 20 μl (all reagents
from Applied Biosystems). The cycling conditions were 50°C for 2
min and 95°C for 10 min, followed by 46 cycles at 95°C for 15 sec
and 60°C for 1 min. The gene expression values (relative mRNA
levels) were expressed as ratios (differences between the Ct
values) between the gene of interest (target gene) and the internal
reference gene (β-actin), enabling the data to be normalized
according to the amount of RNA isolated from each specimen.
 | Table I.Primer and probe sequences for
quantitative RT-PCR. |
Table I.
Primer and probe sequences for
quantitative RT-PCR.
| Gene | Gene symbol
(HUGO) | GenBank no. | Forward primer
(5′-3′) | Reverse primer
(3′-5′) | TaqMan probe
(5′-3′) |
|---|
| TS | TYMS | NM_001071.2 |
GCCTCGGTGTGCCTTTCA |
CCCGTGATGTGCGCAAT |
TCGCCAGCTACGCCCTGCTCA |
| DPD | DPYD | NM_000110.3 |
AGGACGCAAGGAGGGTTTG |
GTCCGCCGAGTCCTTACTGA |
CAGTGCCTACAGTCTCGAGTCTGCCAGTG |
| hENT1 | SLC29A1 | NM_004955.2 |
CCAAGTTGGACCTCATTAGCA |
TGGGCTGAGAGTTGGAGACT |
TGCCTGCTCTTGGCTCCTCTCC |
| RRM1 | RRM1 | NM_111033.3 |
ACTAAGCACCCTGACTATGCTATCC |
CTTCCATCACATCACTGAACACTTT |
CAGCCAGGATCGCTGTCTCTAACTTGCA |
| RRM2 | RRM2 | NM_001034.2 | ACCGCGAGGAGGATCT | TCAGCAGCGGCTCATC |
TTTCGGCTCCGTGGGCTCCT |
| DHFR | DHFR | NM_000791.3 |
GTCCTCCCGCTGCTGTCA |
GCCGATGCCCATGTTCTG |
TTCGCTAAACTGCATCGTCGCTGTGTC |
| FPGS | FPGS | M98045 |
GGCTGGAGGAGACCAAGGAT |
CATGAGTGTCAGGAAGCGGA |
CAGCTGTGTCTCCATGCCCCCCTAC |
| GGH | GGH | NM_003878.2 |
GTGGCAATGCCGCTGAA |
CAACTCAGTAGGAAAATTCTGGAACA |
TTCACTGGAGGTCAATTGCACAGCAGA |
| EGFR | EGFR | NM_005228.3 |
TGCGTCTCTTGCCGGAAT |
GGCTCACCCTCCAGAAGGTT |
ACGCATTCCCTGCCTCGGCTG |
| VEGF | VEGFA | NM_003376.4 |
AGTGGTCCCAGGCTGCAC |
TCCATGAACTTCACCACTTCGT |
TGATTCTGCCCTCCTCCTTCTGCCAT |
| β-actin | ACTB | NM_001101.3 |
GAGCGCGGCTACAGCTT |
TCCTTAATGTCACGCACGATTT |
ACCACCACGGCCGAGCGG |
Statistical analysis
Overall survival (OS) was calculated as the period
from the surgical resection until death. To assess the associations
of the gene expression levels with OS, the expression level of each
gene was categorized into high and low values based on median
values. The clinical laboratory data were treated as continuous
variables. The hazard ratio (HR) and 95% confidence interval (CI)
were estimated using the Cox proportional hazards model to provide
a quantitative summary of the gene expression data.
All reported P-values were two-sided, and the level
of statistical significance was set at P<0.05. The variables
that were included in the multivariate analysis were selected using
the stepwise method model, with a significance level of <0.05
for entering into or remaining in the model. All analyses were
performed using the SAS statistical package, version 9.1.3 (SAS
Institute Inc., Cary, NC, USA).
Results
Patient characteristics
Quantifiable mRNA levels were obtained in 57 of the
79 patients (72.2%). The demographic characteristics of the patient
population in which the mRNA levels could be quantified are shown
in Table II. All of the patients
had received adjuvant chemotherapy using either gemcitabine (73.3%)
or S-1 (26.7%) after surgical resection, and no significant
difference was identified in the patient characteristics between
these adjuvant chemotherapies (data not shown).
| Table II.Patient characteristics. |
Table II.
Patient characteristics.
| Characteristic | n (%) |
|---|
| mRNA analysis
population | 57 (100) |
| Gender | |
| Male | 39 (68) |
| Female | 18 (32) |
| Age (years) | |
| Median | 65 |
| Range | 39–80 |
| <65 | 25 (44) |
| ≥65 | 32 (56) |
| UICC T | |
| T1/2 | 2 (4) |
| T3/4 | 55 (96) |
| UICC N | |
| N(−) | 15 (26) |
| N(+) | 42 (74) |
| UICC M | |
| M(−) | 55 (96) |
| M(+) | 2 (4) |
| UICC stage | |
| I–II | 55 (96) |
| III–IV | 2 (4) |
| Histology | |
| Poor | 4 (7) |
| Moderate | 44 (77) |
| Well | 3 (5) |
| Other | 6 (11) |
| Adjuvant
chemotherapy regimen | |
| Gemcitabine | 42 (74) |
| S-1 | 15 (26) |
mRNA and cut-off rates of gene expression
levels in quantifiable cases
When the Ct value for a target gene was >39 and
that for β-actin was <30, the mRNA expression level was
designated as 0.00 (Table III).
The gene expression cut-off values for the OS analyses were defined
using the median value, and the number of measurable samples for
each single gene is shown in Table
IV.
| Table III.Gene expression levels in the mRNA
analysis population (57 patients). |
Table III.
Gene expression levels in the mRNA
analysis population (57 patients).
| Gene | mRNA expression
levels relative to β-actin (x10−3)
| No. of patients (%)
below measurable limitsa |
|---|
| Median | Range |
|---|
| ENT1 | 4.64 | 0.00–17.97 | 3 (5.26) |
| RRM1 | 0.00 | 0.00–2.78 | 35 (61.40) |
| RRM2 | 1.34 | 0.00–12.72 | 20 (35.09) |
| TS | 1.34 | 0.00–5.54 | 3 (5.26) |
| DPD | 0.53 | 0.00–2.61 | 7 (12.28) |
| DHFR | 1.14 | 0.00–8.44 | 12 (21.05) |
| FPGS | 1.21 | 0.00–5.17 | 0 (0.00) |
| GGH | 0.00 | 0.00–19.34 | 35 (61.40) |
| EGFR | 1.52 | 0.00–6.28 | 5 (8.77) |
| VEGF | 6.35 | 0.00–63.19 | 1 (1.75) |
| Table IV.Univariate and multivariate Cox
regression analysis of overall survival in patients with adjuvant
chemotherapy. |
Table IV.
Univariate and multivariate Cox
regression analysis of overall survival in patients with adjuvant
chemotherapy.
| Factor | Cut-off point | No. of
patients | Median time
(months) | Univariate
analysis | Multivariate
analysis |
|---|
|
|---|
| Hazard ratio (95%
CI) | P-value
log-rank | P-value
Wilcoxon | Hazard ratio (95%
CI) | P-value |
|---|
| Gender | | | | | | | | |
| Male | | 39 | 24.1 | 1.00 | 0.667 | 0.865 | - | |
| Female | | 18 | 25.1 | 1.19
(0.51–2.63) | | | | |
| Age (years) | | | | | | | | |
| <65 | | 25 | 30.6 | 1.00 | 0.052 | 0.045a | - | |
| ≥65 | | 32 | 24.1 | 2.16
(0.99–4.96) | | | | |
| UICC pTNM | | | | | | | | |
| pT | 1/2 | 2 | Not reached | - | 0.653 | 0.656 | - | |
| 3/4 | 55 | 25.1 | - | | | | |
| pN | − | 15 | 30.6 | 1.00 | 0.137 | 0.066 | - | |
| + | 42 | 23.3 | 2.22
(0.84–7.65) | | | | |
| pM | − | 55 | 25.1 | 1.00 | 0.169 | 0.447 | - | |
| + | 2 | 18.4 | 2.70
(0.43–9.52) | | | | |
| I–II | | 55 | 25.1 | - | 0.169 | 0.447 | - | |
| III–IV | | 2 | 18.4 | - | | | | |
| Histology | | | | | | | | |
| Poor | | 4 | 23.8 | 1.00 | 0.689 | 0.853 | - | |
| Moderate | | 44 | 24.1 | 0.78
(0.23–4.87) | 0.798 | 0.528 | | |
| Well | | 3 | 25.4 | 0.68
(0.03–7.20) | 0.910 | 0.531 | | |
| Other | | 6 | Not reached | 0.41
(0.02–4.29) | 0.512 | 0.807 | | |
| Genea | | | | | | | | |
| ENT1 | <4.64 | 28 | 25.1 | 1.00 | 0.148 | 0.322 | - | |
| ≥4.64 | 27 | 25.1 | 1.79
(0.80–4.04) | | | | |
| RRM1 | − | 35 | 25.4 | 1.00 | 0.264 | 0.211 | - | |
| + | 22 | 23.3 | 1.62
(0.65–3.70) | | | | |
| RRM2 | <1.34 | 27 | 25.1 | 1.00 | 0.586 | 0.823 | - | |
| ≥1.34 | 26 | 23.3 | 1.24
(0.58–2.70) | | | | |
| TS | <1.34 | 26 | 30.6 | 1.00 | 0.431 | 0.831 | - | |
| ≥1.34 | 26 | 24.1 | 1.37
(0.63–3.04) | | | | |
| DPD | <0.53 | 28 | 27.2 | 1.00 | 0.166 | 0.333 | 5.55
(1.27–24.05) | 0.022a |
| ≥0.53 | 28 | 23.3 | 1.77
(0.77–4.04) | | | | |
| DHFR | <1.14 | 18 | 27.3 | 1.00 | 0.203 | 0.271 | - | |
| ≥1.14 | 18 | 21.8 | 1.83
(0.70–4.80) | | | | |
| FPGS | <1.21 | 26 | 16.9 | 1.00 | 0.129 | 0.023a | - | |
| ≥1.21 | 26 | 25.4 | 0.50
(0.19–1.20) | | | | |
| GGH | − | 35 | 25.4 | 1.00 | 0.085 | 0.033a | 3.77
(1.04–13.79) | 0.043a |
| + | 15 | 15.4 | 2.23
(0.83–5.54) | | | | |
| EGFR | <1.52 | 25 | 23.3 | 1.00 | 0.665 | 0.497 | - | |
| ≥1.52 | 26 | 24.1 | 0.84
(0.36–1.87) | | | | |
| VEGF | <6.35 | 28 | 27.2 | 1.00 | 0.226 | 0.424 | - | |
| ≥6.35 | 28 | 23.3 | 1.63
(0.72–3.66) | | | | |
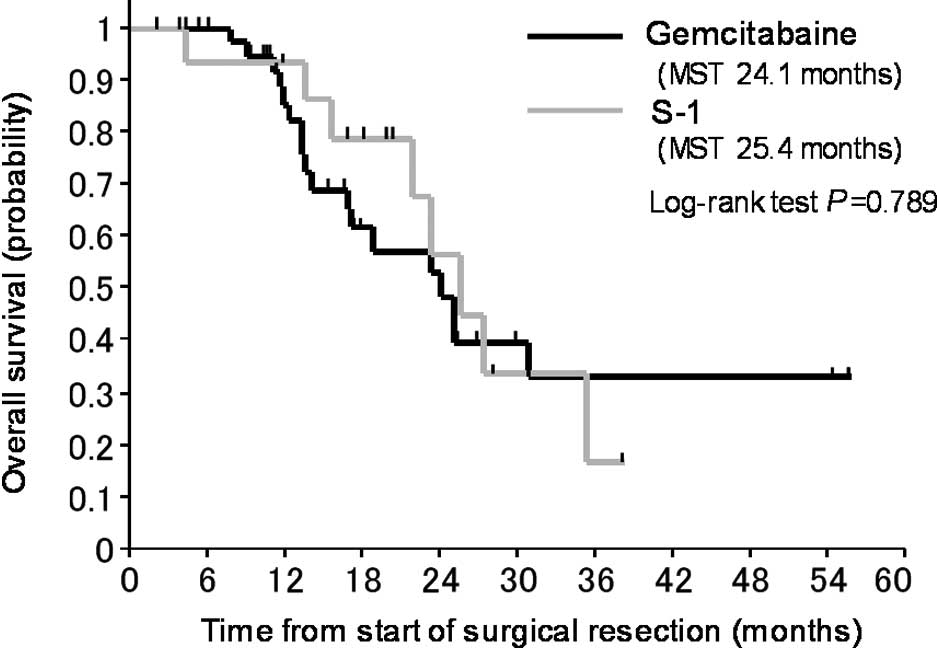
Clinical outcomes of treatment with
either gemcitabine or S-1
The OS curves for patients who received gemcitabine
compared to those who received S-1 are shown in Fig. 1. The OS of patients treated with
S-1 as an adjuvant chemotherapy was not significantly different
from that of patients who received gemcitabine.
Correlation between gene expression
levels and overall survival
In subsequent analyses, we pooled the patients who
received gemcitabine with those who received S-1. In univariate
analyses, an age of <65 years, a high gene expression level of
FPGS and a low gene expression level of GGH significantly
correlated with a favorable prognosis in all 57 patients (Table IV, Fig. 2B and C). The expression levels of
the other genes (TS, DHFR, hENT-1, RRM1, RRM2, EGFR and VEGF) did
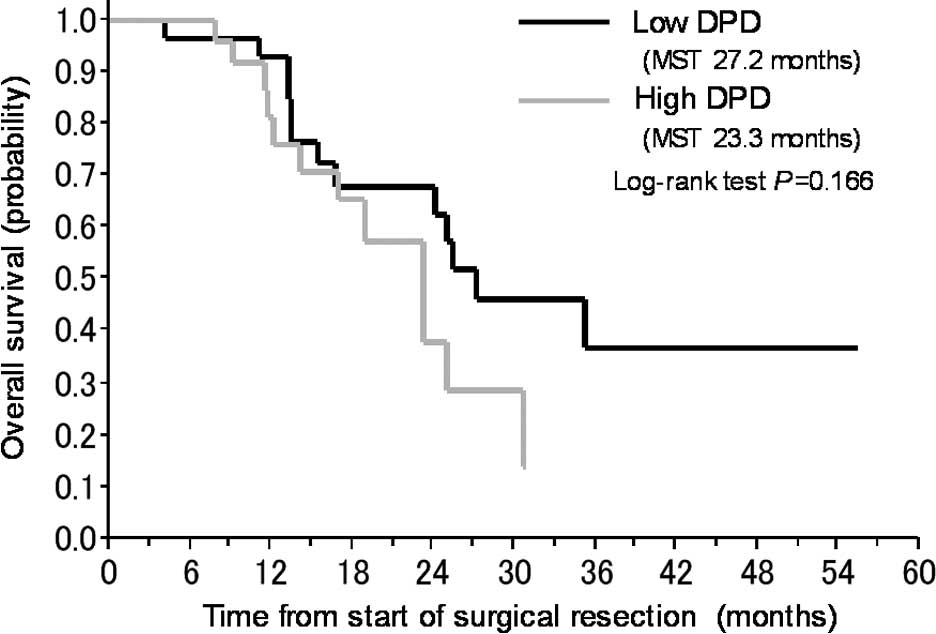
not significantly correlate with the prognosis. In a multivariate
analysis including all of the significant factors obtained in the
univariate analyses, low gene expression levels of DPD and GGH were
identified as predictors of a favorable prognosis (Table IV, Fig. 2A and B).
We also analyzed OS separately among the patients
who received gemcitabine or S-1. Among the patients who received
gemcitabine, a low gene expression level of hENT1 significantly
correlated with a longer OS period compared to those who had a high
expression level of hENT1 (Table
V). A low gene expression level of GGH significantly correlated
with a longer OS period among patients who received S-1, compared
to those who had a high expression level of GGH (Table V).
| Table V.Univariate Cox regression analysis of
the overall survival in patients who received adjuvant chemotherapy
(gemcitabine or S-1). |
Table V.
Univariate Cox regression analysis of
the overall survival in patients who received adjuvant chemotherapy
(gemcitabine or S-1).
| Factor | Cut-off point | Gemcitabine | S-1 |
|---|
|
|---|
| No. of
patients | Median time
(months) | P-value
log-rank | No. of
patients | Median time
(months) | P-value
log-rank |
|---|
| ENT1 | <4.64 | 24 | 25.1 |
0.044a | 4 | 25.2 | 0.944 |
| ≥4.64 | 17 | 16.7 | | 10 | 35.1 | |
| RRM1 | − | 27 | 24.1 | 0.454 | 8 | 27.2 | 0.126 |
| + | 15 | 14.0 | | 7 | 23.3 | |
| RRM2 | <1.34 | 22 | 24.1 | 0.917 | 5 | 35.1 | 0.172 |
| ≥1.34 | 17 | 18.8 | | 9 | 23.3 | |
| TS | <1.34 | 19 | 30.60 | 0.397 | 7 | 23.3 | 0.807 |
| ≥1.34 | 20 | 23.30 | | 6 | 25.4 | |
| DPD | <0.53 | 17 | 25.1 | 0.193 | 11 | 27.2 | 0.908 |
| ≥0.53 | 25 | 18.8 | | 3 | 23.3 | |
| DHFR | <1.14 | 13 | Not reached | 0.329 | 5 | 27.2 | 0.141 |
| ≥1.14 | 15 | 18.8 | | 3 | 21.8 | |
| FPGS | <1.21 | 18 | 16.8 | 0.165 | 8 | 23.3 | 0.358 |
| ≥1.21 | 21 | 25.1 | | 5 | 25.4 | |
| GGH | − | 24 | 25.1 | 0.592 | 11 | 27.2 |
0.001a |
| + | 11 | 16.9 | | 4 | 14.4 | |
| EGFR | <1.52 | 19 | 23.3 | 0.716 | 6 | 23.6 | 0.763 |
| ≥1.52 | 20 | 24.1 | | 5 | 35.1 | |
| VEGF | <6.35 | 19 | Not reached | 0.150 | 9 | 27.2 | 0.737 |
| ≥6.35 | 22 | 18.8 | | 6 | 22.6 | |
Discussion
In this study, we examined whether the expression of
genes in FFPE tumor specimens obtained from primary pancreatic
cancer was related to prognosis and whether these expression levels
could be used to determine whether gemcitabine or S-1 chemotherapy
would be optimal in individual patients. We explored biomarkers
that strongly correlated with the clinical outcomes of all of the
patients and found that a high gene expression level of FPGS and
low gene expression level of GGH correlated with a favorable OS in
univariate analyses; furthermore, low expression level of DPD and
GGH significantly correlated with a favorable outcome in
multivariate analyses (Table
IV).
To the best of our knowledge, this is the first
report of single genes, DPD and GGH, correlating with OS in
patients with pancreatic cancer. Miyake et al reported that
7 patients with pancreatic cancer and a high TP/DPD ratio showed a
significantly poorer outcome compared to 14 patients with a low
TP/DPD ratio (13). However, their
report analyzed a small patient population (21 patients) and did
not show a correlation between DPD alone and prognosis.
Our previous study suggested that the median DPD
mRNA level in 33 patients with recurrent pancreatic cancer who had
undergone resection was significantly lower among responders than
among non-responders (P=0.02; median level 1.25 vs. 2.20),
determining response to chemotherapy by measuring the serum CA19-9
tumor marker levels (11). This
study indicated that the gene expression level of DPD in patients
with pancreatic cancer who received adjuvant chemotherapy after
undergoing a curative resection correlated with the patient
outcome. Consequently, our studies support a correlation between
the gene expression level of DPD and tumor response to chemotherapy
or a survival advantage in patients with pancreatic cancer.
We previously reported that the intratumor
expression level of DPD was significantly higher in patients with
pancreatic cancer than in those with gastric or colorectal cancer
[median level, 1.38 (n=33), 0.82 (n=20) and 0.44 (n=44),
respectively] (11). Furthermore,
Mori et al reported that the median expression level of DPD
in patients with pancreatic cancer was 1.5–3 times higher than that
in patients with gastric or colorectal cancer by an ELISA assay
(14). Thus, the expression level
of DPD in pancreatic cancer is higher than in gastrointestinal
cancer. Several reports have shown an inverse correlation between
the expression level of DPD and 5-FU sensitivity in patients with
gastrointestinal cancer (15,16).
Basically, Takechi et al demonstrated that CDHP, included in
S-1, inhibits 5-FU degradation through the inhibition of intratumor
DPD activity and enhances 5-FU cytotoxicity in pancreatic cancer
cells (17). Collectively, these
results suggest that treatment with S-1 may be useful for patients
with pancreatic cancer, which has relatively high DPD.
A meta-analysis to estimate the effectiveness of
adjuvant 5-FU/LV vs. resection alone for patients with pancreatic
cancer showed that adjuvant chemotherapy using 5-FU/LV was more
effective than resection alone (18). In addition, Larsson et al
reported that an increased intake of folate may be associated with
a reduced risk of pancreatic cancer (19). These results suggest a correlation
between prognosis of patients with pancreatic cancer and folate
metabolism in pancreatic tumors.
In this study, a low expression level of GGH was
correlated with a longer OS period, compared to a high expression
level of GGH, in all patients as well as in the subgroup of
patients treated with S-1 (Tables
IV and V). Collectively, the
results suggest that the gene expression of DPD and folate
metabolism may also affect the prognosis of patients with
pancreatic cancer, and the gene expression of GGH may be useful for
deciding whether gemcitabine or S-1 should be administered as an
adjuvant chemotherapy to patients with advanced pancreatic
cancer.
In colorectal cancer cells, intracellular folate
levels were regulated by the expression of GGH and FPGS, and these
genes may be responsible for the correlation between combined 5-FU
and LV treatment and the antitumor effect (20). In colorectal tumor xenografts in
nude mice fed a low-folate diet, the formation of much higher
levels of a ternary complex with TS and 5-fluoro-2′-deoxyuridine
5′-monophosphate (FdUMP) derived from 5-FU was observed after LV
treatment combined with S-1, leading to a prolonged inhibition of
TS activity (21). These reports
suggest that patients with activated folate metabolism in
pancreatic tumor are likely to have a favorable outcome, and
activated folate metabolism in tumor may be responsible for the
improvement in therapeutic efficacy enabled by the combination of
5-FU and LV for the treatment of pancreatic cancer. Building on
these data, we are now carrying out basic research on the
effectiveness of LV used in combination with 5-FU and S-1 against
pancreatic cancer.
In this study, the mRNA levels in the FFPE tumor
tissue samples were quantifiable only in 57 of 79 patients (72.2%),
whereas quantifiable mRNA levels in 88% of non-small cell lung
cancer biopsy specimens have been previously reported (22). These results indicate that the RNA
extracted from tumor tissue in the present study was relatively
insufficient in quantity. Since FFPE samples of the pancreatic
tumor tissue contained many interstitial normal cells, it was
considered that the amount of tumor volume was comparatively small.
The optimization and standardization of procedures for sampling and
fixation of pancreatic tumor tissue are required in future
studies.
In conclusion, our study provided evidence that the
expression of DPD and GGH is correlated with the outcomes of
patients with pancreatic cancer, suggesting that treatment with S-1
or S-1 combined with LV may be useful as adjuvant chemotherapy in
patients with pancreatic cancer. However, this exploratory study
was conducted retrospectively in a relatively small patient cohort.
As basic research on the molecular markers identified in the
present study advances in the future, the results obtained here
should be validated in another large and well-defined population of
patients treated with gemcitabine, S-1 or 5-FU combined with LV, as
well as in prospective studies.
Acknowledgements
Statistical advice and fruitful
support was provided by Dr Satoru Shimizu (Tokyo Women's Medial
University, Tokyo, Japan). The authors thank Professor J. Patrick
Barron of the Department of International Medical Communications of
Tokyo Medical University (Tokyo, Japan), a remunerated consultant
of Taiho Pharmaceutical, for his review of this report. They also
thank Dr Masakazu Fukushima for the helpful advice and the many
discussions. This study was funded by the Taiho Pharmaceutical Co.,
Ltd. (Tokyo, Japan) and the Nakayama Cancer Research Institute
(Tokyo, Japan).
Abbreviations:
|
LV,
|
leucovorin;
|
|
TS,
|
thymidylate synthase;
|
|
DPD,
|
dihydropyrimidine dehydrogenase;
|
|
DHFR,
|
dihydrofolate reductase;
|
|
FPGS,
|
folylpolyglutamate synthase;
|
|
GGH,
|
γ-glutamyl hydrolase;
|
|
hENT-1,
|
human equilibrative nucleoside
transporter-1;
|
|
RRM1,
|
ribonucleotide reductase regulatory
subunit M1;
|
|
RRM2,
|
ribonucleotide reductase regulatory
subunit M2;
|
|
EGFR,
|
epidermal growth factor receptor;
|
|
VEGF,
|
vascular endothelial growth
factor;
|
|
FFPE,
|
formalin-fixed, paraffin embedded;
|
References
|
1
|
Jemal A, Siegel R, Ward E, et al: Cancer
statistics. CA Cancer J Clin. 56:106–130. 2006.
|
|
2
|
Oettle H and Neuhaus P: Adjuvant therapy
in pancreatic cancer: a critical appraisal. Drugs. 67:2293–2310.
2007. View Article : Google Scholar : PubMed/NCBI
|
|
3
|
Neoptolemos JP, Dunn JA, Stocken DD, et
al: Adjuvant chemoradiotherapy and chemotherapy in resectable
pancreatic cancer: a randomised controlled trial. Lancet.
358:1576–1585. 2001. View Article : Google Scholar : PubMed/NCBI
|
|
4
|
Neoptolemos JP, Stocken DD, Friess H, et
al: A randomized trial of chemoradiotherapy and chemotherapy after
resection of pancreatic cancer. N Engl J Med. 350:1200–1210. 2004.
View Article : Google Scholar : PubMed/NCBI
|
|
5
|
Neoptolemos J, Büchler M, Stocken DD, et
al: ESPAC-3(v2): a multicenter, international, open-label,
randomized, controlled phase III trial of adjuvant
5-fluorouracil/folinic acid (5-FU/FA) versus gemcitabine (GEM) in
patients with resected pancreatic ductal adenocarcinoma. J Clin
Oncol. 27(suppl s18): abs LBA4505,. 2009.(ASCO Annual Meeting).
|
|
6
|
Andersson R, Aho U, Nilsson BI, et al:
Gemcitabine chemoresistance in pancreatic cancer: molecular
mechanisms and potential solutions. Scand J Gastroenterol.
44:782–786. 2009. View Article : Google Scholar : PubMed/NCBI
|
|
7
|
Giovannetti E, del Tacca M, Mey V, et al:
Transcription analysis of human equilibrative nucleoside
transporter-1 predicts survival in pancreas cancer patients treated
with gemcitabine. Cancer Res. 66:3928–3935. 2006. View Article : Google Scholar
|
|
8
|
Ioka T, Ohkawa S, Yanagimoto H, et al:
Randomized phase III study of gemcitabine plus S-1 (GS) versus S-1
versus gemcitabine (GEM) in unresectable advanced pancreatic cancer
(PC) in Japan and Taiwan: GEST study. J Clin Oncol. 29:2011.(ASCO
Annual Meeting).
|
|
9
|
Ichikawa W, Takahashi T, Suto K, et al:
Thymidylate synthase predictive power is overcome by irinotecan
combination therapy with S-1 for gastric cancer. Br J Cancer.
91:1245–1250. 2004. View Article : Google Scholar : PubMed/NCBI
|
|
10
|
Ichikawa W and Sasaki Y: Challenges in
predicting the clinical outcome in S-1-based chemotherapy for
gastric cancer patients. Int J Clin Oncol. 13:206–211. 2008.
View Article : Google Scholar : PubMed/NCBI
|
|
11
|
Kuramochi H, Hayashi K, Uchida K, et al:
High intratumoral dihydropyrimidine dehydrogenase mRNA levels in
pancreatic cancer associated with a high rate of response to S-1.
Cancer Chemother Pharmacol. 63:85–89. 2008. View Article : Google Scholar
|
|
12
|
Heid CA, Stevens J, Livak KJ and Williams
PM: Real time quantitative PCR. Genome Res. 6:986–994. 1996.
View Article : Google Scholar : PubMed/NCBI
|
|
13
|
Miyake K, Imura S, Yoshizumi T, Ikemoto T,
Morine Y and Shimada M: Role of thymidine phosphorylase and orotate
phosphoribosyltransferase mRNA expression and its ratio to
dihydropyrimidine dehydrogenase in the prognosis and
clinicopathological features of patients with pancreatic cancer.
Int J Clin Oncol. 12:111–119. 2007. View Article : Google Scholar
|
|
14
|
Mori K, Hasegawa M, Nishida M, et al:
Expression levels of thymidine phosphorylase and dihydropyrimidine
dehydrogenase in various human tumor tissues. Int J Oncol.
17:33–38. 2000.PubMed/NCBI
|
|
15
|
Ichikawa W: Prediction of clinical outcome
of fluoropyrimidine-based chemotherapy for gastric cancer patients,
in terms of the 5-fluorouracil metabolic pathway. Gastric Cancer.
9:145–155. 2006. View Article : Google Scholar : PubMed/NCBI
|
|
16
|
Salonga D, Danenberg KD, Johnson M, et al:
Colorectal tumors responding to 5-fluorouracil have low gene
expression levels of dihydropyrimidine dehydrogenase, thymidylate
synthase, and thymidine phosphorylase. Clin Cancer Res.
6:1322–1327. 2000.
|
|
17
|
Takechi T, Fujioka A, Matsushima E and
Fukushima M: Enhancement of the antitumour activity of
5-fluorouracil (5-FU) by inhibiting dihydropyrimidine dehydrogenase
activity (DPD) using 5-chloro-2,4-dihydroxypyridine (CDHP) in human
tumour cells. Eur J Cancer. 38:1271–1277. 2002. View Article : Google Scholar
|
|
18
|
Neoptolemos JP, Stocken DD, Tudur Smith C,
et al: Adjuvant 5-fluorouracil and folinic acid vs observation for
pancreatic cancer: composite data from the ESPAC-1 and -3(v1)
trials. Br J Cancer. 100:246–250. 2009. View Article : Google Scholar : PubMed/NCBI
|
|
19
|
Larsson SC, Hakansson N, Giovannucci E and
Wolk A: Folate intake and pancreatic cancer incidence: a
prospective study of Swedish women and men. J Natl Cancer Inst.
98:407–413. 2006. View Article : Google Scholar : PubMed/NCBI
|
|
20
|
Sakamoto E, Tsukioka S, Oie S, et al:
Folylpolyglutamate synthase and gamma-glutamyl hydrolase regulate
leucovorin-enhanced 5-fluorouracil anticancer activity. Biochem
Biophys Res Commun. 365:801–807. 2008. View Article : Google Scholar
|
|
21
|
Tsukioka S, Uchida J, Tsujimoto H, et al:
Oral fluoropyrimidine S-1 combined with leucovorin is a promising
therapy for colorectal cancer: Evidence from a xenograft model of
folate-depleted mice. Mol Med Reports. 2:393–398. 2009.PubMed/NCBI
|
|
22
|
Cobo M, Isla D, Massuti B, et al:
Customizing cisplatin based on quantitative excision repair
cross-complementing 1 mRNA expression: a phase III trial in
non-small-cell lung cancer. J Clin Oncol. 25:2747–2754. 2007.
View Article : Google Scholar : PubMed/NCBI
|