Introduction
The cytochrome P4503A (CYP3A) subfamily of enzymes
are steroid 6β-hydroxylases which convert cortisol (CS) to
6β-hydroxycortisol (6β-OH-CS) and corticosterone to
6β-hydroxycorticosterone (1–3).
Early studies on this subfamily of CYPs focused on the CYP3A4
isoform since it appeared to be predominantly expressed in human
liver. However, in 2001 Kuehl et al(4) reported the expression of CYP3A5 in
the livers of 50% of African-Americans but only one-third of
Caucasians. It is now clear that CYP3A5 may also contribute
significantly, although variably, to drug metabolism (5). CYP3A5 expression is predominant in
the kidney, limited to the proximal tubule and affected by the
CYP3A5*1/*3 polymorphism (6). The
kidney is capable of CS 6β-hydroxylation, but only in individuals
who express CYP3A5 (7). Animal
(2–3) and in vitro(8–9)
studies have reported a correlation of the expression of CYP3A
enzymes with sodium reabsorption and blood pressure (BP). Thus,
genetic polymorphism in CYP3A5 may affect endogenous CS metabolism
in the proximal renal tubule (10)
that may ultimately affect BP, likely through sodium and water
retention. However, reports concerning the association of CYP3A5
genetic polymorphism with BP or hypertension have been largely
inconsistent in humans (11–15).
We have previously reported the absence of CYP3A4 genetic
polymorphism in North Indian individuals and its correlation with
the urinary 6β-hydroxy cortisol/cortisol (6β-OH-CS/CS) ratio
(16).
In the present study, healthy normotensive subjects
were phenotyped for CYP3A activity by assaying the urinary
6β-OH-CS/CS ratio and genotyped for CYP3A5*3 and CYP3A5*6 to
establish whether a correlation exists in the North Indian
population.
Materials and methods
Reagents
Bangalore Genei Pvt. Ltd. (Bangalore, India)
supplied Taq DNA polymerase, PCR buffer, dNTPs and HinfI.
New England Biolabs, Inc. (Beverly, MA, USA) supplied XcmI,
BfaI, DdeI and HpyCH4III. MBI Fermentas
(Hanover, MD, USA) supplied ClaI, MboII and
BsmA1. Operon Technologies, Inc. (Alameda, CA, USA)
synthesized the primers. Sigma Chemical Co. (St. Louis, MO, USA)
supplied CS and 6β-OH-CS. Ranbaxy Fine Chemicals Ltd. (New Delhi,
India) supplied the high-performance liquid chromatography (HPLC)
solvents.
Subjects and sample collection
Three hundred (n=300) healthy volunteers aged 20–50
years who were normotensive (BP≤120), non-smokers, non-alcoholics
and not on any medication for the previous two weeks were selected
for the study. Written consent along the Helsinki on
experimentation involving humans was obtained from each volunteer.
The present study was performed at the Department of Biochemistry
and approved by the Ethics Committee of the Postgraduate Institute
of Medical Education and Research (Chandigarh, India).
Morning spot urine samples were collected between 8
and 9 am in 20-ml screw-tight glass vials. These glass vials were
washed with nitric acid and baked in an oven at 150°C for 3 h.
Urine samples were brought to the laboratory as soon as possible
and stored at −20°C. Blood samples (5 ml) from the subjects
selected for genotyping were collected in a vial containing 875 μl
acid citrate dextrose.
Phenotyping
A total of 300 North Indian individuals were
phenotyped for CYP3A by measuring CS and 6β-OH-CS levels in urine
by HPLC as described previously (16).
Genotyping
Blood (5 ml) was collected in a vial containing ACD
(0.48% citric acid, 1.32% sodium citrate and 1.47% dextrose) from
150 subjects (75 demonstrating low and 75 demonstrating high CYP3A
activity). DNA was isolated (17)
and stored in a refrigerator until use. The PCR conditions, primers
and restriction endonucleases to diagnose CYP3A5*3 and CYP3A5*6
were as described previously (18)
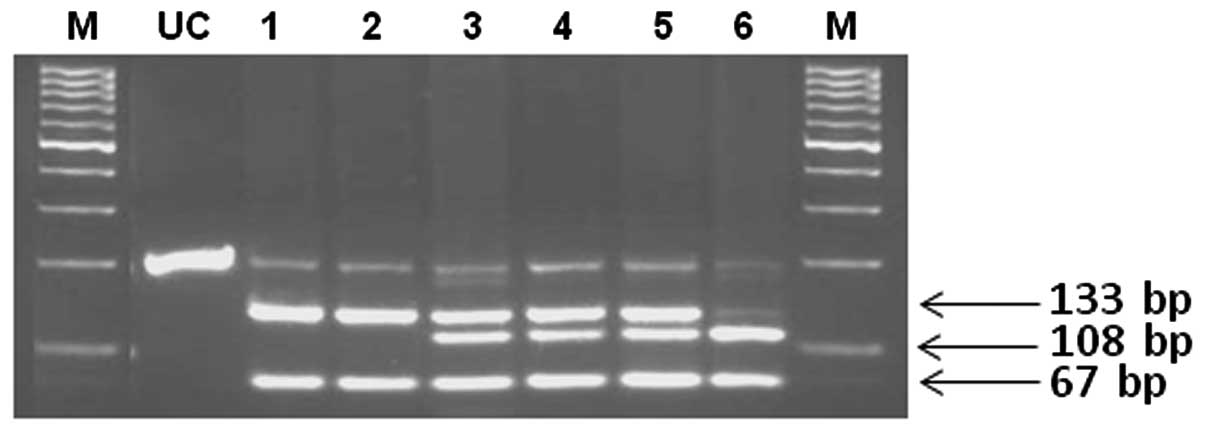
and are presented in Table I. The
amplified 200-bp DNA fragment for CYP3A5*3 contains one DdeI
site. This mutation results in the creation of an additional
DdeI site. DdeI digestion of DNA from a normal
homozygote (CYP3A5*1/*1) produces 133- and 67-bp fragments, while a
heterozygote (CYP3A5*1/*3) has 133-, 108-, 67- and 25-bp fragments
and a mutant homozygote (CYP3A5*3/*3) has 108-, 67- and 25-bp
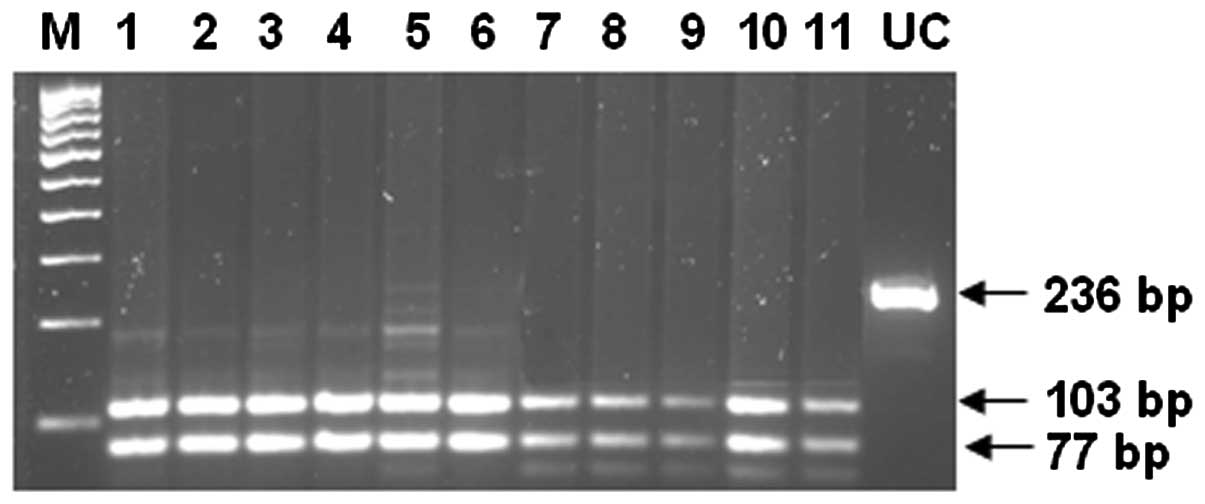
fragments. The amplified 236-bp DNA fragment for CYP3A5*6 contains
two DdeI sites. This mutation results in the loss of one
DdeI site. The DdeI digestion of DNA from a normal
homozygote (CYP3A5*1/*1) produces 103-, 77-, 31- and 25-bp
fragments, while a heterozygote (CYP3A5*1/*6) has 128-, 103-, 77-,
31- and 25-bp fragments and a mutant homozygote (CYP3A5*6/*6) has
128-, 77- and 31-bp fragments.
 | Table I.Primers, PCR conditions, REs and
diagnostic DNA fragments for genotyping CYP3A5 alleles. |
Table I.
Primers, PCR conditions, REs and
diagnostic DNA fragments for genotyping CYP3A5 alleles.
| Allele | Primers | PCR (35 Cycles) | RE | DNA Fragments |
|---|
| 3A5*3 | FP:
5′-CTTAAAGAGCTCTTTTGTCTCTCA-3′ | 45 sec, 94°C | DdeI | AF 200 NH 133,67 HE
133, 108, 67, 25 MH 108, 67,25 |
| RP:
5′-CCAGGAAGCCAGACTTTGAT-3′ | 45 sec, 69°C |
| | 30 sec, 72°C |
| 3A5*6 | FP:
5′-GTGGGTTTCTTGCTGCATGT-3′ | 45 sec, 94°C | DdeI | AF 236 NH 103,
7,31,25 HE 128, 103,77,31,25 MH 128 77, 31 |
| RP:
5′-GCCCACATACTTATTGAGAG-3′ | 45 sec, 69°C |
| | 30 sec, 72°C |
Statistical analysis
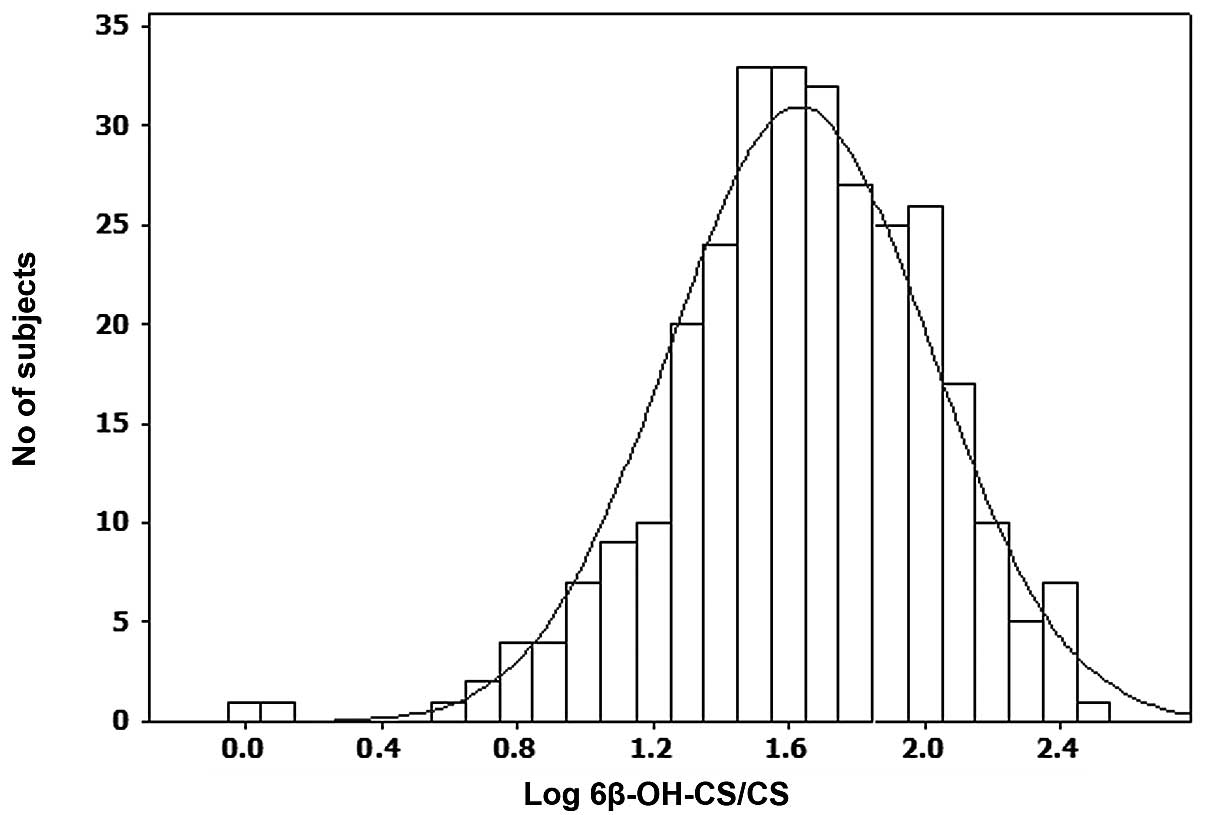
Analysis of the interindividual variations in the
metabolism of CS was expressed by computing a histogram with log
6β-OH-CS/CS ratio on the x-axis and the number of subjects on the
y-axis. The CYP3A5 genotypes and allele frequencies were compared
by the Chi-square test. Data were analyzed by nonparametric one-way
Kruskal-Wallis ANOVA followed by Mann-Whitney U tests. P<0.05
was considered to indicate a statistically significant
difference.
Results
Phenotype analysis
CYP3A phenotype data was plotted on the x-axis and
number of subjects on the y-axis to generate frequency distribution
histogram (Fig. 1) which
demonstrated a unimodal distribution with respect to CYP3A
activity. The mean 6β-OH CS/CS ratio was 61 (95% CI, 55–67). On the
basis of CYP3A activity, the subjects were divided into three
groups demonstrating low (n=75), intermediate (n=150) and high
(n=75) CYP3A activity (Table II).
The mean CS concentrations were 197, 124 and 58 ng/ml in the urine
of the low, intermediate and high CYP3A activity groups,
respectively, and the mean 6β-OH-CS concentrations were 2,931,
5,596 and 7,446 ng/ml in the urine of the low, intermediate and
high CYP3A activity groups, respectively. The 6β-OH-CS/CS ratio in
urine was 16 in the low, 47 in the intermediate and 135 in the high
CYP3A activity groups (Table II).
CS levels were statistically significant lower in the intermediate
and high CYP3A activity groups than in the low CYP3A activity
group, whereas 6β-OH-CS levels, the 6β-OH-CS/CS ratio and log
6β-OH-CS/CS were statistically significantly higher (P<0.01).
The 6β-OH-CS/CS and log 6β-OH-CS/CS ratios in the high CYP3A
activity group were 8-fold and 1.84-fold higher, respectively, than
those in the low CYP3A activity group. CS levels were also
statistically significantly lower (P<0.01) in the high CYP3A
activity group than in the intermediate CYP3A activity group,
whereas 6β-OH-CS/CS and log 6β-OH-CS/CS ratios were statistically
significantly higher (P<0.01; Table
II).
| Table II.CYP3A phenotype parameters in the low,
intermediate and high CYP3A activity groups. |
Table II.
CYP3A phenotype parameters in the low,
intermediate and high CYP3A activity groups.
| Urine parameter | Low CYP3A activity
group (n=75) | Intermediate CYP3A
activity group (n=150) | High CYP3A activity
group (n=75) |
|---|
| CS (ng/ml) | 197±118 | 124±92a | 58±56ab |
| 6β-OH-CS (ng/ml) | 2931±2211 | 5596±4210a |
7446±7845ac |
| 6β-OH-CS/CS | 16±6 | 47±15a | 135±53ab |
| Log 6β-OH-CS/CS | 1.14±0.26 | 1.65±0.14a |
2.10±0.15ab |
Genotype analysis
The CYP3A5 genotypes were determined by PCR-RFLP
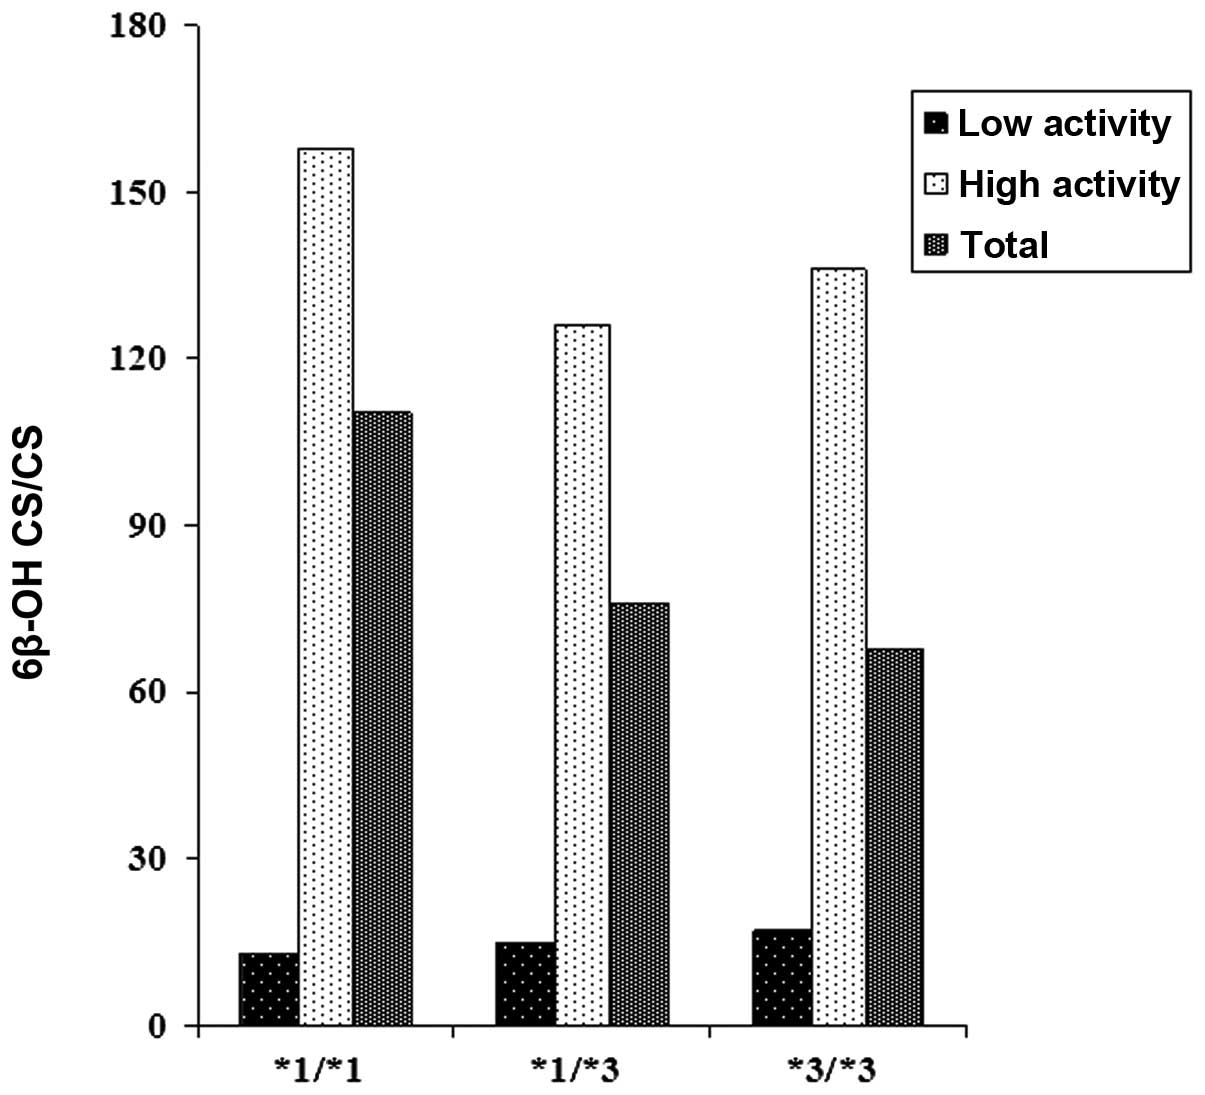
(Figs. 2 and 3). The correlations between the CYP3A
phenotypes and CYP3A5 genotypes in the low and high CYP3A activity
groups are shown in Table III and
Fig. 4. Normal homozygotes
(CYP3A5*1/*1), heterozygotes (CYP3A5*1/*3) and mutant homozygotes
(CYP3A5*3/*3) in the high CYP3A activity group exhibited
statistically significantly lower CS levels when compared with the
low CYP3A activity group, whereas statistically significantly
higher 6β-OH-CS, 6β-OH-CS/CS and log 6β-OH-CS/CS ratios were
observed. When the 6β-OH-CS/CS ratios of the genotypes were
compared within the high CYP3A activity group, heterozygotes
(CYP3A5*1/*3) and mutant homozygotes (CYP3A5*3/*3) demonstrated 20
and 14% decreases, respectively, compared with the normal
homozygotes (CYP3A5*1/*1). These decreases were much higher (30 and
37%, respectively) when the 6β-OH-CS/CS ratios in heterozygotes
(CYP3A5*1/*3) and mutant homozygotes (CYP3A5*3/*3) were compared
with normal homozygotes (CYP3A5*1/*1) in the total study
population. Although the results are not statistically significant,
these suggest that CYP3A5*3 reduced the urinary 6β-OH-CS/CS ratios
and, as such, CYP3A5*3 is a debilitating allele.
| Table III.Correlation between CYP3A phenotypes
and CYP3A5 genotypes. |
Table III.
Correlation between CYP3A phenotypes
and CYP3A5 genotypes.
| CYP3A5
genotypes | Low CYP3A activity
group | High CYP3A activity
group | P-value | Total |
|---|
| CS (ng/ml
urine) | | | | |
| CYP3A5*1/*1 | 182±107 | 63±64 | 0.048 | 103±96 |
| CYP3A5*1/*3 | 225±113 | 55±45 | 0.0001 | 132±118 |
| CYP3A5*3/*3 | 180±121 | 57±65 | 0.0003 | 126±117 |
| 6β-OH-CS (ng/ml
urine) | | | | |
| CYP3A5*1/*1 | 2581±1811 | 9231±8738 | 0.283 | 7015±7759 |
| CYP3A5*1/*3 | 3210±2364 | 6681±6675 | 0.002 | 5114±5442 |
| CYP3A5*3/*3 | 2781±2169 | 7290±8739 | 0.0001 | 4739±6347 |
| 6β-OH-CS/CS
(urine) | | | | |
| CYP3A5*1/*1 | 13.5±3.2 | 158±65 | 0.004 | 110±80 |
| CYP3A5*1/*3 | 14.7±6.8 | 126±57 | 0.0001 | 76±70 |
| CYP3A5*3/*3 | 16.5±6.4 | 136±46 | 0.0001 | 69±67 |
| Log 6β-OH-CS/CS
(urine) | | | | |
| CYP3A5*1/*1 | 1.11±0.11 | 2.17±0.18 | 0.004 | 1.82±0.54 |
| CYP3A5*1/*3 | 1.10±0.30 | 2.07±0.66 | 0.0001 | 1.63±0.54 |
| CYP3A5*3/*3 | 1.17±0.25 | 2.11±0.13 | 0.0001 | 1.58±0.51 |
The distribution of the genotypes in the low and
high CYP3A activity groups is shown in Table IV. Out of 150 subjects genotyped
for CYP3A5*3, 12 (8%) were normal homozygotes (CYP3A5*1/*1), 62
(41%) were heterozygotes (CYP3A5*1/*3) and 76 (51%) were mutant
homozygotes (CYP3A5*3/*3). Thus, the frequencies of CYP3A5*1 and
CYP3A5*3 were 0.29 (95% CI, 0.22–0.36) and 0.71 (95% CI, 0.64–0.78)
in 150 North Indian individuals (Table
IV). Out of 75 subjects genotyped for CYP3A5*3 in the low CYP3A
activity group, 4 (5%) were normal homozygotes (CYP3A5*1/*1), 28
(37%) were heterozygotes (CYP3A5*1/*3) and 43 (57%) were mutant
homozygotes (CYP3A5*3/*3; Table
IV). Thus, the frequencies of CYP3A5*1 and CYP3A5*3 were 0.24
and 0.76, respectively in the low CYP3A activity group. Out of 75
subjects genotyped for CYP3A5* 3 in the high CYP3A activity group,
8 (11%) were normal homozygotes (CYP3A5*1/*1), 34 (45%) were
heterozygotes (CYP3A5*1/*3) and 33 (44%) were mutant homozygotes
(CYP3A5*3/*3; Table IV). Thus, the
frequencies of CYP3A5*1 and CYP3A5*3 were 0.33 and 0.67,
respectively, in the high CYP3A activity group. There were 30% more
mutant homo-zygotes (CYP3A5*3/*3) and 14% more CYP3A5*3 alleles in
the low CYP3A activity group than in the high CYP3A activity group.
These observations support the previous suggestion that CYP3A5*3
reduced the activity of CYP3A, as its occurrence was higher in the
low CYP3A activity group and lower in the high CYP3A activity group
(Fig. 4).
| Table IV.CYP3A5 genotype and allele frequency
in low and high CYP3A activity groups of North Indian
individuals. |
Table IV.
CYP3A5 genotype and allele frequency
in low and high CYP3A activity groups of North Indian
individuals.
| CYP3A5
genotypes/alleles | Low CYP3A activity
group (n=75) | High CYP3A activity
group (n=75) | Total (n=150) |
|---|
| Genotypes | | | |
| CYP3A5*1/*1 | 4 (5 %) | 8 (11 %) | 12 (8 %) |
| CYP3A5*1/*3 | 28 (37 %) | 34 (45 %) | 62 (41 %) |
| CYP3A5*3/*3 | 43 (57 %) | 33 (44 %) | 76 (51 %) |
| Alleles | | | |
| CYP3A5*1 | 0.24 | 0.33 | 0.29 |
| CYP3A5*3 | 0.76 | 0.67 | 0.71 |
Discussion
The single nucleotide polymorphisms (SNPs) reported
in CYP3A4 in Caucasians are not detrimental and are present at low
frequencies to account for variation in CYP3A activity. CYP3A5*3
and CYP3A*6 have been shown to drastically reduce CYP3A activity.
Hence, in the present study the correlation between CYP3A activity
and CYP3A5*3 and CYP3A*6 was studied in a North Indian population.
Since the population demonstrated a unimodal distribution with
respect to CYP3A activity (Fig.
1), the individuals were divided into three groups of low,
intermediate and high CYP3A activity (Table II). The CYP3A activity in
heterozygotes (CYP3A5*1/*3) and mutant homozygotes (CYP3A5*3/*3)
was not different from that in normal homozygotes (CYP3A5*1/*1) in
the low CYP3A activity group, but exhibited 20 and 14% decreases,
respectively, from that in normal homozygotes in the high CYP3A
activity group. These decreases increased to 31 and 37% in the
total study population. Although the data were not statistically
significant, it suggested that CYP3A5*3 reduced the CYP3A activity
(Table III). This was further
supported by the observation that mutant homozygotes (CYP3A5*3/*3)
were present at high frequency in the low CYP3A activity group and
low frequency in the high CYP3A activity group (Table IV). The results are statistically
insignificant due to the fact that CYP3A4 and CYP3A5 contribute
towards CYP3A activity and, while CYP3A4 is expressed in all the
livers, hepatic CYP3A5 is polymorphically expressed in ∼30% of
Causcasian, Asian and Hispanic individuals and >50% African
Americans (4). The corresponding
information is not available for an Indian population, but it may
be estimated from the data generated in the present study that
hepatic CYP3A5 is expressed in ∼50% North Indian individuals
(normal homozygotes plus heterozygotes; Table IV). However, this must be
substantiated by assaying the CYP3A5 protein content by
immunochemical techniques and is constrained by the availability of
human livers.
CYP3A5 is important due to the differential
metabolism of specific substrates, despite a substantial overlap
with the substrate specificity of CYP3A4. CYP3A5 metabolizes
cyclosporine slower than CYP3A4 and produces only one metabolite,
MI, whereas CYP3A4 produces two additional metabolites, AM9 and
AMN4 (19). Mugundu et
al(20) assessed the
contributions of CYP3A4 and CYP3A5 and examined the impact of the
CYP3A5 genotype on the formation of α-hydroxytamoxifen (α-OHT) and
N-desmethyltamoxifen (N-DMT) from tamoxifen and suggested that
CYP3A5 expression may affect the formation of N-DMT but not that of
α-OHT. Differences have also been reported in the rate of the
metabolism of testosterone, progesterone and androstenedione by
CYP3A4 and CYP3A5 (19). Most
significantly, an association exists between tacrolimus, an
immunosuppressant with a narrow therapeutic index, and the CYP3A5
genotypes. Eight studies performed on tacrolimus with regard to
CYP3A5 genotypes in organ transplant patients in various ethnic
groups (21) demonstrated a direct
correlation between the tacrolimus dose required to reach a
predetermined trough concentration and CYP3A5 genotypes. Mutant
homozygotes (CYP3A5*3/*3) required less tacrolimus to reach the
trough levels than normal homozygotes (CYP3A5*1/*1), as the former
have lower metabolic activity than the latter. In support of this,
baculovirus-expressed CYP3A5 metabolized tacrolimus to
13-O-demethyltacrolimus, the main metabolite, at a higher rate
compared with CYP3A4 and CYP3A7 (22). Human hepatic microsomes from low
and high CYP3A expressors metabolized tacrolimus at different
rates. The high expressors metabolized tacrolimus at a faster rate
than the low expressors. It must be noted that the 15 human hepatic
microsomes used in this study had been phenotyped by
CS-6β-hydroxylase (22), thus
demonstrating that the metabolism of tacrolimus and CS are closely
correlated.
Another important hypothesis concerning the CYP35
genotype is that it plays role in BP since CYP3A5 and not CYP3A4 is
expressed in extrahepatic tissues, particularly the kidney
(23). As mentioned previously,
CYP3A5 metabolizes CS to 6β-OH-CS. The local metabolism of CS to
6β-OH-CS increases the metabolite concentration in the kidney. The
metabolites 6β-OH-CS and 6β-OH corticosterone act as
mineralocorticoids, which lead to hypertension due to electrolyte
and water retention in kidney. Levels of 6β-OH-CS have been shown
to be elevated in hypertensive individuals (24). Moreover, African American normal
homo-zygotes (CYP3A5*1/*1) exhibited higher systolic BP, mean
arterial pressure and creatinine clearance compared with
heterozygotes (CYP3A5*1/*3) (23).
These observations were confirmed in a larger cohort (25). It is notable that all three; normal
homozygotes (CYP3A5*1/*1) (4),
hypertension (26) and salt
sensitivity (27) are
simultaneously higher in African Americans. This information is
lacking for an Indian population and should be investigated.
The normal homyzygote frequency (CYP3A5*1/*1) was
8%, heterozygote frequency (CYP3A5*1/*1) was 41% and mutant
homozygote frequency (CYP3A5*3/*3) was 51%. This data agrees with
the pooled data from other studies which demonstrated the frequency
of normal homozygotes (CYP3A5*1/*1) to be 7.3%, heterozygotes
(CYP3A5*1/*1) to be 39.7% and mutant homozygotes (CYP3A5*3/*3) to
be 53.0% in an Asian population (28). According to these studies, CYP3A5
expressors should be ∼50% of the population, whereas CYP3A5
expressors have been reported to be 69% (normal homozygotes plus
heterozygotes) in an Indian population (18). Accordingly, the CYP3A5*3 allele
frequency reported in Indian individuals was 0.59 (18), lower than the 0.71 reported in the
present study. This is due to the fact that the present cohort
included North Indians, whereas migrants living in Singapore, who
were an admixture of various ethnic groups from India, were
selected in the earlier study (18). Heterogeneity within the Indian
population has been documented. We previously reported the absence
of CYP2C19*3 in North Indian individuals (29), whereas its frequency in South
Indian individuals has been reported to be 0.022 (30). It would be prudent to give due
consideration to the various ethnic groups within India while
studying genetic polymorphism of CYPs.
References
|
1.
|
Hunt CM, Watkins PB, Saenger P, et al:
Heterogeneity of CYP3A isoforms metabolizing erythromycin and
cortisol. Clin Pharmacol Ther. 51:18–23. 1992. View Article : Google Scholar : PubMed/NCBI
|
|
2.
|
Ghosh S, Grogan WM, Basu A and Watlington
C: Renal corticosterone 6 beta-hydroxylase in the spontaneously
hypertensive rat. Biochim Biophys Acta. 1182:152–156. 1993.
View Article : Google Scholar : PubMed/NCBI
|
|
3.
|
Watlington CO, Kramer LB, Schuetz EG, et
al: Corticosterone 6 beta-hydroxylation correlates with blood
pressure in spontaneously hypertensive rats. Am J Physiol.
262:F927–F931. 1992.PubMed/NCBI
|
|
4.
|
Kuehl P, Zhang J, Lin Y, Lamba J, et al:
Sequence diversity in CYP3A promoters and characterization of the
genetic basis of polymorphic CYP3A5 expression. Nat Genet.
27:383–391. 2001. View
Article : Google Scholar : PubMed/NCBI
|
|
5.
|
Huang W, Lin YS, McConn DJ II, et al:
Evidence of significant contribution from CYP3A5 to hepatic drug
metabolism. Drug Metab Dispos. 32:1434–1445. 2004. View Article : Google Scholar : PubMed/NCBI
|
|
6.
|
Bolbrinker J, Seeberg S, Schostak M, et
al: CYP3A5 genotype-phenotype analysis in the human kidney reveals
a strong site-specific expression of CYP3A5 in the proximal tubule
in carriers of the CYP3A5*1 allele. Drug Metab Dispos. 40:639–641.
2012.PubMed/NCBI
|
|
7.
|
Haehner BD, Gorski JC, Vandenbranden M, et
al: Bimodal distribution of renal cytochrome P450 3A activity in
humans. Mol Pharmacol. 50:52–59. 1996.PubMed/NCBI
|
|
8.
|
Duncan RL, Grogan WM, Kramer LB and
Watlington CO: Corticosterone’s metabolite is an agonist for
Na+ transport stimulation in A6 cells. Am J Physiol.
255:F736–F748. 1988.
|
|
9.
|
Grogan WM, Fidelman ML, Newton DE, et al:
A corticosterone metabolite produced by A6 (toad kidney) cells in
culture: identification and effects on Na+ transport.
Endocrinology. 116:1189–1194. 1985. View Article : Google Scholar : PubMed/NCBI
|
|
10.
|
Koch I, Weil R, Wolbold R, et al:
Interindividual variability and tissue-specificity in the
expression of cytochrome P450 3A mRNA. Drug Metab Dispos.
30:1108–1114. 2002. View Article : Google Scholar : PubMed/NCBI
|
|
11.
|
Xi B, Wang C, Liu L, et al: Association of
the CYP3A5 polymorphism (6986G>A) with blood pressure and
hypertension. Hypertens Res. 34:1216–1220. 2011.
|
|
12.
|
Langaee TY, Gong Y, Yarandi HN, et al:
Association of CYP3A5 polymorphisms with hypertension and
antihypertensive response to verapamil. Clin Pharmacol Ther.
81:386–391. 2007. View Article : Google Scholar : PubMed/NCBI
|
|
13.
|
Eap CB, Bochud M, Elston RC, et al: CYP3A5
and ABCB1 genes influence blood pressure and response to treatment,
and their effect is modified by salt. Hypertension. 49:1007–1014.
2007. View Article : Google Scholar : PubMed/NCBI
|
|
14.
|
Givens RC, Lin YS, Dowling AL, et al:
CYP3A5 genotype predicts renal CYP3A activity and blood pressure in
healthy adults. J Appl Physiol. 95:1297–1300. 2003. View Article : Google Scholar : PubMed/NCBI
|
|
15.
|
Zhang L, Miyaki K, Wang W and Muramatsu M:
CYP3A5 polymorphism and sensitivity of blood pressure to dietary
salt in Japanese men. J Hum Hypertens. 24:345–350. 2010. View Article : Google Scholar : PubMed/NCBI
|
|
16.
|
Rais N, Chawla YK and Kohli KK: CYP3A
phenotypes and genotypes in North Indians. Eur J Clin Pharmacol.
62:417–422. 2006. View Article : Google Scholar : PubMed/NCBI
|
|
17.
|
Daly AK, Steen VM, Fairbrother KS and Idle
JR: CYP2D6 multiallelism. Methods Enzymol. 272:199–210. 1996.
View Article : Google Scholar
|
|
18.
|
Balram C, Zhou Q, Cheung YB and Lee EJ:
CYP3A5*3 and *6 single nucleotide polymorphisms in three distinct
Asian populations. Eur J Clin Pharmacol. 59:123–126. 2003.
|
|
19.
|
Aoyama T, Yamano S, Waxman DJ, et al:
Cytochrome P-450 hPCN3, a novel cytochrome P-450 IIIA gene product
that is differentially expressed in adult human liver. cDNA and
deduced amino acid sequence and distinct specificities of
cDNA-expressed hPCN1 and hPCN3 for the metabolism of steroid
hormones and cyclosporine. J Biol Chem. 264:10388–10395. 1989.
|
|
20.
|
Mugundu GM, Sallans L, Guo Y, et al:
Assessment of the impact of CYP3A polymorphisms on the formation of
α-hydroxytamoxifen and N-desmethyltamoxifen in human liver
microsomes. Drug Metab Dispos. 40:389–396. 2012.
|
|
21.
|
Daly AK: Significance of the minor
cytochrome P450 3A isoforms. Clinic Pharmacokinet. 45:13–31. 2006.
View Article : Google Scholar : PubMed/NCBI
|
|
22.
|
Kamdem LK, Streit F, Zanger UM, et al:
Contribution of CYP3A5 to the in vitro hepatic clearance of
tacrolimus. Clin Chem. 51:1374–1381. 2005. View Article : Google Scholar : PubMed/NCBI
|
|
23.
|
Givens RC, Lin YS, Dowling AL, et al:
CYP3A5 genotype predicts renal CYP3A activity and blood pressure in
healthy adults. J Appl Physiol. 95:1297–1300. 2003. View Article : Google Scholar : PubMed/NCBI
|
|
24.
|
Kornel L, Miyabo S, Saito Z, et al:
Corticosteroids in human blood. VIII Cortisol metabolites in plasma
of normotensive subjects and patients with essential hypertension.
J Clin Endocrinol Metab. 40:949–958. 1975. View Article : Google Scholar : PubMed/NCBI
|
|
25.
|
Ho H, Pinto A, Hall SD, et al: Association
between the CYP3A5 genotype and blood pressure. Hypertension.
45:294–298. 2005. View Article : Google Scholar : PubMed/NCBI
|
|
26.
|
Cornoni-Huntley J, LaCroix AZ and Havlik
RJ: Race and sex differentials in the impact of hypertension in the
United States. The National Health and Nutrition Examination Survey
I Epidemiologic Follow-up Study. Arch Intern Med. 149:780–788.
1989. View Article : Google Scholar : PubMed/NCBI
|
|
27.
|
Weinberger MH: Salt sensitivity of blood
pressure in humans. Hypertension. 27:481–490. 1996. View Article : Google Scholar : PubMed/NCBI
|
|
28.
|
Xie HG, Wood AJ, Kim RB, et al: Genetic
variability in CYP3A5 and its possible consequences.
Pharmacogenomics. 5:243–272. 2004. View Article : Google Scholar : PubMed/NCBI
|
|
29.
|
Lamba JK, Dhiman RK and Kohli KK: CYP2C19
genetic mutations in North Indians. Clin Pharmacol Ther.
68:328–335. 2000. View Article : Google Scholar : PubMed/NCBI
|
|
30.
|
Adithan C, Gerard N, Vasu S, et al: Allele
and genotype frequency of CYP2C19 in a Tamilian population. Br J
Clin Pharmacol. 56:331–333. 2003. View Article : Google Scholar : PubMed/NCBI
|