Introduction
Trancatheter arterial chemoembolization (TACE) is
one of the preferred methods of treating patients with advanced
stage hepatocellular carcinoma (HCC). TACE not only directly kills
tumor cells, but also blocks the blood supply to the tumor.
However, embolic agents used in chemoembolization, such as iodized
oil, may result in liver fibrosis though activating cells around
the tumor and excreting numerous types of cytokine. Monitoring the
real-time progress of liver fibrosis following TACE and inversing
the development has vital clinical significance in prolonging the
survival times of patients.
Liver biopsy pathology examinations remain the gold
standard in the diagnosis of liver fibrosis (1,2). Due
to the uneven distribution of fibrosis tissue, small samples of
hepatic tissue in each liver puncture inevitably cause more error.
Serum indexes, including hyaluronate (HA), laminin (LN), human
procollagen type-III (hPC-III) and collagen type-IV (IV-C), reflect
the degree of liver fibrosis. However, the majority of hospitals do
not have the equipment required to use these in clinical practice,
resulting in limitations in general use (3). Therefore, investigation into a more
advanced and reasonable method that can effectively detect the
degree of liver fibrosis and is easy to conduct has become an
urgent priority.
Magnetic resonance (MR) diffusion-weighted imaging
(DWI) reflects the degree of liver fibrosis on a microscopic
molecular level and has demonstrated good application prospects
(4–6). In the present study, HCC patients
were treated with TACE and apparent diffusion coefficient (ADC)
values were used to determine the progress of liver fibrosis, with
the aim of providing an easy and effective method to detect the
progress of liver fibrosis in HCC patients following TACE.
Materials and methods
Study objects and grouping
Patients with primary HCC that received TACE between
October 2007 and July 2011 were recruited for the study. All the
cases were consistent with the diagnosis standard of primary
carcinoma of the liver (7). The
study selected 84 cases that had normal liver fibrosis indexes
prior to treatment, including 38 males and six females with an
average age of 49.30±8.84 years. The patients received more than
four cycles of TACE and were divided into two groups: Low dose and
conventional dose. The low dose group (group A; n=48) were
administered low doses of chemotherapeutic agents, including 250 mg
5-fluorouracil (5-FU) and 4 mg mitomycin (MMC), while the
conventional group (group B; n=36) received 1,000 mg 5-FU, 8 mg MMC
and 40 mg cisplatin. Prior to and at week 4 following the fourth
surgery, examinations of the four liver fibrosis indexes (HA, LN,
hPC-III and IV-C) and the ADC value were conducted. The study was
conducted in accordance with the Declaration of Helsinki and with
approval from the Ethics Committee of the Three Gorges University
(Yichang, China). Written informed consent was obtained from all
the participants.
TACE procedure
A microcatheter was inserted into the blood-supply
artery of the carcinoma to perform embolization with a
super-selective intubation technique. Chemotherapeutic drugs,
including MMC and 5-FU, were then injected, followed by embolism
with hyper liquidness iodinated oil. The dosage of iodinated oil
was adjusted according to the size of the focus. Embolism standards
included that lesions had good iodinated oil sedimentation, blood
supply vessels were predominantly obliterated and the tumor stain
had almost vanished. MRI and index analysis determined the next
TACE time.
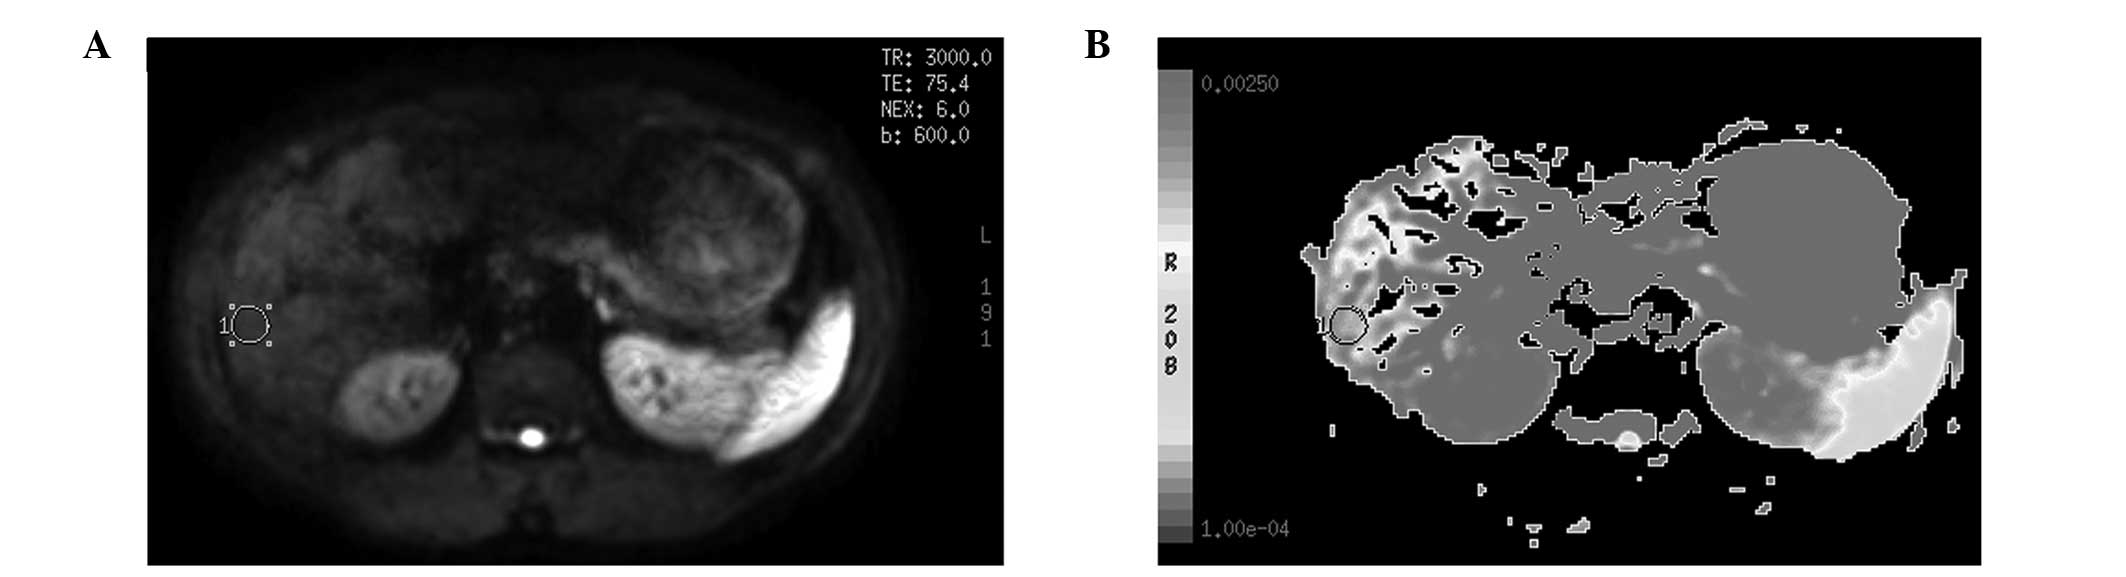
A Signa HD echospeed 1.5 T MRI system (GE
Healthcare, Pittsburgh, PA, USA) with a 16 channel body coil was
used for MRI. MR-DWI (1.5T HDe Singa model; American GE Corp,
Fairfield, CT, USA) had a b-value of 600 sec/mm2 and
cross sectional scans. ADC imaging was acquired following computer
processing. The center of the porta hepatic plane was selected, as
well as points above and below the plane in the right lobe of the
liver, to obtain the ADC imaging, from which three regions of
interest (ROI) were selected with a size of 50–100 mm2.
Areas that included the bile ducts, blood vessels, artifacts and
the lesion after the treatment of TACE were avoided. The same size
ROI was copied and eventually the mean value was calculated as the
general ADC value of the right liver lobe (Fig. 1A and B).
Serology detection
Prior to and at week 4 following the fourth surgery,
5 ml venous blood was collected from all the patients. The samples
were placed in test tubes without pyrogen and endotoxin, and were
maintained for 2 h at room temperature. Samples were stored in a
−20°C refrigerator following centrifugation for 10 min at 6,037 ×
g. Levels of HA, hPC-III, IV-C and LN were measured using a
radioimmunoassay method.
Statistical analysis
Measurement data are expressed as the mean ±
standard deviation. Differences between groups were analyzed by
one-factor analysis of variance, while comparisons between groups
were performed using the t-test. Pearson’s correlation analysis
method was used. All statistical analyses were conducted using SPSS
13.0 statistical software (SPSS, Inc., Chicago, IL, USA), where
P<0.05 was considered to indicate a statistically significant
difference.
Results
ADC values
MR plain scans, DWI and ADC value detection were
performed prior to the first TACE cycle and at week 4 following
each surgery. ADC values were determined with b=600
sec/mm2. Results are shown in Tables I and II.
 | Table IADC values prior to and following four
cycles of TACE in groups A and B. |
Table I
ADC values prior to and following four
cycles of TACE in groups A and B.
| Group A (n=48) | | Group B (n=36) | |
|---|
|
| |
| |
|---|
| TACE cycle | Preoperative
(x10−3 mm2/sec) | Postoperative
(x10−3 mm2/sec) | P-value | Preoperative
(x10−3 mm2/sec) | Postoperative
(x10−3 mm2/sec) | P-value |
|---|
| First | 1.613±0.133 | 1.595±0.124 | 0.2531 | 1.598±0.147 | 1.433±0.151 | 0.0435 |
| Second | 1.595±0.124 | 1.564±0.165 | 0.1574 | 1.433±0.151 | 1.359±0.159 | 0.0371 |
| Third | 1.564±0.165 | 1.526±0.213 | 0.1128 | 1.359±0.159 | 1.286±0.123 | 0.0395 |
| Fourth | 1.526±0.213 | 1.488±0.248 | 0.0981 | 1.286±0.123 | 1.206±0.222 | 0.0366 |
| Table IIADC values prior to the first cycle of
TACE and following the fourth TACE cycle in groups A and B. |
Table II
ADC values prior to the first cycle of
TACE and following the fourth TACE cycle in groups A and B.
| Group | Prior to the first
TACE (x10−3 mm2/sec) | Following the fourth
TACE (x10−3 mm2/sec) | P-value |
|---|
| A (n=48) | 1.613±0.133 | 1.488±0.248 | 0.0342 |
| B (n=36) | 1.598±0.151 | 1.206±0.222 | 0.0057 |
As shown in Table
I, ADC values following each TACE cycle in the low dose group
exhibited no statistically significant difference when compared
with the preoperative value (P>0.05), while in the conventional
dose group, the ADC values decreased markedly and the differences
exhibited statistical significance (P<0.05). ADC values of the
liver in the two groups following the fourth TACE cycle were
significantly lower compared with the value prior to the first TACE
cycle (P<0.05), however, group B exhibited a more marked
difference (P<0.01; Table
II).
Liver fibrosis indexes
Levels of the four serum liver fibrosis indexes (HA,
hPC-III, IV-C and LN) were measured prior to and following each
TACE cycle (Table III).
| Table IIILiver fibrosis indexes prior to and
following TACE cycles. |
Table III
Liver fibrosis indexes prior to and
following TACE cycles.
| Group A (n=48) | Group B (n=36) |
|---|
|
|
|
|---|
| Fibrosis indexes | Preoperative | Postoperative | Preoperative | Postoperative |
|---|
| First TACE |
| HA (mg/l) | 259.81±78.16 | 263.81±87.24 | 263.81±87.24 | 279.47±95.39 |
| PC-III (μg/l) | 182.11±65.27 | 186.86±58.05 | 180.11±65.27 | 199.16±83.25 |
| IV-C (μg/l) | 121.20±43.46 | 127.20±38.40 | 119.20±43.46 | 124.13±25.43 |
| LN (μg/ml) | 159.03±33.66 | 166.51±38.19 | 157.03±32.55 | 169.08±31.25 |
| Second TACE |
| HA (mg/l) | 276.67±81.23 | 273.24±95.57 | 279.47±95.39 | 316.15±124.48b |
| PC-III (μg/l) | 189.11±78.82 | 193.23±88.07 | 182.11±81.34 | 243.16±89.52a |
| IV-C (μg/l) | 123.27±50.35 | 123.27±50.35 | 127.27±50.35 | 179.71±69.89a |
| LN (μg/ml) | 177.86±25.53 | 177.86±25.53 | 164.86±25.53 | 192.21±29.78a |
| Third TACE |
| HA (mg/l) | 276.63±91.14 | 296.63±102.16 | 286.63±102.16 | 332.45±128.63b |
| PC-III (μg/l) | 190.66±85.15 | 203.81±85.25 | 210.46±75.15 | 236.16±88.46a |
| IV-C (μg/l) | 130.00±55.37 | 139.45±60.66 | 150.20±57.35 | 188.16±70.13a |
| LN (μg/ml) | 183.86±30.75 | 183.86±30.75 | 183.86±30.75 | 201.58±68.43a |
| Fourth TACE |
| HA (mg/l) | 293.63±98.05 | 296.07±101.11 | 311.63±103.21 | 352.11±132.36b |
| PC-III (μg/l) | 198.57±85.11 | 211.66±81.74 | 218.46±75.15 | 255.16±78.21a |
| IV-C (μg/l) | 140.08±62.22 | 148.33±61.84 | 159.20±57.35 | 199.16±72.13a |
| LN (μg/ml) | 190.10±35.77 | 197.45±36.88 | 189.86±35.77 | 231.58±78.45a |
Data of the liver fibrosis indexes shown in Tables II and III were analyzed with a t-test. The
results demonstrated that the value of each liver fibrosis index in
group A had no significant difference following each TACE cycle
when compared with the preoperative value. In group B, following
the first TACE cycle, the same results were observed as group A,
however, following the second, third and fourth TACE cycle, each
liver fibrosis index was observed to increase (P<0.05), with HA
exhibiting the most significant change (P<0.01).
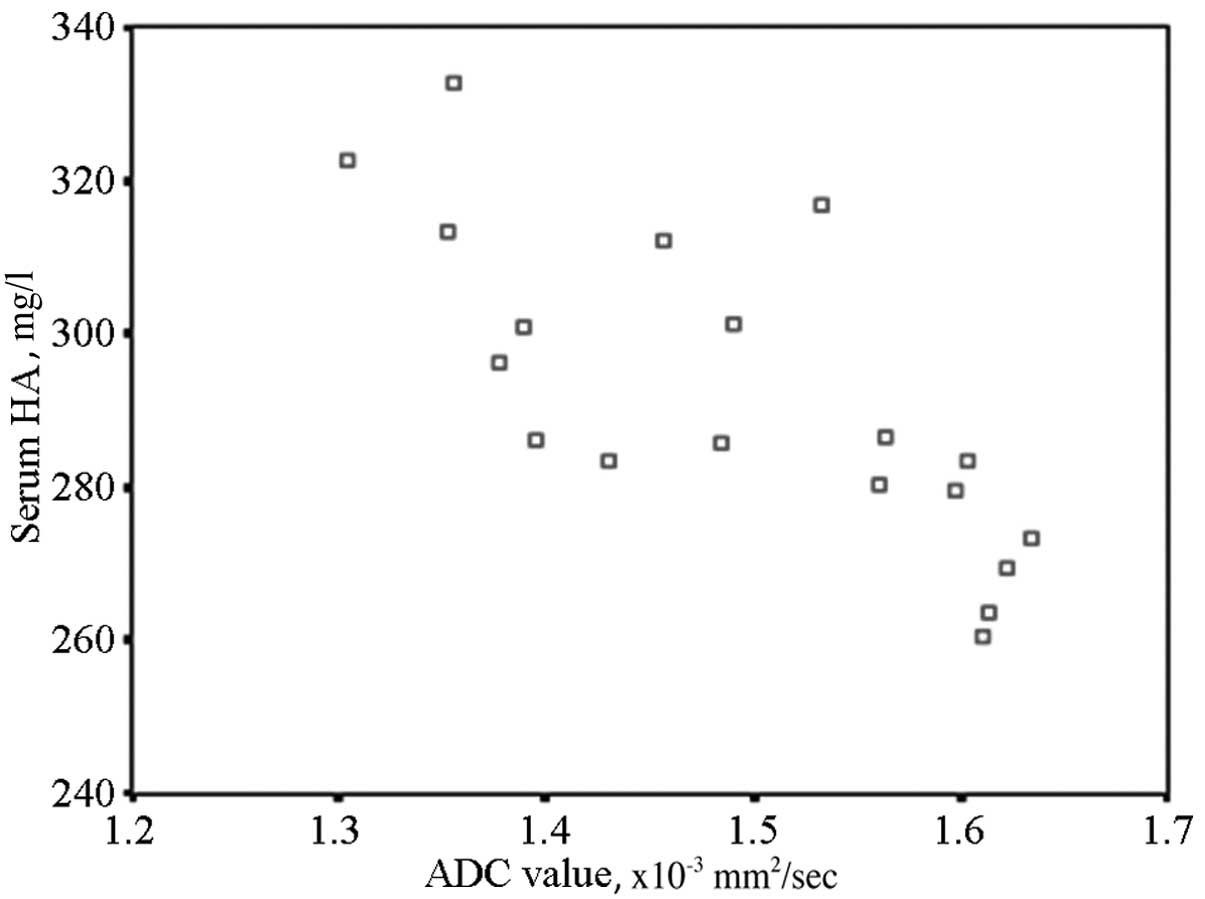
Correlation analysis between liver
fibrosis and ADC values
Liver fibrosis progress exhibited significant
effects on the serum liver fibrosis indexes. HA was the most
significant of the four indicators, thus, HA should be used to
evaluate the degree of liver fibrosis. When comparing HA with the
ADC value at the same time period using Pearson’s method, the two
indicators exhibited a significant negative correlation (r=0.535,
P<0.01). The results are shown in the scatter diagram (Fig. 2).
Discussion
In the development of liver fibrosis, the main
pathological change is the aggregation of a large number of
collagen fibers in the extracellular matrix. The deposition of
collagen fibers reduces extracellular clearance, which further
reduces the moisture capacity, as collagen fiber itself does not
have a high moisture capacity. This limits the diffusion movement
of water molecules, thus, resulting in a decrease in ADC values
(8–10). The more deposition of collagen
fibers in the extracellular matrix, the more progressive the liver
fibrosis and the more significant the decrease in ADC values
(2). Lewin et al (11) performed MR-DWI in 54 patients, with
the results also showing that ADC values were correlated to liver
fibrosis grading (3,12). Previous studies have also
demonstrated that the liver and spleen ADC ratio may reflect the
progression of liver fibrosis more specifically. The study by Sun
et al (13) included 41
patients with chronic liver disease, in which MR-DWI and blood
biochemical index analysis was performed. The study indicated that
a logistic regression model constructed with ADC values and
multiple blood biochemical indexes had even higher diagnostic
accuracy compared with single detection. All these studies
hypothesized that ADC values aided the diagnosis, staging and
prediction of liver fibrosis. In the present study, lower and
conventional doses of chemotherapy in TACE were compared, and the
ADC values of the conventional group exhibited statistical
significance following each TACE cycle when compared with the
preoperative values. Therefore, to a certain extent, we
hypothesized that ADC values can replace liver fibrosis indexes in
the evaluation of liver fibrosis progression.
A number of studies have indicated that DWI, as an
invasive MR functional imaging technique, may eliminate the T2
penetration effect, and reflect the pacing of hydrone diffusion
more accurately and provide quantitative indicators. DWI may be
used to reflect the characteristics of the organization and
curative effects from a molecular level, and has demonstrated a
superior value in the evaluation of interventional therapeutics in
HCC (14,15).
In TACE treatment of HCC, chemotherapeutic drugs and
iodized oil may activate cells around the tumor, causing the
excretion of numerous types of cytokine and eventually leading to
liver fibrosis. The prevention or delay of liver fibrosis, as well
as a scientific method for the monitoring and assessment of liver
fibrosis, are becoming increasingly studied for the interventional
therapy of HCC. Due to the cytotoxic effect of large doses of
chemotherapeutic drugs, tumor cells undergo necrosis or apoptosis
and a large number of collagen fibers are deposited in the
extracellular matrix of normal liver cells, resulting in a marked
decrease in the ADC value compared with the preoperative value. ADC
values were analyzed in non-tumor areas of the liver in the
conventional group and no significant difference was observed
between the postoperative and preoperative values following the
first TACE cycle. ADC values decreased following the second and
third surgeries (P<0.05), and after the fourth TACE cycle, the
ADC values had decreased significantly (P<0.01). The results
confirmed that repeated cycles of TACE with large doses of
chemotherapeutic drugs can aggravate the process of liver
fibrosis.
Kamada et al (16) indicated that hepatic cancer cells
were not sensitive to chemotherapeutic drugs, thus, reducing the
dose of chemotherapeutic agents had little effect on the recent and
forward curative effects. The present study analyzed ADC values in
non-tumor areas of the liver in low dose groups and no significant
difference was observed between the postoperative and preoperative
values following each TACE cycle (P>0.05). However, the ADC
values significantly decreased following the fourth surgery, as
compared with the value prior to the first TACE (P<0.05). Thus,
it is clear that ADC values exhibit no marked decrease following
surgery as a result of reducing the dose of chemotherapeutic drugs.
This observation further indicated that liver fibrosis had no or
little progression, thus, low doses of chemotherapeutic drugs in
TACE may improve the curative effect.
Correlation analysis was performed between the liver
fibrosis indexes and ADC values. Due to the limitations of liver
pathological examinations in the evaluation of liver fibrosis
(17,18), the use of four blood serum indexes
of liver fibrosis is generally accepted. The liver tissue
proliferation weakened, of which the indices level of liver
fibrosis increased as well as the serological index. Extracellular
matrix abnormal hyperplasia and deposition lead to an increase in
blood metabolites, which further induces the levels of serum liver
fibrosis indexes to increase. By contrast, the over-deposition of
extracellular matrix aggravates the barricade of the extracellular
space and limits the diffusing capacity of hydrone, causing the ADC
values to decrease. Previous studies (19,20)
have indicated that there is a correlation between ADC values and
serum HA levels. The present study identified a varying extent of
correlation between ADC values of liver non-tumor areas and serum
indicators, including HA, PCIII, C-IV and LN. In the conventional
group, the liver fibrosis indexes increased following the second,
third and fourth cycle of TACE (P<0.05), with HA increasing most
significantly (P<0.01). While in the low dose group, a
significant negative correlation was observed between HA levels and
ADC values, as analyzed with Pearson’s method (r=−0.535,
P<0.01); the result exhibited statistical significance.
In conclusion, the ADC value can not only be used to
evaluate the extent of liver fibrosis progression, but also with
its unconspicuous decline to indicate that it had slower or no
progress to liver fibrosis in patients with lower doses of
chemotherapeutics, and thus to improve the curative effect of
TACE.
References
|
1
|
Bakan AA, Inci E, Bakan S, Gokturk S and
Cimilli T: Utility of diffusion-weighted imaging in the evaluation
of liver fibrosis. Eur Radiol. 22:682–687. 2012. View Article : Google Scholar : PubMed/NCBI
|
|
2
|
Yin M, Talwalkar JA, Glaser KJ, et al:
Dynamic postprandial hepatic stiffness augmentation assessed with
MR elastography in patients with chronic liver disease. AJR Am J
Roentgenol. 197:64–70. 2011. View Article : Google Scholar : PubMed/NCBI
|
|
3
|
Do RK, Chandarana H, Felker E, et al:
Diagnosis of liver fibrosis and cirrhosis with diffusion-weighted
imaging: value of normalized apparent diffusion coefficient using
the spleen as reference organ. AJR Am J Roentgenol. 195:671–676.
2010. View Article : Google Scholar
|
|
4
|
Papanikolaou N, Gourtsoyianni S,
Yarmenitis S, Maris T and Gourtsoyiannis N: Comparison between
two-point and four-point methods for quantification of apparent
diffusion coefficient of normal liver parenchyma and focal lesions.
Value of normalization with spleen. Eur J Radiol. 73:305–309. 2010.
View Article : Google Scholar
|
|
5
|
Sandrasegaran K, Akisik FM, Lin C, et al:
Value of diffusion-weighted MRI for assessing liver fibrosis and
cirrhosis. AJR Am J Roentgenol. 193:1556–1560. 2009. View Article : Google Scholar : PubMed/NCBI
|
|
6
|
Gourtsoyianni S, Papanikolaou N,
Yarmenitis S, Maris T, Karantanas A and Gourtsoyiannis N:
Respiratory gated diffusion-weighted imaging of the liver: value of
apparent diffusion coefficient measurements in the differentiation
between most commonly encountered benign and malignant focal liver
lesions. Eur Radiol. 18:486–492. 2008. View Article : Google Scholar
|
|
7
|
Taouli B, Tolia AJ, Losada M, et al:
Diffusion-weighted MRI for quantification of liver fibrosis:
preliminary experience. AJR Am J Roentgenol. 189:799–806. 2007.
View Article : Google Scholar : PubMed/NCBI
|
|
8
|
Ismail MH and Pinzani M: Reversal of liver
fibrosis. Saudi J Gastroenterol. 15:72–79. 2009. View Article : Google Scholar
|
|
9
|
Faria SC, Ganesan K, Mwangi I, et al: MR
imaging of liver fibrosis: current state of the art. Radiographics.
29:1615–1635. 2009. View Article : Google Scholar : PubMed/NCBI
|
|
10
|
Eccles CL, Haider EA, Haider MA, Fung S,
Lockwood G and Dawson LA: Change in diffusion weighted MRI during
liver cancer radiotherapy: preliminary observations. Acta Oncol.
48:1034–1043. 2009. View Article : Google Scholar : PubMed/NCBI
|
|
11
|
Lewin M, Poujol-Robert A, Boëlle PY, et
al: Diffusion-weighted magnetic resonance imaging for the
assessment of fibrosis in chronic hepatitis C. Hepatology.
46:658–665. 2007. View Article : Google Scholar : PubMed/NCBI
|
|
12
|
Wang Y, Ganger DR, Levitsky J, et al:
Assessment of chronic hepatitis and fibrosis: comparison of MR
elastography and diffusion-weighted imaging. AJR Am J Roentgenol.
196:553–561. 2011. View Article : Google Scholar : PubMed/NCBI
|
|
13
|
Sun J, Shi YX, Zhang ZY, Zhang ZQ, Wu JT
and Wan HY: Combination of MRI ADC value and biochemical indicators
for the assessment of fibrosis in chronic hepatitis: Preliminary
results. Lin Chuang Fang She Xue Za Zhi. 43:616–619. 2010.(In
Chinese).
|
|
14
|
Binkovitz LA, El-Youssef M, Glaser KJ, Yin
M, Binkovitz AK and Ehman RL: Pediatric MR elastography of hepatic
fibrosis: principles, technique and early clinical experience.
Pediatr Radiol. 42:402–409. 2012. View Article : Google Scholar : PubMed/NCBI
|
|
15
|
Kamel IR, Bluemke DA, Ramsey D, et al:
Role of diffusion weighted imaging in estimating tumor necrosis
after chemoembolization of hepatocellular carcinoma. AJR Am J
Roentgenol. 181:708–710. 2003. View Article : Google Scholar : PubMed/NCBI
|
|
16
|
Kamada K, Nakanishi T, Kitamoto M, et al:
Long-term prognosis of patients undergoing transcatheter arterial
chemoembolization for unresectable hepatocellular carcinoma:
comparison of cisplatin lipiodol suspension and doxorubicin
hydrochloride emulsion. J Vasc Interv Radiol. 12:847–854. 2001.
View Article : Google Scholar
|
|
17
|
Aguirre DA, Behling CA, Alpert E,
Hassanein TI and Sirlin CB: Liver fibrosis: noninvasive diagnosis
with double contrast material-enhanced MR imaging. Radiology.
239:425–437. 2006. View Article : Google Scholar : PubMed/NCBI
|
|
18
|
Aubé C, Racineux PX, Lebigot J, et al:
Diagnosis and quantification of hepatic fibrosis with diffusion
weighted MR imaging: preliminary results. J Radiol. 85:301–306.
2004.(In French).
|
|
19
|
Koinuma M, Ohashi I, Hanafusa K and
Shibuya H: Apparent diffusion coefficient measurements with
diffusion-weighted magnetic resonance imaging for evaluation of
hepatic fibrosis. J Magn Reson Imaging. 22:80–85. 2005. View Article : Google Scholar
|
|
20
|
Taouli B and Koh DM: Diffusion-weighted MR
imaging of the liver. Radiology. 254:47–66. 2010. View Article : Google Scholar : PubMed/NCBI
|