Introduction
The natural course of type 2 diabetes mellitus
(T2DM) is longer than that observed in the clinic, and consists of
progression from normal glucose tolerance (NGT) to impaired glucose
tolerance (IGT), ultimately leading to T2DM. Among individuals with
hyperglycemia, early insulin secretion has been shown to decrease
by 27% from NGT to IGT, and decrease by an additional 51% from IGT
to T2DM (1). Progressive
deterioration of pancreatic β-cell function and the worsening of
hyperglycemia over time are the basic characteristics of T2DM.
Intensive insulin treatment (IIT) can decrease the endogenous
secretory demand on β-cells, which may lead to the recovery of
β-cell function and possibly prevent further loss of β-cell mass
(2,3). A series of studies have confirmed
that the early implementation of IIT can markedly improve β-cell
function in the majority of patients with newly diagnosed T2DM
(4–6). Furthermore, the early recovery of
β-cell function and glycemic control through IIT improves
unsatisfactory metabolic outcomes and reduces the risk of diabetic
complications (7,8). In the Steno-2 study and UK
Prospective Diabetes Study, patients exhibiting near-normal
glycemic control from the diagnosis of T2DM were reported to have a
lower long-term cardiovascular mortality rate compared with
patients with worse initial control (9,10).
However, the mechanisms responsible for this disease-modifying
effect remain unclear.
It is well recognized that impaired first-phase
insulin secretion is an early marker of β-cell dysfunction, and
also an independent and additive predictor of the progression of
diabetes. At present, glucotoxicity is considered to restrict
first-phase insulin secretion, leading to decreased second-phase
insulin secretion and potentially an increased rate of β-cell
apoptosis (11,12). Full or partial recovery of
first-phase insulin secretion may aid long-term maintenance of good
glycemic control. Weng et al previously reported that
first-phase insulin secretion was partially restored following the
completion of intensive therapy, and the improvement in β-cell
function was associated with the persistence of euglycemia for one
year (13).
T2DM is a multi-factorial disease associated with
several possible risk factors, including life style, increasing
age, insulin resistance, family history (FH) of diabetes and
ethnicity. FH is known to be an important independent risk factor
for T2DM, and is ascribed to shared genes and a shared environment
(14,15). The probability of developing T2DM
is two to four fold higher for individuals with a positive FH
compared with those without, depending on the number of affected
family members and their relationship to the patient (16–18).
However, the affected degree and exact mechanism are not clear.
In the present prospective study, the differences in
first-phase insulin secretion and the effect of ITT on the
improvement of β-cell function were investigated and compared in
newly diagnosed T2DM patients with or without a FH of diabetes.
Materials and methods
Patients
Patients with newly diagnosed T2DM were recruited
from outpatient and inpatient clinics of the Department of
Endocrinology at the Affiliated Hospital of Medical College,
Qingdao University (Qingdao, China), between January 2011 and
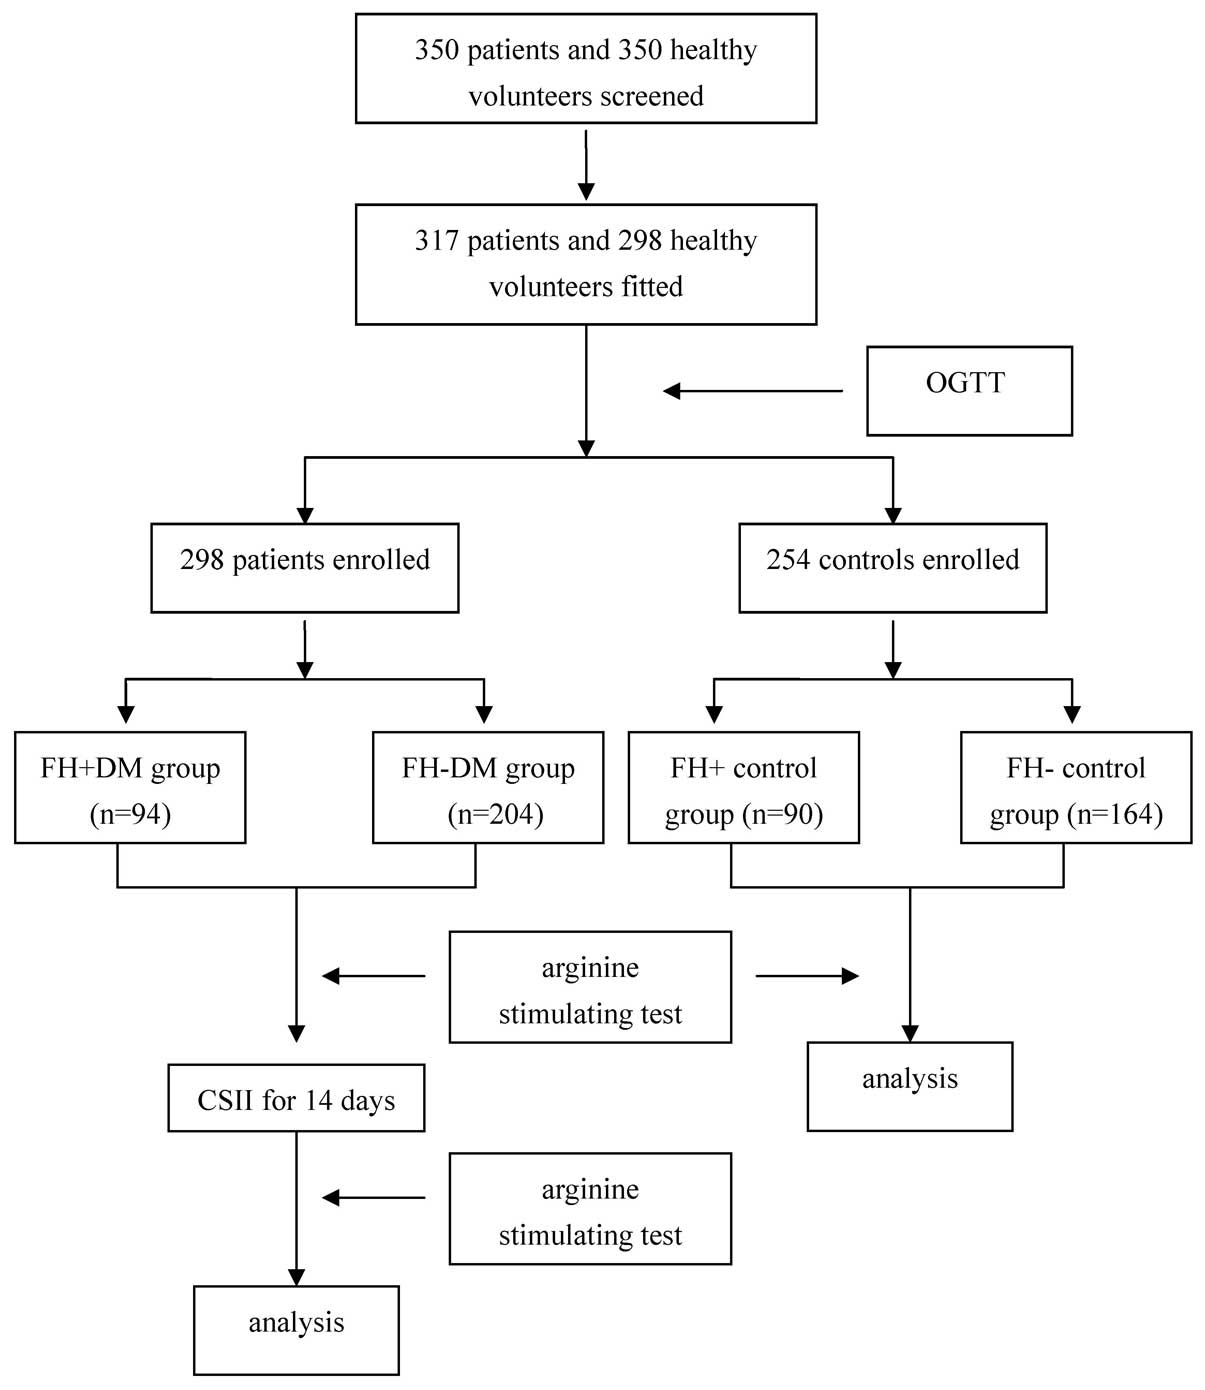
January 2013. In total, 360 patients were screened for enrollment.
Of those patients, 307 patients met the inclusion criteria and were
personally interviewed, with 300 patients ultimately enrolled in
the study. Patients were divided into two groups according to their
FH of diabetes. A total of 95 patients comprised the positive FH
group (FH+ DM group), while the remaining 205 patients participated
in negative FH group (FH- DM group). A positive FH was defined as a
direct or collateral relative with DM within three generations of
the patient from the maternal or paternal side. Individuals that
had undergone a health examination in our hospital were screened as
controls and 256 healthy volunteers were enrolled in the study. All
the controls were divided into two groups according to their FH of
diabetes. In total, 91 participants were included in the positive
FH group (FH+ control group), while the remaining 165 healthy
volunteers comprised the negative FH group (FH- control group). All
the participants were subsequently enrolled and underwent treatment
until March 2013 at the Department of Endocrinology at the
Affiliated Hospital of Medical College, Qingdao University. The
study protocol was approved by the Ethical Committee of the
Affiliated Hospital of Medical College, Qingdao University, and
informed consent, according to the Declaration of Helsinki, was
provided by every participant.
Male and female patients, aged between 30 and 60
years, were included in the study. All the patients had received a
clinical and laboratory diagnosis of T2DM, according to the
criteria of the American Diabetes Association (19), and were newly diagnosed without
having undergone antidiabetic therapy. Patients with type 1 or
other types of diabetes, or T2DM complicated with diabetic
nephropathy or diabetic retinopathy, sustained hypertension,
unstable angina or stroke, recent myocardial infarction (<6
months), heart failure, peripheral vascular disease, acute or
chronic infections, cancer, hepatic or renal disease and mental
disorders were excluded from the study. In addition, patients were
excluded if pregnant or breast-feeding, or receiving medications
affecting glucose and insulin levels.
The control groups comprised male and female
patients aged between 30 and 60 years. Each volunteer had been
found to have a normal glucose tolerance via an oral glucose
tolerance test (OGTT). Volunteers with any types of diabetes,
sustained hypertension, unstable angina or stroke, recent
myocardial infarction (<6 months), heart failure, peripheral
vascular disease, acute or chronic infections, cancer, pregnancy or
breast-feeding, hepatic or renal disease, mental disorders or those
receiving medications affecting glucose and insulin levels were
excluded from the study.
Treatment procedure
Prior to enrollment, the diabetic and control
subjects underwent careful physical examinations and detailed
laboratory examinations to exclude any condition that may interfere
with glucose tolerance. Subsequently, β-cell function was evaluated
in the controls using an arginine stimulation test.
All the patients were admitted to hospital and
recommended a diabetic diet and an exercise routine (walking or
similar for 1 h three times per week during the entire study). For
two weeks, the patients underwent ITT with continuous subcutaneous
insulin infusion (CSII) to reach and maintain an excellent glycemic
control, which was defined as a fasting blood glucose level of
<5.6 mmol/l and a postprandial blood glucose level of <7.8
mmol/l. At day two after the termination of ITT, and without
administration of additional medications that may have affected the
glucose and insulin levels, the β-cell function was reassessed
(Fig. 1).
Measurement
Upon enrollment, the medical history, body weight,
height, blood pressure, waist circumference, hip circumference,
body mass index (BMI) and waist to hip ratio were recorded for each
patient. The waist circumferences were measured to the nearest 0.1
cm at the narrowest point between the lowest rib and the uppermost
lateral border of the right iliac crest. Blood pressure was
measured in the supine position on the right arm three times using
a mercury manometer (Mercury Sphygmomanometer SB3001A; Wenzhou
Doctor Medical Device Co., Ltd., Wenzhou, China) following a 20-min
rest, and the mean of three measurements was used for analysis. The
BMI was calculated as the weight divided by the squared height
(kg/m2).
Levels of fasting plasma glucose (FPG), postprandial
plasma glucose (PPG), glycosylated hemoglobin (HbA1c), glutamic
acid decarboxylase antibody, free fatty acid (FFA), insulin and
C-peptide, as well as the lipid profile and the first-phase insulin
secretion, were measured prior to CSII and at day two following
insulin cessation with a 10-h overnight fast. The PPG level was
measured at 2 h after the main meals in hospital. OGTT was
performed according to the World Health Organization standard
(20). After 10–12 h of overnight
fasting, subjects ingested a solution containing 75 g dextrose over
a 5-min period. Venous blood samples were collected at 0, 30, 60
and 120 min for the determination of plasma glucose by an automated
glucose oxidase method (Glucose Analyzer 2; Beckman Instruments,
Fullerton, CA, USA) according to the manufacturer’s
instructions.
First-phase insulin secretion was assessed with an
arginine stimulation test at 8:00am, after a 10–12-h overnight
fast. A 25% solution of L-arginine (5 g/20 ml; Shanghai Xinyi
Jinzhu Pharmaceutical Co., Ltd., Shanghai, China) was infused
intravenously in 30 sec. Blood samples for the determination of
serum insulin and C-peptide levels were collected prior to
initiating the infusion and at 2, 4 and 6 min after the infusion.
Serum samples were measured using the Roche Modular system and an
electrochemiluminescence immunoassay kit (Roche Diagnostics GmbH,
Mannheim, Germany). This assay shows 0.05% cross-reactivity to
intact human proinsulin and the primary circulating split form, des
31,32-proinsulin.
Calculations
Based on the updated homeostasis model assessment
(HOMA) methods, the HOMA insulin resistance (HOMA2-IR) and HOMA
β-cell insulin secretion (HOMA2-%β) were calculated using HOMA2
calculator version 2.2 software (http://www.dtu.ox.ac.uk/homacalculator/index.php).
The estimated first-phase insulin secretion was assessed by the
first-phase peak ratio as follows: Peak insulin/fasting
insulin.
Adverse events
Adverse events were documented throughout the study.
Weight was assessed using a medical scale (HW600B, Zhengzhou
Kaiyuan Electronic Co., Ltd., Zhengzhou, China) to avoid errors.
Mild hypoglycemic episodes were defined as symptoms indicative of
low blood glucose, accompanied by a documented capillary blood
glucose value of ≤70 mg/dl. Severe hypoglycemia was defined as
symptoms of hypoglycemia that required assistance from another
individual for treatment, regardless of the capillary blood glucose
level.
Statistical analysis
Statistical analysis was performed using SPSS 17.0
software (SPSS, Inc., Chicago, IL, USA). Data are presented as the
mean ± standard error of the mean. Parameters that did not fulfill
normal distribution were mathematically transformed to improve the
symmetry for subsequent analyses. Baseline characteristics of the
T2DM and control subjects were compared using the independent
sample t-test or χ2 test. The differences between
variables prior to and following intensive glycemic control in the
T2DM subgroup were analyzed for significance using a paired sample
t-test. The associations between variables were analyzed by simple
correlation (Pearson’s or Spearman’s correlation analysis) and
multiple regression in a stepwise forward manner. All the
statistical analyses were two-sided and P<0.05 was considered to
indicate a statistically significant difference.
Results
Subject characteristics
In total, 300 patients with newly diagnosed T2DM and
256 healthy volunteers completed this study. Their baseline data
are summarized in Table I. No
statistically significant differences were observed with regard to
the age, gender, BMI, systolic blood pressure, diastolic blood
pressure, and levels of triglyceride, total cholesterol,
high-density lipoprotein-cholesterol and low density
lipoprotein-cholesterol between the T2DM groups and the respective
control groups prior to treatment. However, the levels of HbA1c,
blood glucose, FFA and HOMA2-IR in the FH+ DM group and FH- DM
group were higher when compared with the respective FH+ and FH-
control groups (P<0.05). In addition, the HOMA2-%β in the FH+ DM
and FH- DM groups was markedly lower compared with the FH+ and FH-
control groups (P<0.05). No statistically significant
differences were observed in age, HbA1c, FPG, PPG, HOMA2-%β and
HOMA2-IR between the FH+ DM and FH- DM groups. However, the
HOMA2-%β was found to be higher in the FH- control group when
compared with the FH+ control group (P=0.043).
 | Table IPatient baseline characteristics in
the four groups. |
Table I
Patient baseline characteristics in
the four groups.
| Characteristics | FH+ DM group | FH- DM group | FH+ control
group | FH- control
group |
|---|
| Male/female (n) | 61/34 | 135/70 | 56/35 | 103/62 |
| Age (years) | 46.04±8.63 | 46.63±7.87 | 47.44±5.65 | 46.40±6.31 |
| BMI
(kg/m2) | 27.04±5.80 | 26.80±3.53 | 26.76±3.65 | 27.30±2.39 |
| SBP (mmHg) | 131±15 | 129±15 | 128±15 | 130±19 |
| DBP (mmHg) | 86±10 | 84±10 | 84±11 | 85±11 |
| TG (mmol/l) | 2.84±4.33 | 2.73±2.98 | 2.75±0.36 | 2.82±0.46 |
| TC (mmol/l) | 5.31±1.52 | 5.20±2.23 | 5.33±0.50 | 5.04±0.92 |
| HDL-c (mmol/l) | 1.25±0.03 | 1.21±0.37 | 1.29±0.34 | 1.32±0.14 |
| LDL-c (mmol/l) | 3.64±1.17 | 3.67±1.23 | 3.57±0.56 | 3.54±0.78 |
| HbA1c (%) | 8.34±2.10a | 8.51±2.37a | 5.21±1.19 | 5.39±1.31 |
| FPG (mmol/l) | 10.48±3.68a | 9.94±1.99a | 5.22±0.46 | 5.15±0.50 |
| PPG (mmol/l) | 13.67±4.35a | 13.16±6.21a | 6.35±1.56 | 6.84±1.24 |
| FFA (mmol/l) | 0.84±0.68a | 0.87±0.96a | 0.57±0.17 | 0.58±0.24 |
| HOMA2-IR | 2.47±1.09a | 2.35±1.06a | 1.51±0.66 | 1.43±0.42 |
| HOMA2-%β | 34.58±7.92a | 35.15±9.68a | 70.91±15.3 | 78.67±16.84b |
First-phase insulin secretion prior to
therapy
Fasting insulin levels in the FH+ DM and FH- DM
groups were significantly higher compared with the levels in the
respective FH+ and FH- control groups (P<0.05), while there was
no significant statistical difference observed between the FH+ DM
group and FH- DM groups (10.49±6.14 vs. 10.01±6.47; P=0.135).
Following an infusion of arginine, insulin secretion reached the
highest level at 2 min, after which the insulin levels began to
decrease. The first-phase peak ratios in the FH+ DM group, FH- DM
group and FH+ and FH- control groups were 5.03, 5.23, 7.29 and
8.88, respectively. The first-phase peak ratios in the FH+ DM and
FH- DM groups were significantly lower compared with the FH+ and
FH- control groups (P<0.05). Compared with the FH- control
group, the first-phase peak ratio in the FH+ control group was
statistically lower (P=0.023), while no statistically significant
difference was observed between the FH+ DM and FH- DM groups
(Table II).
| Table IIFirst-phase peak ratio in the four
groups following L-arginine infusion. |
Table II
First-phase peak ratio in the four
groups following L-arginine infusion.
| Parameter | FH+ DM group | FH- DM group | FH+ control
group | FH- control
group |
|---|
| Insulin
(mIU/l) |
| 0 min | 10.49±6.14a | 10.01±6.47a | 5.83±2.57 | 5.41±1.83 |
| 2 min | 49.11±29.35 | 53.10±29.99 | 47.64±16.60 | 47.89±18.54 |
| 4 min | 35.42±21.61 | 39.33±20.72 | 33.95±12.59 | 36.70±16.59 |
| 6 min | 25.98±14.61 | 23.02±13.49 | 27.57±9.42 | 27.26±14.01 |
| Peak ratio | 5.03±2.51 | 5.23±2.47 | 7.29±3.79a | 8.88±3.32a,b |
Effect of CSII on glycemic control
Prior to treatment with CSII, the blood glucose
levels were high in the diabetic patients, with an average FPG of
10.48±3.68 mmol/l in the FH+ DM group and 9.94±1.99 mmol/l in the
FH- DM group. In addition, the average PPG level was 13.67±4.35
mmol/l in the FH+ DM group and 13.16±6.21 mmol/l in the FH- DM
group, while the average level of HbA1c was 8.34±2.10% in the FH+
DM group and 8.51±2.37% in the FH- DM group. Following treatment
with CSII, all the patients achieved excellent blood glucose
control in 6.2±3.6 days. The FPG and PPG levels were significantly
reduced (FGP: FH+ DM group, 10.48±3.68 vs. 5.38±0.6 mmol/l; FH- DM
group, 9.94±1.99 vs. 5.56±1.77 mmol/l; PPG: FH+ DM group,
13.67±4.35 vs. 6.89±1.05 mmol/l; FH- DM group, 13.16±6.21 vs.
6.76±0.43 mmol/l; P<0.05), with an average daily insulin dose of
0.8 U/kg (range, 0.32–1.46 U/kg).
Effect of CSII on insulin resistance and
β-cell function
At day two following the end of therapy, the fasting
insulin levels of the patients in the FH+ DM group and FH- DM group
were lower compared with the value prior to therapy (FH+ DM group,
8.69±3.22 vs. 10.49±6.14 mIU/l; FH- DM group, 8.46±3.55 vs.
10.01±6.47 mIU/l; P=0.013 and 0.022, respectively), while the
first-phase peak ratios in the two groups were higher than the
value prior to treatment (FH+ DM group, 5.75±2.04 vs. 5.03±2.51;
FH- DM group, 6.17±2.42 vs. 5.23±2.47; P=0.037 and 0.042,
respectively). The first-phase peak ratio in the FH- DM group was
higher compared with the FH+ DM group (P=0.049), as shown in
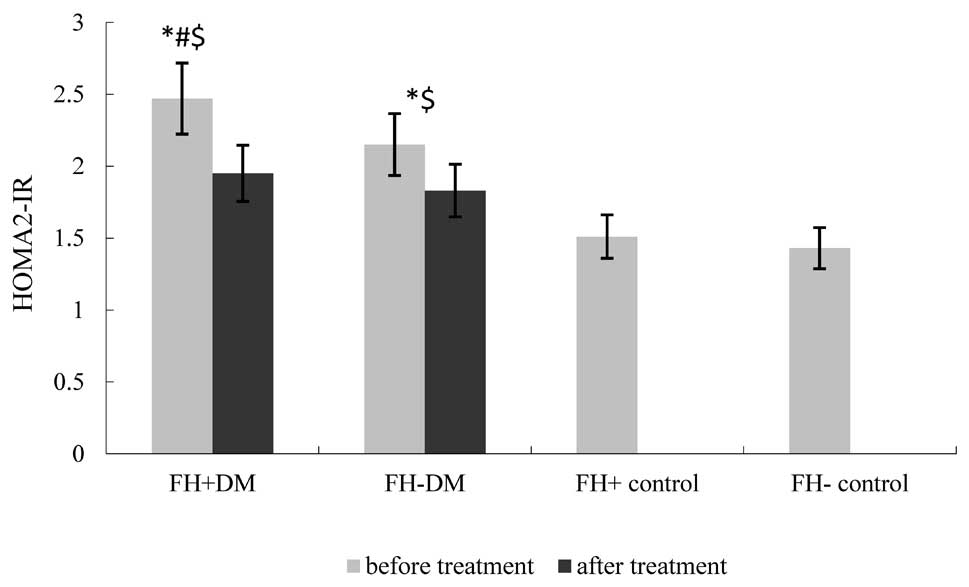
Table III and Fig. 2. The HOMA2-IR in the FH+ DM group
and FH- DM group was lower compared with the value prior to CSII
(FH+ DM group, 1.95±0.62 vs. 2.47±1.09; FH- DM group, 1.83±0.45 vs.
2.15±1.06; P=0.024 and 0.019, respectively); however, no
statistically significant difference was observed between the two
diabetic groups (Fig. 3). The
HOMA2-%β in the FH+ DM and FH- DM groups was higher compared with
the value prior to therapy (FH+ DM group, 63.37±17.25 vs.
35.15±9.68; FH- DM group, 70.23±19.7 vs. 34.58±7.92; P=0.023 and
0.019, respectively). The HOMA2-%β in the FH+ DM group was lower
compared with the FH- DM group (P=0.027; Fig. 2).
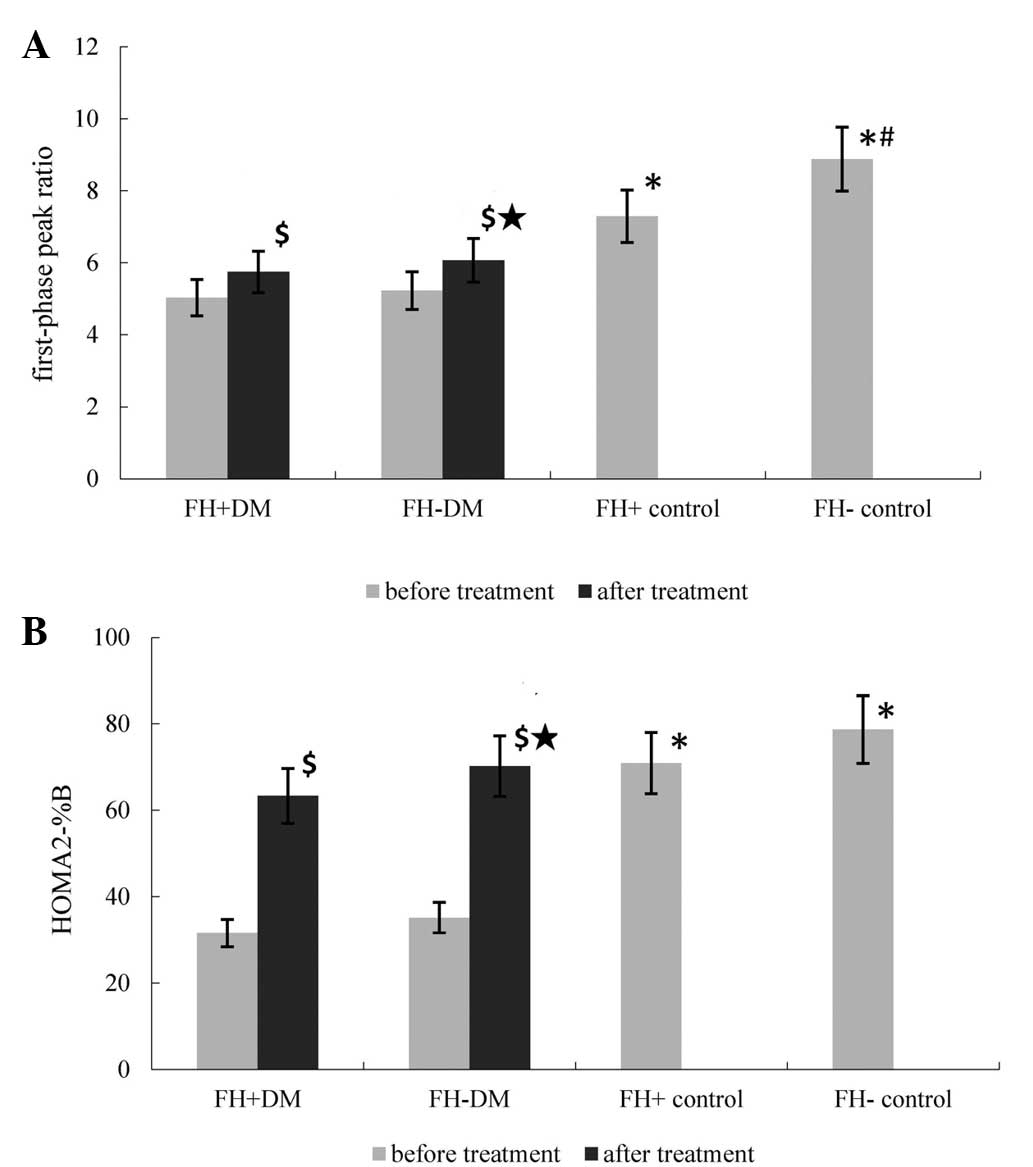 | Figure 2Differences in the (A) first-phase
peak ratio and (B) HOMA2-%β among the groups. Prior to treatment,
the first-phase peak ratio and HOMA2-%β were markedly lower in the
FH+ DM and FH- DM groups when compared with the FH+ and FH- control
groups (*P<0.05). Compared with the FH- control
group, the first-phase peak ratio in the FH+ control group was
significantly lower (#P=0.023). Following CSII, the
first-phase peak ratio and HOMA2-%β were higher in the DM groups
compared with the value pretreatment ($P=0.037, 0.042,
0.023 and 0.019, vs. pretreatment value for the first-phase peak
ratio and HOMA2-%β in the FH+ DM and FH- DM groups, respectively).
The first-phase peak ratio and HOMA2-%β were higher in the FH- DM
group compared with the FH+ DM group («P=0.044 and
0.027, respectively). FH, family history; DM, diabetes mellitus;
HOMA2-%β, homeostasis model assessment of β-cell insulin secretion;
CSII, continuous subcutaneous insulin infusion. |
| Table IIIClinical characteristics of the
patients in the DM groups following CSII. |
Table III
Clinical characteristics of the
patients in the DM groups following CSII.
| Parameter | FH+ DM group | FH- DM group |
|---|
| FPG (mmol/l) | 5.38±0.6 | 5.56±1.77 |
| PPG (mmol/l) | 6.89±1.05 | 6.76±0.43 |
| Insulin
(mIU/l) |
| 0 min | 8.69±3.22 | 8.46±3.55 |
| 2 min | 40.38±26.45 | 53.49±30.87 |
| 4 min | 26.48±35.53 | 24.05±10.26 |
| 6 min | 19.75±17.66 | 15.70±6.62 |
| Peak ratio | 5.75±2.04 | 6.17±2.42a |
| HOMA2-IR | 1.95±0.62 | 1.83±0.45 |
| HOMA2-%β | 63.37±17.25 | 70.23±19.7b |
Adverse events
No severe adverse events occurred during the study
period. Mild symptoms of hypoglycemia were observed in 27 patients;
however, following ingestion of a 20-g cracker, the symptoms were
relieved.
Discussion
A FH of diabetes is not only a risk factor for the
disease, but is also positively associated with risk awareness.
Individuals with or without a FH of T2DM have been shown to have
different pathophysiological characteristics during disease
progression (15). In immediate
relatives of individuals with T2DM, insulin resistance has been
shown to already exist when the glucose levels are normal, and
dysfunction in insulin secretion has been found to be a key factor
in determining the progression of glucose intolerance (21,22).
In the present study, the HOMA2-IR in the FH+ control group was
comparable with the FH- group, while the HOMA2-%β and first-phase
peak ratio were lower compared with the FH- control group,
indicating that immediate relatives of individuals with T2DM
already exhibit impaired β-cell function despite being
euglycemic.
The progressive deterioration of insulin secretory
function in individuals with T2DM is accompanied by a loss of
β-cell mass. However, the precise pathological mechanisms leading
to β-cell failure are yet to be fully elucidated. A number of
factors, including glucotoxicity, lipotoxicity, islet inflammation
and amyloid deposition, have been implicated as potentially
contributing to this process. The strategy of administering a short
course of IIT has been studied in patients with newly diagnosed
T2DM (23–25). These studies demonstrated that
short-term IIT, delivered by multiple daily injections or CSII, can
significantly improve β-cell function in the majority of newly
diagnosed patients. In the present study, the therapeutic effect
was further confirmed on newly diagnosed T2DM patients with and
without a FH of T2DM.
The mechanism by which ITT may improve β-cell
function remains unclear. The elimination of glucotoxicity may not
be the sole basis for this improvement, and other properties of
insulin, including its antilipolytic, anti-inflammatory and
antiapoptotic effects, may also contribute to the improved β-cell
function (6,8). Li et al used a rat model of
diabetes, induced by streptozotocin and high-fat feeding, to
investigate the protective role of insulin on β-cell function. The
authors found that insulin therapy was able to improve β-cell
function, markedly reduce the islet fat content and increase the
β-cell area through decreasing the rate of apoptosis and increasing
the rate of β-cell proliferation (26).
In the present study, all the patients achieved good
glycemic control within a mean duration of six days following CSII.
The fasting insulin levels, first-phase peak ratio, HOMA2-IR and
HOMA2-%β in the patients were all markedly improved compared with
the values prior to therapy, which indicated that insulin
resistance and β-cell function had been improved. Weng et al
previously demonstrated that improvements in β-cell function were
associated with the persistence of euglycemia for one year, and
suggested that the preservation of first-phase insulin secretion is
likely to contribute to the higher rates of remission achieved with
ITT (13). However, further study
is required to confirm this hypothesis.
In the present study, following treatment with CSII
and delamination by FH, the HOMA2-%β and first-phase peak ratio
were found to be markedly higher than the levels prior to therapy,
but remained lower compared with the FH- DM group. In addition, the
HOMA2-IR in the FH+ DM group was markedly lower compared with the
pretreatment value and comparative with the FH- DM group. These
results indicate that defects in β-cell secretion and insulin
sensitivity in T2DM patients with a FH of the disease were more
severe compared with T2DM patients without a FH.
A limitation of the current study was the absence of
a long-term follow-up period; thus, the durability of the
beneficial effect of short-term CSII on β-cell function and
glycemic control in T2DM patients remains to be defined. An
additional limitation was the use of surrogate indices (e.g.
euglycemic hyperinsulinemic glucose clamp) for the assessment of
insulin secretion and insulin sensitivity.
In conclusion, the present study investigated the
differences in response to ITT between T2DM and healthy controls
with or without a FH of diabetes. T2DM patients, irrespective of
their FH, were found to have a good response to CSII via the
improvement of insulin resistance and β-cell function. However, the
improvements observed in patients with a FH of diabetes were less
significant compared with the T2DM patients without a FH. In
addition, for the healthy individuals included in the study, a FH
of T2DM was shown to have an important effect on disease
progression.
Acknowledgements
The authors thank all the subjects who participated
in the study.
References
|
1
|
Polonsky KS, Sturis J and Bell GI:
Seminars in medicine of the Beth Israel Hospital, Boston.
Non-insulin dependent diabetes mellitus - a genetically programmed
failure of the beta cell to compensate for insulin resistance. N
Engl J Med. 334:777–783. 1996. View Article : Google Scholar : PubMed/NCBI
|
|
2
|
Retnakaran R and Zinman B: Short-term
intensified insulin treatment in type 2 diabetes: long-term effects
on β-cell function. Diabetes Obes Metab. 14(Suppl 3): 161–166.
2012. View Article : Google Scholar
|
|
3
|
Tian J, Wang J, Li Y, et al: Endothelial
function in patients with newly diagnosed type 2 diabetes receiving
early intensive insulin therapy. Am J Hypertens. 25:1242–1248.
2012.PubMed/NCBI
|
|
4
|
Harrison LB, Adams-Huet B, Raskin P and
Lingvay I: β-cell function preservation after 3.5 years of
intensive diabetes therapy. Diabetes Care. 35:1406–1412. 2012.
View Article : Google Scholar : PubMed/NCBI
|
|
5
|
Fukui T and Hirano T: High-density
lipoprotein subspecies between patients with type 1 diabetes and
type 2 diabetes without/with intensive insulin therapy. Endocr J.
59:561–569. 2012. View Article : Google Scholar
|
|
6
|
Chen A, Huang Z, Wan X, et al: Attitudes
toward diabetes affect maintenance of drug-free remission in
patients with newly diagnosed type 2 diabetes after short-term
continuous subcutaneous insulin infusion treatment. Diabetes Care.
35:474–481. 2012. View Article : Google Scholar : PubMed/NCBI
|
|
7
|
Fang D, Guan H, Liu J, et al: Early
intensive insulin therapy attenuates the p38 pathway in the renal
cortex and indices of nephropathy in diabetic rats. Endocr J.
59:81–90. 2012. View Article : Google Scholar
|
|
8
|
Dailey G: Early and intensive therapy for
management of hyperglycemia and cardiovascular risk factors in
patients with type 2 diabetes. Clin Ther. 33:665–678. 2011.
View Article : Google Scholar : PubMed/NCBI
|
|
9
|
Holman RR, Paul SK, Bethel MA, Matthews DR
and Neil HA: 10-year follow-up of intensive glucose control in type
2 diabetes. N Engl J Med. 359:1577–1589. 2008. View Article : Google Scholar : PubMed/NCBI
|
|
10
|
Gaede P, Lund-Andersen H, Parving HH and
Pedersen O: Effect of a multifactorial intervention on mortality in
type 2 diabetes. N Engl J Med. 358:580–591. 2008. View Article : Google Scholar : PubMed/NCBI
|
|
11
|
Hu Y, Li L, Xu Y, et al: Short-term
intensive therapy in newly diagnosed type 2 diabetes partially
restores both insulin sensitivity and β-cell function in subjects
with long-term remission. Diabetes Care. 34:1848–1853. 2011.
View Article : Google Scholar : PubMed/NCBI
|
|
12
|
Shah PK, Mudaliar S, Chang AR, et al:
Effects of intensive insulin therapy alone and in combination with
pioglitazone on body weight, composition, distribution and liver
fat content in patients with type 2 diabetes. Diabetes Obes Metab.
13:505–510. 2011. View Article : Google Scholar : PubMed/NCBI
|
|
13
|
Weng J, Li Y, Xu W, et al: Effect of
intensive insulin therapy on beta-cell function and glycaemic
control in patients with newly diagnosed type 2 diabetes: a
multicentre randomised parallel-group trial. Lancet. 371:1753–1760.
2008. View Article : Google Scholar : PubMed/NCBI
|
|
14
|
Valdez R, Yoon PW, Liu T and Khoury MJ:
Family history and prevalence of diabetes in the U.S. population:
the 6-year results from the National Health and Nutrition
Examination Survey (1999–2004). Diabetes Care. 30:2517–2522. 2007.
View Article : Google Scholar : PubMed/NCBI
|
|
15
|
Li P, Zhang JF, Li L, et al: The impact of
a family history of type 2 diabetes on insulin secretion and
insulin sensitivity in individuals with varying glucose tolerance.
Am J Med Sci. 345:22–27. 2013. View Article : Google Scholar
|
|
16
|
Xia Z, Wang Z, Cai Q, et al: Prevalence
and risk factors of type 2 diabetes in the adults in Haikou city,
Hainan island, China. Iran J Public Health. 42:222–230.
2013.PubMed/NCBI
|
|
17
|
Oh YJ, Nam HK, Rhie YJ, Park SH and Lee
KH: Low serum adiponectin levels in Korean children with a family
history of type 2 diabetes mellitus. Horm Res Paediatr. 77:382–387.
2012. View Article : Google Scholar : PubMed/NCBI
|
|
18
|
Das M, Pal S and Ghosh A: Family history
of type 2 diabetes and prevalence of metabolic syndrome in adult
Asian Indians. J Cardiovasc Dis Res. 3:104–108. 2012. View Article : Google Scholar : PubMed/NCBI
|
|
19
|
Lambert M: ADA releases revisions to
recommendations for standards of medical care in diabetes. Am Fam
Physician. 85:514–515. 2012.PubMed/NCBI
|
|
20
|
Bhowmik B, Diep LM, Munir SB, et al:
HbA(1c) as a diagnostic tool for diabetes and pre-diabetes: the
Bangladesh experience. Diabet Med. 30:e70–e77. 2013. View Article : Google Scholar
|
|
21
|
Praveen EP, Sahoo J, Khurana ML, et al:
Insulin sensitivity and β-cell function in normoglycemic offspring
of individuals with type 2 diabetes mellitus: Impact of line of
inheritance. Indian J Endocrinol Metab. 16:105–111. 2012.
View Article : Google Scholar : PubMed/NCBI
|
|
22
|
Zengi A, Ercan G, Caglayan O, et al:
Increased oxidative DNA damage in lean normoglycemic offspring of
type 2 diabetic patients. Exp Clin Endocrinol Diabetes.
119:467–471. 2011. View Article : Google Scholar : PubMed/NCBI
|
|
23
|
Retnakaran R, Qi Y, Opsteen C, Vivero E
and Zinman B: Initial short-term intensive insulin therapy as a
strategy for evaluating the preservation of beta-cell function with
oral antidiabetic medications: a pilot study with sitagliptin.
Diabetes Obes Metab. 12:909–915. 2010. View Article : Google Scholar : PubMed/NCBI
|
|
24
|
Opsteen C, Qi Y, Zinman B and Retnakaran
R: Effect of short-term intensive insulin therapy on quality of
life in type 2 diabetes. J Eval Clin Pract. 18:256–261. 2012.
View Article : Google Scholar
|
|
25
|
Chon S, Oh S, Kim SW, et al: The effect of
early insulin therapy on pancreatic β-cell function and long-term
glycemic control in newly diagnosed type 2 diabetic patients.
Korean J Intern Med. 25:273–281. 2010. View Article : Google Scholar : PubMed/NCBI
|
|
26
|
Li HQ, Wang BP, Deng XL, et al: Insulin
improves β-cell function in glucose-intolerant rat models induced
by feeding a high-fat diet. Metabolism. 60:1566–1574. 2011.
View Article : Google Scholar : PubMed/NCBI
Zengi A, Ercan G, Caglayan O, et al:
Increased oxidative DNA damage in lean normoglycemic offspring of
type 2 diabetic patients. Exp Clin Endocrinol Diabetes.
119:467–471. 2011. View Article : Google Scholar : PubMed/NCBI
|