Introduction
Pharmacological stress testing in conjunction with
radionuclide myocardial perfusion imaging has been used as an
alternative to dynamic exercise testing for the detection of
coronary artery disease and risk stratification in patients who are
unable to perform adequate levels of exercise (1–3).
Adenosine is the most widely used agent due to its rapid onset of
action and short half-life (<10 sec), which allows for dose
titration. However, a number of side effects are frequently
observed following the intravenous infusion of adenosine. In
addition to flushing, nausea and dyspnea, arrhythmia is the most
common side effect due to the negative chronotropic effect of
adenosine (4–7). Although previous studies have
demonstrated the overall safety of adenosine stress testing
(8,9), specific electrocardiographic
alterations during the process have been rarely described. In
addition, whether the newly occurred arrhythmic events are within
safe limits or whether they are indications of ischemia or/and are
life-threatening is yet to be investigated. Moreover, whether
adenosine infusion should be suspended upon the occurrence of
severe arrhythmic events, including second degree (II°) and third
degree (III°) atrioventricular block (AVB) or sinoatrial block
(SAB), remains controversial. Shortage of the aforementioned
information has impeded the wide application of adenosine stress
testing since the method became available in 2003 in China
(2,10). Therefore, the aim of the present
study was to reveal the detailed characteristics of the
electrocardiographic changes during an adenosine stress test, and
to investigate the correlation between arrhythmia and perfusion
results, in order to provide safety profiles of adenosine stress
testing based on a Chinese population.
Materials and methods
Study population
Between May 2010 and January 2012, outpatients with
potential diagnoses of coronary artery disease, who had undergone
adenosine-induced stress using Technetium-99m sestamibi
(99mTc-MIBI) single photon emission computed tomography (SPECT)
myocardial perfusion imaging at Fuwai Hospital (Beijing, China),
were prospectively enrolled in the study. The contraindications for
adenosine stress testing included the occurrence of myocardial
infarction within two months, unstable angina, hypotension
(systolic blood pressure of <90 mmHg), hypertension (systolic or
diastolic blood pressure of >200 or >110 mmHg, respectively),
New York Heart Association (11)class IV congestive heart failure, an
AVB greater than first degree (I°), patients with a pacemaker
implantation or those with asthma or obstructive lung diseases.
Ethical approval was obtained from the Ethics Review Board of Fuwai
Hospital, and written informed consent was obtained from all the
subjects enrolled.
Adenosine infusion protocol
Adenosine (Shenyang Guangda Pharmaceuticals Co.,
Ltd., Shenyang, China) was infused at a constant rate of 140
μg/kg/min through a peripheral venous catheter, using an accurate
computerized infusion pump (BYZ-810; Changsha BEYOND Medical
Devices Co., Ltd., Changsha, China) over 6 min (total dose, 0.8
mg/kg body weight). At the third minute of adenosine infusion, 925
MBq 99mTc-MIBI (Radiation Chemistry Department, Beijing Normal
University, Beijing, China) was injected as a bolus through the
contralateral cubical vein and the adenosine infusion was continued
for an additional 3 min. The heart rate and a 12-lead
electrocardiogram (ECG) were recorded continuously at the baseline
(at least 2 min prior to the infusion), during infusion and for at
least 3 min after the termination of infusion. ECG data were
analyzed by an experienced electrophysiologist, according to the
2008 AHA/ACCF/HRS recommendations for the standardization and
interpretation of the ECG (12–14).
The electrophysiologist was blinded to the myocardial perfusion
results. Systolic and diastolic blood pressure were monitored every
minute during the entire process. The administration of adenosine
was terminated under the following circumstances: Patients with
poorly tolerated side effects; severe hypotension (systolic blood
pressure of <80 mmHg); horizontal or downsloping ST depression
of >0.1 mV; ST elevation of >0.1 mV; crescendo II° or III°
AVB or SAB.
SPECT acquisition protocol
99mTc-MIBI SPECT myocardial perfusion imaging was
performed 1.0–1.5 h after the completion of adenosine infusion
using a dual-head gamma camera equipped with low-energy,
high-resolution collimators (e.cam; Siemens Medical Solutions USA,
Inc., Malvern, PA, USA). Projection data were acquired from 16
views over 180° from 45° right anterior oblique to 45° left
anterior oblique, with 25 sec per view, on a 64×64 matrix. The
image slices were analyzed visually by two experienced nuclear
cardiologists in consensus based on 17 segments. Rest images were
obtained the following day if the stress images were abnormal. The
final perfusion results were determined by comparing the stressed
images with the rest images. Reversible and irreversible defects
were defined as ischemia and infarction, respectively, and if both
patterns existed, the condition was defined as ischemia combined
with infarction.
Statistical analysis
Statistical analysis was performed using SPSS 19.0
software (IBM, Armonk, NY, USA). Continuous variables are expressed
as the mean ± standard deviation, while categorical variables are
presented as frequencies. The Student’s t-test was used to compare
the differences in continuous variables, while the χ2
test was used to analyze the categorical variables. Logistic
regression analysis was used to determine the risk factors.
P<0.05 was considered to indicate a statistically significant
difference.
Results
Patient characteristics
A total of 1,168 patients (male, 420; female, 748;
mean age, 58±10 years) were enrolled in the study. Of these
individuals, 330 patients had type 2 diabetes mellitus, 230
patients had hypertension and seven patients had undergone a
previous percutaneous coronary intervention (Table I).
 | Table IPatient characteristics. |
Table I
Patient characteristics.
| Characteristics | Total (n=1,168) |
|---|
| Age (years) | 58±10 |
| Gender, male/female
(n) | 420/748 |
| Weight (kg) | 68±11 |
| BMI
(kg/m2) | 25±3 |
| Diabetes mellitus
(n) | 330 |
| Hypertension (n) | 230 |
| Previous PCI (n) | 7 |
Effects of adenosine infusion on
hemodynamic parameters and cardiac electrical conduction
Blood pressure, heart rate and electrocardiographic
intervals at the baseline, at the maximal response during adenosine
infusion and at 2 min after the completion of adenosine
administration are summarized in Table II. The intravenous adenosine
infusion was demonstrated to induce a significant decrease in
systolic blood pressure and an increase in the heart rate. In
addition, adenosine infusion caused a prolongation of the PQ
interval, without affecting the QRS interval. However, considering
that an inverse ratio exists between an increasing heart rate and
the shortening of the QT interval (15), the shortening of the QT interval
may be caused by the increased heart rate rather than the infusion
of adenosine. The maximal changes in the hemodynamic parameters and
cardiac electrical conduction appeared between 2 and 3 min after
the initiation of adenosine infusion. The parameters returned to
the baseline level at 2 min after the termination of infusion.
| Table IIEffects of the adenosine stress test
on hemodynamic parameters and cardiac electrical conduction. |
Table II
Effects of the adenosine stress test
on hemodynamic parameters and cardiac electrical conduction.
| Parameter | Baseline | Peak effect | 2 min after the
termination of adenosine infusion |
|---|
| HR (bpm) | 76±14 | 91±16a | 83±15b |
| SBP (mmHg) | 131±20 | 109±19a | 115±19a |
| DBP (mmHg) | 80±12 | 68±12a | 74±12b |
| PQ interval
(msec) | 153±21 | 166±22a | 154±20b |
| QRS interval
(msec) | 84±11 | 85±10 | 85±11b |
| QT interval
(msec) | 375±31 | 365±33a | 373±31b |
Baseline ECG characteristics
Baseline ECG characteristics are summarized in
Table III. In total, 357
baseline arrhythmic events were observed in 340 patients (29.11%).
A total of 73 patients (6.25%) exhibited sinus bradycardia (heart
rate of <60 bpm), while 38 patients (3.25%) presented with sinus
tachycardia (heart rate of >100 bpm). In addition, 74 patients
(6.34%) had premature atrial contractions (>6 bpm) and 69
patients (5.91%) had premature ventricular contractions (>6
bpm). A I° AVB was identified in 22 patients (1.88%), and 41
patients (3.51%) exhibited atrial fibrillation. A total of 32
patients (2.74%) presented with a right bundle branch block, while
eight patients (0.68%) exhibited a left bundle branch block.
Furthermore, 96 patients (8.22%) exhibited baseline ST depression
(>0.1 mV).
| Table IIIBaseline ECG characteristics. |
Table III
Baseline ECG characteristics.
| Arrhythmia | Cases, n (%) |
|---|
| Sinus
bradycardia | 73 (6.25) |
| Sinus
tachycardia | 38 (3.25) |
| Frequent PAC | 74 (6.34) |
| Frequent PVC | 69 (5.91) |
| Atrial
fibrillation | 41 (3.51) |
| I° AVB | 22 (1.88) |
| RBBB | 32 (2.74) |
| LBBB | 8 (0.68) |
| ST depression | 96 (8.22) |
ECG alterations during adenosine
infusion
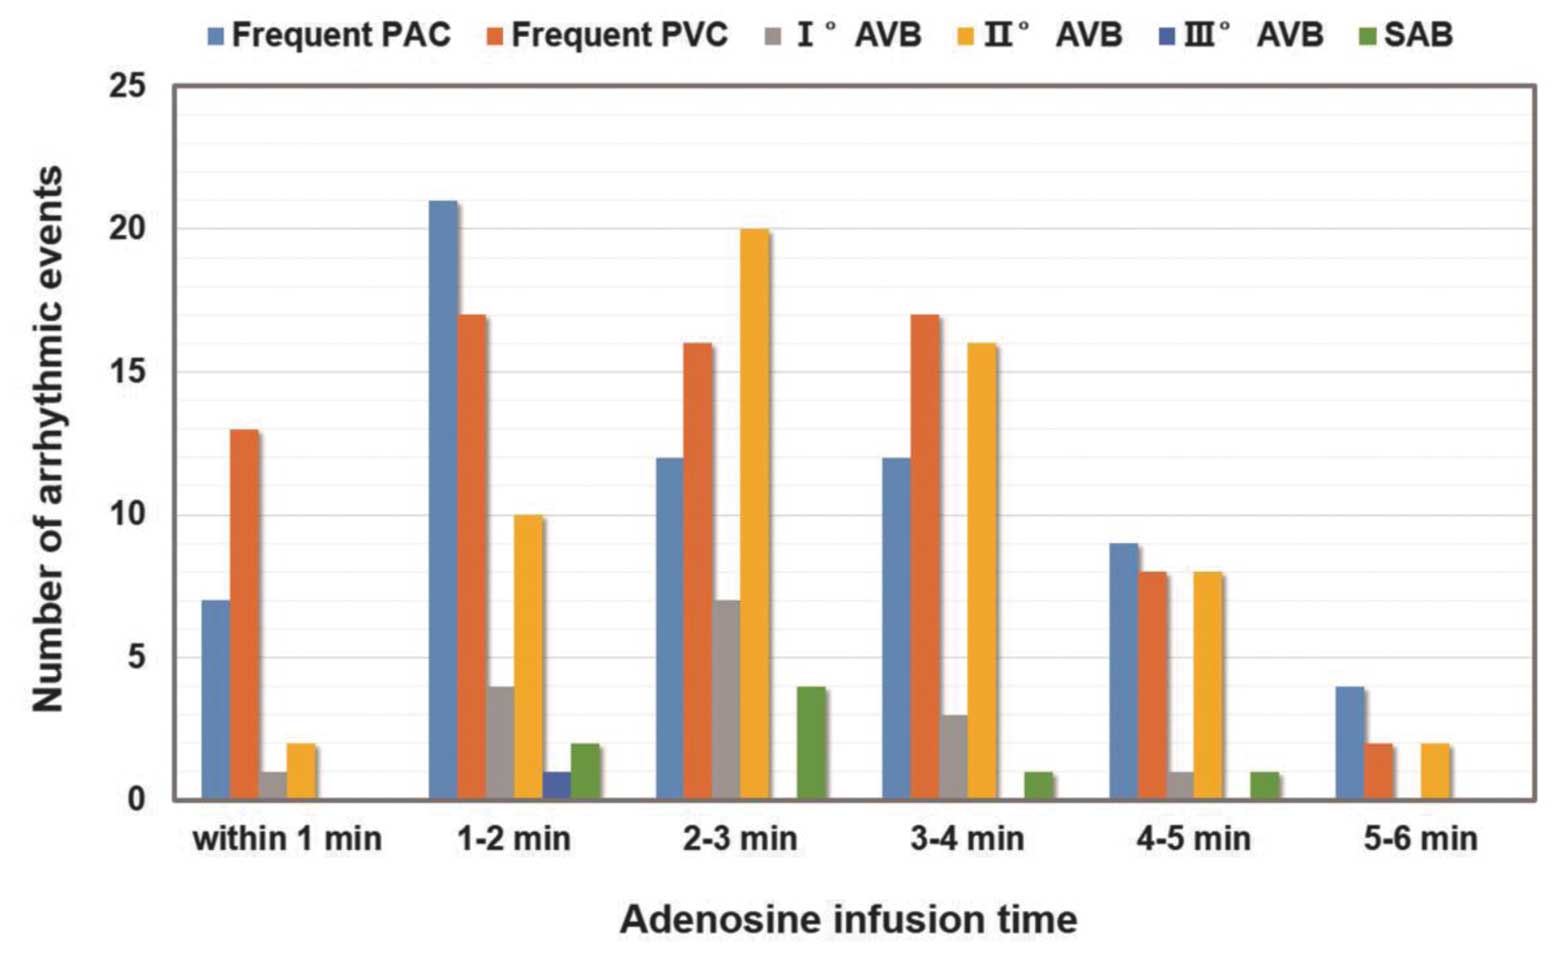
Newly occurred arrhythmias during adenosine infusion
are summarized in Table IV and
Fig. 1. During adenosine infusion,
221 arrhythmic events occurred in 110 patients (9.42%), among which
65 individuals (5.6%) had frequent premature atrial contractions
and 73 patients (6.3%) exhibited frequent premature ventricular
contractions. In total, 16 patients (1.4%) had I° AVB, 58 patients
(5.0%) had II° AVB and one individual (0.09%) developed III° AVB
following the development of II° AVB. In addition, eight
individuals (0.68%) exhibited SAB. Of these arrhythmic events, 174
(14.90%) were transient (lasted for <10 sec), 34 (2.91%) were
persistent (lasted for ≥10 sec) but self-terminated and 13 events
(1.11%) were persistent and diminished following the termination of
adenosine infusion. Early dose-termination was carried out in 15
patients. The newly occurred severe arrhythmias (SAB and II° or
III° AVB) emerged when the infusion initiated and reached the
maximal point during the 2–3 min interval following infusion
(Fig. 1). The mean effective
systolic blood pressure at the 2–3 min interval was 103±22 mmHg
(baseline systolic blood pressure, 129±20 mmHg), which was
considered to be a tolerable level.
| Table IVOccurrence of new arrhythmic events
during adenosine infusion. |
Table IV
Occurrence of new arrhythmic events
during adenosine infusion.
| | Transient
arrhythmiaa | Persistent
arrhythmiab | | | |
|---|
| |
|
| | | |
|---|
| Arrhythmia | Total (n) | Cases (n) | Emerging time
(sec) | Cases (n) | Emerging time
(sec) | Duration (sec) | Self termination
(n) | Early termination
(n) |
|---|
| Frequent PAC | 65 | 58 | 112±76 | 7 | 96±42 | 169±97 | 5 | 0 |
| Frequent PVC | 73 | 57 | 127±69 | 16 | 109±72 | 173±85 | 8 | 3 |
| I°AVB | 16 | 0 | - | 16 | 138±57 | 114±70 | 16 | 2 |
| II° AVB | 58 | 51 | 179±78 | 7 | 171±69 | 57±42 | 5 | 9 |
| III° AVB | 1 | 0 | - | 1 | 77 | 48 | 0 | 1 |
| SAB | 8 | 8 | 147±90 | 0 | - | - | - | 1 |
| Total | 221 | 174 | | 47 | | | | 15c |
Of the 1,168 patients, newly occurred ST depression
(>0.1 mV) was observed in 69 patients (5.91%). During the
adenosine stress test, no patient presented with acute myocardial
infarction or sudden mortality, and no patient required specific
treatment.
With regard to the correlations between the gender,
age and baseline ECG characteristics of the patients and the
development of II° AVB during adenosine infusion, only the baseline
I° AVB was determined to be a predictor [P<0.001; odds ratio
(OR), 28.68; 95% confidence interval (CI), 8.81–93.31; Table V). Furthermore, patients with a
baseline ST depression were more likely to have a further depressed
ST segment during the adenosine stress test (P<0.001; OR, 5.01;
95% CI, 2.76–9.10), possibly due to the already existing
hypoperfusion prior to the test (Table VI).
| Table VLogistic regression analysis for the
development of II° AVB during adenosine infusion. |
Table V
Logistic regression analysis for the
development of II° AVB during adenosine infusion.
| Variables | OR | 95% CI | P-value |
|---|
| Gender | 1.09 | 0.61–1.95 | 0.77 |
| Age | 1.00 | 0.97–1.03 | 0.88 |
| Baseline ST
depression | 0.00 | 0.00 | 1.00 |
| Baseline sinus
tachycardia | 0.00 | 0.00 | 1.00 |
| Baseline sinus
bradycardia | 0.38 | 0.10–1.46 | 0.16 |
| Baseline I°
AVB | 28.68 | 8.81–93.31 | 0.001 |
| Baseline RBBB | 0.17 | 0.02–1.61 | 0.12 |
| Baseline LBBB | 0.45 | 0.03–6.16 | 0.55 |
| Baseline PVC | 0.57 | 0.13–2.41 | 0.44 |
| Baseline PAC | 0.53 | 0.12–2.29 | 0.40 |
| Baseline atrial
fibrillation | 0.00 | 0.00 | 1.00 |
| Table VILogistic regression analysis for the
development of ST depression during adenosine infusion. |
Table VI
Logistic regression analysis for the
development of ST depression during adenosine infusion.
| Variables | OR | 95% CI | P-value |
|---|
| Gender | 0.95 | 0.55–1.62 | 0.84 |
| Age | 0.99 | 0.96–1.01 | 0.36 |
| Baseline ST
depression | 5.01 | 2.76–9.10 | 0.001 |
| Baseline sinus
tachycardia | 0.67 | 0.15–2.97 | 0.60 |
| Baseline sinus
bradycardia | 0.76 | 0.26–2.27 | 0.63 |
| Baseline I°
AVB | 0.00 | 0.00 | 1.00 |
| Baseline RBBB | 0.82 | 0.11–6.28 | 0.85 |
| Baseline LBBB | 0.00 | 0.00 | 1.00 |
| Baseline PVC | 0.92 | 0.32–2.71 | 0.88 |
| Baseline PAC | 1.14 | 0.42–3.05 | 0.80 |
| Baseline atrial
fibrillation | 0.58 | 0.13–2.65 | 0.48 |
| Newly occurred II°
AVB | 0.40 | 0.05–2.94 | 0.37 |
| Newly occurred I°
AVB | 1.58 | 0.20–12.4 | 0.67 |
| Persistent PVC | 1.56 | 0.20–12.32 | 0.67 |
| Persistent PAC | 0.00 | 0.00 | 1.00 |
| Newly occurred
SAB | 0.00 | 0.00 | 1.00 |
ECG alterations following the termination
of adenosine infusion
Following the completion of adenosine infusion, 10
patients (0.86%) presented with newly occurred arrhythmias,
including II° AVB in four patients, II° and III° AVB in one patient
and SAB in five individuals (Table
VII). The episodes were transient in nine patients; however,
one patient had persistent SAB and ischemic ST changes due to a
coronary spasm, which was revealed by an immediate coronary
angiogram.
| Table VIIOccurrence of arrhythmias following
the termination of adenosine infusion. |
Table VII
Occurrence of arrhythmias following
the termination of adenosine infusion.
| Patient number | Gender | Age (years) | Baseline
arrhythmia | Arrhythmia during
infusion | Arrhythmia after
infusion | Onset timea (sec) | Arrhythmia duration
(sec) | Treatment |
|---|
| 79 | F | 41 | None | None | SAB | 311 | 12 | PCI |
| 248 | F | 50 | Sinus
bradycardia | II° AVB | SAB | 27 | 9 | None |
| 672 | F | 59 | None | None | II° AVB | 49 | 3 | None |
| 762 | F | 62 | None | None | SAB | 145 | 2 | None |
| 773 | F | 62 | Sinus
bradycardia | None | SAB | 120 | 2 | None |
| 851 | F | 65 | None | None | II° AVB | 12 | 8 | None |
| 925 | M | 67 | None | None | II° AVB | 12 | 2 | None |
| 984 | F | 69 | None | None | II° AVB | 38 | 3 | None |
| 1063 | F | 72 | I° AVB | None | II°+III° AVB | 64 | 7 | None |
| 1108 | F | 74 | Sinus
tachycardia | None | SAB | 125 | 3 | None |
Myocardial perfusion imaging results
Perfusion imaging revealed ischemia in 79 patients
(6.76%), infarction in 10 patients (0.86%) and ischemia combined
with infarction in seven patients (0.60%). Logistic regression
analysis demonstrated that male patients and those who had newly
occurred ST depression during adenosine infusion had an increased
risk of abnormal perfusion results (OR, 2.14 and 95% CI, 1.35–3.4;
OR, 14.66 and 95% CI, 8.12–26.48, respectively; both P<0.01;
Table VIII).
| Table VIIILogistic regression analysis for the
occurrence of abnormal myocardial perfusion results. |
Table VIII
Logistic regression analysis for the
occurrence of abnormal myocardial perfusion results.
| Variables | OR | 95% CI | P-value |
|---|
| Gender | 2.14 | 1.35–3.40 | 0.001 |
| Age | 1.02 | 1.00–1.04 | 0.12 |
| Baseline ST
depression | 0.74 | 0.33–1.63 | 0.45 |
| Baseline sinus
tachycardia | 1.03 | 0.27–3.94 | 0.96 |
| Baseline sinus
bradycardia | 1.36 | 0.57–3.22 | 0.49 |
| Baseline I°
AVB | 1.03 | 0.20–5.22 | 0.97 |
| Baseline RBBB | 1.65 | 0.50–5.43 | 0.41 |
| Baseline LBBB | 0.00 | 0.00 | 1.00 |
| Baseline PVC | 1.00 | 0.39–2.56 | 1.00 |
| Baseline PAC | 1.12 | 0.47–2.69 | 0.80 |
| Baseline atrial
fibrillation | 0.45 | 0.10–2.03 | 0.30 |
| Newly occurred ST
depression | 14.66 | 8.12–26.48 | 0.001 |
| Newly occurred
II°AVB | 1.00 | 0.33–3.05 | 1.00 |
| Newly occurred I°
AVB | 0.83 | 0.09–7.33 | 0.86 |
| Persistent PVC | 0.00 | 0.00 | 1.00 |
| Persistent PAC | 0.00 | 0.00 | 1.00 |
| Newly occurred
SAB | 0.00 | 0.00 | 1.00 |
| Arrhythmia
occurrence after adenosine infusion | 1.96 | 0.24–16.36 | 0.53 |
Discussion
In the present study, the detailed
electrocardiographic changes through the entire process of the
adenosine stress test were described. Adenosine was shown to have a
strong depressant effect on the atrioventricular conduction system;
however, an insignificant influence was observed on ventricular
depolarization and repolarization. The newly occurred severe
arrhythmias tended to emerge during the 2–3 min interval following
adenosine administration, after which they gradually decreased. The
majority of the newly occurred arrhythmias were transient and
required no special treatment. In addition, no statistical
correlation was observed between the newly occurred arrhythmias and
abnormal perfusion results.
Adenosine is an autacoid that plays a critical role
in regulating cardiac function. There are at least four subtypes of
adenosine receptors, known as A1, A2A, A2B and A3, of which A2A is
the predominant subtype responsible for coronary blood flow
regulation (4). Documented studies
have confirmed that adenosine-induced stress myocardial perfusion
imaging has a relatively high sensitivity and specificity for the
detection of coronary artery disease (1,2).
Furthermore, this method offers a number of advantages when
compared with the exercise test, including a rapid onset of action,
a direct coronary vasodilatory effect, timely dose adjustment for
its short half-life (<10 sec), a more standard operational
procedure and a procedure that is less influenced by drugs
(3). However, the unselected
activation of adenosine receptors may lead to various undesirable
side effects, among which ECG alterations are the most common due
to the negative chronotropic effect of the A1 receptor, which
suppresses the activity of the sinus node, atrioventricular
junction and His-Purkinje system (4–7).
In the present study, the incidence of newly
occurred AVB events was 6.42%, which is comparable with US
population (7.63%) (8) and
Japanese population (4.57%) (9)
studies. Age was not found to be a predictor of the development of
severe arrhythmia, indicating that adenosine may also be safe for
elder Chinese patients. However, attention should be paid for
patients with a baseline I° AVB, as these individuals were more
likely to develop a II° AVB during adenosine infusion. Previous
studies have demonstrated that new occurrence of ST depression
during adenosine infusion is an independent predictor of future
cardiac events (16–18). Consistently, in the present study,
patients with newly developed ST depression were more likely to
have abnormal perfusion results. Thus, attention should also be
paid when ischemic ST changes emerge during adenosine infusion.
Finally, although the incidence is low (19–21),
a coronary spasm may occur during or after the adenosine infusion.
This may be due to the activation of the A1 receptor, which induces
the contraction of vascular smooth muscle (22,23).
In addition, delayed coronary spasms that occur at the termination
of adenosine infusion may be the result of the withdrawal of
vasodilatory effects and the reflected onset of vascular smooth
muscle contraction (21).
Therefore, intensive monitoring is highly recommended even
following adenosine infusion.
The current preliminary study has a number of
inherent limitations due to its single-centered research nature. In
addition, the sample size was relatively small, which may lead to
selection bias. Therefore, a randomized multicentered trial that
includes a greater number of patients is required to confirm the
ECG profiles of adenosine stress testing in a Chinese
population.
In conclusion, based on a Chinese population, the
findings of the present prospective study indicate the safety of
adenosine pharmacological hyperemia in conjunction with
radionuclide perfusion imaging. Despite the relative high incidence
of arrhythmic events, the majority of arrhythmias that occurred
during adenosine infusion were transient and did not indicate
abnormal perfusion results.
Acknowledgements
The study was supported by grants from the Young
Scholar Funding of Chaoyang Hospital (no. 2014-YQ-01) and the
National Natural Science Foundation of China (nos. 81400268 and
81100587).
References
|
1
|
Verani MS, Mahmarian JJ, Hixson JB, et al:
Diagnosis of coronary artery disease by controlled coronary
vasodilation with adenosine and thallium-201 scintigraphy in
patients unable to exercise. Circulation. 82:80–87. 1990.
View Article : Google Scholar : PubMed/NCBI
|
|
2
|
Tian YQ, Wang JC, He ZX, et al: Diagnostic
value of adenosine (99m)Tc-MIBI myocardial perfusion imaging for
detecting coronary artery disease. Zhonghua Xin Xue Guan Bing Za
Zhi. 33:58–61. 2005.(In Chinese). PubMed/NCBI
|
|
3
|
Gupta NC, Esterbrooks DJ, Hilleman DE and
Mohiuddin SM: Comparison of adenosine and exercise thallium-201
single-photon emission computed tomography (SPECT) myocardial
perfusion imaging. The GE SPECT Multicenter Adenosine Study Group.
J Am Coll Cardiol. 19:248–257. 1992. View Article : Google Scholar : PubMed/NCBI
|
|
4
|
Mustafa SJ, Morrison RR, Teng B and Pelleg
A: Adenosine receptors and the heart: role in regulation of
coronary blood flow and cardiac electrophysiology. Handb Exp
Pharmacol. 193:161–188. 2009. View Article : Google Scholar : PubMed/NCBI
|
|
5
|
Alkoutami GS, Reeves WC and Movahed A: The
safety of adenosine pharmacologic stress testing in patients with
first-degree atrioventricular block in the presence and absence of
atrioventricular blocking medications. J Nucl Cardiol. 6:495–497.
1999. View Article : Google Scholar : PubMed/NCBI
|
|
6
|
Verani MS: Pharmacological stress with
adenosine for myocardial perfusion imaging. Semin Nucl Med.
21:266–272. 1991. View Article : Google Scholar : PubMed/NCBI
|
|
7
|
Alkoutami GS, Reeves WC and Movahed A: The
frequency of atrioventricular block during adenosine stress testing
in young, middle-aged, young-old, and old-old adults. Am J Geriatr
Cardiol. 10:159–161. 2001. View Article : Google Scholar : PubMed/NCBI
|
|
8
|
Cerqueira MD, Verani MS, Schwaiger M, et
al: Safety profile of adenosine stress perfusion imaging: results
from the Adenoscan Multicenter Trial Registry. J Am Coll Cardiol.
23:384–389. 1994. View Article : Google Scholar : PubMed/NCBI
|
|
9
|
Hatanaka K, Doi M, Hirohata S, et al:
Safety of and tolerance to adenosine infusion for myocardial
perfusion single-photon emission computed tomography in a Japanese
population. Circ J. 71:904–910. 2007. View Article : Google Scholar : PubMed/NCBI
|
|
10
|
Fan ZJ, Chen LB, Li F, et al: The
application of adenosine stress myocardial perfusion tomographic
imaging in detecting coronary artery disease. Zhonghua Nei Ke Za
Zhi. 45:112–115. 2006.(In Chinese). PubMed/NCBI
|
|
11
|
The Criteria Committee of the New York
Heart Association. Nomenclature and Criteria for Diagnosis of
Diseases of the Heart and Great Vessels. Dolgin M: 9th edition.
Little, Brown & Co; Boston, USA: pp. 253–256. 1994
|
|
12
|
Surawicz B, Childers R, Deal BJ, et al;
American Heart Association Electrocardiography and Arrhythmias
Committee, Council on Clinical Cardiology; American College of
Cardiology Foundation; Heart Rhythm Society. AHA/ACCF/HRS
recommendations for the standardization and interpretation of the
electrocardiogram: part III: intraventricular conduction
disturbances: a scientific statement from the American Heart
Association Electrocardiography and Arrhythmias Committee, Council
on Clinical Cardiology; the American College of Cardiology
Foundation; and the Heart Rhythm Society. Endorsed by the
International Society for Computerized Electrocardiology. J Am Coll
Cardiol. 53:976–981. 2009. View Article : Google Scholar : PubMed/NCBI
|
|
13
|
Rautaharju PM, Surawicz B, Gettes LS, et
al; American Heart Association Electrocardiography and Arrhythmias
Committee, Council on Clinical Cardiology; American College of
Cardiology Foundation; Heart Rhythm Society. AHA/ACCF/HRS
recommendations for the standardization and interpretation of the
electrocardiogram: part IV: the ST segment, T and U waves, and the
QT interval: a scientific statement from the American Heart
Association Electrocardiography and Arrhythmias Committee, Council
on Clinical Cardiology; the American College of Cardiology
Foundation; and the Heart Rhythm Society. Endorsed by the
International Society for Computerized Electrocardiology. J Am Coll
Cardiol. 53:982–991. 2009. View Article : Google Scholar : PubMed/NCBI
|
|
14
|
Wagner GS, Macfarlane P, Wellens H, et al;
American Heart Association Electrocardiography and Arrhythmias
Committee, Council on Clinical Cardiology; American College of
Cardiology Foundation; Heart Rhythm Society. AHA/ACCF/HRS
recommendations for the standardization and interpretation of the
electrocardiogram: part VI: acute ischemia/infarction: a scientific
statement from the American Heart Association Electrocardiography
and Arrhythmias Committee, Council on Clinical Cardiology; the
American College of Cardiology Foundation; and the Heart Rhythm
Society. Endorsed by the International Society for Computerized
Electrocardiology. J Am Coll Cardiol. 53:1003–1011. 2009.
View Article : Google Scholar : PubMed/NCBI
|
|
15
|
Kligfield P, Lax KG and Okin PM: QT
interval-heart rate relation during exercise in normal men and
women: definition by linear regression analysis. J Am Coll Cardiol.
28:1547–1555. 1996. View Article : Google Scholar : PubMed/NCBI
|
|
16
|
Marshall ES, Raichlen JS, Kim SM, Intenzo
CM, Sawyer DT, Brody EA, et al: Prognostic significance of
ST-segment depression during adenosine perfusion imaging. Am Heart
J. 130:58–66. 1995. View Article : Google Scholar : PubMed/NCBI
|
|
17
|
Klodas E, Miller TD, Christian TF, Hodge
DO and Gibbons RJ: Prognostic significance of ischemic
electrocardiographic changes during vasodilator stress testing in
patients with normal SPECT images. J Nucl Cardiol. 10:4–8. 2003.
View Article : Google Scholar : PubMed/NCBI
|
|
18
|
Abbott BG, Afshar M, Berger AK and Wackers
FJ: Prognostic significance of ischemic electrocardiographic
changes during adenosine infusion in patients with normal
myocardial perfusion imaging. J Nucl Cardiol. 10:9–16. 2003.
View Article : Google Scholar : PubMed/NCBI
|
|
19
|
Golzar J, Mustafa SJ and Movahed A: Chest
pain and ST-segment elevation 3 minutes after completion of
adenosine pharmacologic stress testing. J Nucl Cardiol. 11:744–746.
2004. View Article : Google Scholar : PubMed/NCBI
|
|
20
|
Stern S and Bayes de Luna A: Coronary
artery spasm: a 2009 update. Circulation. 119:2531–2534. 2009.
View Article : Google Scholar : PubMed/NCBI
|
|
21
|
Rosenberg T and Perdrisot R: Coronary
spasm after an adenosine stress test: an adverse effect of a
vasodilator. Acta Cardiol. 63:401–404. 2008. View Article : Google Scholar : PubMed/NCBI
|
|
22
|
Ansari HR, Teng B, Nadeem A, Roush KP,
Martin KH, Schnermann J and Mustafa SJ: A(1) adenosine
receptor-mediated PKC and p42/p44 MAPK signaling in mouse coronary
artery smooth muscle cells. Am J Physiol Heart Circ Physiol.
297:H1032–H1039. 2009. View Article : Google Scholar : PubMed/NCBI
|
|
23
|
Sato A, Terata K, Miura H, Toyama K,
Loberiza FR Jr, Hatoum OA, et al: Mechanism of vasodilation to
adenosine in coronary arterioles from patients with heart disease.
Am J Physiol Heart Circ Physiol. 288:H1633–H1640. 2005. View Article : Google Scholar : PubMed/NCBI
|