Introduction
The androgen receptor (AR) is a member of the
nuclear receptor superfamily that functions as a ligand-dependent
transcription factor and plays an important biological role in the
male phenotype and prostate cancer biology. Prostate cancer was
originally identified as an androgen-dependent tumor, whose growth
and survival were under the control of AR signaling (1). Androgen deprivation therapy is
initially effective for inhibiting the growth of prostate cancers
by suppressing AR activity (2);
however, the possibility of recurrence is relatively high and the
recurrence is associated with androgen independence (3). Despite a loss of response to
antiandrogens, there are data indicating that AR signaling
continues to function in castration-resistant prostate cancer
(CRPC). The mechanisms include: i) AR following an adaptive process
by an activating mutation or multiplication in response to androgen
deficiency (4–6); ii) AR regulating other signaling
pathways to execute the procedure of self-activation (7); and iii) transcription activities of AR
activated by AR signals. Additionally, alternative signaling
pathways may result in the activation of the AR (8,9). These
observations support a strong selective pressure to maintain
AR-regulated signaling pathways in castration-resistant forms of
the disease.
Previous studies have aimed to identify
androgen-regulated genes or AR genomic binding sites (10–12). In
the process where androgen-dependent prostate cancer (ADPC) turns
into androgen-independent prostate cancer (AIPC), the effect of an
activated AR and associated gene differential expression remains
unclear. The AR may be found in different binding molecules within
the nucleus in the development of prostate cancer (1); therefore, a detailed map of
AR-regulated genes and AR genomic binding sites in the
hormone-naive and CRPC forms of prostate cancer is required. To
determine the changes between AR-dependent and AR-independent
chromatin accessibility, chromatin immunoprecipitation in
combination with direct sequencing (ChIP-seq) was performed on the
well-established LNCaP androgen-sensitive prostate cancer cell line
and the long-term LNCaP-AI androgen-deprived cell line, following
hormone induction. A high-throughput elucidation of these sites
allowed for a deep understanding of the complexities of this
process. In the present study, an interdisciplinary approach was
taken to successfully discern direct gene targets of the AR. The
results indicated that AR genomic binding sites in LNCaP-AI cells
exposed to 10 nM dihydrotestosterone differ compared with those in
LNCaP cells. The aim of the study was to provide an essential
reference for the development of novel biomarkers and potential
diagnostic biomarkers to improve the current methods of therapeutic
intervention and treatment.
Materials and methods
Cell culture
The prostate cancer cell line, LNCaP, was obtained
from the American Type Culture Collection (Manassas, VA, USA) and
routinely cultured in Dulbecco's modified Eagle's medium (DMEM)
with 10% fetal bovine serum (FBS; Gibco Life Technologies,
Carlsbad, CA, USA) at 37°C in 5% CO2. The establishment
of an androgen-independent cell line (LNCaP-AI) was conducted as
previously described (13). The
LNCaP-AI cells were grown under phenol red-free DMEM with 10%
dextran-charcoal stripped FBS (dcc-FBS; Gibco Life Technologies)
(14).
ChIP assay
ChIP assays were performed using an EZ-Zyme™
Chromatin Prep kit (17-375; Millipore Corporation, Billerica, MA,
USA) and a Magna ChIP™ A-Chromatin Immunoprecipitation kit (17-610;
Millipore Corporation). The cells were cultured in dcc-FBS medium
without phenol red for 3 days prior to stimulation with 10 nM
dihydrotestosterone (Sigma-Aldrich, St. Louis, MO, USA) for 24 h.
Approximately 4×10⁷ cells were used for the ChIP assay.
Chromatin was prepared from the LNCaP and LNCaP-AI cells
(∼4×10⁷), according to the manufacturer's instructions.
The cells were fixed with 550 µl formaldehyde (1%) for 10 min at
room temperature, and glycine (2 ml) was added to quench the
unreacted formaldehyde. The fixed cells were resuspended in 450 µl
EZ-Zyme lysis buffer containing 5 µl protease inhibitor cocktail.
Subsequently, the nuclei were collected by centrifugation at 2,500
× g, and resuspended in 150 µl digestion buffer (#17-375; Millipore
Corporation). Samples were sheared to an average DNA length of
100–500 bp using 10 µl EZ-Zyme enzymatic cocktail. The lysates were
rotated at 4°C overnight with 10 µl rabbit polyclonal AR antibody
(#17-10489; Millipore Corporation). Protein G beads (50 µl; #88848;
Life Technologies, Carlsbad, CA, USA) were added and incubated for
2 h, after which the precipitates were eluted from the beads with
100 µl ChIP elution buffer. Cross-links were reverted by heating at
62°C overnight, and DNA was recovered using a QIAquick Polymerase
Chain Reaction Purification kit (Qiagen GmbH, Hilden, Germany).
ChIP-seq data analysis
ChIP DNA fragments were processed for deep
sequencing at a 49-bp read length on the Illumina Genome Analyzer
System (Illumina HiSeq 2000 platform; Illumina, Chesterford, UK).
Sequence tags were obtained and mapped to the human genome using
the Solexa Analysis Pipeline (Illumina). The output of the Solexa
Analysis Pipeline was converted to browser extensible data files
for viewing the data in the University of California at Santa Cruz
(UCSC) genome browser. Model-based analysis for ChIP-seq (MACS)
(15) was used with default
parameters to detect the statistically significant peaks of mapped
reads. The results were mapped to human genome version 19 (hg19),
and the peaks were denoted as high-confidence AR binding sites
(ARBSs). The high-confidence ARBSs were each split into five
categories according to the peak locations, namely an intragenic
region, exons, introns, upstream 20 kb and downstream 20 K. To
calculate the distance to the transcription start sites (TSS),
annotations from the UCSC genome browser were used. The data were
available from the National Center for Biotechnology Information
Gene Expression Omnibus under the accession number GSE44800. Using
a stringent P-value cutoff of 0.00001, 2,800 AR ChIP-enriched
regions were identified as significant ARBSs.
Motif scanning and identification
To determine the motif enrichment in regions of AR
bound sequences, Multiple EM for Motif Elicitation (MEME; version
4.6.1) transcription factor binding site motif identification
software was used (16). MEME is a
web-based tool for analyzing motifs in large DNA data sets. The
software performs de novo motif discovery, motif enrichment
analysis and motif location analysis, providing a comprehensive
image of the DNA motif in the LNCaP and LNCaP-AI sequence tags
(17). The matching criterion was
set at a likelihood ratio (LR) of ≥500, and matched matrices with a
LR of ≥500 were tabulated. MEME also compared each of the matched
matrices with each of the motifs in the JASPAR CORE database.
Gene ontology analysis
The Blast2GO suites were used to determine gene
ontology (GO) function categories, while GO enrichment analysis was
performed using Web Gene Ontology Annotation Plot (WEGO) software
(18). The observed number of
differentially expressed transcripts in each GO category was
compared with the corresponding number in the UniGene database
(http://www.ncbi.nlm.nih.gov/unigene/)
to assess the significant over-representation of differentially
expressed transcripts in the GO categories. Statistical
significance of over-representation for each GO category was
determined using Pearson's χ2 test, where P<0.05 was
considered to indicate a statistically significant difference. For
LNCaP and LNCaP-AI samples, the genes bound by the AR in an exon or
intron region of the gene or, at most, 50 K upstream of the TSS or
50 K downstream of the 3′-untranslated region, were collected into
separate lists. The gene lists were subsequently used to identify
statistically over-represented GO terms with WEGO. GO has three
domains, namely molecular function, cellular component and
biological process. The basic unit of GO is a term, and each GO
term belongs to one of the three domains.
Results
Global identification of direct
AR-regulated genes
In order to identify direct AR-regulated genes in
the two cell lines that represented distinct molecular subtypes of
prostate cancer, the ligand-dependent (LNCaP) and
ligand-independent (LNCaP-AI) subtypes, ChIP-seq of the DNA from
anti-AR ChIP was performed. To improve the sensitivity of the
approach, the AR ChIP-seq in the two cell lines were performed in
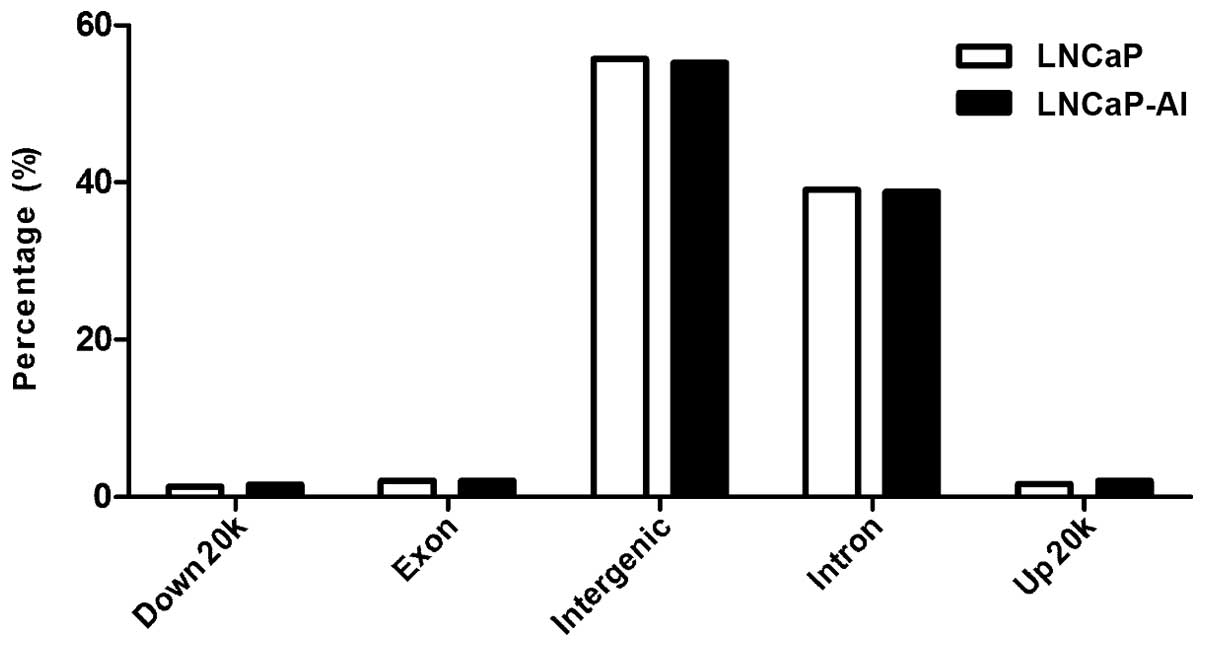
the presence of dihydrotestosterone in the two cell lines. Using
ChIP-seq, 31,115,845 sequence tags in the LNCaP cells and 9,414,950
sequence tags in the LNCaP-AI cells were obtained, which were
mapped uniquely to hg19 allowing two mismatches. By generating peak
range scanning with the use of MACS software, 9,021 and 4,949 peaks
were obtained in the LNCaP and LNCaP-AI cells, respectively, which
were confirmed with the Poisson Distribution Model (P<0.00001).
The distribution character of these peaks is presented in Fig. 1. Using model-based analysis for
ChIP-seq, 4,143 ARBSs were identified in LNCaP cells and 2,380 AR
binding regions were identified in LNCaP-AI cells, based on a
stringent false discovery rate (FDR) of 0.05. LNCaP cells were
found to have a greater number of higher affinity ARBSs compared
with LNCaP-AI cells, which is consistent with a previous study in
which androgen signaling activity was demonstrated to be decreased
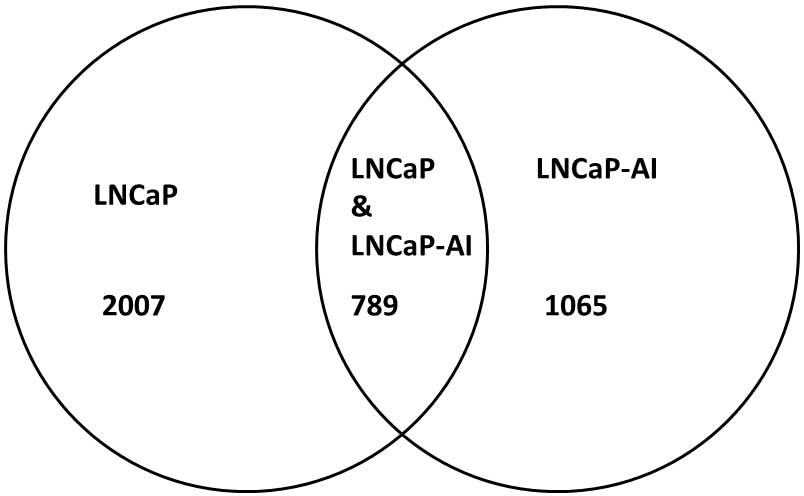
in AIPC compared with ADPC (19). As
shown in Fig. 2, 4,143 AR binding
regions in the LNCaP cells and 2,261 AR binding regions in the
LNCaP-AI cells were mapped to their corresponding TSSs of 2,796
genes and 1,854 genes, respectively. Furthermore, the two cell
lines (LNCaP and LNCaP-AI) were shown to share 789 mutual genes,
and the average numbers of AR binding regions per gene were
determined as 1.49 for LNCaP and 1.28 for LNCaP-AI.
Functional characterization of genes
in the LNCaP and LNCaP-AI cells
To elucidate the functions of the
androgen-responsive genes in the LNCaP and LNCaP-AI cells, GO
category enrichment analysis was applied using Fisher's exact test
with an FDR cutoff adjusted to P≤0.01. In the LNCaP cells, 1,797
genes were clustered into the biological process category, 1,996
genes were classified in the molecular function category and 2,061
genes were sorted into the cellular components domain. In the
LNCaP-AI cells 1,231 genes were categorized into the biological
process domain, 1,370 genes were sorted into the molecular function
category and 1,414 genes were divided into the cellular components
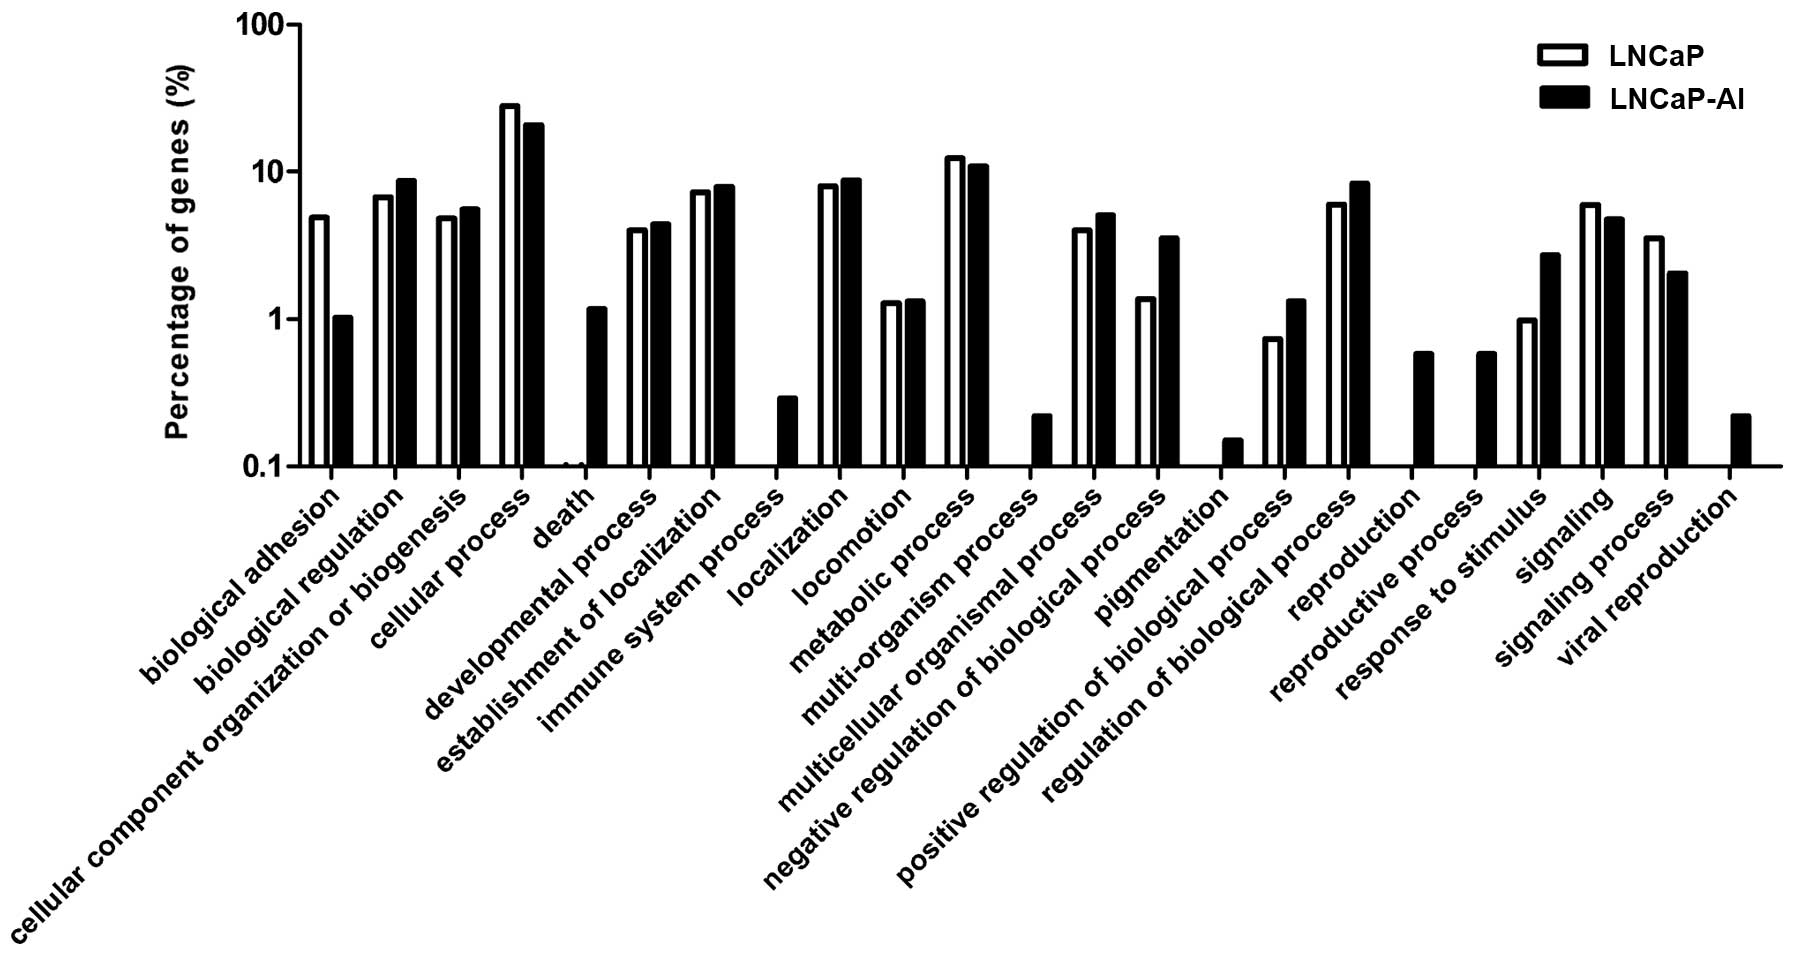
domain. In the biological process category, a number of different
GO terms were identified between the LNCaP and LNCaP-AI cells,
including the reproductive process, death, immune system process,
multi-organism process, pigmentation and viral reproduction
(Fig. 3). Table I lists the genes in the various GO
terms. In the molecular function category, different GO terms
associated with structural molecular activity, receptor regulator
activity and antioxidant activity were identified between the LNCaP
and LNCaP-AI cells. However, the GO terms in the cellular component
domain were consistent between the LNCaP and LNCaP-AI cells.
 | Table I.List of genes according to GO
biological processes. |
Table I.
List of genes according to GO
biological processes.
| GO biological
process | Gene symbol | Chromosome |
|---|
| Cell death | TNFAIP8 | chr5 |
|
| RTN4 | chr2 |
|
| RRAGA | chr9 |
|
| FAF1 | chr1 |
|
| CIDEA | chr18 |
|
| TTBK2 | chr15 |
|
| EIF4G2 | chr11 |
|
| FGF14 | chr13 |
|
| SYNE1 | chr6 |
|
| NDOR1 | chr9 |
|
| HTR2A | chr13 |
|
| APP | chr21 |
|
| ITPR1 | chr3 |
|
| ATM | chr11 |
|
| ATXN7 | chr3 |
|
| TGFB2 | chr1 |
| Immune system
process | NCOA6 | chr20 |
|
| JAK2 | chr9 |
|
| PML | chr15 |
|
| KAT8 | chr16 |
| Multi-organism
process | RRAGA | chr9 |
|
| HIPK2 | chr7 |
|
| VAPB | chr20 |
| Pigmentation | OCA2 | chr15 |
|
| TYR | chr11 |
| Reproduction | RRAGA | chr9 |
|
| HIPK2 | chr7 |
|
| VAPB | chr20 |
|
| FNDC3A | chr13 |
|
| STRBP | chr9 |
|
| RNF17 | chr13 |
|
| BBS4 | chr15 |
|
| CEP57 | chr11 |
| Viral
reproduction | RRAGA | chr9 |
|
| HIPK2 | chr7 |
|
| VAPB | chr20 |
Identification of AR enrichment
consensus in the AR binding regions
To define whether the AR binding regions in LNCaP or
LNCaP-AI cells have their own specificity and enriched binding
motif, it was essential to rank all the peaks in LNCaP and LNCaP-AI
cells according to enrichment, from highest to lowest.
Subsequently, 100 peaks with a high level of statistical
significance were identified in the two cell lines by analyzing the
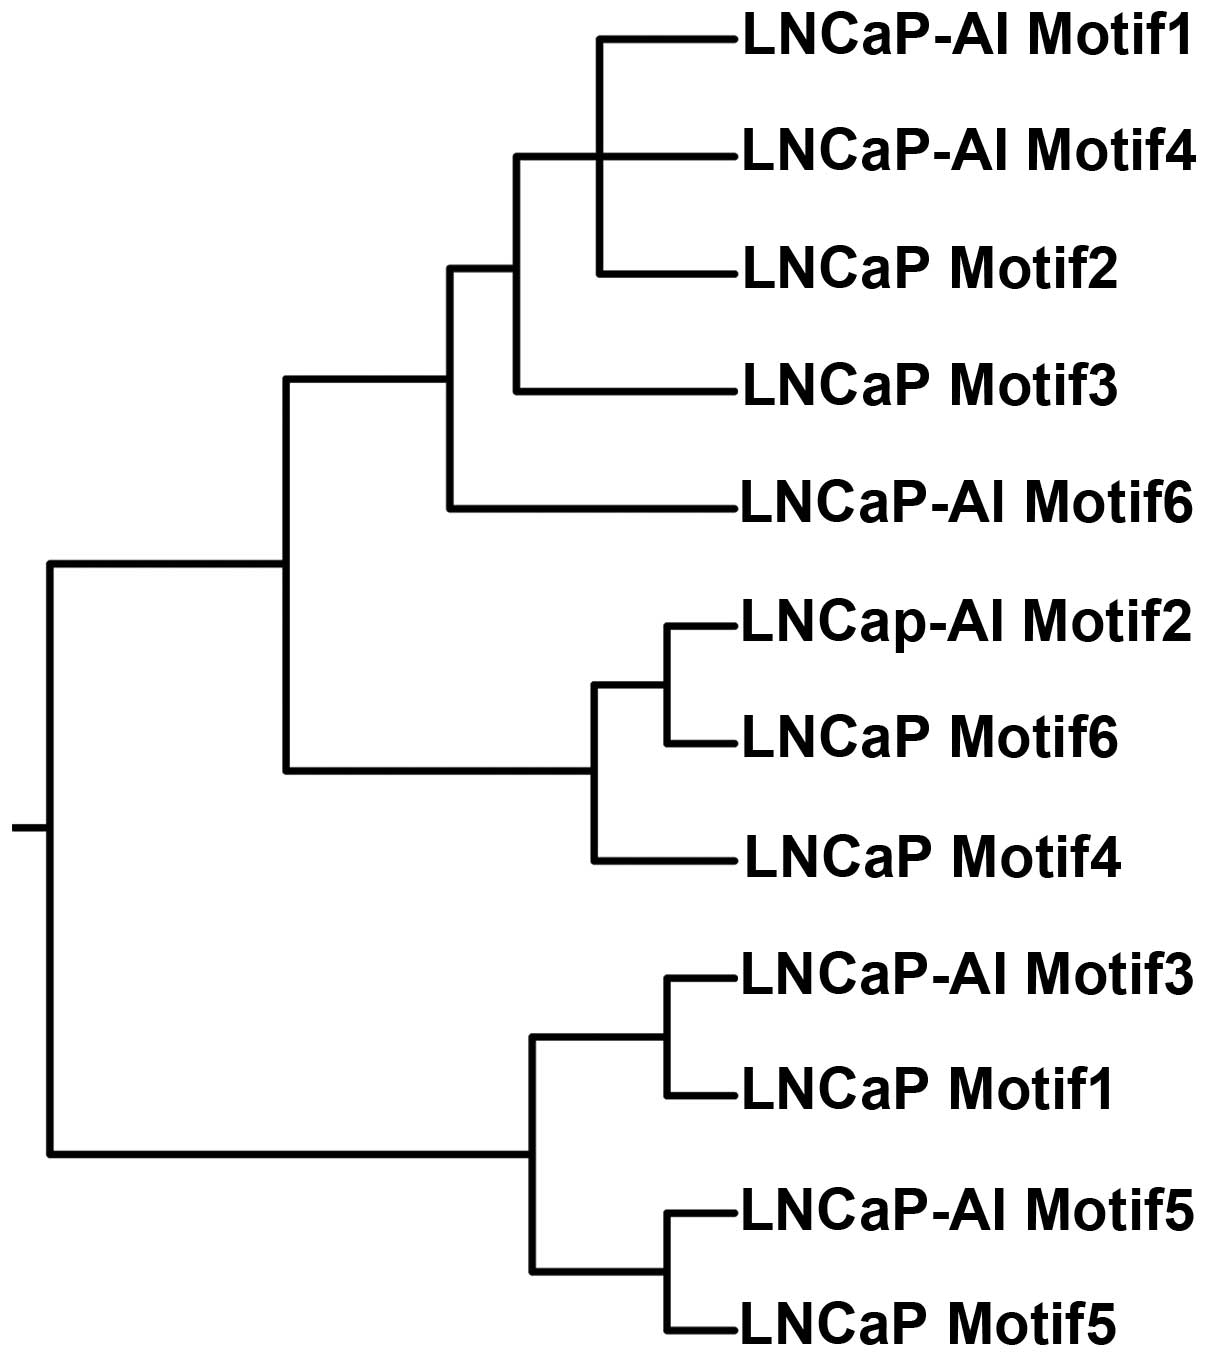
DNA-binding motifs using MEME software. In the LNCaP cells, six
motifs were detected with a good statistical significance, while in
the LNCaP-AI cells different sequences of six motifs were obtained.
The Newick tree format is built based on the association between
all 12 instances of motif, which resembles genealogy, as shown in
Fig. 4. Using TOMTOM software, it
was easy to infer DNA-binding motifs from the JASPAR database,
which shared a high level of homology with the 12 instances of
motif obtained (Table II).
| Table II.Matrices were matched to each of the
motifs in the JASPAR CORE database. |
Table II.
Matrices were matched to each of the
motifs in the JASPAR CORE database.
| Name | Alignment | Best match in
JASPAR | Alignment (best
match motif) |
|---|
| LNCaP_Motif1 | GTGGATATTTGG |
MA0130.1_ZNF354C | GTGGATATTTGG |
| LNCaP_Motif2 | AYRGARTKGAAY | MA0218.1_ct | RTTCMAYTCYRT |
| LNCaP_Motif3 | CAYTCYTTTTG | MA0277.1_AZF1 | CAAAARGARTG |
| LNCaP_Motif4 | AGTTTCTGAGAA |
MA0432.1_YNR063W | TTCTCAGAAACT |
| LNCaP_Motif5 | GAGYNGWWTGGA | MA0371.1_ROX1 | GAGYNGWWTGGA |
| LNCaP_Motif6 | GCTTCTGTCTAG | MA0323.1_IXR1 | GCTTCTGTCTAG |
|
LNCaP-AI_Motif1 | GASTTGAATGCA | MA0274.1_ARR1 | TGCATTCAASTC |
|
LNCaP-AI_Motif2 | AGAATGCTTCTG | MA0417.1_YAP5 | CAGAAGCATTCT |
|
LNCaP-AI_Motif3 | GTGGATATTTGG |
MA0130.1_ZNF354C | CCAAATATCCAC |
|
LNCaP-AI_Motif4 | ACAGAGTTGAAC | MA0218.1_ct | GTTCAACTCTGT |
|
LNCaP-AI_Motif5 | GAGCAGTTTTGA | MA0299.1_GAL4 | GAGCAGTTTTGA |
|
LNCaP-AI_Motif6 | CGCTTTGAGGCC | MA0021.1_Dof3 | CGCTTTGAGGCC |
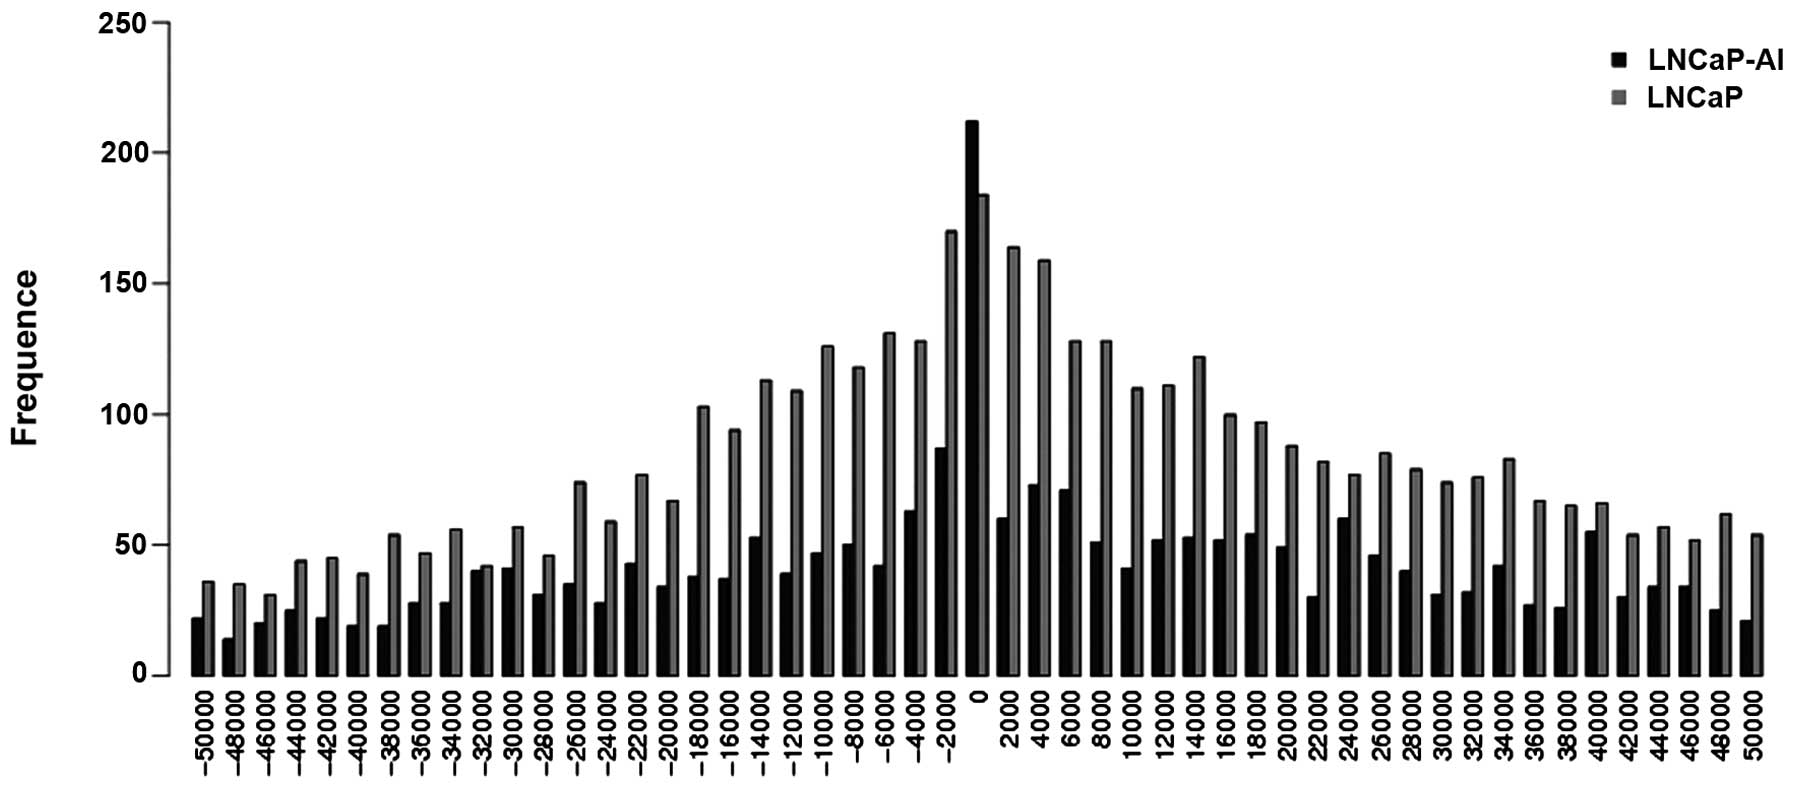
Categorization of AR binding regions
identified by ChIP-seq based on their distribution to genes
The aim was to determine the location of the AR
binding regions relative to the TSSs of the closet
androgen-responsive genes. Subsequently, the frequency across the
distance intervals prior to and subsequent to the TSS for every 2
kb were tabulated. Fig. 5 shows the
peaks of the AR binding regions in the LNCaP and LNCaP-AI cells
around the TSSs; a histogram of the AR binding regions residing
within the downstream 50 kb or upstream 50 kb genomic regions
relative to the annotated TSSs is shown. For the 4,143 AR binding
regions in the LNCaP cells, 93% (3,871/4,143) resided within 50 kb
of the TSSs. Similarly, for the 2,380 AR binding regions in the
LNCaP-AI cells, 92% (2,185/2,380) resided within 50 kb of the TSSs.
Among all the AR binding regions, ∼8.5% (354/4,143) were mapped to
within 2 kb of the TSS in the LNCaP cells and ∼12.6% (299/2,380)
were mapped to within 2 kb of the TSS in the LNCaP-AI cells.
Discussion
AR is a nuclear receptor that has been recognized as
a major factor involved in prostate tumor genesis (20). A number of studies have shown that
the majority of CRPC cases express AR and androgen-responsive genes
(21,22). The role of AR in prostate cancer
progression is to promote the expression of specific target genes.
The present study aimed to define AR binding sites in
ligand-dependent and ligand-independent prostate cancer by
performing ChIP-seq analysis in cell line models of ADPC and
AIPC.
Genomic localization of the AR binding sites
indicated that the majority of the androgen regulation was mediated
by the binding of AR to the distal intragenic elements and intronic
regions, as previously suggested (11,12,23). A
total of 2,796 and 1,854 actively transcribed target genes
regulated by AR were identified in the LNCaP and LNCaP-AI cells,
respectively. Comparisons between the cell lines demonstrated that
there was a rare overlap of genes between the cell lines. The small
overlap appeared to be a consequence of intrinsic differences, such
as AR binding of other transcription factors (24). GO analysis of these genes revealed
that there was significant overlap between GO terms in the LNCaP
and LNCaP-AI cells. However, GO terms within the biological process
domain that were only observed in LNCaP-AI cells included
reproduction process, death, immune system process, multi-organism
process, pigmentation and viral reproduction. The genes in the
different GO terms included TNFAIP8, RTN4, APP and SYNE1 (Table I). TNFAIP8 is known to have oncogenic
properties and is overexpressed in numerous cancer types (25,26).
Furthermore, TNFAIP8 expression is significantly associated with a
higher risk of prostate cancer recurrence (27). A previous study demonstrated that APP
expression levels correlated with the extent of disease and the
prognosis in several forms of cancer (28). In addition, SYNE1 is a promising
biomarker in colitis-associated colorectal cancer (29). As previously suggested, RTN4
contributes to the susceptibility of cervical squamous cell
carcinoma (30).
In conclusion, these studies have provided new
insights into the DNA sequences to which the AR can bind.
Furthermore, AR cooperating transcription factors have been
identified and thousands of potential AR-regulated genes have been
mapped, providing insight into the biological processes regulated
by the AR. In addition, the present study has added a number of
candidate genes, including TNFAIP8, RTN4, APP and SYNE1 (Table I). However, further studies are
required to clarify the function of the candidate genes, which may
aid understanding into the molecular mechanisms underlying the
transition from ADPC to AIPC. Subsequently, the candidate genes may
aid the development of novel strategies for therapeutic
intervention or serve as biomarkers of different cancer stages.
Acknowledgements
This study was supported by a grant from the
National Natural Science Foundation of China (no. 81271917).
References
|
1
|
Suzuki H, Ueda T, Ichikawa T and Ito H:
Androgen receptor involvement in the progression of prostate
cancer. Endocr Relat Cancer. 10:209–216. 2003. View Article : Google Scholar : PubMed/NCBI
|
|
2
|
Debes JD and Tindall DJ: Mechanisms of
androgen-refractory prostate cancer. N Engl J Med. 351:1488–1490.
2004. View Article : Google Scholar : PubMed/NCBI
|
|
3
|
Scher HI, Liebertz C, Kelly WK, et al:
Bicalutamide for advanced prostate cancer: the natural versus
treated history of disease. J Clin Oncol. 15:2928–2938.
1997.PubMed/NCBI
|
|
4
|
Chen CD, Welsbie DS, Tran C, et al:
Molecular determinants of resistance to antiandrogen therapy. Nat
Med. 10:33–39. 2004. View
Article : Google Scholar : PubMed/NCBI
|
|
5
|
Hu R, Dunn TA, Wei S, et al:
Ligand-independent androgen receptor variants derived from splicing
of cryptic exons signify hormone-refractory prostate cancer. Cancer
Res. 69:16–22. 2009. View Article : Google Scholar : PubMed/NCBI
|
|
6
|
Zeng R, Liu Z, Sun Y and Xu C:
Differential expression and function of AR isoforms in prostate
cancer. Oncol Rep. 27:492–498. 2012.PubMed/NCBI
|
|
7
|
Carver BS, Chapinski C, Wongvipat J, et
al: Reciprocal feedback regulation of PI3K and androgen receptor
signaling in PTEN-deficient prostate cancer. Cancer Cell.
19:575–586. 2011. View Article : Google Scholar : PubMed/NCBI
|
|
8
|
Richter E, Srivastava S and Dobi A:
Androgen receptor and prostate cancer. Prostate Cancer Prostatic
Dis. 10:114–118. 2007. View Article : Google Scholar : PubMed/NCBI
|
|
9
|
Wang Q, Li W, Zhang Y, et al: Androgen
receptor regulates a distinct transcription program in
androgen-independent prostate cancer. Cell. 138:245–256. 2009.
View Article : Google Scholar : PubMed/NCBI
|
|
10
|
Wang Q, Li W, Liu XS, et al: A
hierarchical network of transcription factors governs androgen
receptor-dependent prostate cancer growth. Mol Cell. 27:380–392.
2007. View Article : Google Scholar : PubMed/NCBI
|
|
11
|
Yu J, Yu J, Mani RS, et al: An integrated
network of androgen receptor, polycomb, and TMPRSS2-ERG gene
fusions in prostate cancer progression. Cancer Cell. 17:443–454.
2010. View Article : Google Scholar : PubMed/NCBI
|
|
12
|
Jia L, Berman BP, Jariwala U, et al:
Genomic androgen receptor-occupied regions with different
functions, defined by histone acetylation, coregulators and
transcriptional capacity. PLoS One. 3:e36452008. View Article : Google Scholar : PubMed/NCBI
|
|
13
|
Xu G, Wu J, Zhou L, et al:
Characterization of the small RNA transcriptomes of androgen
dependent and independent prostate cancer cell line by deep
sequencing. PLoS One. 5:e155192010. View Article : Google Scholar : PubMed/NCBI
|
|
14
|
Tewari AK, Yardimci GG, Shibata Y, et al:
Chromatin accessibility reveals insights into androgen receptor
activation and transcriptional specificity. Genome Biol.
13:R882012. View Article : Google Scholar : PubMed/NCBI
|
|
15
|
Zhang Y, Liu T, Meyer CA, et al:
Model-based analysis of ChIP-Seq (MACS). Genome Biol. 9:R1372008.
View Article : Google Scholar : PubMed/NCBI
|
|
16
|
Bailey TL and Elkan C: Fitting a mixture
model by expectation maximization to discover motifs in
biopolymers. Proc Int Conf Intell Syst Mol Biol. 2:28–36.
1994.PubMed/NCBI
|
|
17
|
Ma W, Noble WS and Bailey TL: Motif-based
analysis of large nucleotide data sets using MEME-ChIP. Nat Protoc.
9:1428–1450. 2014. View Article : Google Scholar : PubMed/NCBI
|
|
18
|
Ashburner M, Ball CA, Blake JA, et al: The
Gene Ontology Consortium: Gene ontology: tool for the unification
of biology. Nat Genet. 25:25–29. 2000. View
Article : Google Scholar : PubMed/NCBI
|
|
19
|
Tomlins SA, Mehra R, Rhodes DR, et al:
Integrative molecular concept modeling of prostate cancer
progression. Nat Genet. 39:41–51. 2007. View Article : Google Scholar : PubMed/NCBI
|
|
20
|
Vander Griend DJ, D'Antonio J, Gurel B,
Antony L, Demarzo AM and Isaacs JT: Cell-autonomous intracellular
androgen receptor signaling drives the growth of human prostate
cancer initiating cells. Prostate. 70:90–99. 2010. View Article : Google Scholar : PubMed/NCBI
|
|
21
|
Kokontis JM, Hsu S, Chuu CP, Dang M,
Fukuchi J, Hiipakka RA and Liao S: Role of androgen receptor in the
progression of human prostate tumor cells to androgen independence
and insensitivity. Prostate. 65:287–298. 2005. View Article : Google Scholar : PubMed/NCBI
|
|
22
|
Attard G, Richards J and de Bono JS: New
strategies in metastatic prostate cancer: Targeting the androgen
receptor signaling pathway. Clin Cancer Res. 17:1649–1657. 2011.
View Article : Google Scholar : PubMed/NCBI
|
|
23
|
Lupien M, Eeckhoute J, Meyer CA, et al:
FoxA1 translates epigenetic signatures into enhancer-driven
lineage-specific transcription. Cell. 132:958–970. 2008. View Article : Google Scholar : PubMed/NCBI
|
|
24
|
Zinzen RP, Girardot C, Gagneur J, Braun M
and Furlong EE: Combinatorial binding predicts spatio-temporal
cis-regulatory activity. Nature. 462:65–70. 2009. View Article : Google Scholar : PubMed/NCBI
|
|
25
|
Liu T, Gao H, Yang M, Zhao T, Liu Y and
Lou G: Correlation of TNFAIP8 overexpression with the
proliferation, metastasis, and disease-free survival in endometrial
cancer. Tumour Biol. 35:5805–5814. 2014. View Article : Google Scholar : PubMed/NCBI
|
|
26
|
Liu T, Xia B, Lu Y, Xu Y and Lou G:
TNFAIP8 overexpression is associated with platinum resistance in
epithelial ovarian cancers with optimal cytoreduction. Hum Pathol.
45:1251–1257. 2014. View Article : Google Scholar : PubMed/NCBI
|
|
27
|
Zhang C, Kallakury BV, Ross JS, et al: The
significance of TNFAIP8 in prostate cancer response to radiation
and docetaxel and disease recurrence. Int J Cancer. 133:31–42.
2013. View Article : Google Scholar : PubMed/NCBI
|
|
28
|
Chase D, McLauchlan G, Eckersall PD,
Pratschke J, Parkin T and Pratschke K: Acute phase protein levels
in dogs with mast cell tumours and sarcomas. Vet Rec. 170:6482012.
View Article : Google Scholar : PubMed/NCBI
|
|
29
|
Papadia C, Louwagie J, Del Rio P, et al:
FOXE1 and SYNE1 genes hypermethylation panel as promising biomarker
in colitis-associated colorectal neoplasia. Inflamm Bowel Dis.
20:271–277. 2014. View Article : Google Scholar : PubMed/NCBI
|
|
30
|
Shi S, Zhou B, Wang Y, et al: Genetic
variation in RTN4 3′-UTR and susceptibility to cervical squamous
cell carcinoma. DNA Cell Biol. 31:1088–1094. 2012. View Article : Google Scholar : PubMed/NCBI
|