Introduction
The major purpose of the systemic energy metabolism
is to provide an energy source for the brain. The brain mainly
utilizes glucose and, if available, ketone bodies and lactate
(1). During prolonged exercise,
muscles use intramuscular glycogen and triacylglycerol (TG), as
well as circulating fuel sources. The muscle takes up glucose,
fatty acids, ketone bodies and potentially TG from the circulation
(2,3). Carbohydrate is the primary preferential
substrate for muscle, whereas the priority can be changed to lipid
under exercise (4).
The pace of marathon runners can sometimes abruptly
decrease after ~30 km, as the runners are struck by a sudden
feeling of exhaustion. This is called ‘hitting the wall’ and it is
explained as the depletion of intramuscular glycogen stores and the
absence of a suitable energy source in the circulation (5). Sengoku et al (6) described an individual who ran a 100-km
marathon while wearing a continuous glucose monitoring system
(CGMS). The runner maintained a constant pace of 11–12 km/h for 60
km but dropped the pace to 6 km/h for the next 30 km. The kinetics
of the blood glucose concentration were synchronized with running
velocity, being ~5.5 mM up to 60 km and ~3.3 mM during the next 30
km (6). A recent report by the same
author (7), however, described two
cases showing discordance between blood glucose and running
velocity.
Plasma glucose contributes ~10% of the energy
expenditure during exercise with intensity ranging between 25 and
85% of maximum oxygen uptake (VO2 max) (8); however, the difference in the
adaptation to endurance exercise could affect muscle glucose
consumption. Coggan et al (9)
reported that 12 weeks of training lowered plasma glucose
utilization from 21 to 15% of total energy expenditure during
90–120 min of exercise. Another study (10) found that trained athletes oxidized
only 5% of the total blood glucose as an energy source during
exercise at 65% VO2 max intensity for 60 min, whereas
untrained individuals required 23% of the blood glucose under the
same conditions.
The association among blood glucose levels, running
performance and training status has, therefore, not been clarified.
In addition, the continuous glucose transition during prolonged
running with the kinetics of hematological and biochemical indices
in healthy individuals has, to the best of our knowledge, not been
reported. Therefore, in the present study, two athletes with
different training statuses were monitored running for 5 h wearing
a CGMS.
Materials and methods
Subjects
Two healthy female college athletes participated in
the present study. Athlete A was a triathlete (age, 21 years;
height, 166 cm; weight, 62 kg; VO2 max, 59.6 ml/kg/min)
and athlete B was a tennis player (age, 21 years; height, 169 cm;
weight, 58 kg; VO2 max, 42.1 ml/kg/min). Both received
detailed information about the purpose, methods, expected results
and ethical considerations, including possible adverse effects,
relevant to the study, and both athletes provided written informed
consent to participate in the study. The athletes ate dinner as
usual, slept for ≥5 h on the day prior to the experiment and then
ate breakfast and arrived at the site of the experiment by 09:30
the following morning.
Study design
The athletes participated for 6 h in the First Japan
24 h Indoor Ultramarathon Race (Tokyo, Japan) on December 17, 2011,
which comprised running around a circular course with a
circumference of 247.4 m. The athletes ran from 11:00 to 16:00 at
their own pace, aiming to maintain their heart rates between 140
and 180 bpm with reference to an RS800CX heart-rate monitor (Polar,
Kempele, Finland); however heart rate data were not available for
athlete B as the start button was not pressed. Food and fluids were
freely provided by the race organizer throughout the event. The
energy and carbohydrate intake was calculated using a food
composition database (11), which
gave the following results: Subject A, 940.2 kcal (including 88.1 g
carbohydrate); and subject B, 1,006.1 kcal (including 137.2 g
carbohydrate) (Table I). Athletes A
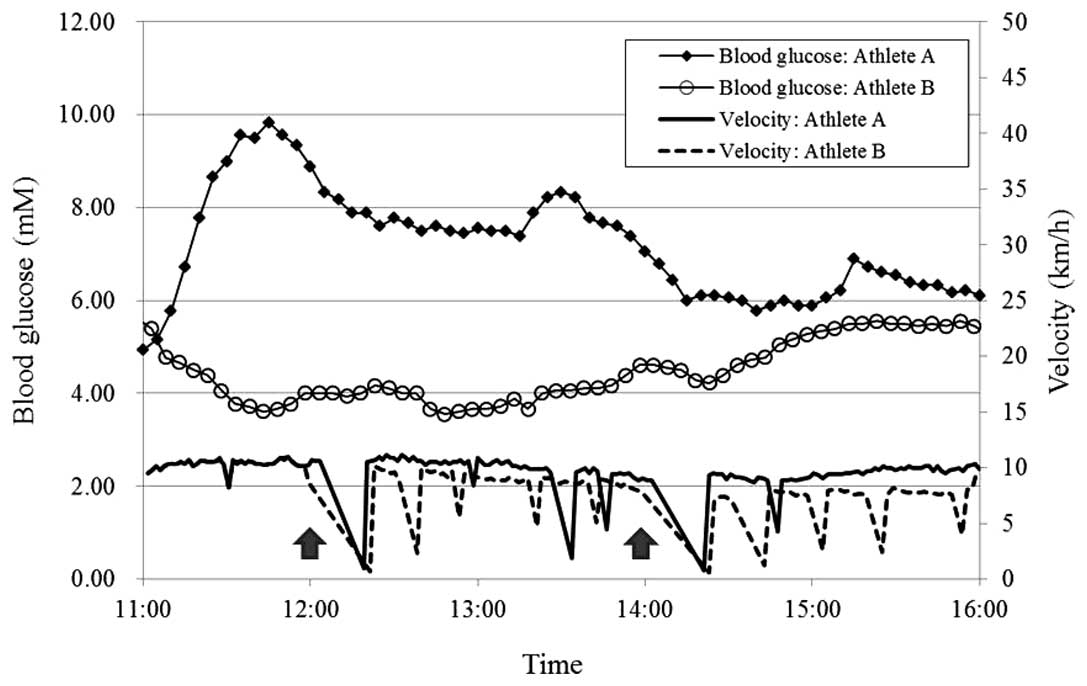
and B ran 43.048 and 34.141 km, respectively. The running velocity
was calculated by lap time (Fig. 1).
The estimated oxygen uptake at the average velocity of the initial
57 min, 10.3 km/h, was 34.8 ml/kg/min according to the table
provided by Cooper (12). Thus, the
exercise intensity for the initial 1 h was estimated to be 58.4 and
82.7% VO2 max for athletes A and B, respectively. During
the race, the athletes wore a Minimed CGMS-Gold® (Medtronic, Tokyo,
Japan) with the glucose sensor positioned subcutaneously ~20 cm
lateral to the hilum. Blood was collected 1 h before and 1, 3 and 5
h after starting the race. The Ethics Committee of Juntendo
University (Inzai, Chiba) approved the study protocol (Jundai SuRin
no. 23–24).
 | Table I.Energy and carbohydrate intake during
the 5-h run. |
Table I.
Energy and carbohydrate intake during
the 5-h run.
|
| Athlete A | Athlete B |
|---|
|
|
|
|
|---|
| Time | Energy (kcal) | Carbohydrate (g) | Energy (kcal) | Carbohydrate (g) |
|---|
| 11:00–12:00 | 19.0 | 4.7 | – | – |
| 12:00–13:00 | 195.1 | 24.8 |
158.6 | 25.6 |
| 13:00–14:00 | 290.0 | 46.5 |
175.9 | 28.8 |
| 14:00–15:00 | 436.1 | 12.1 |
454.6 | 36.9 |
| 15:00–16:00 | – | – |
217.0 | 45.9 |
| Total | 940.2 | 88.1 | 1,006.1 | 137.2 |
Analysis
Serum albumin, insulin, glucagon, catecholamine,
adrenocorticotropic hormone (ACTH), arginine vasopressin (AVP),
cortisol, TG, non-esterified fatty acid (NEFA), acetoacetic acid
and 3-hydroxybutyric acid (3-HB) were analyzed at an authorized
clinical laboratory (SRL, Inc., Tokyo, Japan) using the methods and
reagents described below. Albumin was assayed by bromocresol purple
dye-binding assay using Pureauto®S ALB reagent (Sekisui Medical,
Tokyo, Japan). Insulin, ACTH, cortisol and testosterone were
assayed by electrochemiluminescence immunoassay using Lumipulse®
Presto® for insulin (Fujirebio, Tokyo, Japan) and ECLusys reagents
for ACTH, cortisol and testosterone (Roche Diagnostics, Mannheim,
Germany). Glucagon and AVP were analyzed by double-antibody
radioimmunoassay (RIA) using the Millipore glucagon RIA (Merck
Millipore, Darmstadt, Germany) and AVP RIA Mitsubishi (Mitsubishi
Chemical Corp., Tokyo, Japan) kits, respectively. Catecholamines
(adrenaline, noradrenaline and dopamine) were measured by
high-performance liquid chromatography. TG and NEFAs were analyzed
using PureAutoS TG-N reagent (Sekisui Medical) and an NEFA-SS Eiken
kit (Eiken Chemical, Tokyo, Japan), respectively. Total ketone
bodies and 3-HB were measured by the Kainos® reagents for total
ketone bodies and 3-HB (Kainos Laboratories, Inc., Tokyo, Japan),
respectively. The acetoacetic acid level was calculated as the
difference between the measurements for total ketone bodies and
3-HB. Plasma amino acids were determined according to the method of
Bidlingmeyer et al (13) with
slight modifications (14).
Results
Blood glucose
Blood glucose levels in athlete A increased to ~10
mM soon into the run and then gradually decreased, but remained
>5.5 mM throughout the run. By contrast, the blood glucose
levels in athlete B fell to 3.6 mM during the run and then
gradually increased, although without reaching the pre-run level
(Fig. 1). Athlete B ingested more
carbohydrates than athlete A during the run (Table I). The timing and amount of the
carbohydrate did not directly reflect the blood glucose level
(Fig. 1).
Biochemical parameters
Plasma glucagon, ACTH, AVP, adrenaline,
noradrenaline and dopamine levels increased during the run in both
athletes, although their magnitude and kinetics differed between
the athletes (Table II). Adrenaline
in athlete A rose by 2.9-fold (from 29 to 81 pg/ml), and by
14.8-fold (from 16 to 236 pg/ml) in athlete B. Noradrenaline
increased by 1.6-fold (from 478 to 756 pg/ml) in athlete A and
2.5-fold (from 422 to 1,053 pg/ml) in athlete B. ACTH reached a
peak at 1 h in athlete B, and at 5 h in athlete A. AVP reached a
peak at 5 h in athlete A, and at 3 h in athlete B. In addition, it
was found that the total plasma amino acids during the first 3 h
increased in athlete A but decreased in athlete B; thereafter, the
levels decreased in athlete A and increased in athlete B. This
inconsistency was mainly due to differences in levels of
non-essential amino acids (NEAAs) during the first 3 h and in
essential amino acids (EAAs) over the next 2 h (Table III).
| Table II.Biochemical parameters. |
Table II.
Biochemical parameters.
|
| Athlete A | Athlete B |
|---|
|
|
|
|
|---|
| Parameter | Pre | 1 h | 3 h | 5 h | Pre | 1 h | 3 h | 5 h |
|---|
| Albumin (g/dl) | 5.4 | 5.0 | 5.1 | 5.1 | 5.1 | 5.5 | 5.3 | 5.3 |
| Insulin (µIU/ml) |
5.64 | 11.6 |
3.85 |
9.62 |
42.9 |
10.7 |
4.49 |
9.95 |
| Glucagon (pg/ml) | 59 | 63 | 87 | 66 | 78 | 114 | 164 | 123 |
| ACTH (pg/ml) | 15.2 | 22.5 | 31.9 | 43.2 | 36.4 | 68.8 | 68.4 | 43.9 |
| Cortisol (µg/dl) | 10.1 | 8.7 | 12.3 | 17 | 10.6 | 20.6 | 25.2 | 17.8 |
| Vasopressin
(pg/ml) | 1.2 | 1.4 | 1.7 | 3.1 | 1.5 | 1.8 | 3.7 | 2.1 |
| Catecholamines |
|
|
|
|
|
|
|
|
|
Adrenaline (pg/ml) | 29 | 50 | 81 | 59 | 16 | 56 |
236 | 125 |
|
Noradrenaline (pg/ml) | 478 | 595 | 753 | 756 | 422 | 782 | 1,053 | 978 |
| Dopamine
(pg/ml) | 5 | 19 | 20 | 23 | 15 | 34 |
69 | 102 |
| Triacylglycerol | 80 | 63 | 54 | 69 | 94 | 58 |
60 | 50 |
| NEFA (µEq/l) | 171 | 726 | 813 | 1,589 | 82 | 618 | 1,579 | 1,411 |
| Ketone bodies |
|
|
|
|
|
|
|
|
|
Acetoacetic acid (µmol/l) | 10 | 21 | 31 | 55 | 10 | 21 |
72 | 69 |
| 3-HB
(µmol/l) | 12 | 27 | 40 | 86 | 11 | 44 |
84 | 102 |
| Total
ketone bodiesa
(µmol/l) | 22 | 48 | 71 | 141 | 21 | 65 |
156 | 171 |
| Table III.Plasma amino acid concentrations in
the athletes. |
Table III.
Plasma amino acid concentrations in
the athletes.
|
| Athlete A | Athlete B |
|---|
|
|
|
|
|---|
| Amino acid | Pre | 1 h | 3 h | 5 h | Pre | 1 h | 3 h | 5 h |
|---|
| Aspartic acid
(µmol/l) | 15.1 | 11.3 | 11.8 | 11.0 | 15.1 | 11.5 | 9.8 | 9.9 |
| Glutamic acid
(µmol/l) | 36.6 | 37.7 | 39.6 | 39.4 | 33.8 | 27.9 | 35.4 | 33.1 |
| Asparagine
(µmol/l) | 41.1 | 50.1 | 47.7 | 48.3 | 57.9 | 41.4 | 33.9 | 35.4 |
| Serine
(µmol/l) | 93.8 | 115.6 | 112.4 | 97.9 | 124.4 | 96.5 | 86.2 | 83.4 |
| Glutamine
(µmol/l) | 475.8 | 575.2 | 626.2 | 662.7 | 614.7 | 571.8 | 516.0 | 525.1 |
| Glycine
(µmol/l) | 242.6 | 267.4 | 246.8 | 235.3 | 275.5 | 212.6 | 179.1 | 154.6 |
| Histidine
(µmol/l) | 64.0 | 74.0 | 78.7 | 80.0 | 80.5 | 71.0 | 58.2 | 63.4 |
| Arginine
(µmol/l) | 78.6 | 92.6 | 92.1 | 96.0 | 88.5 | 77.9 | 68.2 | 74.8 |
| Taurine
(µmol/l) | 115.5 | 72.8 | 100.3 | 80.3 | 96.6 | 69.9 | 68.5 | 62.2 |
| Threonine
(µmol/l) | 124.4 | 144.7 | 145.4 | 137.5 | 131.7 | 106.7 | 93.5 | 93.3 |
| Alanine
(µmol/l) | 439.3 | 535.3 | 499.9 | 426.3 | 399.7 | 393.2 | 266.3 | 240.2 |
| Proline
(µmol/l) | 137.2 | 145.6 | 136.4 | 130.9 | 204.5 | 183.2 | 159.8 | 131.2 |
| Tyrosine
(µmol/l) | 79.0 | 102.4 | 122.3 | 123.0 | 80.2 | 90.7 | 98.1 | 96.8 |
| Valine
(µmol/l) | 209.5 | 235.4 | 325.3 | 254.1 | 227.9 | 224.4 | 206.2 | 371.6 |
| Methionine
(µmol/l) | 20.2 | 29.5 | 32.6 | 25.5 | 26.0 | 33.5 | 24.9 | 19.5 |
| Isoleucine
(µmol/l) | 62.3 | 74.3 | 138.5 | 75.8 | 67.9 | 58.9 | 60.2 | 145.3 |
| Leucine
(µmol/l) | 109.9 | 134.6 | 254.1 | 142.7 | 116.0 | 126.3 | 111.5 | 281.0 |
| Phenylalanine
(µmol/l) | 79.8 | 86.7 | 93.1 | 104.2 | 80.3 | 77.1 | 82.8 | 89.5 |
| Lysine
(µmol/l) | 145.2 | 165.2 | 157.1 | 150.5 | 141.7 | 101.0 | 93.2 | 94.4 |
| Gln/Glu | 13.0 | 15.3 | 15.8 | 16.8 | 18.2 | 20.5 | 14.6 | 15.8 |
| BCAAsa (µmol/l) | 381.6 | 444.3 | 717.9 | 472.6 | 411.9 | 409.6 | 377.9 | 798.0 |
| EAAs (µmol/l) | 894.2 | 1,046.9 | 1,347.1 | 1,093.3 | 952.2 | 889.5 | 828.6 | 1,254.7 |
| NEAAs (µmol/l) | 1,560.1 | 1,830.9 | 1,813.0 | 1,747.9 | 1,814.2 | 1,616.0 | 1,354.6 | 1,287.8 |
| Total AAs
(µmol/l) | 2,454.3 | 2,877.8 | 3,160.1 | 2,841.2 | 2,766.4 | 2,505.5 | 2,183.2 | 2,542.5 |
Discussion
The two athletes ran >30 km, at the same pace in
the initial 1 h; however, the blood glucose levels were notably
different between them. The blood glucose concentration of athlete
B decreased to a minimum of 3.6 mM at 12:48 and then recovered
gradually. By contrast, the running velocity of athlete B was
maintained at ~10 km/h until the first break for blood collection
at noon, and then gradually decreased following the restart with
periodical valleys (Fig. 1). In
athlete A, however, the blood glucose levels increased from the
start of the run to 9.8 mM by 11:45, and then gradually decreased,
although they remained higher than the pre-run blood glucose level.
These kinetics did not reflect the running velocities of the two
athletes.
Carbohydrate intake during the run did not appear to
affect the blood glucose concentrations. Athletes A and B ingested
88.1 and 137.2 g carbohydrate, respectively, but their glucose
levels did not simultaneously increase. This was in agreement with
the report by Sengoku et al (7).
In athlete B, the blood glucose concentration
stopped falling and recovered after 3 h of running. Simultaneously,
the EAA levels increased, with the increase exceeding the decrease
in NEAAs to elevate the levels of total amino acids. EAAs cannot be
endogenously syntheized and thus the increase should indicate
extensive protein breakdown. Ezaki et al (15) reported that the increase in plasma
EAAs occurred via hepatic autophagy to maintain blood glucose in
starved mice. The same autophagy could be suggested in athlete
B.
In athlete B, the insulin concentrations were higher
than those in athlete A throughout the experiment. The initial
level may have been due to breakfast, since the diet was not
controlled or recorded by the first blood collection. This may
account for the initial decrease in the blood glucose; however, the
insulin-to-glucagon ratio was higher in athlete A than that in
athlete B during the running. Thus, the insulin levels alone could
not account for the hypoglycemia in athlete B.
The changes in ACTH, cortisol, catecholamines and
glucagon appeared to promote glycolysis to release glucose in the
circulation, although the effect was not distinctively shown in the
blood glucose levels. The magnitude of the change in these hormones
was greater in athlete B, which may have been due to the training
status: Athlete A, a triathlete, may have been more adapted to
endurance running.
It was expected that the blood glucose concentration
would correlate with the running velocity and carbohydrate
ingestion, but that was not proven. However, a discrepancy in the
blood glucose transition was observed between the triathlete and
the tennis player, indicating a possible association between the
adaptation to endurance exercise and the blood glucose kinetics
during prolonged running. Despite this, further study is warranted
to clarify the association between training status and glucose
kinetics, as the number of subjects studied was limited.
Acknowledgements
The authors would like to thank Mr. T. Kawana of
Juntendo University Urayasu Hospital for his assistance in specimen
collection. Part of this study was presented at the 67th Annual
Meeting of the Japanese Society of Physical Fitness and Sports
Medicine, September 14–16, 2012 in Gifu, Japan. The present study
was funded by Juntendo University (grant no. 1508-048).
References
|
1
|
Amiel SA: Organ fuel selection: Brain.
Proc Nutr Soc. 54:151–155. 1995. View Article : Google Scholar : PubMed/NCBI
|
|
2
|
Kiens B: Skeletal muscle lipid metabolism
in exercise and insulin resistance. Physiol Rev. 86:205–243. 2006.
View Article : Google Scholar : PubMed/NCBI
|
|
3
|
Henriksson J: Muscle fuel selection:
Effect of exercise and training. Proc Nutr Soc. 54:125–138. 1995.
View Article : Google Scholar : PubMed/NCBI
|
|
4
|
Lindholm A: What determines fuel selection
in relation to exercise? Proc Nutr Soc. 54:275–282. 1995.
View Article : Google Scholar : PubMed/NCBI
|
|
5
|
Newsholm E, Leech T and Duester G: Keep on
Running: The Science of Training and Performance. John Wiley &
Sons; Chichester: 1994
|
|
6
|
Sengoku Y, Nakamura K, Ogata H, Yoshioka
T, Watanabe K, Nabekura Y and Tokuyama K: Case-study of blood
glucose fluctuation and performance during 100 km marathon race.
Tairyoku Kagaku. 57:285–294. 2008.(In Japanese). View Article : Google Scholar
|
|
7
|
Sengoku Y, Nakamura K, Ogata H, Nabekura
Y, Nagasaka S and Tokuyama K: Continuous glucose monitoring during
a 100-km race: A case study in an elite ultramarathon runner. Int J
Sports Physiol Perform. 10:124–127. 2015. View Article : Google Scholar : PubMed/NCBI
|
|
8
|
Romijn JA, Coyle EF, Sidossis LS,
Gastaldelli A, Horowitz JF, Endert E and Wolfe RR: Regulation of
endogenous fat and carbohydrate metabolism in relation to exercise
intensity and duration. Am J Physiol. 265:E380–E391.
1993.PubMed/NCBI
|
|
9
|
Coggan AR, Kohrt WM, Spina RJ, Bier DM and
Holloszy JO: Endurance training decreases plasma glucose turnover
and oxidation during moderate-intensity exercise in men. J Appl
Physiol (1985). 68:990–996. 1990.PubMed/NCBI
|
|
10
|
Jansson E and Kaijser L: Substrate
utilization and enzymes in skeletal muscle of extremely
endurance-trained men. J Appl Physiol (1985). 62:999–1005.
1987.PubMed/NCBI
|
|
11
|
Japanese Ministry of Education, Culture,
Sports, Science and Technology (MEXT), . Food composition database.
http://fooddb.jp/index.plMarch.
2012
|
|
12
|
Cooper KH: A means of assessing maximal
oxygen intake. Correlation between field and treadmill testing.
JAMA. 203:201–204. 1968. View Article : Google Scholar : PubMed/NCBI
|
|
13
|
Bidlingmeyer BA, Cohen SA and Tarvin TL:
Rapid analysis of amino acids using pre-column derivatization. J
Chromatogr. 336:93–104. 1984. View Article : Google Scholar : PubMed/NCBI
|
|
14
|
Iwai K, Hasegawa T, Taguchi Y, Morimatsu
F, Sato K, Nakamura Y, Higashi A, Kido Y, Nakabo Y and Ohtsuki K:
Identification of food-derived collagen peptides in human blood
after oral ingestion of gelatin hydrolysates. J Agric Food Chem.
53:6531–6536. 2005. View Article : Google Scholar : PubMed/NCBI
|
|
15
|
Ezaki J, Matsumoto N, Takeda-Ezaki M,
Komatsu M, Takahashi K, Hiraoka Y, Taka H, Fujimura T, Takehana K,
Yoshida M, et al: Liver autophagy contributes to the maintenance of
blood glucose and amino acid levels. Autophagy. 7:727–736. 2011.
View Article : Google Scholar : PubMed/NCBI
|