Introduction
Diabetic nephropathy (DN) is a long-term
microvascular complication of diabetes mellitus, affecting 30–35%
of diabetic patients and is a major cause of end-stage renal
disease (ESRD) (1). The incidence of
ESRD associated with type 2 diabetes (T2D) has markedly increased
because the prevalence of T2D has increased greatly, and accounts
for >90% of diabetic cases (2).
The molecular pathophysiology of DN is complex,
involving interactions between hyperglycemia-induced metabolic,
hemodynamic and inflammatory factors (3,4). These
factors modify the function and morphology of blood vessel walls
and interact with neighboring cells leading to renal endothelial
dysfunction, which plays a central role in the development of DN
(4).
The earliest clinical indication of DN is the
appearance of abnormally low levels of albumin in the urine
(microalbuminuria) (5). The onset of
microalbuminuria leads to macroalbuminuria, and the latter is
followed by deterioration of renal function with a progressive
decline in the glomerular filtration rate (GFR), which eventually
leads to ESRD (6). Although
microalbuminuria is considered as the gold standard for the
diagnosis of DN, it can reveal renal dysfunction only after a long
period of a clinically silent phase of the disease (7), and is also independently associated
with increased cardiovascular risk (8). In addition, it has been reported that
renal impairment occurs in one-third of patients with DN, even
prior to the appearance of microalbuminuria (9). Other markers of DN risk are required
for optimal clinical management (9),
particularly for patients with T2D who pass through a period of
pre-diabetes and may experience renal impairment at the time of
diagnosis. In this regard, a number of candidate markers have been
proposed for the early identification of renal injury, such as
creatinine, kidney enzymes, cystatin C and C-reactive protein
(10,11).
Genomic regulatory non-coding RNA molecules, namely
microRNAs (miRNAs), have been shown to be involved in the control
of key biological processes such as proliferation, differentiation,
apoptosis and metabolism (12).
miRNAs function through inhibition of translation by binding to the
3′ untranslated region (3′-UTR) of their target messenger RNAs
(mRNAs) (13). Alterations in the
regulation of these miRNAs can lead to serious physiological
abnormalities, including chronic diseases such as diabetes
(14,15). Studies using in vivo and in
vitro models of diabetic renal disease have also linked the
dysregulation of miRNA expression with the pathogenicity and
progression of DN (16,17).
miRNAs have been found in tissues and several human
body fluids, including blood, in a stable form that is protected
from endogenous RNase activity (18,19). The
sequences of the majority of miRNAs are conserved among different
species and their expression is tissue- or biological
stage-specific (20). miRNAs are
accessible through non-invasive methods, and can be easily assessed
by sensitive and specific methods such as quantitative polymerase
chain reaction (qPCR) (19,20). This has led to the proposal that
circulating miRNAs may be useful biomarkers for the detection of
various diseases, including cancer and diabetes (21–23).
miR-126 is highly enriched in endothelial cells and
plays a key role in angiogenesis (24). It is the most extensively studied
miRNA in diabetes, and a number of studies have shown decreased
circulating miR-126 levels in the blood of patients with T2D
(25–27). Moreover, changes in circulating
miR-126 levels have been reported to be associated with DN and
diabetic microvascular damage (28)
and with the development of ESRD (29).
The aim of the present study was to investigate the
expression of circulating miR-126 in the peripheral whole blood of
patients with T2D without history of DN (with normoalbuminuria), DN
patients (with microalbuminuria/macroalbuminuria) and non-diabetic
healthy control individuals, and to evaluate the potential of
miR-126 as a blood-based biomarker for DN in patients with T2D.
Materials and methods
Participants and clinical data
The study included 152 individuals: 52 patients with
T2D without history of DN (with normoalbuminuria), 50 DN patients
who had a history of albuminuria
(microalbuminuria/macroalbuminuria) and 50 non-diabetic healthy
controls. All subjects were recruited from King Abdullah University
Medical Centre (Arabian Gulf University, Kingdom of Bahrain). The
study was approved by the Research and Ethics Committee in the
College of Medicine and Medical Sciences, Arabian Gulf University.
The participants provided written consent for research use of their
blood samples.
Age, gender, body mass index (BMI), blood pressure
and other clinical parameters were collected by reviewing the
medical records of the participants.
The diagnosis of T2D was in accordance with the
World Health Organization (WHO) criteria (30) using combinations of the following
parameters: Fasting glucose (FG) levels ≥7.0 mmol/l (126 mg/dl) or
2-h glucose levels ≥11.1 mmol/l (200 mg/dl) in an oral glucose
tolerance test, and glycated hemoglobin (HbA1c) levels >6.5%.
Normoalbuminuria was defined as an albumin/creatinine ratio (ACR)
<2.5 mg/mmol for men and ACR <3.5 mg/mmol for women, with an
albumin excretion rate (AER) of <25 mg/day. Microalbuminuria was
defined as an ACR of 2.5–25 mg/mmol for men and 2.8–28 mg/mmol for
women, with an AER of 30–300 mg/day. Macroalbuminuria was defined
as an ACR of >25 mg/mmol for men and >28 mg/mmol for women,
with an AER of >300 mg/day. GFR was assessed using the
Modification of Diet in Renal Disease (MDRD) formula (31). Hypertension was defined as a systolic
pressure of ≥140 mmHg, and/or a diastolic pressure of ≥90 mmHg. T2D
patients without nephropathy had ≥10 years of diabetes duration,
were without history of albuminuria, and had normal renal function
and normal blood pressure (≤130/80 mmHg). Healthy control
individuals had a FG level of 4.8–5.2 mmol/l (<110 mg/dl), were
without history of albuminuria, and had normal renal function and
normal blood pressure. General exclusion criteria were a known
history of vascular events (stroke, unstable angina, acute
myocardial infarction or coronary artery disease), or evidence of
hepatic dysfunction and neoplastic diseases.
Extraction of miRNA
Whole blood samples were collected in tubes
containing ethylenediamine tetraacetic acid, and total RNA
including miRNA was extracted using a Norgen Blood RNA kit (Norgen
Biotek Corporation, Thorold, ON, Canada) following the
manufacturers' protocol. Samples were stored at −80°C until RNA
extraction. RNA concentration and quality were assessed using a
NanoDrop ND-1000 spectrophotometer (Thermo Fisher Scientific, Inc.,
Waltham, MA, USA).
Reverse transcription (RT)-qPCR
RT-qPCR analysis was performed using the
TaqMan® MicroRNA Reverse Transcription kit and Applied
Biosystems Real-Time PCR detection system (Thermo Fisher
Scientific, Inc.) as previously described (22). The small nuclear RNU6B was used for
normalization (22). The PCR primer
sequences were as follows: Mature hsa-miR-126 (target),
UCGUACCGUGAGUAAUAAUGC and RNU6B (reference),
CGCAAGGATGACACGCAAATTCGTGAAGCGTTCCATATTTTT (Thermo Fisher
Scientific, Inc.). qPCR was performed using a 7900HT Fast Real Time
PCR system (Thermo Fisher Scientific, Inc.) with the following
cycling conditions: 95°C for 10 min, followed by 95°C for 15 sec
and 60°C for 60 sec for a total of 40 cycles. All reactions were
performed in duplicate under identical experimental conditions.
Results were analyzed using Sequence Detection Software, version
1.7 (Applied Biosystems; Thermo Fisher Scientific, Inc.). The
expression levels of miR-126 were normalized to those of RNU6B, and
relative expression values were calculated using the
2−ΔΔCt method as previously described (22). The Ct values from qPCR assays with
>35 cycles were treated as not expressed.
Data analysis
Data were analyzed using SPSS version 19 (IBM,
Armonk, NY, USA). Chi-square and Student's t-tests were used to
compare the expression levels of miR-126, and the differences in
clinical parameters between T2D patients or DN patients and
non-diabetic healthy controls. One-way analysis of variance was
used to compare differences in clinical parameters among the
subject groups. The odds ratios (ORs) and 95% confidence intervals
(CIs) were calculated to assess the association of miR-126 with T2D
and DN, with multivariate logistic regression models after
adjusting for multiple factors. Pearson's correlation coefficient
was used to test the correlation between miR-126 and albuminuria,
estimated GFR (eGFR), and other clinical variables. A stepwise
multiple regression analysis was performed to identify the
predictors of miR-126 (dependent variable). Receiver operating
characteristic (ROC) analysis was used to assess the biomarker
potential of miR-126 for DN, and areas under the curves (AUCs) were
reported. All statistical analyses were two-sided, and a P-value
<0.05 was considered significant.
Results
Baseline characteristics of
subjects
The baseline characteristics of the subjects in this
study are shown in Table I. There
was a significant difference in age between T2D patients, DN
patients and non-diabetic healthy controls (P<0.05), but no
statistically significant difference was found for gender
(P>0.05). FG, HbA1c and total cholesterol levels differed
significantly in T2D patients and DN patients compared with
controls (P<0.05). Patients with DN had significantly higher
blood pressure and triglyceride levels than patients with T2D and
controls (P<0.05). There was no significant difference between
the T2D patient and DN patient groups in terms of FG, HbA1c,
diabetes duration, LDL and HDL (P>0.05). Patients with DN
exhibited increased albuminuria, ACR and serum creatinine and
decreased eGFR compared with T2D patients (P<0.05).
 | Table I.Baseline characteristics of
subjects. |
Table I.
Baseline characteristics of
subjects.
| Characteristic | T2D
(normoal-buminuria) | All DN
microalbuminuria/macroalbuminuria | DN
(microal-buminuria) | DN
(macro-albuminuria) | Controls |
|---|
| Number of
subjects | 52 | 50 | 29 | 21 | 50 |
| Age (years) |
62.0±10.5a |
64.6±6.3a | 62.5±6.5 | 67.0±5.4 | 56±5.2 |
| Gender
(male/female) | 27/25 | 24/26 | 16/13 | 8/13 | 22/28 |
| BMI
(kg/m2) | 25.2±4.5 |
26.3±5.2a | 26.7±5.1 | 25.8±4.7 | 24.2±4.1 |
| Mean blood pressure
(mmHg) | 86.2±11.3 |
96.2±12.6a,c | 92.8±10.5 | 99.5±13.4 | 83.9±2.5 |
| Diabetes duration
(years) | 15.2±4.4 | 17.5±4.6 | 16.4±4.4 | 19.0±4.1 | – |
| FG (mmol/l) |
8.8±2.2b |
8.7±1.2b | 8.6±1.4 | 8.8 ±1.1 | 4.3±0.6 |
| HbA1c (%) |
8.9±2.7b |
9.3±1.8b | 8.1±1.1 | 10.6±1.4 | 4.9±0.7 |
| Total cholesterol
(mmol/l) |
4.4±1.2a |
4.6±1.1b | 4.3±1.2 | 4.9±0.9 | 4.02±0.8 |
| LDL (mmol/l) | 2.8±1.4 |
4.4±1.5a | 3.7±1.2 | 4.3±1.0 | 2.14±0.8 |
| HDL (mmol/l) | 1.3±0.3 | 1.3±0.3 | 1.4±0.2 | 1.2±0.3 | 1.3±0.2 |
| Triglyceride
(mmol/l) | 1.7±0.6 |
2.5±1.3b,c | 1.8±1.3 | 3.2±1.1 | 1.6±0.6 |
| Albuminuria
(mg/day) | 6.2±3.3 |
223.3±117.9b,c | 113.4±52.2 | 332.8±28.7 | 5.4±1.7 |
| ACR (mg/mmol) | 1.0±0.7 |
28.3±12.0b,c | 22.2±15.8 | 34.3±7.7 | 0.9±0.4 |
| Serum creatinine
(mm/l) |
66.3±15.3a |
119.2±45.8b,c | 121.2±41.1 | 176.8±41.2 | 54.7±11.7 |
| eGFR (ml/min/1.73
m2) | 95.0±9.4 |
66.0±14.8b,c | 78.2±15.1 | 53.7±7.7 | 104.3±13.2 |
Expression of circulating miR-126 in
T2D patients, DN patients and healthy controls
The expression levels of circulating miR-126 in
peripheral whole blood were quantified by qPCR in T2D patients, DN
patients and non-diabetic healthy individuals; and were expressed
relative to the endogenous control RNU6B as mean ± standard
deviation (SD).
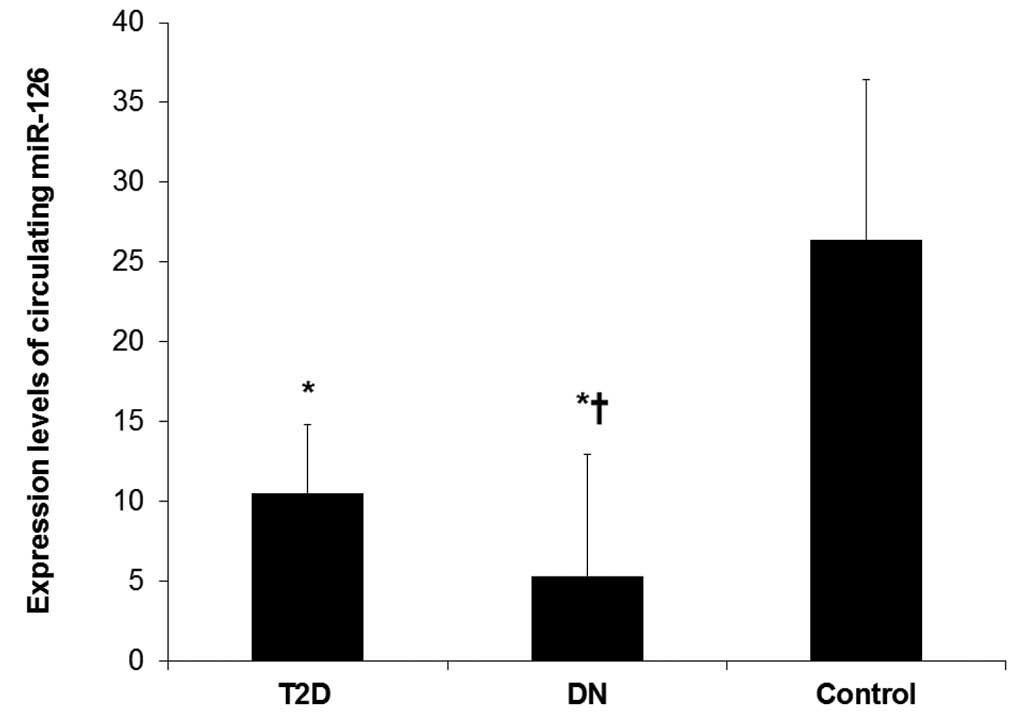
In comparison with those in non-diabetic healthy
control individuals, the expression levels of circulating miR-126
were significantly decreased in T2D patients and further decreased
in DN patients (P<0.05; Fig. 1).
miR-126 levels were 2.5-fold lower in T2D patients and 5-fold lower
in DN patients compared with controls. Notably, DN patients had
significantly lower miR-126 levels (2-fold lower) compared with
those in T2D patients (P<0.05). The means (± SD) of relative
quantification for miR-126 were 10.5±4.3 for T2D patients, 5.3±7.6
for DN patients and 26.4±10.0 for controls.
On the application of further analysis using
multivariate logistic regression with adjustment for age, gender,
BMI and blood pressure, additionally for FG and HbA1c, and further
for triglyceride and LDL (Table
II), low miR-126 levels were independently associated with T2D
(OR, 0.797; 95% CI, 0.613–0.960; P=0.003) and with DN (OR, 0.513;
95% CI, 0.371–0.708; P=0.002).
| Table II.Association of circulating miR-126
expression levels with T2D and DN. |
Table II.
Association of circulating miR-126
expression levels with T2D and DN.
|
| T2D | DN |
|---|
|
|
|
|
|---|
| Circulating
miR-126 | OR (95% CI) | P-value | OR (95% CI) | P-value |
|---|
| Crude | 0.778
(0.708–0.853) | <0.001 | 0.557
(0.467–0.664) | <0.001 |
| Adjusted, model
1a | 0.869
(0.761–0.901) | 0.002 | 0.601
(0.496–0.728) | 0.030 |
| Adjusted, model
2b | 0.817
(0.669–0.923) | 0.046 | 0.540
(0.415–0.702) | 0.005 |
| Adjusted, model
3c | 0.797
(0.613–0.960) | 0.003 | 0.513
(0.371–0.708) | 0.002 |
Association of circulating miR-126
expression with the degree of albuminuria
To evaluate the association between circulating
miR-126 and albuminuria, a sub-analysis was performed in T2D
patients with normoalbuminuria (n=52), and DN patients with
microalbuminuria (n=29) or macroalbuminuria (n=21) to determine the
association between circulating miR-126 expression levels and the
development of DN.
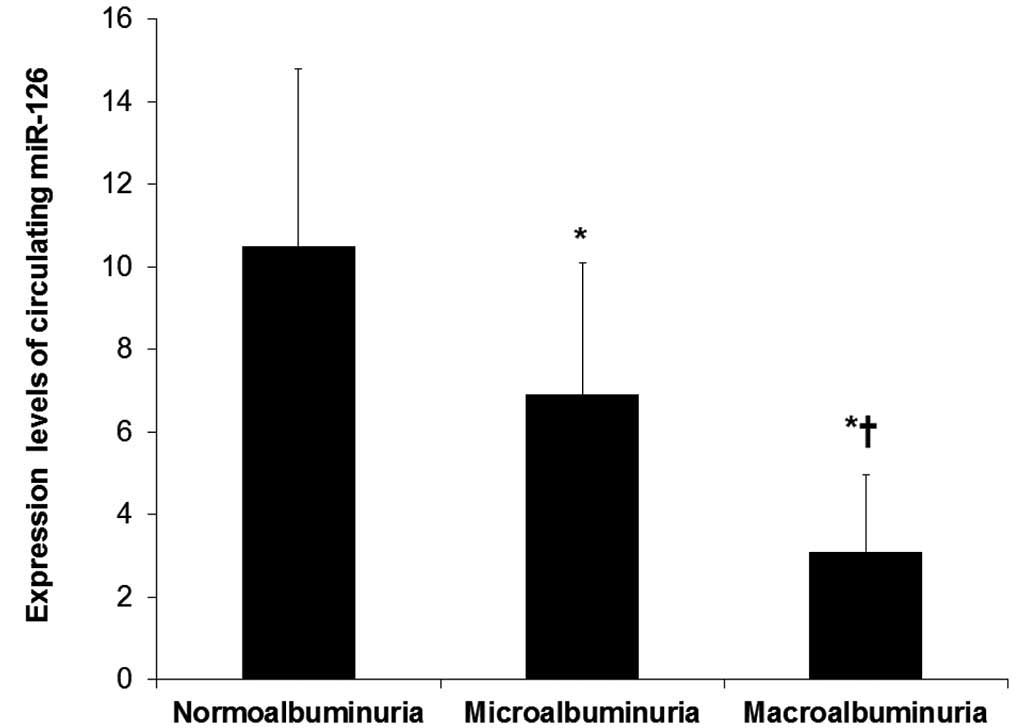
As shown in Fig. 2,
miR-126 levels were significantly lower in DN patients with
microalbuminuria, and were further decreased in DN patients with
macroalbuminuria than in T2D patients with normoalbuminuria
(P<0.05). The means (± SD) of relative quantification for
miR-126 were 10.5±4.3 for normoalbuminuria, 6.9±3.2 for
microalbuminuria and 3.4±2.2 for macroalbuminuria.
The association of circulating miR-126 with the
degree of albuminuria was also confirmed in multivariate logistic
regression analysis after adjustment for age, gender, BMI and blood
pressure, additionally for FG and HbA1c, and further for
triglyceride and LDL. The adjusted OR was found to be 0.781 (95%
CI, 0.698–0.952; P=0.04) for microalbuminuria and the adjusted OR
was 0.433 (95% CI, 0.299–0.701; P=0.03) for macroalbuminuria
(Table III).
| Table III.Association of circulating miR-126
expression levels with the degree of albuminuria. |
Table III.
Association of circulating miR-126
expression levels with the degree of albuminuria.
|
|
Microalbuminuria |
Macroalbuminuria |
|---|
|
|
|
|
|---|
| Circulating
miR-126 | OR (95% CI) | P-value | OR (95% CI) | P-value |
|---|
| Crude | 0.758
(0.643–0.894) | 0.013 | 0.394
(0.275–0.564) | <0.001 |
| Adjusted, model
1a | 0.756
(0.641–0.892) | 0.046 | 0.347
(0.226–0.532) | <0.001 |
| Adjusted, model
2b | 0.769
(0.647–0.931) | 0.05 | 0.426
(0.291–0.624) | 0.03 |
| Adjusted, model
3c | 0.781
(0.698–0.952) | 0.04 | 0.433
(0.299–0.701) | 0.03 |
Correlation and multivariate
analysis
Pearson's correlation coefficient was calculated in
patients with DN to determine the correlation between circulating
miR-126 and renal function parameters, including albuminuria and
eGFR, as well as other clinical variables including FG, HbA1c,
triglyceride and LDL.
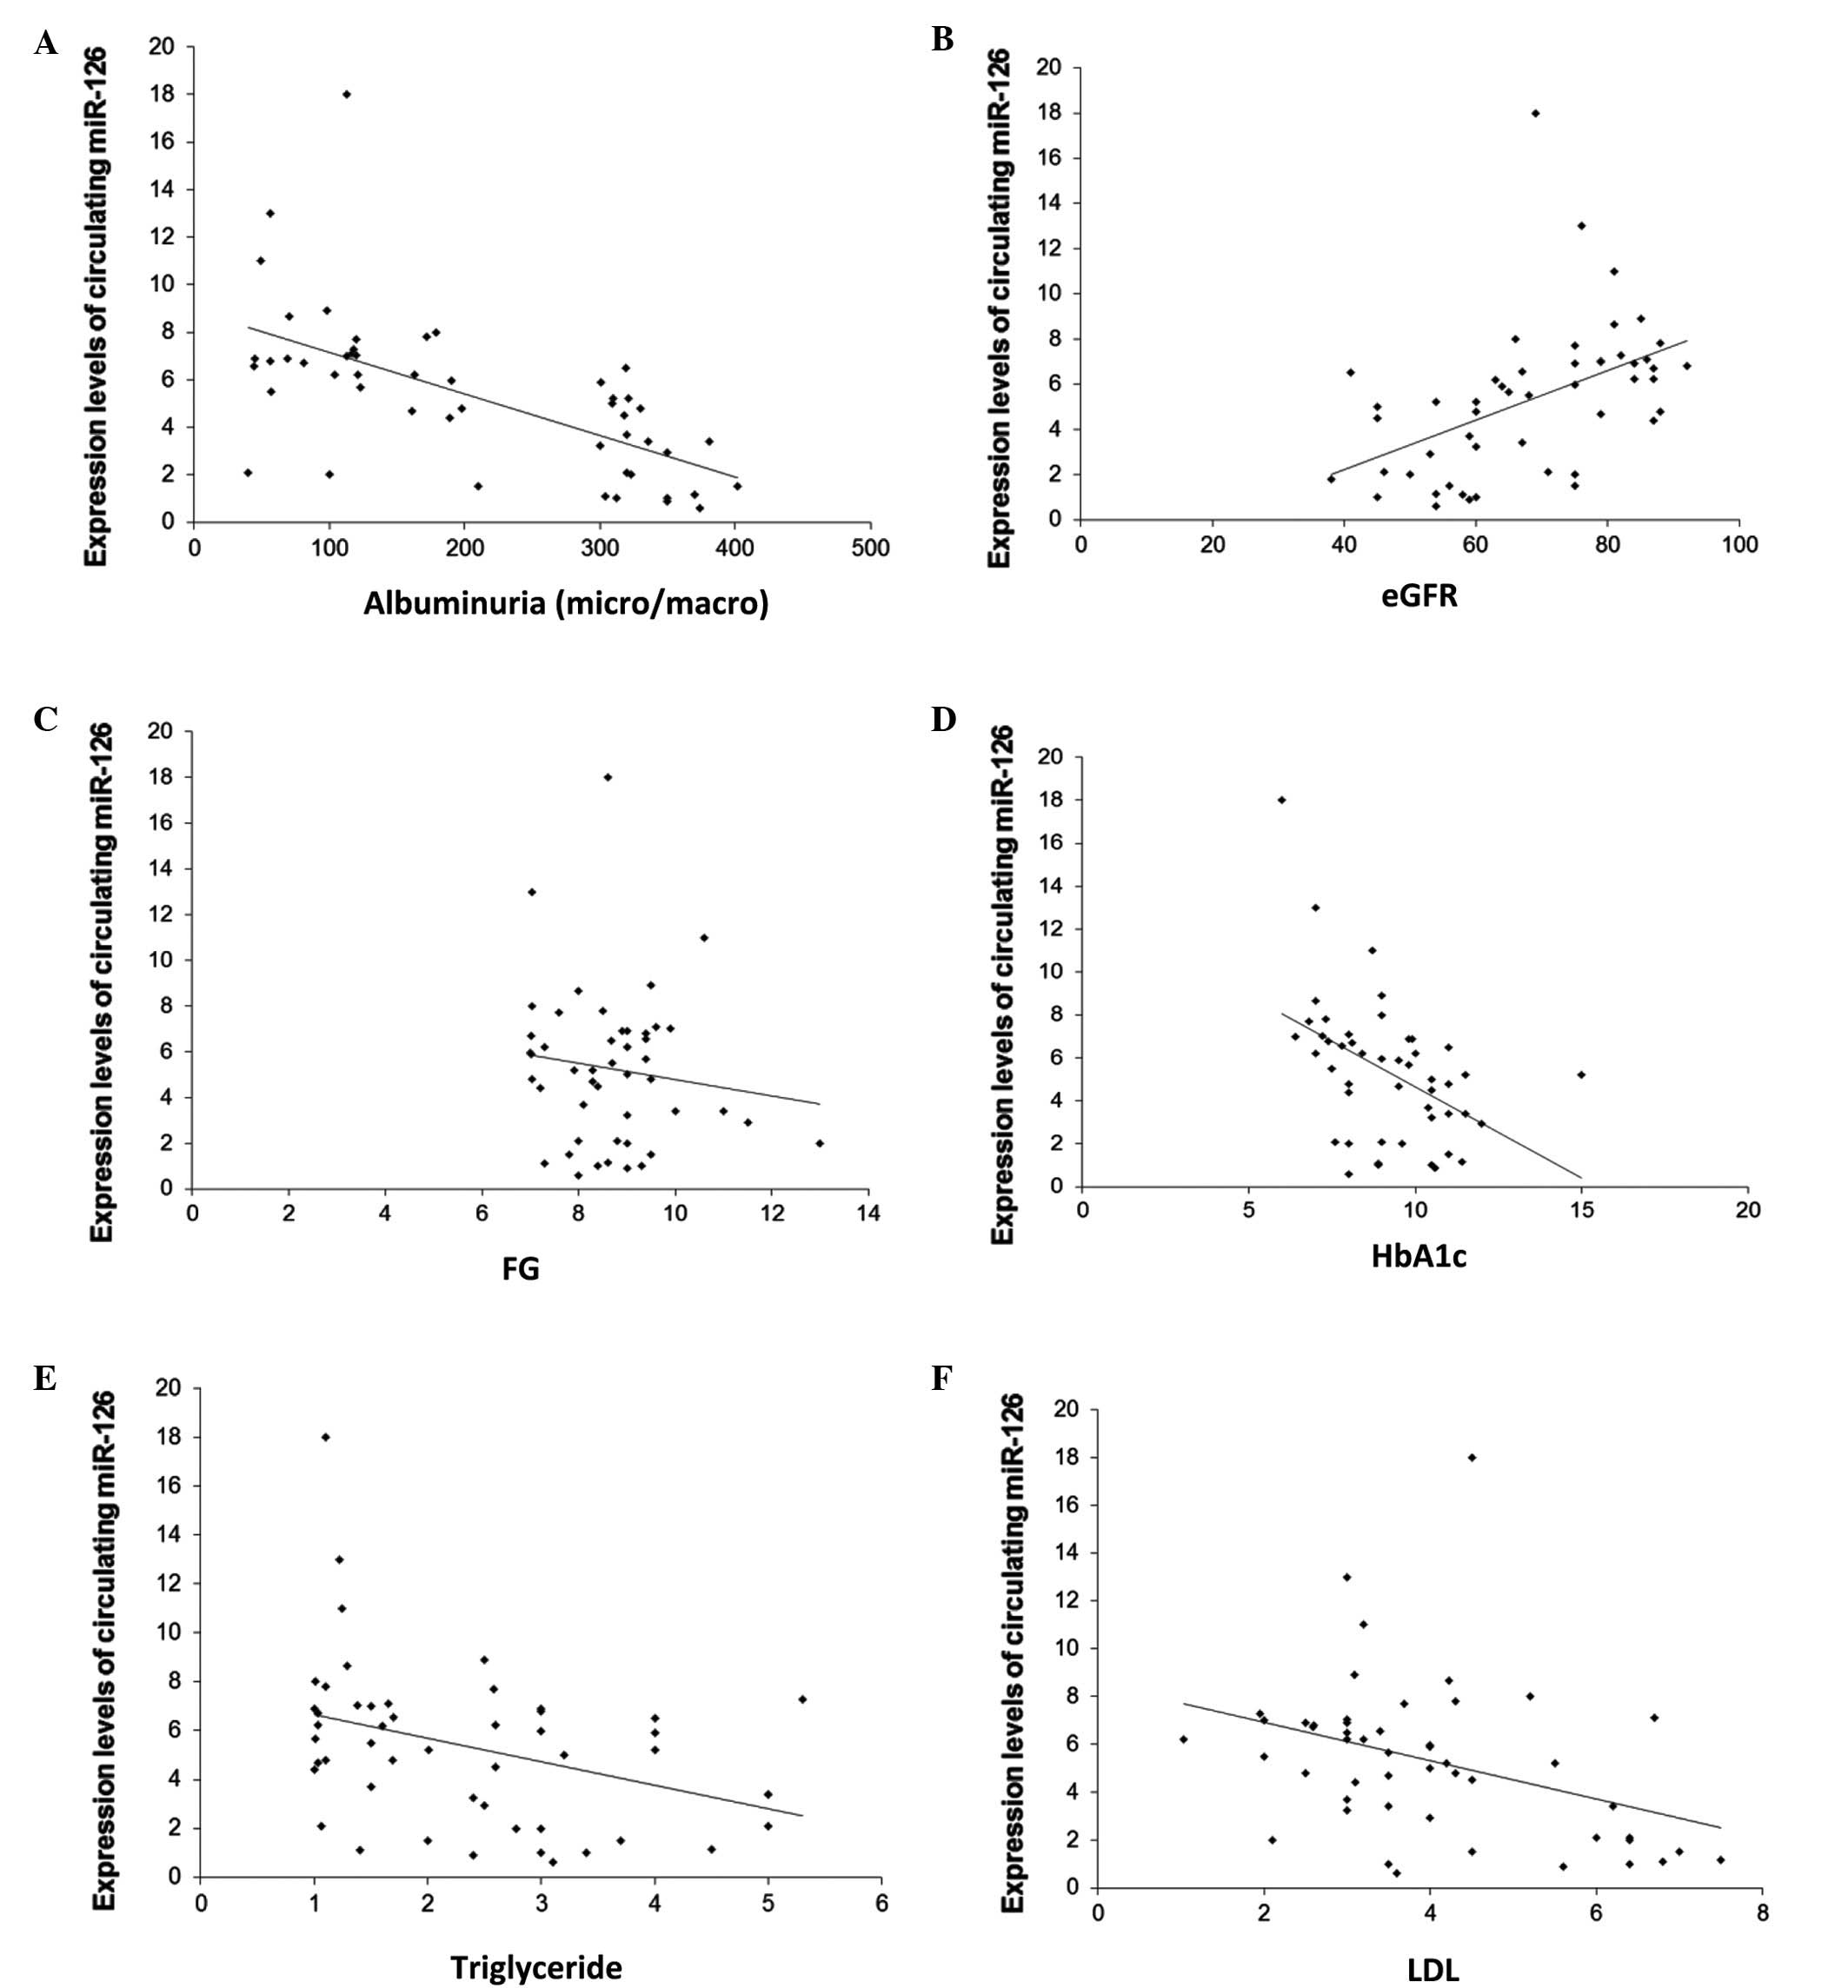
The results showed that the expression levels of
circulating miR-126 were significantly and negatively correlated
with albuminuria (r=−0.63; P<0.001; Fig. 3A), and were significantly and
positively correlated with eGFR (r=0.48; P<0.001; Fig. 3B). Moreover, miR-126 levels were
negatively correlated with FG (r=−0.63; P<0.001; Fig. 3C), HbA1c (r=−0.63; P<0.001;
Fig. 3D), triglyceride (r=−0.63;
P<0.001; Fig. 3E) and LDL
(r=−0.63; P=0.01; Fig. 3F).
In addition, stepwise multiple regression analyses
applied in these subjects, which included albuminuria, eGFR as well
as age, gender, BMI, blood pressure, FG, HbA1c, total cholesterol,
triglyceride and LDL, identified albuminuria as a significant
predictor of circulating miR-126 (P<0.001).
ROC analysis
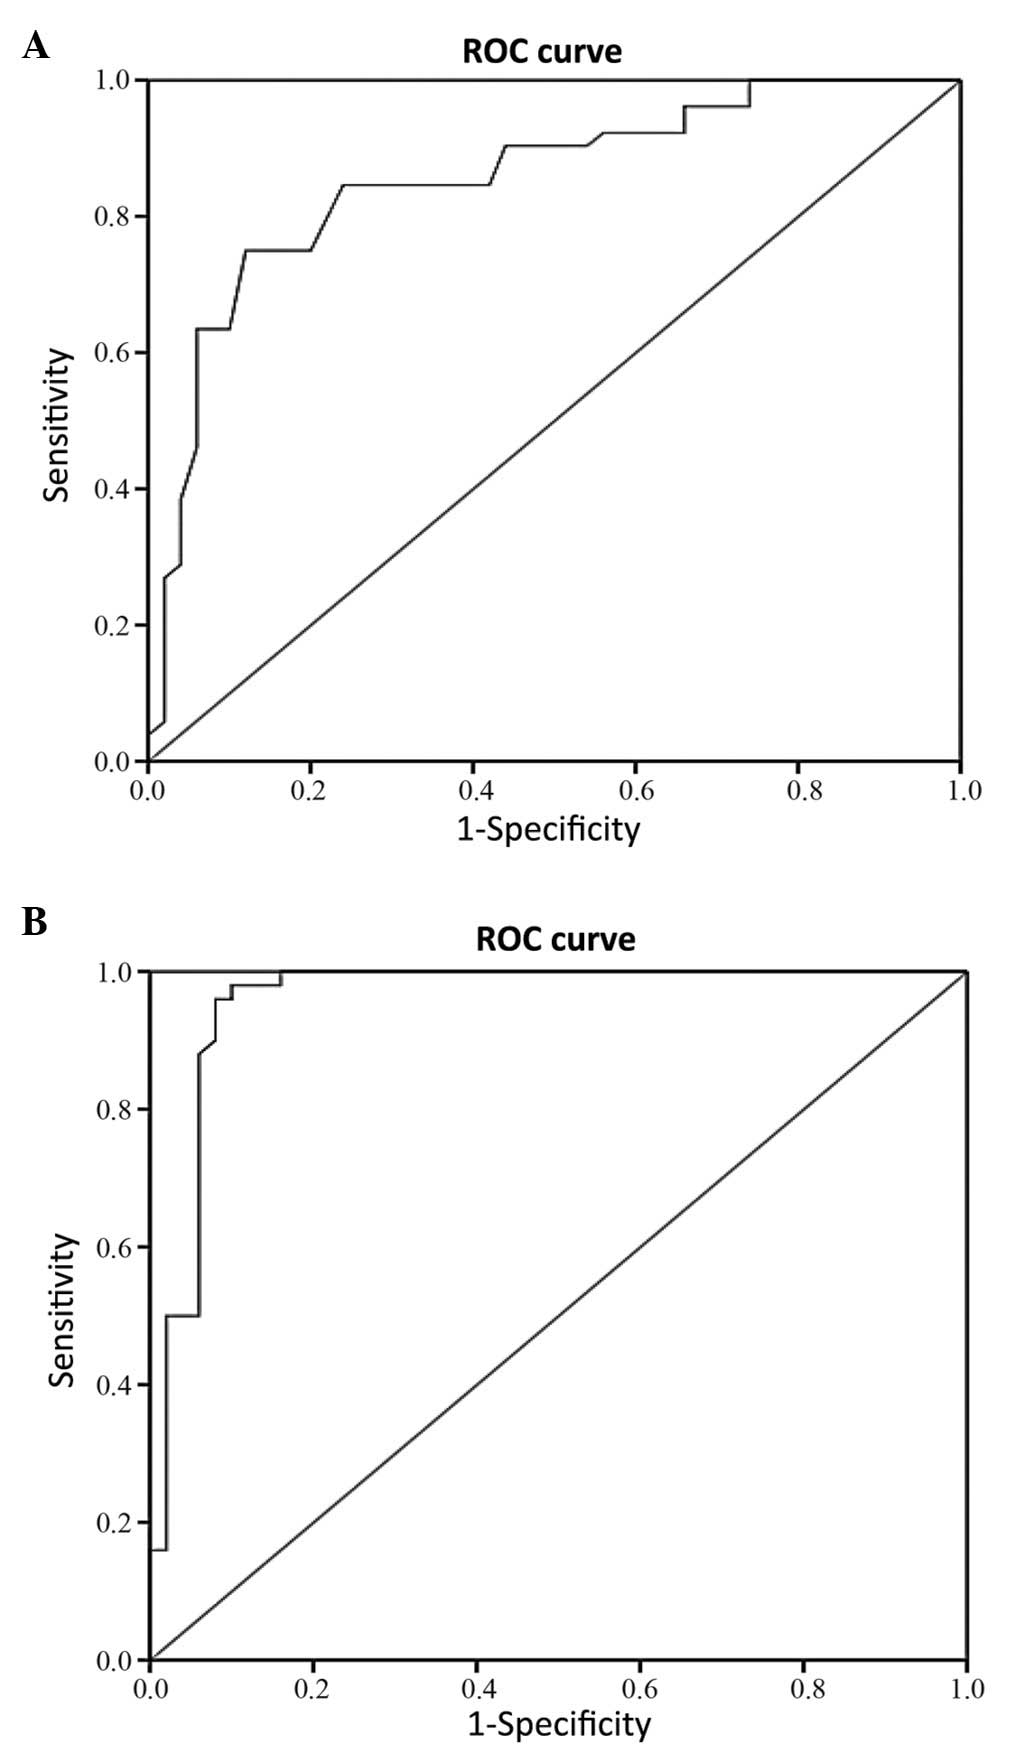
ROC analysis was performed to evaluate the
usefulness of circulating miR-126 as a potential blood-based
biomarker for DN in T2D patients.
First, the expression levels of circulating miR-126
were compared between DN patients and T2D patients. The ROC
analysis of miR-126 yielded an AUC of 0.854 (95% CI, 0.779–0.929;
P<0.001) in the differentiation of DN patients from T2D patients
(Fig. 4A).
Next, the expression levels of circulating miR-126
were compared between DN patients and non-diabetic healthy control
individuals. The AUC of the ROC curve was found to be 0.959 (95%
CI, 0.916–1.000; P<0.001) in the differentiation of DN patients
from healthy controls (Fig. 4B).
Discussion
MicroRNAs (miRNAs) have emerged as key players in
the modulation of gene expression in several biological processes
(12), and have been implicated in
the manifestation of various diseases, including diabetes and
kidney diseases (14–17). miRNAs can be encapsulated in
exosomes, microparticles, or apoptotic bodies (32,33), and
actively released from cells and enter the circulation. It is
believed that circulating miRNAs mediate cell-to-cell communication
(33,34), and correlate well with diseases or
injurious conditions. Changes in the levels of circulating miRNAs
have been observed in several diseases, suggesting that miRNAs
could serve as a new class of biomarkers (21–23).
In the present study, the expression of circulating
miR-126 was investigated in the peripheral whole blood of T2D
patients without history of DN (with normoalbuminuria), T2D
patients with DN (with microalbuminuria/macroalbuminuria), and
non-diabetic healthy control individuals; and the possibility of
using circulating miR-126 as a blood-based biomarker for DN was
evaluated.
The results showed significantly reduced expression
levels of circulating miR-126 in T2D patients, with further
reduction in DN patients as compared with non-diabetic healthy
controls. The results also showed a significant association of
lower circulating miR-126 levels with T2D and DN after controlling
for possible confounders.
Previous studies on diabetes have shown decreased
circulating miR-126 levels in the blood of patients with T2D
(25–27), and the results of the present study
are in agreement with these reports. However, in contrast to
previous clinical data for DN which showed increased miR-126 levels
in blood samples of DN patients with type 1 diabetes (T1D)
(28) and in urine samples of DN
patients of T2D (35) compared with
healthy individuals, the results of the present study revealed
decreased expression levels of circulating miR-126 in the
peripheral blood of T2D patients with DN compared with the levels
in non-diabetic healthy controls. Osipova et al (36) reported lower miR-126 levels in the
urine of T1D pediatric patients compared with corresponding
controls, but they found no differences in the levels of miR-126 in
plasma from the two groups, whereas Wang et al (29) observed decreased circulating miR-126
levels in the plasma of patients with chronic kidney disease, which
was associated with the development of ESRD.
miR-126, a highly enriched miRNA in endothelial
cells and apoptotic bodies (24),
promotes pro-angiogenic actions by repressing two negative
regulators of the vascular endothelial growth factor (VEGF)
pathway, namely Sprouty-related protein (SPRED1) and
phosphoinositol-3 kinase regulatory subunit 2 (PIK3R2/p85-β), and
enhances blood vessel formation (24,37). It
has been also shown that apoptotic bodies containing miR-126,
derived from endothelial cells, are taken up by neighboring
vascular cells and induce vascular protection (38). Moreover, miR-126 has been shown to be
expressed in glomerular and peritubular endothelial cells and
targets negative repressors (such as PIK3R2 and SPRED1) of the VEGF
pathway (39). In human umbilical
vein endothelial cells, loss of miR-126 was observed when cultured
with a high glucose concentration (25), and downregulation of endothelial
miR-126 was reported to impair the functional properties of
endothelial progenitor cells from diabetic patients via VEGF
signaling (40).
Besides its role in endothelial homeostasis and
angiogenesis, miR-126 additionally controls vascular inflammation
through targeting and suppressing vascular cell adhesion molecule 1
(VCAM-1), thereby limiting leukocyte adherence to endothelial cells
(41). miR-126 also protects against
atherosclerosis by inhibiting VCAM-1 during inflammation (42,43) and
contributes to renal microvascular heterogeneity of VCAM-1 protein
expression in acute inflammation (44). Diabetes-induced endothelial
dysfunction has been proposed as a major mechanism implicated in
the pathogenesis and development of DN, occurring through
activation of signal transducers of metabolic, hemodynamic and
inflammatory factors (3,4), which modifies the function and
morphology of neighboring cells, triggering a cascade of
inflammatory, proliferative and profibrotic responses in
progressive DN (4).
The results of the current study, indicating that
T2D patients and DN patients exhibit significantly low expression
levels of circulating miR-126 are consistent with the suggestion
that decreased miR-126 levels are associated with a reduced
response to VEGF and endothelial dysfunction (24,37).
Furthermore, as miR-126 is an important regulator of vascular
homeostasis and vascular inflammatory pathways (24,37,41), the
results of the preset study suggest that decreased circulating
miR-126 levels in patients with DN may be the consequence of
diabetes-associated renal endothelial damage.
The progression of DN is commonly defined by an
increase in albuminuria from normoalbuminuria to microalbuminuria
and from microalbuminuria to macroalbuminuria. On average, 20–40%
of patients with diabetes develop renal dysfunction (45), but type 2 diabetics with ESRD are
rapidly increasing because of the continuing increase in the
prevalence of T2D (2). Indeed, T2D
patients represent the large majority of macroalbuminuric patients
at risk of ESRD (2).
In the present study, a significant association of
miR-126 expression with the degree of albuminuria was observed, as
miR-126 levels were significantly low in DN patients with
microalbuminuria and were even lower in DN patients with
macralbuminuria than in patients with T2D and macralbuminuria.
These results suggest a possible link between miR-126 and the
development of DN.
In the DN patients, it was found that circulating
miR-126 levels were correlated negatively with albuminuria, and
positively with eGFR, suggesting that decreased miR-126 levels may
be associated with the development of renal impairment. Notably, a
previous study conducted in patients with ESRD has also shown a
positive correlation between blood miR-126 levels and eGFR
(29).
Additionally, the observation in the present study
that circulating miR-126 levels negatively correlated with FG and
HbA1c in DN patients, further supports the involvement of miR-126
in long-term hyperglycemia-induced diabetic renal damage.
Furthermore, the negative correlation between circulating miR-126
and either triglyceride or LDL, may indicate a possible involvement
of miR-126 in lipid metabolism in DN. In the same subject groups,
the present study found that albuminuria is a significant predictor
for circulating miR-126, by conducting a stepwise multiple
regression analysis with different variables including albuminuria,
eGFR as well as age, gender, BMI, blood pressure, FG, HbA1c, total
cholesterol, triglyceride and LDL. The present study indicates that
a significant reduction in miR-126 may be used as a biomarker for
DN, as shown in the ROC curve analysis of its ability to
discriminate DN patients from T2D patients, in addition to its
ability to differentiate between DN patients and non-diabetic
healthy control individuals.
Although the circulating level of miR-126 appears to
have potential as a biomarker for DN, there are certain limitations
to the current study. The sample size was relatively small and
larger samples are required for the further validation of miR-126
as a biomarker for DN. Moreover, additional investigations and
validation studies are required for the prognostic evaluation of
circulating miR-126 levels in a clinical setting.
In conclusion, our results suggest that decreased
expression of circulating miR-126 is implicated in the development
of DN and may serve as a potential blood-based biomarker for the
identification of T2D patients at risk of developing DN.
Acknowledgements
The authors would like to thank the staff of the
Clinical Laboratory of King Abdullah University Medical Centre in
the Kingdom of Bahrain. This study was supported by a research
grant from the College of Medicine and Medical Sciences, Arabian
Gulf University, Kingdom of Bahrain (grant no. 81).
References
|
1
|
Declèves AE and Sharma K: New
pharmacological treatments for improving renal outcomes in
diabetes. Nat Rev Nephrol. 6:371–380. 2010. View Article : Google Scholar : PubMed/NCBI
|
|
2
|
Ruggenenti P and Remuzzi G: Nephropathy of
type 1 and type 2 diabetes: Diverse pathophysiology, same
treatment? Nephrol Dial Transplant. 15:1900–1902. 2000. View Article : Google Scholar : PubMed/NCBI
|
|
3
|
Kanwar YS, Sun L, Xie P, Liu FY and Chen
S: A glimpse of various pathogenetic mechanisms of diabetic
nephropathy. Annu Rev Pathol. 6:395–423. 2011. View Article : Google Scholar : PubMed/NCBI
|
|
4
|
Cheng H and Harris RC: Renal endothelial
dysfunction in diabetic nephropathy. Cardiovasc Hematol Disord Drug
Targets. 14:22–33. 2014. View Article : Google Scholar : PubMed/NCBI
|
|
5
|
Mogensen CE: Microalbuminuria predicts
clinical proteinuria and early mortality in maturity-onset
diabetes. N Engl J Med. 310:356–360. 1984. View Article : Google Scholar : PubMed/NCBI
|
|
6
|
Rossing K, Christensen PK, Hovind P,
Tarnowl L, Rossing P and Parving HH: Progression of nephropathy in
type 2 diabetic patients. Kidney Int. 66:1596–1605. 2004.
View Article : Google Scholar : PubMed/NCBI
|
|
7
|
Gonzalez Suarez ML, Thomas DB, Barisoni L
and Fornoni A: Diabetic nephropathy: Is it time yet for routine
kidney biopsy? World J Diabetes. 4:245–255. 2013.PubMed/NCBI
|
|
8
|
Hillege HL, Janseen WM, Bak AA, Diercks
GF, Grobbee DE, Crijns HJ, Van Gilst WH, De Zeeuw D and De Jong PE:
Prevend Study Group: Microalbuminuria is common, also in a
nondiabetic, no hypertensive population and an independent
indicator of cardiovascular risk factors and cardiovascular
morbidity. J Intern Med. 249:519–526. 2001. View Article : Google Scholar : PubMed/NCBI
|
|
9
|
Tabaei BP, Al-Kassab AS, Ilag LL, Zawacki
CM and Herman WH: Does microalbuminuria predict diabetic
nephropathy? Diabetes Care. 24:1560–1566. 2001. View Article : Google Scholar : PubMed/NCBI
|
|
10
|
Jeon YK, Kim MR, Huh JE, Mok JY, Song SH,
Kim SS, Kim BH, Lee SH, Kim YK and Kim IJ: Cystatin C as an early
biomarker of nephropathy in patients with type 2 diabetes. J Korean
Med Sci. 26:258–263. 2011. View Article : Google Scholar : PubMed/NCBI
|
|
11
|
Oddoze C, Morange S, Portugal H, Berland Y
and Dussol B: Cystatin C is not more sensitive than creatinine for
detecting early renal impairment in patients with diabetes. Am J
Kidney Dis. 38:310–316. 2001. View Article : Google Scholar : PubMed/NCBI
|
|
12
|
Bartel DP: MicroRNAs: Target recognition
and regulatory functions. Cell. 136:215–233. 2009. View Article : Google Scholar : PubMed/NCBI
|
|
13
|
Pillai RS, Bhattacharyya SN and Filipowicz
W: Repression of protein synthesis by miRNAs: How many mechanisms?
Trends Cell Biol. 17:118–126. 2007. View Article : Google Scholar : PubMed/NCBI
|
|
14
|
Ardekani AM and Naeini M: The role of
microRNAs in human diseases. Avicenna J Med Biotechnol. 2:161–179.
2010.PubMed/NCBI
|
|
15
|
Pandey AK, Agarwal P, Kaur K and Datta M:
MicroRNAs in diabetes: Tiny players in big disease. Cell Physiol
Biochem. 23:221–232. 2009. View Article : Google Scholar : PubMed/NCBI
|
|
16
|
Bhatt K, Mi QS and Dong Z: MicroRNAs in
kidneys: Biogenesis, regulation, and pathophysiological roles. Am J
Physiol Renal Physiol. 300:F602–F610. 2011. View Article : Google Scholar : PubMed/NCBI
|
|
17
|
Kato M, Arce L and Natarajan R: MicroRNAs
and their role in progressive kidney diseases. Clin J Am Soc
Nephrol. 4:1255–1266. 2009. View Article : Google Scholar : PubMed/NCBI
|
|
18
|
Weber JA, Baxter DH, Zhang S, Huang DY,
Huang KH, Lee MJ, Galas DJ and Wang K: The microRNA spectrum in 12
body fluids. Clin Chem. 56:1733–1741. 2010. View Article : Google Scholar : PubMed/NCBI
|
|
19
|
Mitchell PS, Parkin RK, Kroh EM, Fritz BR,
Wyman SK, Pogosova-Agadjanyan EL, Peterson A, Noteboom J, O'Briant
KC, Allen A, et al: Circulating microRNAs as stable blood-based
markers for cancer detection. Proc Natl Acad Sci USA.
105:10513–10518. 2008. View Article : Google Scholar : PubMed/NCBI
|
|
20
|
Etheridge A, Lee I, Hood L, Galas D and
Wang K: Extracellular microRNA: A new source of biomarkers. Mutat
Res. 717:85–90. 2011. View Article : Google Scholar : PubMed/NCBI
|
|
21
|
Chen X, Ba Y, Ma L, Cai X, Yin Y, Wang K,
Guo L, Zhang Y, Chen J, Guo X, et al: Characterization of microRNAs
in serum: A novel class of biomarkers for diagnosis of cancer and
other diseases. Cell Res. 18:997–1006. 2008. View Article : Google Scholar : PubMed/NCBI
|
|
22
|
Al-Kafaji G, Al-Mahroos G, Alsayed NA,
Hasan ZA, Nawaz S and Bakhiet M: Peripheral blood microRNA-15a is a
potential biomarker for type 2 diabetes mellitus and pre-diabetes.
Mol Med Rep. 12:7485–7490. 2015.PubMed/NCBI
|
|
23
|
Meder B, Keller A, Vogel B, Haas J,
Sedaghat-Hameddani F, Kayvanpour E, Just S, Borries A, Rudloff J,
Leidinger P, et al: MicroRNA signatures in total peripheral blood
as novel biomarkers for acute myocardial infarction. Basic Res
Cardiol. 106:13–23. 2011. View Article : Google Scholar : PubMed/NCBI
|
|
24
|
Wang S, Aurora AB, Johnson BA, Qi X,
McAnally J, Hill JA, Richardson JA, Bassel-Duby R and Olson EN: The
endothelial-specific microRNA miR-126 governs vascular integrity
and angiogenesis. Dev Cell. 15:261–271. 2008. View Article : Google Scholar : PubMed/NCBI
|
|
25
|
Zampetaki A, Kiechl S, Drozdov I, Willeit
P, Mayr U, Prokopi M, Mayr A, Weger S, Oberhollenzer F, Bonora E,
et al: Plasma microRNA profiling reveals loss of endothelial
miR-126 and other microRNAs in type 2 diabetes. Circ Res.
107:810–817. 2010. View Article : Google Scholar : PubMed/NCBI
|
|
26
|
Ortega FJ, Mercader JM, Moreno-Navarrete
JM, Rovira O, Guerra E, Esteve E, Xifra G, Martínez C, Ricart W,
Rieusset J, et al: Profiling of circulating microRNAs reveals
common microRNAs linked to type 2 diabetes that change with insulin
sensitization. Diabetes Care. 37:1375–1383. 2014. View Article : Google Scholar : PubMed/NCBI
|
|
27
|
Liu Y, Gao G, Yang C, Zhou K, Shen B,
Liang H and Jiang X: The role of circulating microRNA-126
(miR-126): A novel biomarker for screening prediabetes and newly
diagnosed type 2 diabetes mellitus. Int J Mol Sci. 15:10567–10577.
2014. View Article : Google Scholar : PubMed/NCBI
|
|
28
|
Bijkerk R, Duijs JM, Khairoun M, Ter Horst
CJ, van der Pol P, Mallat MJ, Rotmans JI, de Vries AP, de Koning
EJ, de Fijter JW, et al: Circulating microRNAs associate with
diabetic nephropathy and systemic microvascular damage and
normalize after simultaneous pancreas-kidney transplantation. Am J
Transplant. 15:1081–1090. 2015. View Article : Google Scholar : PubMed/NCBI
|
|
29
|
Wang H, Peng W, Shen X, Huang Y, Ouyang X
and Dai Y: Circulating levels of inflammation-associated miR-155
and endothelial-enriched miR-126 in patients with end-stage renal
disease. Braz J Med Biol Res. 45:1308–1314. 2012. View Article : Google Scholar : PubMed/NCBI
|
|
30
|
Alberti KG and Zimmet PZ: Definition,
diagnosis and classification of diabetes mellitus and its
complications. Part 1: Diagnosis and classification of diabetes
mellitus provisional report of a WHO consultation. Diabet Med.
15:539–553. 1998. View Article : Google Scholar : PubMed/NCBI
|
|
31
|
Stoves J, Lindley EJ, Barnfield MC,
Burniston MT and Newstead CG: MDRD equation estimates of glomerular
filtration rate in potential living kidney donors and renal
transplant recipients with impaired graft function. Nephrol Dial
Transplant. 17:2036–2037. 2002. View Article : Google Scholar : PubMed/NCBI
|
|
32
|
Valadi H, Ekström K, Bossios A, Sjöstrand
M, Lee JJ and Lötvall JO: Exosome-mediated transfer of mRNAs and
microRNAs is a novel mechanism of genetic exchange between cells.
Nat Cell Biol. 9:654–659. 2007. View
Article : Google Scholar : PubMed/NCBI
|
|
33
|
Kosaka N, Iguchi H, Yoshioka Y, Takeshita
F, Matsuki Y and Ochiya T: Secretory mechanisms and intercellular
transfer of microRNAs in living cells. J Biol Chem.
285:17442–17452. 2010. View Article : Google Scholar : PubMed/NCBI
|
|
34
|
Chen X, Liang H, Zhang J, Zen K and Zhang
CY: Secreted microRNAs: A new form of intercellular communication.
Trends Cell Biol. 22:125–132. 2012. View Article : Google Scholar : PubMed/NCBI
|
|
35
|
Liu Y, Gao G, Yang C, Zhou K, Shen B,
Liang H and Jiang X: Stability of miR-126 in urine and its
potential as a biomarker for renal endothelial injury with diabetic
nephropathy. Int J Endocrinol. 2014:3931092014. View Article : Google Scholar : PubMed/NCBI
|
|
36
|
Osipova J, Fischer DC, Dangwal S, Volkmann
I, Widera C, Schwarz K, Lorenzen JM, Schreiver C, Jacoby U,
Heimhalt M, et al: Diabetes-associated microRNAs in pediatric
patients with type 1 diabetes mellitus: A cross-sectional cohort
study. J Clin Endocrinol Metab. 99:E1661–E1665. 2014. View Article : Google Scholar : PubMed/NCBI
|
|
37
|
Fish JE, Santoro MM, Morton SU, Yu S, Yeh
RF, Wythe JD, Ivey KN, Bruneau BG, Stainier DY and Srivastava D:
MiR-126 regulates angiogenic signaling and vascular integrity. Dev
Cell. 15:272–284. 2008. View Article : Google Scholar : PubMed/NCBI
|
|
38
|
Zernecke A, Bidzhekov K, Noels H,
Shagdarsuren E, Gan L, Denecke B, Hristov M, Köppel T, Jahantigh
MN, Lutgens E, et al: Delivery of microRNA-126 by apoptotic bodies
induces CXCL12-dependent vascular protection. Sci Signal.
2:ra812009. View Article : Google Scholar : PubMed/NCBI
|
|
39
|
Harvey SJ, Jarad G, Cunningham J, Goldberg
S, Schermer B, Harfer BD, McManus MT, Benzing T and Miner JH:
Podocyte-specific deletion of dicer alters cytoskeletal dynamics
and causes glomerular disease. J Am Soc Nephrol. 19:2150–2158.
2008. View Article : Google Scholar : PubMed/NCBI
|
|
40
|
Meng S, Cao JT, Zhang B, Zhou Q, Shen CX
and Wang CQ: Downregulation of microRNA-126 in endothelial
progenitor cells from diabetes patients, impairs their functional
properties, via target gene Spred-1. J Mol Cell Cardiol. 53:64–72.
2012. View Article : Google Scholar : PubMed/NCBI
|
|
41
|
Harris TA, Yamakuchi M, Ferlito M, Mendell
JT and Lowenstein CJ: MicroRNA-126 regulates endothelial expression
of vascular cell adhesion molecule 1. Proc Natl Acad Sci USA.
105:1516–1521. 2008. View Article : Google Scholar : PubMed/NCBI
|
|
42
|
Lagos-Quintana M, Rauhut R, Yalcin A,
Meyer J, Lendeckel W and Tuschl T: Identification of
tissue-specific microRNAs from mouse. Curr Biol. 12:735–739. 2002.
View Article : Google Scholar : PubMed/NCBI
|
|
43
|
Jiang Y, Wang HY, Li Y, Guo SH, Zhang L
and Cai JH: Peripheral blood miRNAs as a biomarker for chronic
cardiovascular diseases. Sci Rep. 4:50262014.PubMed/NCBI
|
|
44
|
Asgeirsdóttir SA, van Solingen C, Kurniati
NF, Zwiers PJ, Heeringa P, van Meurs M, Satchell SC, Saleem MA,
Mathieson PW, Banas B, et al: MicroRNA-126 contributes to renal
microvascular heterogeneity of VCAM-1 protein expression in acute
inflammation. Am J Physiol Renal Physiol. 302:F1630–F1639. 2012.
View Article : Google Scholar : PubMed/NCBI
|
|
45
|
Hostetter TH: Prevention of the
development and progression of renal disease. J Am Soc Nephrol.
14(7 Suppl 2): S144–S147. 2003. View Article : Google Scholar : PubMed/NCBI
|