Introduction
Hypoxic-ischemic encephalopathy (HIE), secondary to
perinatal asphyxia, is a primary cause of pediatric mortality and
morbidity, and results in neurologic outcomes, such as cerebral
palsy, mental retardation and epilepsy (1). Timely prognostic information is
important in counseling parents and in determining the appropriate
level of treatment. Consequently, reliable early examinations are
urgently required. During the last decade, advances have been
achieved in the field of diagnosis and prognosis of HIE (2).
Clinicians use prognostic tests, including magnetic
resonance (MR) imaging (MRI), to help determine the prognosis and
decide whether to consider treatment withdrawal. It is understood
that MRI serves an increasing important role for imaging the
neonatal brain (3–6). However, proton MR spectroscopy has been
developed for clinical use. This allows real-time analyses of the
metabolites in the human brain. It has been widely reported that
the potential utility of proton MR spectroscopy could reveal brain
ischemic injuries in asphyxiated neonates earlier than T1- or
T2-weighted MR imaging (7–11). Whether MR spectroscopy prior to
conventional MR imaging should be used in the early diagnosis of
neonate with HIE remains unknown. How to select the imaging
technique between the two methods in different conditions?
Therefore, the aim of the present study was to evaluate the value
of MR spectroscopy and MR imaging for the diagnosis of HIE.
Subjects and methods
Subject selection
The protocol was approved by the review board of
Nanjing Medical University (Nanjing, China). Participants in the
study were voluntary; the study was performed after obtaining
informed consent from the infants' parents. In this study, 24 full
term infants (17 males, 7 females; age range,0–15 days) with HIE
were collected from the Department of Pediatrics in Huai'an First
People's Hospital Affiliated to Nanjing Medical University
(Huai'an, China) between February 2012 and February 2013. All of
the cases had perinatal asphyxia, and were defined as having at
least three of the following criteria (12): i) Fetal heart rate abnormalities; ii)
meconium staining of amniotic fluid; iii) delayed onset of
respiration; iv) early postnatal blood pH level <7.1; v) Apgar
score at 5 min of <5; or vi) multiorgan failure. Furthermore,
all neonates had signs of neonatal encephalopathy (13).
Neonates with congenital malformation, trauma,
metabolic or infective diseases, and patients born prior to
reaching a 36-week gestational age, were excluded from this study.
Five healthy term infants (3 males, 2 females; age range, 0–15
days) were recruited in the control group. The patients underwent
MRI examination for scalp hematoma or slight neonatal jaundice.
MRI examinations
During the MRI procedures, all neonates were sedated
with chloral hydrate 10 mg/kg (Sigma-Aldrich, St. Louis, MO, USA)
orally, or rectally as a suppository. Vacuum pillows were used to
prevent patients movement during MR examinations. Ear protection to
noise exposure was provided by using neonatal ear muffs. A
pediatrician was present throughout the investigation. The neonates
were monitored by MR-compatible pulse oximetry during the
examination procedure. For those neonates with severe
encephalopathy who were in a coma or who were ventilator-dependent,
hand-bag ventilator equipment was used.
All images in these series were obtained with
superconducting magnets (MAGNETOM Avanto; Siemens Healthcare GmbH,
Erlangen, Germany) operating at a field-strength of 1.5T magnet.
All infants were in the axial plane. The total duration of the
examination is 8 min.
Conventional MRI methods
MRI protocols included 4.0 mm transverse and
sagittal T1-weighted spin-echo sequences [repetition time (TR)/echo
time (TE), 468/11 and 400/8.1 ms, respectively]; 4.0 mm transverse
T2-weighted fast spin-echo sequence (TR/TE, 4000/101 ms); and an
echo-planar imaging technique was used for diffusion weighted
imaging (DWI; repetition time msec/echo time msec = 3300/93), with
a 180×180 mm field of view, 4.0 mm section thickness and b values
of 0 and 1,000 sec/mm2.
Proton MR spectroscopy methods
MR spectroscopy was performed similarly to the
routine MR protocol. Spectra were acquired by using a single-voxel
technique to select a single volume of interest (voxel dimensions,
10 mm3, 1 ml) in the left or right basal ganglia and
thalamus, as reported previously. The basal ganglia and thalamus
are most sensitive to the effects of acute anoxia (14). This single voxel can reflect the
global disturbances, such as cortical gray matter and the frontal
and occipital white matter. Placement was performed carefully to
avoid contact with cerebral spinal fluid.
The parameters of single-voxel MR spectroscopy were
as follows: TR, 1,500 ms; TE, 35 ms; 128 signals acquired; and
8NEX. Water suppression was achieved by applying chemical shift
selective saturation pulses. Metabolites of biologic importance,
such as N-acetylaspartate (NAA), creatine (Cr), and choline (Cho)
peaks were identified at 2.02, 3.02 and 3.24 ppm, respectively.
When present, lactate (Lac) was identified as a doublet at 1.33
ppm.
Automated curve was performed on an MRI operator
console by using proprietary software (Siemens Healthcare GmbH).
Manual phase adjustment was applied if necessary. In all cases,
peak surface area was used to calculate metabolite ratios for
metabolite quantification. As for Lac, the combined area under the
doublet was used for calculations.
Conventional MRI
The MR images obtained in all neonates were analyzed
independently by a senior radiologist (Dr. Dehang Wang) who was
experienced in neonatal neuroimaging, blinded to the clinical
outcomes and MR spectroscopy information, and who analyzed the
images according to MRI scores (15). This score (range, 0–22; Table I) was generated according to a report
on MRI and DWI abnormalities in neonates with HIE (16). The following predefined structures
were analyzed: Basal ganglia regions (including thalamus); cerebral
cortex; periventricular and subcortical white matter; corpus
callosum; and brainstem. For each structure, any MR signal
intensity abnormality irrelevant to injury was documented as a
high-signal intensity (SI) lesion on T1 weighted image (WI).
 | Table I.Magnetic resonance imaging score
criteria. |
Table I.
Magnetic resonance imaging score
criteria.
| Category | Score criteria |
|---|
| A | Brain swelling: 0,
Not present; 2, present |
| B | Grey/white matter
differentiation: 0, Present; 1, absent in one localization; 2,
absent in more than one localization |
| C | High signal in the
posterior limb of the internal capsule on T1WI: 0, Normal; 1, mild
decrease; 2, absent |
| D | Hyperintensity on
T1WI sequences on PP and T: 0, None; 1, one localization; 2, more
than one localization |
| E | Hyperintensity on T2
sequences on PP and T: 0, None; 1, one localization; 2, more than
one localization |
| F | Brain stem
abnormalities on T1WI and/or T2WI sequences: 0, None; 1,
present |
| G | Cortex abnormalities
on T1 and/or T2 sequences: 0, None; 1, one localization; 2, more
than one localization |
| H | White matter
petechial abnormalities: 0, None; 1, one localization; 2, more than
one localization |
| I | Subarachnoid
hemorrhages: 0, None; 1, present |
| J | White-matter
abnormalities in DWI: 0, None; 1, one localization; 2, more than
one localization |
| K | Basal ganglia
abnormalities in DWI: 0, None; 1, one localization; 2, more than
one localization |
| L | Cerebral cortex
abnormalities in DWI: 0, None; 1, one localization; 2, more than
one localization |
MR spectroscopy quantifications
The spectra was reviewed by an MR specialist (Dr.
Genji Bo) who had 10 years of experience in interpreting brain MR
spectroscopy and who was blinded to the clinical outcomes and the
MR images. All 1H-MR spectroscopic data were included in
the analysis (n=29) and all findings were pooled. Cr was used as a
reference to measure the ratios of NAA/Cr, Cho/Cr and Lac/Cr. These
ratios were compared in the 29 neonates to select a perspective
indicator of the neonates with HIE.
Statistical analysis
Data obtained were expressed as the mean ± standard
deviation, and all data were analyzed using SPSS version 15.0
statistical software (SPSS, Inc., Chicago, IL, USA). P<0.05 were
considered to indicate a statistically significant difference. The
comparison between the control and HIE group was performed by a
two-tailed t-test. The paired comparisons among the control group
and each HIE group were performed by two-way analysis of variance
and the Student-Newman-Keuls method.
Results
Clinical characteristics
The neurologic examinations were routinely performed
by the pediatricians in charge of the neonates. Knowledge of the
outcomes, including seizures, sensory impairment and
encephalodysplasia, were collected from the medical records by
these pediatricians.
Two cases with severe HIE succumbed to irreversible
cerebral injury and withdrawal of the life-sustaining treatments.
The decision to withdraw treatment was based on the combination
results of clinical examination, cerebral MRI, 1H-MR
spectroscopy and electroencephalography, as reported previously
(17). The remaining cases received
suitable HIE treatment. The average number of days spent in
hospital were as follows: Mild to moderate group, 11.5 days (range,
6–18 days); severe group, 19.6 days (range, 8–25 days). Four cases
of severe HIE neonates still had weak nerve reaction upon discharge
from the hospital. The neurological system symptoms of the
remaining participants disappeared prior to leaving the hospital.
No abnormal nervous system signs were detected in the control
group.
Neonatal HIE severity was graded clinically
according to Sarnat-Sarnat classification (18). The general condition of the HIE
neonates were as follows (Table
II): Mild to moderate (stages I–II), 13 cases; severe (stage
III), 11 cases.
| Table II.Clinical data and magnetic resonance
findings of all participants in the study. |
Table II.
Clinical data and magnetic resonance
findings of all participants in the study.
| Case no. | Gender | Age (days) | Number of PWML | Signal on DWI
(reduced diffusion) | Body weight (g) | Outcome |
|---|
| 1 | M | 3 | 4 | Yes | 3350 | Minor or moderate
abnormalities |
| 2 | M | 7 | 13 | Yes | 3000 | Minor or moderate
abnormalities |
| 3 | M | 1 | 0 | No | 3630 | No abnormalities |
| 4 | F | 3 | 0 | No | 3070 | No
abnormalities |
| 5 | M | 15 | 0 | No | 3040 | No
abnormalities |
| 6 | M | 5 | 6 | Yes | 4000 | Minor or moderate
abnormalities |
| 7 | M | 10 | 8 | No | 3620 | Minor or moderate
abnormalities |
| 8 | M | 2 | 35 | Yes | 2380 | Mortality on day
6 |
| 9 | F | 3 | 13 | Yes | 3760 | Severe
abnormalities |
| 10 | F | 1 | 8 | Yes | 3510 | Minor or moderate
abnormalities |
| 11 | M | 3 | 1 | Yes | 2800 | No
abnormalities |
| 12 | M | 1 | 1 | Yes | 3710 | No
abnormalities |
| 13 | M | 3 | 12 | Yes | 3560 | Minor or moderate
abnormalities |
| 14 | F | 5 | 6 | Yes | 3450 | No
abnormalities |
| 15 | M | 1 | 0 | Yes | 2565 | No
abnormalities |
| 16 | M | 12 | 2 | Yes | 2570 | Minor or moderate
abnormalities |
| 17 | F | 11 | 20 | Yes | 2850 | Severe
abnormalities |
| 18 | F | 11 | 14 | Yes | 2560 | Severe
abnormalities |
| 19 | M | 8 | 2 | Yes | 4480 | No
abnormalities |
| 20 | F | 4 | 0 | Yes | 3100 | No
abnormalities |
| 21 | M | 1 | 24 | Yes | 3000 | Severe
abnormalities |
| 22 | F | 5 | 59 | Yes | 2050 | Mortality on day
12 |
| 23 | M | 8 | 1 | Yes | 3570 | No
abnormalities |
| 24 | M | 15 | 1 | No | 3450 | No
abnormalities |
| 25 | M | 3 | 1 | Yes | 2860 | No
abnormalities |
| 26 | M | 6 | 11 | Yes | 3600 | Minor or moderate
abnormalities |
| 27 | M | 10 | 5 | Yes | 4000 | Minor or moderate
abnormalities |
| 28 | F | 3 | 1 | Yes | 2850 | No
abnormalities |
| 29 | M | 2 | 13 | Yes | 3600 | Minor or moderate
abnormalities |
MR imaging data
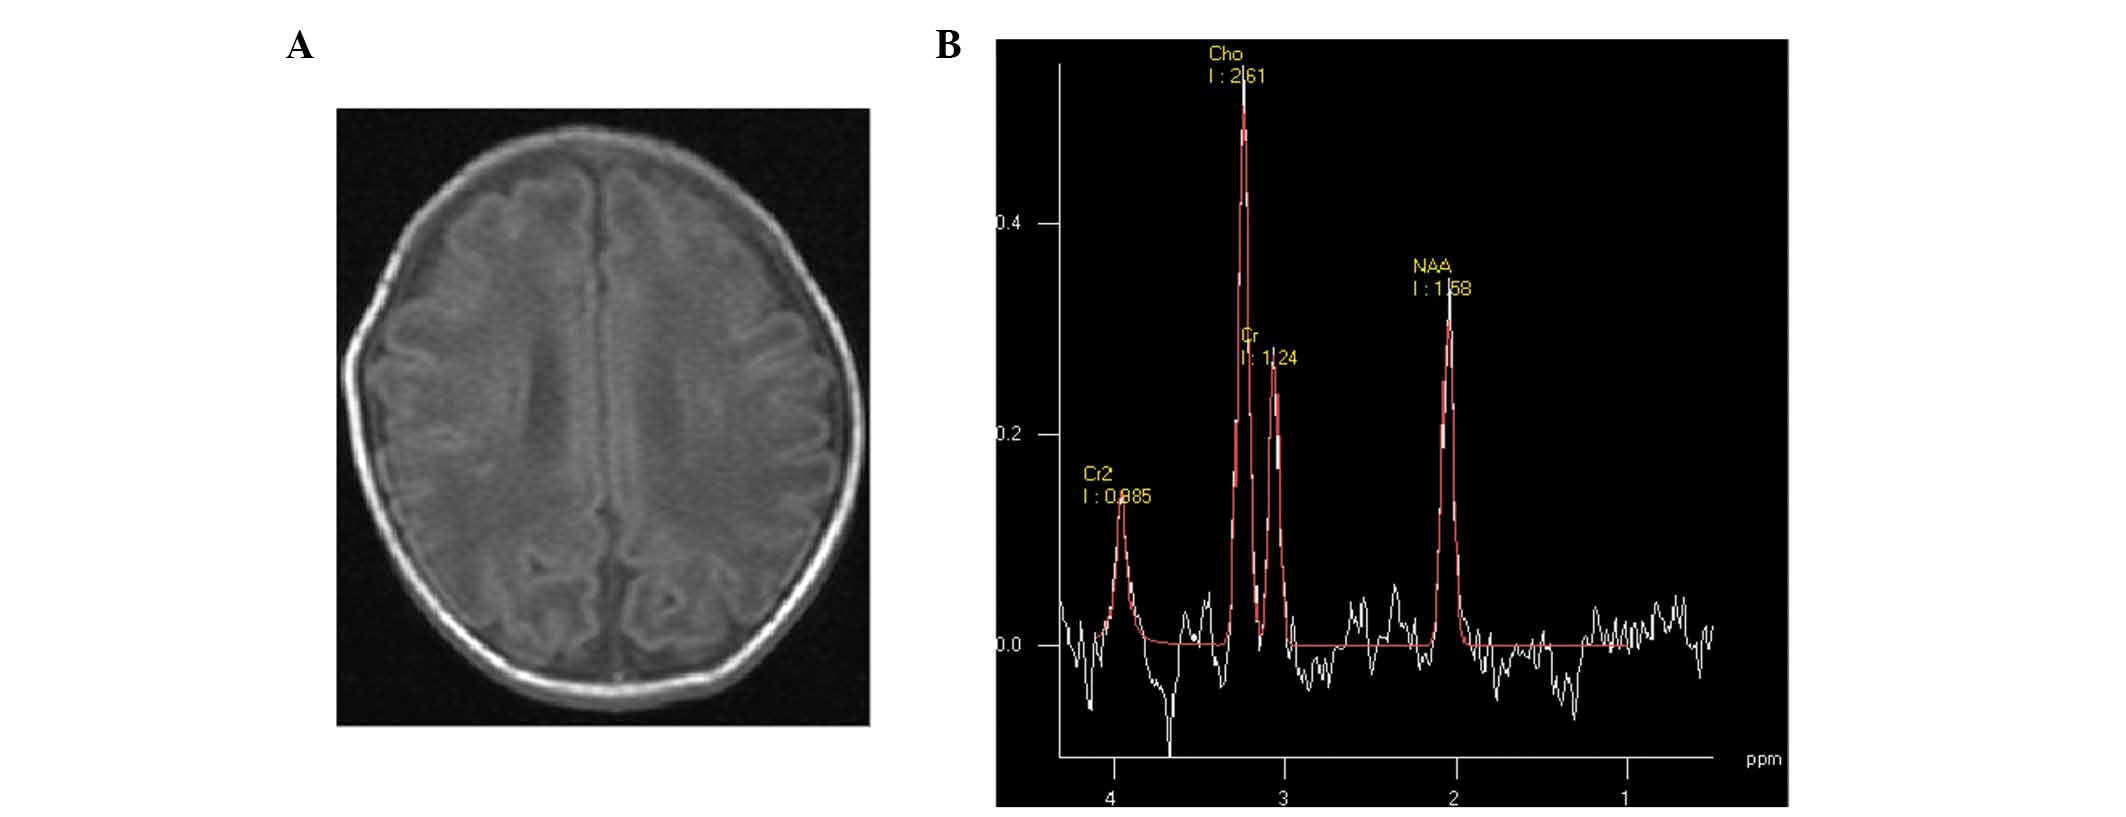
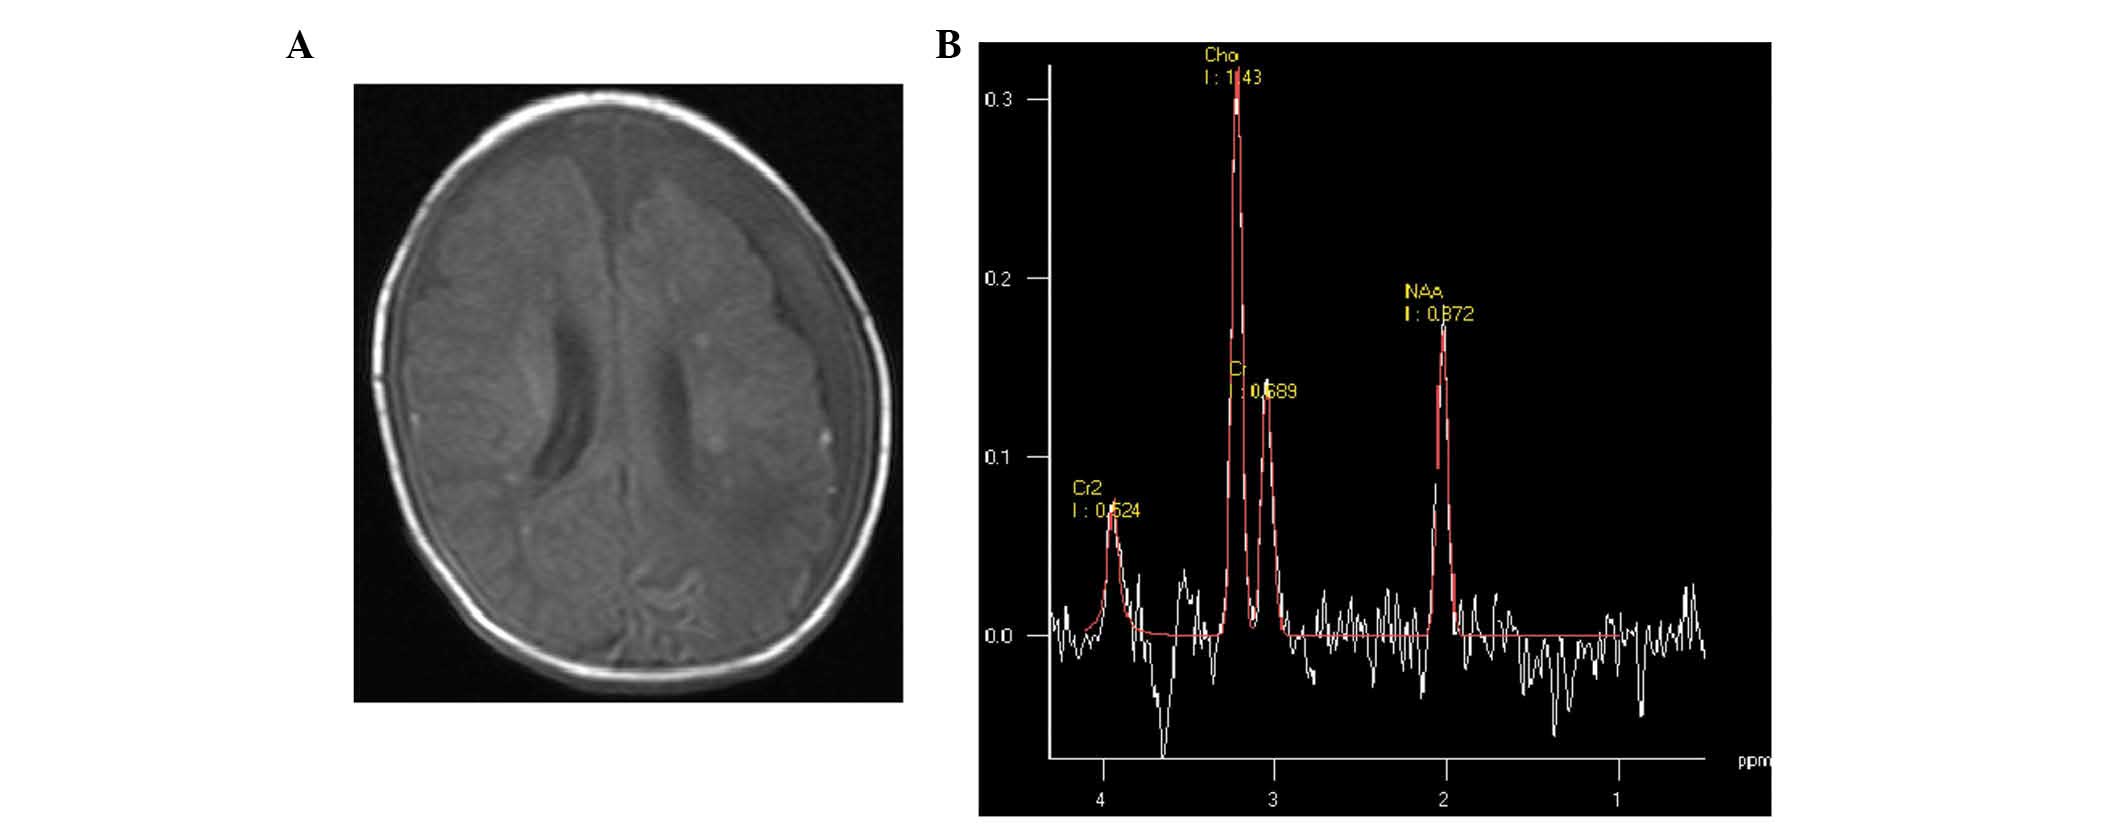
According to the MRI data, abnormal imaging was not
identified in the control group. Four types of images in HIE groups
were observed. Cerebral hyperintensity lesions (according to the
site of lesions, two subtypes could be detected), cortex and/or
watershed area lesions (Fig. 1) and
periventricular white matter lesions (Fig. 2) were detected. These characteristic
abnormalities were visible as early as the first day of life.
However, these lesions identified by punctuate hypersignal on T1WI
and hyposignal on T2WI were assumed to be petechial hemorrhage,
gliotic scarring, scarring or mineralization, which are impossible
to distinguish on T1- and T2WI (19,20).
Longitudinal imaging showed a decrease in the number of punctate
white matter lesions (PWML) over time, without hypersignal of PWML
on T1WI, suggesting hemorrhage; a number of PWML did not change
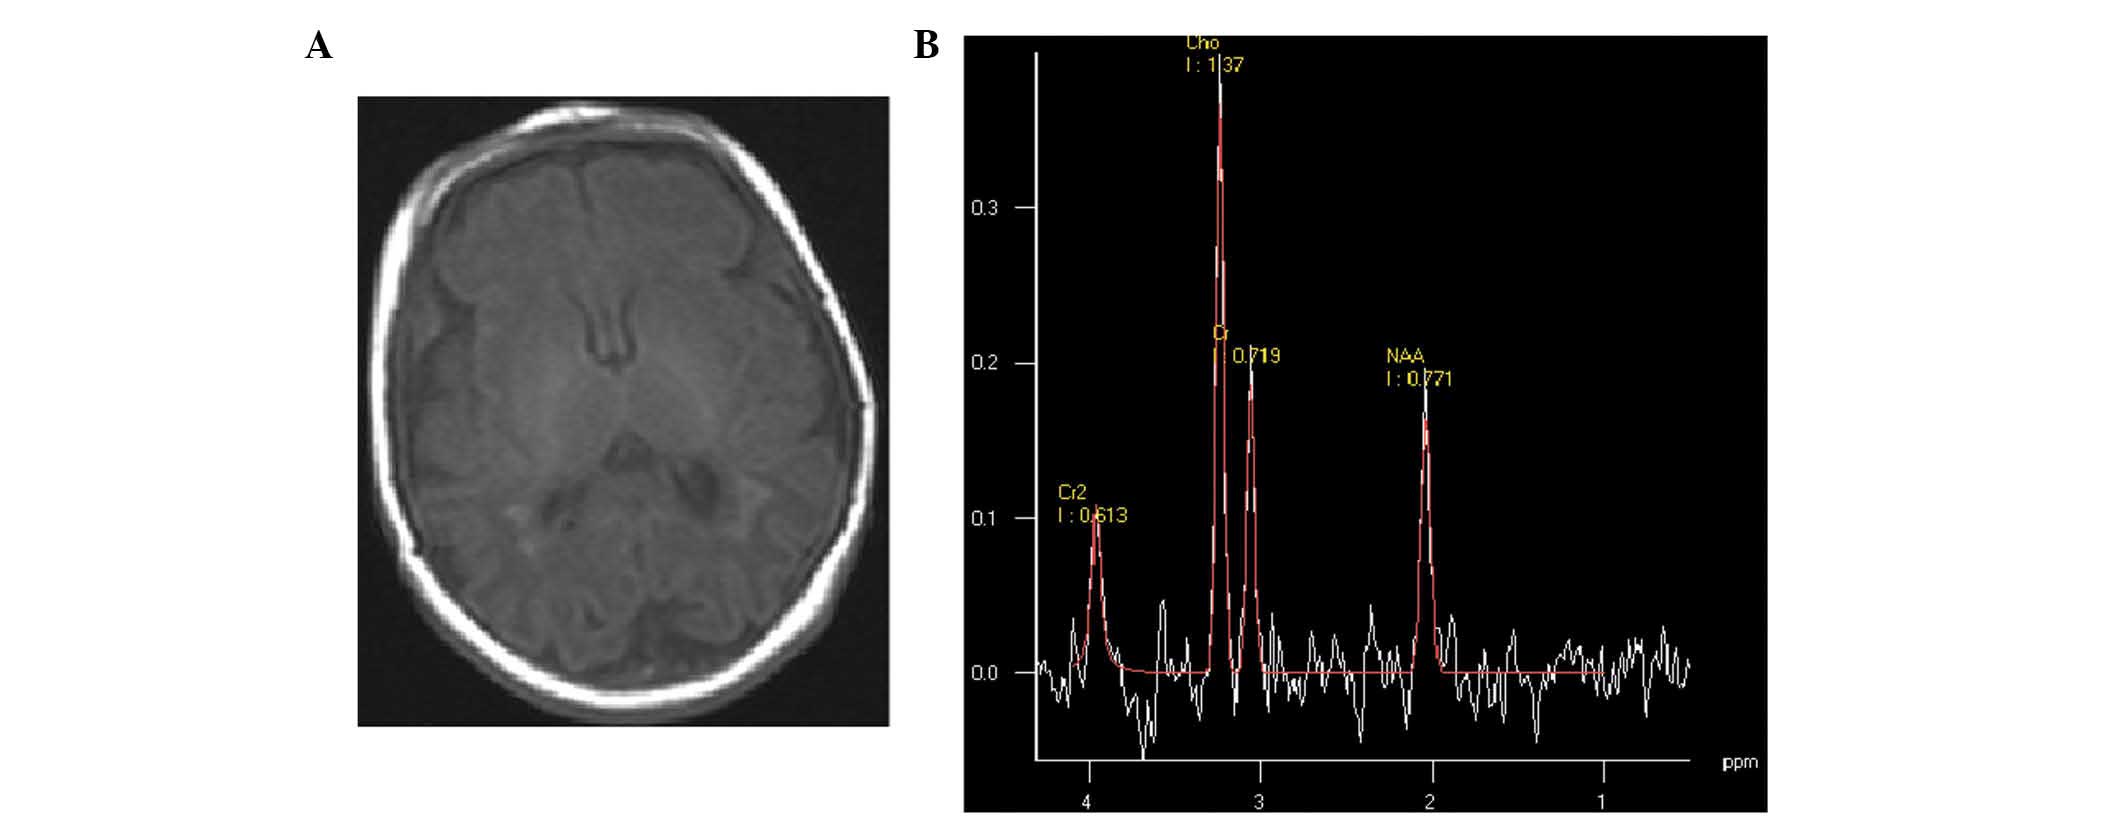
hypersignal on T1WI, suggesting early gliosis (21). In addition, basal ganglia, thalamic,
corpus callosum or mesencephalic injury (Fig. 3) was identified on conventional and
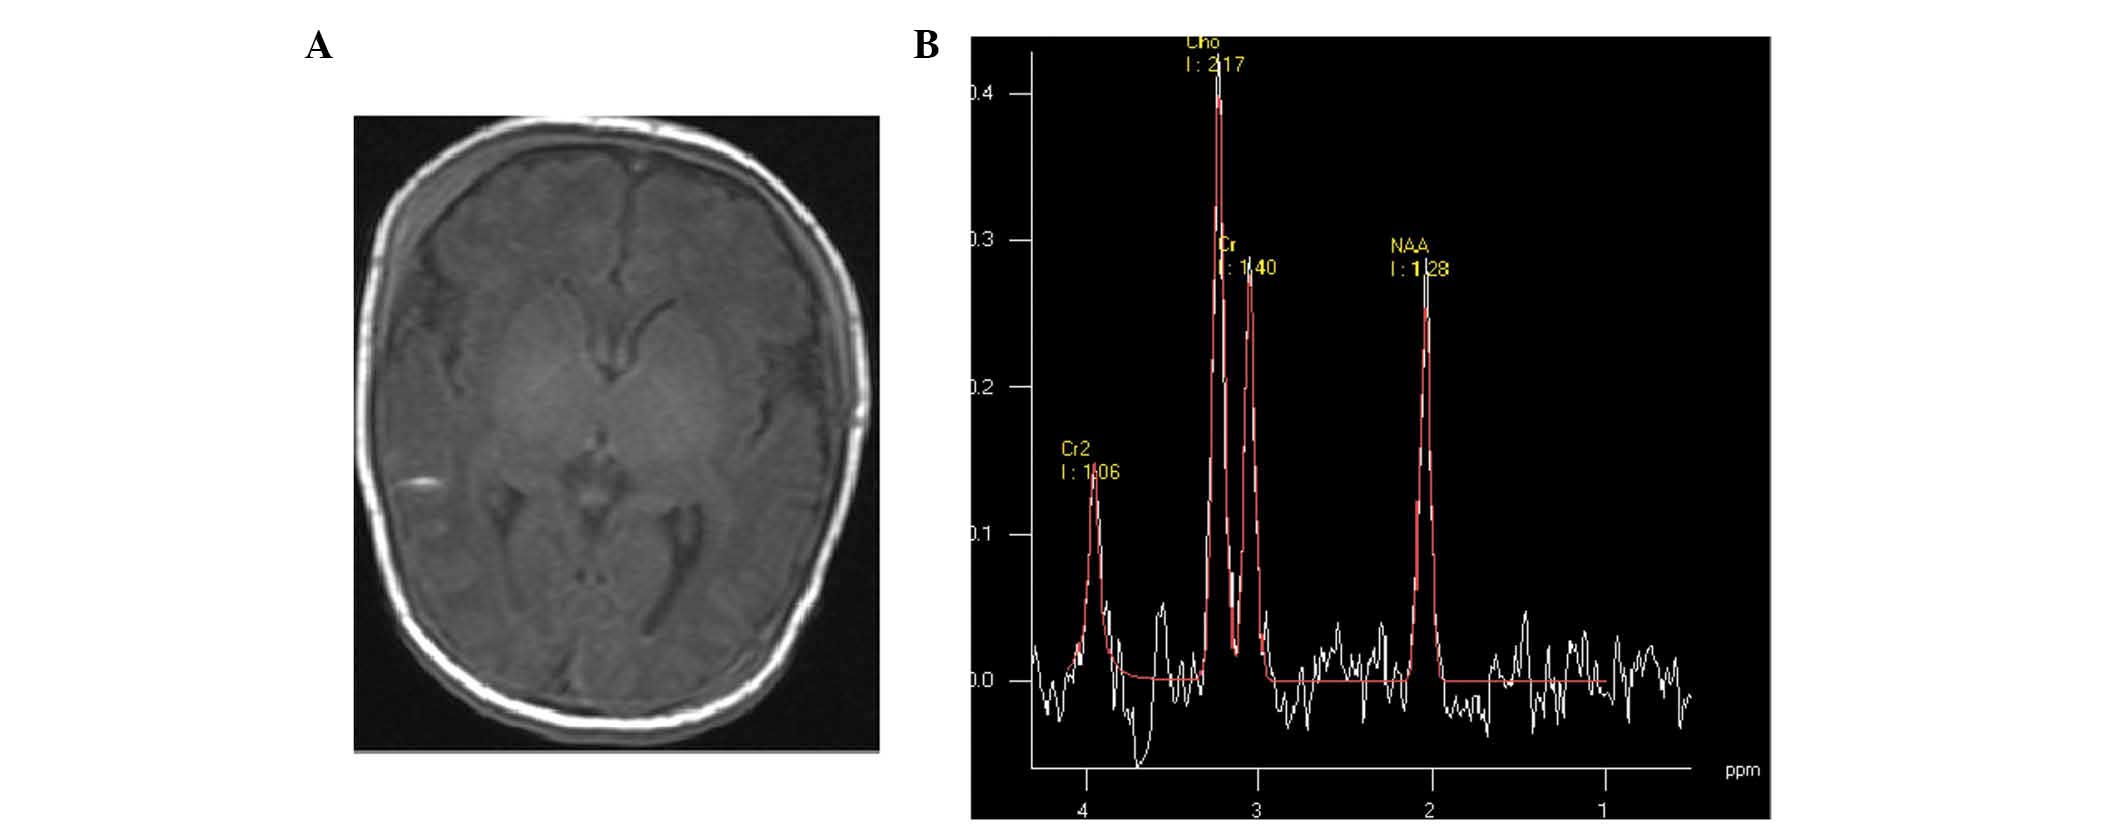
diffusion-weighted MR images. Furthermore, subarachnoid
haemorrhage, in which short T1 high signal was manifested in the
posterior sagittal sinus, horizontal sinus, cerebellar tentorium or
confluence of sinus (Fig. 4), was
detected. Finally, intraventricular haemorrhage (Fig. 5) could be observed.
Compared with the images of the two HIE groups,
punctate hyperintensity lesions on T1WI in the cortex or
subcortical white matter and brain edema on T2WI were visually
similar. Abnormal SI of the thalamus, corpus callosum or brain stem
on conventional and diffusion-weighted MR images were significantly
different in the severe group (P=0.001). Abnormal SI within the
basal ganglia and thalami may predict the severity outcome.
Unilateral parenchymal hemorrhage was identified in
four infants in the HIE group. The mean number of PWML in the mild
to moderate group (stages I–II) was 5.38±4.68 (range, 1–13). The
mean number of PWML in the severe group (stage III) was 16.82±17.66
(range, 4–59). A significant difference was identified between
these two groups in regard to the number of PWML (P=0.035). The
majority of PWML were identified close to the medullary veins and
showed restricted diffusion on early MRI; two infants did not have
restricted diffusion on early MRI (identified as hyposignal on
DWI).
The neonatal MR score was obtained from the scan
images. Points were awarded for the presence of brain swelling and
abnormal SI within the cortex, subcortical and periventricular
white matter, basal ganglia and thalamus, brain stem, and from the
posterior limb of the internal capsule. The MR scores (Table III) of the two HIE groups were
compared. The mean MR imaging score was 6.20±1.75 for cases of
stage I–II and 9.78±3.64 for cases of stage III. There was a
significant difference between the two groups (P=0.009).
| Table III.Magnetic resonance scores for all
participants. |
Table III.
Magnetic resonance scores for all
participants.
|
|
Category |
|
|
|---|
|
|
|
|
|
|---|
| Case no. | A | B | C | D | E | F | G | H | I | J | K | L | Score | Stage |
|---|
| 1 | 2 | 0 | 2 | 0 | 0 | 0 | 0 | 2 | 1 | 2 | 0 | 0 | 9 | 1–2 |
| 2 | 2 | 0 | 2 | 0 | 0 | 0 | 0 | 2 | 0 | 2 | 0 | 0 | 8 | 1–2 |
| 3 | 0 | 0 | 0 | 0 | 0 | 0 | 0 | 0 | 0 | 0 | 0 | 0 | 0 | 0 |
| 4 | 0 | 0 | 0 | 0 | 0 | 0 | 0 | 0 | 0 | 0 | 0 | 0 | 0 | 0 |
| 5 | 0 | 0 | 0 | 0 | 0 | 0 | 0 | 0 | 0 | 0 | 0 | 0 | 0 | 0 |
| 6 | 0 | 0 | 1 | 0 | 0 | 0 | 0 | 2 | 1 | 2 | 0 | 0 | 5 | 3 |
| 7 | 0 | 0 | 2 | 0 | 0 | 0 | 0 | 2 | 0 | 0 | 0 | 0 | 4 | 1–2 |
| 8 | 2 | 0 | 2 | 0 | 0 | 0 | 0 | 2 | 0 | 2 | 2 | 0 | 10 | 3 |
| 9 | 2 | 2 | 1 | 0 | 0 | 0 | 2 | 2 | 0 | 2 | 2 | 2 | 15 | 3 |
| 10 | 0 | 0 | 2 | 0 | 0 | 0 | 0 | 2 | 0 | 2 | 0 | 0 | 6 | 1–2 |
| 11 | 2 | 0 | 2 | 0 | 0 | 0 | 0 | 1 | 1 | 1 | 0 | 0 | 7 | 1–2 |
| 12 | 2 | 1 | 2 | 0 | 0 | 0 | 0 | 1 | 0 | 1 | 0 | 0 | 6 | 1–2 |
| 13 | 2 | 2 | 2 | 0 | 2 | 1 | 0 | 2 | 0 | 2 | 2 | 0 | 15 | 3 |
| 14 | 2 | 0 | 2 | 0 | 0 | 0 | 2 | 2 | 1 | 2 | 0 | 2 | 13 | 3 |
| 15 | 0 | 0 | 0 | 0 | 0 | 0 | 0 | 0 | 0 | 0 | 0 | 0 | 0 | 0 |
| 16 | 0 | 0 | 1 | 0 | 0 | 0 | 0 | 2 | 0 | 2 | 0 | 0 | 5 | 1–2 |
| 17 | 2 | 0 | 2 | 0 | 0 | 0 | 0 | 2 | 0 | 2 | 0 | 0 | 8 | 3 |
| 18 | 0 | 0 | 0 | 0 | 0 | 0 | 2 | 2 | 1 | 2 | 0 | 2 | 9 | 3 |
| 19 | 2 | 0 | 2 | 0 | 0 | 0 | 0 | 1 | 0 | 1 | 0 | 0 | 4 | 1–2 |
| 20 | 0 | 0 | 0 | 0 | 0 | 0 | 0 | 0 | 0 | 0 | 0 | 0 | 0 | 0 |
| 21 | 2 | 0 | 2 | 0 | 0 | 0 | 2 | 2 | 1 | 2 | 2 | 2 | 15 | 3 |
| 22 | 2 | 0 | 0 | 0 | 0 | 0 | 1 | 2 | 0 | 2 | 0 | 1 | 8 | 3 |
| 23 | 2 | 2 | 2 | 0 | 0 | 0 | 1 | 1 | 1 | 1 | 0 | 1 | 11 | 3 |
| 24 | 2 | 2 | 2 | 0 | 0 | 0 | 0 | 1 | 1 | 1 | 0 | 0 | 9 | 3 |
| 25 | 0 | 0 | 1 | 0 | 0 | 0 | 0 | 1 | 0 | 1 | 0 | 0 | 3 | 1–2 |
| 26 | 2 | 0 | 1 | 0 | 0 | 0 | 0 | 2 | 0 | 2 | 0 | 0 | 7 | 1–2 |
| 27 | 2 | 1 | 0 | 0 | 0 | 0 | 0 | 2 | 1 | 0 | 0 | 0 | 6 | 1–2 |
| 28 | 2 | 2 | 2 | 0 | 0 | 0 | 0 | 1 | 0 | 1 | 0 | 0 | 8 | 1–2 |
| 29 | 2 | 0 | 2 | 0 | 0 | 0 | 0 | 2 | 0 | 2 | 0 | 0 | 8 | 1–2 |
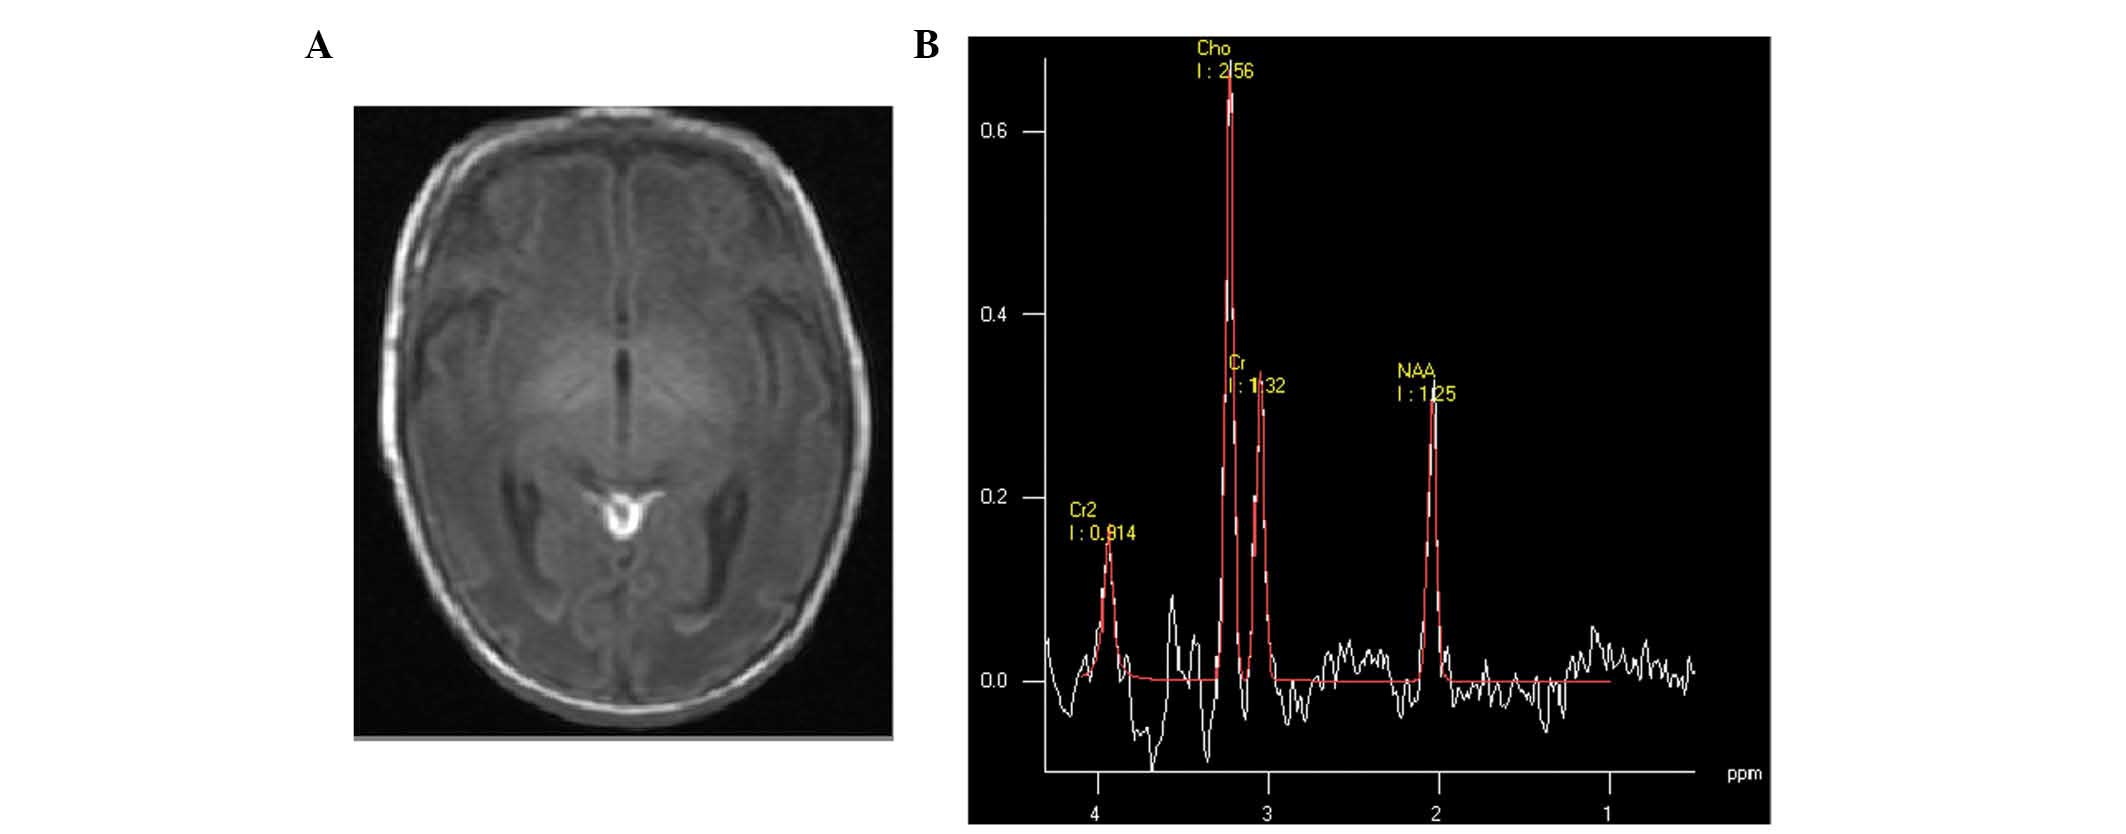
MR spectroscopy. In the control and HIE groups, the
peaks of metabolites of biologic importance, such as NAA (2.02
ppm), Cr (3.02 ppm) and Cho (3.24 ppm), were identified. The Cr was
used as a reference to measure NAA/Cr, Cho/Cr and Lac/Cr ratios
(Table IV). In the control group,
the values of NAA/Cr and Cho/Cr were 1.60±0.47 and 1.67±0.81,
respectively, while Lac/Cr was not detected. In the HIE groups, Lac
was identified as a doublet at 1.33 ppm, and the values of NAA/Cr,
Cho/Cr and Lac/Cr were 1.09±0.4, 2.12±0.87 and 0.14±0.26,
respectively. In the mild to moderate group (stages I–II), the
ratios showed NAA/Cr of 1.23±0.35, Cho/Cr of 1.84±0.37 and Lac/Cr
of 0.03±0.06. In the severe group (stage III), the ratios showed
NAA/Cr of 0.97±0.41, Cho/Cr of 2.43±1.16 and Lac/Cr of
0.26±0.34.
| Table IV.Quantitative analyses of the
metabolic compounds used in the study. |
Table IV.
Quantitative analyses of the
metabolic compounds used in the study.
| Groups | Number | NAA/Cr | Cho/Cr | Lac/Cr |
|---|
| Control | 5 | 1.60±0.47 | 1.67±0.81 | – |
| HIE | 24 | 1.09±0.41 | 2.12±0.87 | 0.14±0.26 |
| Mild to
moderate | 13 | 1.23±0.35 | 1.84±0.37 | 0.03±0.06 |
| Severe | 11 | 0.97±0.41 | 2.43±1.16 | 0.26±0.34 |
Between control and HIE groups, the differences of
NAA/Cr, Cho/Cr and Lac/Cr in the basal ganglia and thalamus were
statistically significant (P<0.05). Multiple comparisons were
performed among control and HIE groups (Table V). The differences of NAA/Cr, Cho/Cr
and Lac/Cr between the control and mild to moderate groups, and
control and severe groups, were statistically significant
(P<0.05). The differences of NAA/Cr, Cho/Cr and Lac/Cr between
mild to moderate and severe groups was not statistically
significant (P>0.05).
| Table V.Comparison of magnetic resonance
spectroscopy metabolites between control and HIE groups. |
Table V.
Comparison of magnetic resonance
spectroscopy metabolites between control and HIE groups.
| Groups | NAA/Cr P | Cho/Cr P | Lac/Cr P |
|---|
| Control vs.
HIE | 0.015 | 0.029 | 0.020 |
| Control vs. Mild to
moderate | 0.016 | 0.040 | 0.048 |
|
| Control vs.
severe | 0.010 | 0.010 | 0.050 |
| Mild to moderate
vs. severe | 0.171 | 0.138 | 0.380 |
Discussion
MR imaging technology, which is thought to show
brain morphology at a high resolution in the clinic, has been
developed rapidly in the past decades. It is superior to cerebral
CT and ultrasound examination in displaying lesions in the basal
ganglia or deep white matter, and multi-cystic encephalomalacia
around the ventricle (22).
T1WI could provide essential information for the
diagnosis and depicting typical MRI features of hypoxic-ischemic
injury (3,5–6). The
imaging pattern of HIE has been classified into three types
(4,23); parasagittal lesions, involving
cortico-subcortical regions, profound lesions located in the basal
ganglia or thalamus, and multi-cystic encephalomalacia.
Parasagittal lesions are typically associated with milder HIE
(24). In the present study, the T1
images in the mild to moderate (n=13) and severe group (n=11) were
similar, with punctate hyperintensity in the cortex or subcortical
white matter (P>0.05). Profound lesions in the basal ganglia and
thalamus are often associated with serious HIE (25). The results in the present study
showed unequivocally that lesions in the basal ganglia and thalamus
were associated with the severe group. Finally, multi-cystic
encephalomalacia are typically connected with an end-stage finding
of severe HIE. Multiple cysts in the brain were not detected in the
current study.
Previously, a meta-analysis (14) reported the prognostic utilities of
various quantitative cerebral MR biomarkers in neonatal
encephalopathy. Thirty-two studies were included that were
performed between January 1990 and July 2008. Regarding predicting
adverse outcome, T1WIs during the first 30 days had a pooled
sensitivity of 91% (95% confidence interval [CI], 87–94%). The
pattern of injury identified with T1WI may provide diagnostic and
prognostic information for neonatal encephalopathy (20,14).
Infants who show abnormal SI in the basal ganglia/thalami typically
undergo an adverse outcome (12–26). The
changes in routine T1WIs are characteristic, but a question is put
forward as to whether MRS biomarkers may be available in T1WI in
the evaluation of infants.
MRS is a non-invasive technique that allows
real-time analysis of metabolites in the human brain (27). Cho is a marker for membrane synthesis
and Cr (3.0 ppm) is chosen as the reference because of its
stability. Due to the rapid growth of the membranes in the neonatal
brain, the NAA (2.01 ppm) level is much lower than Cho (3.02 ppm)
(28). Reportedly, Lac (1.33 ppm) is
not present in great quantities in normal neonates and is rarely
detected by MRS (11). In the
present study, Lac in the control group was not observed.
The ascent of Lac/Cr, presumably because of energy
failure and the necessity to metabolize glucose anaerobically, was
not marked as elucidated by Hanrahan et al (12), in contrast to the results of the
present study. It seems likely that this difference of results is
related to the time of the MRS examination with respect to the
hypoxic-ischemic event. The mean time from injury to MRS in
patients in the current study was 7 days; for patients in Hanrahan
et al (12), the mean time
was <24 h. The precise time at which lactate levels become lower
after hypoxic-ischemic injury in neonates is unknown. Indeed, in
the study by Xu and Vigneron (29),
although the presence of lactate persisted, the Lac level always
dropped on follow-up spectra performed weeks after the injury.
Hence, it can be suggested that the Lac level would have been
higher if the patients had been studied earlier following perinatal
hypoxic-ischaemic injury in the present study. The results in the
present study were consistent with those of Barkovich et al
(30) and Alderliesten et al
(31), who found associations with
NAA levels in HIE. Similarly, the patients in the study by
Barkovich et al (30)
experienced injury within an average of 7 days prior to MRS and
those of Alderliesten et al (31) experienced a hypoxic-ischemic event at
an average of 6 days. Surprisingly, no statistically significant
differences in NAA/Cr and Lac/Cr were identified between the mild
to moderate and severe group. In comparison with MR performances,
results of proton MRS had a number of limitations in distinguishing
mild from moderate to severe injury.
In conclusion, 1H-MRS is a useful
technique for distinguishing between HIE and normal newborns;
however, with regard to differentiating between grades,
1H-MRS should be interpreted in conjunction with
performances on T1WI.
References
|
1
|
Dilenge ME, Majnemer A and Shevell MI:
Long-term developmental outcome of asphyxiated term neonates. J
Child Neurol. 16:781–792. 2001. View Article : Google Scholar : PubMed/NCBI
|
|
2
|
Yin XJ, Wei W, Han T, Shang MX, Han X,
Chai YN and Feng ZC: Value of amplitude-integrated
electroencephalograph in early diagnosis and prognosis prediction
of neonatal hypoxic-ischemic encephalopathy. Int J Clin Exp Med.
7:1099–1104. 2014.PubMed/NCBI
|
|
3
|
Jadas V, Brasseur-Daudruy M, Chollat C,
Pellerin L, Devaux AM and Marret S: et le réseau de périnatalité de
Haute-Normandie: The contribution of the clinical examination,
electroencephalogram and brain MRI in assessing the prognosis in
term newborns with neonatal encephalopathy. A cohort of 30 newborns
before the introduction of treatment with hypothermia. Arch
Pediatr. 21:125–133. 2014.(In French). View Article : Google Scholar : PubMed/NCBI
|
|
4
|
Sie LT, van der Knaap MS, Oosting J, de
Vries LS, Lafeber HN and Valk J: MR patterns of hypoxic-ischemic
brain damage after prenatal, perinatal or postnatal asphyxia.
Neuropediatrics. 31:128–136. 2000. View Article : Google Scholar : PubMed/NCBI
|
|
5
|
Liauw L, Palm-Meinders IH, van der Grond
J, Leijser LM, le Cessie S, Laan LA, Heeres BC, van Buchem MA and
van Wezel-Meijler G: Differentiating normal myelination from
hypoxic-ischemic encephalopathy on T1-weighted MR Images: A new
approach. AJNR Am J Neuroradiol. 28:660–665. 2007.PubMed/NCBI
|
|
6
|
Liauw L, van der Grond J, van den
Berg-Huysmans AA, Laan LA, van Buchem MA and van Wezel-Meijler G:
Is there a way to predict outcome in (near) term neonates with
hypoxic-ischemic encephalopathy based on MR imaging? AJNR Am J
Neuroradiol. 29:1789–1794. 2008. View Article : Google Scholar : PubMed/NCBI
|
|
7
|
Ancora G, Testa C, Grandi S, Tonon C,
Sbravati F, Savini S, Manners DN, Gramegna LL, Tani G, Malucelli E,
et al: Prognostic value of brain proton mr spectroscopy and
diffusion tensor imaging in newborns with hypoxic-ischemic
encephalopathy treated by brain cooling. Neuroradiology.
55:1017–1025. 2013. View Article : Google Scholar : PubMed/NCBI
|
|
8
|
Barkovich AJ, Baranski K, Vigneron D,
Partridge JC, Hallam DK, Hajnal BL and Ferriero DM: Proton MR
spectroscopy for the evaluation of brain injury in asphyxiated,
term neonates. AJNR Am J Neuroradiol. 20:1399–1405. 1999.PubMed/NCBI
|
|
9
|
Barkovich AJ, Westmark KD, Bedi HS,
Partridge JC, Ferriero DM and Vigneron DB: Proton spectroscopy and
diffusion imaging on the first day of life after perinatal
asphyxia: Preliminary report. AJNR Am J Neuroradiol. 22:1786–1794.
2001.PubMed/NCBI
|
|
10
|
Cheong JL, Cady EB, Penrice J, Wyatt JS,
Cox IJ and Robertson NJ: Proton MR spectroscopy in neonates with
perinatal cerebral hypoxic-ischemic injury: Metabolite peak-area
ratios, relaxation times and absolute concentrations. AJNR Am J
Neuroradiol. 27:1546–1554. 2006.PubMed/NCBI
|
|
11
|
Zhu W, Zhong W, Qi J, Yin P, Wang C and
Chang L: Proton magnetic resonance spectroscopy in neonates with
hypoxic ischemic injury and its prognostic value. Transl Res.
152:225–232. 2008. View Article : Google Scholar : PubMed/NCBI
|
|
12
|
Hanrahan JD, Sargentoni J, Azzopardi D,
Manji K, Cowan FM, Rutherford MA, Cox IJ, Bell JD, Bryant DJ and
Edwards AD: Cerebral metabolism within 18 hours of birth asphyxia:
A proton magnetic resonance spectroscopy study. Pediatr Res.
39:584–590. 1996. View Article : Google Scholar : PubMed/NCBI
|
|
13
|
de Vries LS and Cowan FM: Evolving
understanding of Hypoxic-ischemic Encephalopathy in the term
infants. Semin Pediatr Neurol. 16:216–225. 2009. View Article : Google Scholar : PubMed/NCBI
|
|
14
|
Thayyil S, Chandrasekaran M, Taylor A,
Bainbridge A, Cady EB, Chong WK, Murad S, Omar RZ and Robertson NJ:
Cerebral magnetic resonance biomarkers in neonatal encephalopathy:
A meta-analysis. Pediatrics. 125:e382–e395. 2010. View Article : Google Scholar : PubMed/NCBI
|
|
15
|
Meyer-Witte S, Brissaud O, Brun M,
Lamireau D, Bordessoules M and Chateil JF: Prognostic value of MR
in term neonates with neonatal hypoxic-ischemic encephalopathy: MRI
score and spectroscopy. About 26 cases. Arch Pediatr. 15:9–23.
2008.(In French). View Article : Google Scholar : PubMed/NCBI
|
|
16
|
Brissaud O, Amirault M, Villega F, Periot
O, Chateil JF and Allard M: Efficiency of fractional anisotropy and
apparent diffusion coefficient on diffusion tensor imaging in
prognosis of neonates with hypoxic-ischemic encephalopathy: A
methodologic prospective pilot study. AJNR Am J Neuroradiol.
31:282–287. 2010. View Article : Google Scholar : PubMed/NCBI
|
|
17
|
de Vries LS and Toet MC: Amplitude
integrated electroencephalography in the full-term newborn. Clin
Perinatol. 33:619–632. 2006. View Article : Google Scholar : PubMed/NCBI
|
|
18
|
Mia AH, Akter KR, Rouf MA, Islam MN, Hoque
MM, Hossain MA and Chowdhury AK: Grading of perinatal asphyxia by
clinical parameters and agreement between this grading and Sarnat
& Sarnat stages without measures. Mymensingh Med J. 22:807–813.
2013.PubMed/NCBI
|
|
19
|
Dyet LE, Kennea N, Counsell SJ, Maalouf
EF, Ajayi-Obe M, Duggan PJ, Harrison M, Allsop JM, Hajnal J,
Herlihy AH, et al: Natural history of brain lesions in extremely
preterm infants studied with serial magnetic resonance imaging from
birth and neurodevelopmental assessment. Pediatrics. 118:536–548.
2006. View Article : Google Scholar : PubMed/NCBI
|
|
20
|
Ramenghi LA, Fumagalli M, Righini A, Bassi
L, Groppo M, Parazzini C, Bianchini E, Triulzi F and Mosca F:
Magnetic resonance imaging assessment of brain maturation in
preterm neonates with punctate white matter lesions.
Neuroradiology. 49:161–167. 2007. View Article : Google Scholar : PubMed/NCBI
|
|
21
|
Niwa T, de Vries LS, Benders MJ, Takahara
T, Nikkels PG and Groenendaal F: Punctate white matter lesions in
infants: New insights using susceptibility-weighted imaging.
Neuroradiology. 53:669–679. 2011. View Article : Google Scholar : PubMed/NCBI
|
|
22
|
van Laerhoven H, de Haan TR, Offringa M,
Post B and van der Lee JH: Prognostic tests in term neonates with
hypoxic-ischemic encephalopathy: A systematic review. Pediatrics.
131:88–98. 2013. View Article : Google Scholar : PubMed/NCBI
|
|
23
|
Gano D, Chau V, Poskitt KJ, Hill A, Roland
E, Brant R, Chalmers M and Miller SP: Evolution of pattern of
injury and quantitative MRI on days 1 and 3 in term newborns with
hypoxic-ischemic encephalopathy. Pediatr Res. 74:82–87. 2013.
View Article : Google Scholar : PubMed/NCBI
|
|
24
|
Nikas I, Dermentzoglou V, Theofanopoulou M
and Theodoropoulos V: Parasagittal lesions and ulegyria in
hypoxic-ischemic encephalopathy: Neuroimaging findings and review
of the pathogenesis. J Child Neurol. 23:51–58. 2008. View Article : Google Scholar : PubMed/NCBI
|
|
25
|
Wagner F, Haenggi MM, Wagner B, Weck A,
Weisstanner C, Grunt S, Z'Graggen WJ, Gralla J, Wiest R and Verma
RK: The value of susceptibility-weighted imaging (swi) in patients
with non-neonatal hypoxic-ischemic encephalopathy. Resuscitation.
88:75–80. 2015. View Article : Google Scholar : PubMed/NCBI
|
|
26
|
Ment LR, Bada HS, Barnes P, Grant PE,
Hirtz D, Papile LA, Pinto-Martin J, Rivkin M and Slovis TL:
Practice parameter: Neuroimaging of the neonate: Report of the
quality standards subcommittee of the American academy of neurology
and the practice committee of the child neurology society.
Neurology. 58:1726–1738. 2002. View Article : Google Scholar : PubMed/NCBI
|
|
27
|
Martinez-Biarge M, Diez-Sebastian J,
Wusthoff CJ, Lawrence S, Aloysius A, Rutherford MA and Cowan FM:
Feeding and communication impairments in infants with central grey
matter lesions following perinatal hypoxic-ischaemic injury. Eur J
Paediatr Neurol. 16:688–696. 2012. View Article : Google Scholar : PubMed/NCBI
|
|
28
|
Rutherford MA, Ward P and Malamatentiou C:
Advanced MR techniques in the term-born neonate with perinatal
brain injury. Semin Fetal Neonatal Med. 10:445–460. 2005.
View Article : Google Scholar : PubMed/NCBI
|
|
29
|
Xu D and Vigneron D: Magnetic resonance
spectroscopy imaging of the newborn brain-a technical review. Semin
Perinatol. 34:20–27. 2010. View Article : Google Scholar : PubMed/NCBI
|
|
30
|
Barkovich AJ, Miller SP, Bartha A, Newton
N, Hamrick SE, Mukherjee P, Glenn OA, Xu D, Partridge JC, Ferriero
DM and Vigneron DB: MR imaging, MR spectroscopy and diffusion
tensor imaging of sequential studies in neonates with
encephalopathy. AJNR Am J Neuroradiol. 27:533–547. 2006.PubMed/NCBI
|
|
31
|
Alderliesten T, de Vries LS, Benders MJ,
Koopman C and Groenendaal F: MR imaging and outcome of term
neonates with perinatal asphyxia: Value of diffusion-weighted MR
imaging and 1H MR spectroscopy. Radiology. 261:235–242.
2011. View Article : Google Scholar : PubMed/NCBI
|