Introduction
Cerebrovascular disease is one of three major
diseases that can threaten human health, among which ischemic
cerebrovascular disease accounts for over 80% (1). The application of 320-slice volume
computed tomography (CT) in whole brain CT perfusion (CTP) imaging
can make clear diagnoses in a timely manner during the super acute
period (<6 h) of acute cerebral infarction, evaluate blood
perfusion of ischemic brain tissue, and obtain whole brain CT
angiography (CTA) and CT venography (CTV) images (2). It is a method of hemodynamic evaluation
widely applied clinically (3) and is
important for guiding early clinical treatment, especially for
thrombolytic therapy. Reducing the CT scanning radiation dose has
been a focus of international studies (4,5). The
reduction in tube voltage can reduce the radiation dose patients
receive and simultaneously reduce the amount of contrast agent
needed to make it more suitable for brain perfusion imaging
(6). The present study was designed
to investigate the application feasibility of the dual low-dose
scanning scheme in cerebral infarction whole brain CTP by comparing
whole brain CTP image quality and radiation dose of patients with
acute cerebral infarction under different tube voltages and
contrast agent concentration scanning schemes.
Patients and methods
Patients
Fifty-nine patients who underwent 320-slice whole
brain CTP and diagnosed with acute cerebral infarction in Xuzhou
Clinical Medical College from September 2014 to March 2016 were
enrolled (excluding those with allergic history to iodinated
contrast agent, renal insufficiency and those taking metformin for
thyroid disease). The patients included 35 males and 24 females,
aged 39–86 years, with mean age of 60.0±14.6 years. The height and
weight of all patients were measured before examination and body
mass index (BMI) was calculated. Patients were randomly divided
into groups A and B and the general parameters are shown in
Table I. The present study was
approved by the Ethics Committee of Xuzhou Central Hospital and
written informed consent was obtained from all the patients.
 | Table I.Basic parameters of patients in groups
A and B. |
Table I.
Basic parameters of patients in groups
A and B.
| Groups | Case no.
(male/female) | Age (years) | BMI
(kg/m2) |
|---|
| Group A | 28 (18/10) | 61.8±11.7 | 24.2±3.6 |
| Group B | 31 (17/14) | 58.3±16.8 | 24.2±3.3 |
| P-value | 0.648 | 0.942 | 0.984 |
Examination methods
An Aquilion 320 volume CT (Toshiba, Ohtawara, Japan)
was used for whole brain CTP scanning. For group A, the tube
voltage was 100 kV and the contrast agent was iohexol (350 mg
I/ml). For group B, the tube voltage was 80 kV and the contrast
agent was iodixanol (270 mg I/ml). The other scanning parameters in
both groups were the same: The volume scanning mode was used, the
thickness was 0.5 mm and the tube current was 310 mA. The
proportional total injection volume (50 ml) and flow rate (4
ml/sec) in both groups were the same. The whole brain perfusion
scanning scheme was used and the first exposure began 7 sec after
contrast agent injection. The exposure time interval was 2 sec
during the arterial phase, 4–6 sec during the venous phase, and
total scanning time was 62 sec. A total of 19 exposures were
achieved at 7, 11, 13, 15, 19, 21, 23, 25, 27, 29, 32, 34, 36, 38,
42, 47, 52, 57 and 62 sec after injection of contrast agent
(Table II).
| Table II.Scanning schemes in groups A and
B. |
Table II.
Scanning schemes in groups A and
B.
|
| Tube voltage
(kV) | Tube current
(mA) | Exposure time (sec)
(time after injection of contrast agent) | Exposure time
interval (sec) |
|---|
|
|
|
|
|
|
|---|
| Scanning sequence
(exposure frequency) | Group A | Group B | Group A | Group B | Group A | Group B | Group A | Group B |
|---|
| 1 (1) | 100 | 80 | 310 | 310 | 7 | 7 | – | – |
| 2 (3) | 100 | 80 | 150 | 150 | 11-15 | 11-15 | 2 | 2 |
| 3 (6) | 100 | 80 | 310 | 310 | 19-29 | 19-29 | 2 | 2 |
| 4 (4) | 100 | 80 | 150 | 150 | 32-38 | 32-38 | 2 | 2 |
| 5 (5) | 100 | 80 | 310 | 310 | 47-62 | 47-62 | 5 | 5 |
Reconstruction method
Images from group A were reconstructed with the
conventional filtered back projection (FBP) technique and group B
with the algebraic reconstruction technique (ART).
Post-processing of images
A total of 6,080 images divided across 19 groups
obtained from scanning were imported to the Toshiba workstation
(Toshiba, Tokyo, Japan) and entered into the 4-D perfusion software
for analysis (version 3.2; Toshiba). The region of interest (ROI)
was selected for CT value measurement in the arterial M1 segment of
the brain that the software was used to automatically generate,
including other perfusion parameters. CTP referred to repeating
multiple scans on the same selected layer continuously during
intravenous injection of contrast agent to obtain time-density
curves (TDC) (which reflected changes in contrast agent
concentrations in organs, and indirectly reflected changes in organ
perfusion volume) per pixel on this layer. Cerebral blood flow
(CBF), relative cerebral blood volume (rCBV), mean transit time
(MTT) and time to peak (TTP) were calculated with different
mathematical models based on the curve. These parameters were used
to form a new digital matrix. Intuitional and clear parameter color
images were obtained through digital-to-analog conversion and
pseudo-color processing, named CTP. The Toshiba Aquilion One 320
volume CT (Toshiba) was equipped with a 160-mm range detector
(Barui Medical Equipment Co., Beijing, China), which could obtain
images of the whole brain under a single exposure, thus whole brain
perfusion scanning can be achieved without moving the scanning
table. In addition, it can achieve whole brain isotropy, and obtain
whole brain horizontal, coronal and sagittal CTP images. Finally,
brain CTA and CTV images were obtained through post-processing at
the workstation.
All volume data were imported to the Toshiba Vital
version 6.5.3 workstation (Toshiba) and whole brain CTA and CTV
images were obtained with the digital silhouette technology of the
workstation.
Image quality evaluation
i) Objective evaluation. CT value at the arterial M1
segment of the brain at the peak in the images of groups A and B
were measured and the signal-to-noise ratio (SNR) and
contrast-to-noise ratio (CNR) were calculated based on formula
(1) and formula (2): (1) SNR =
ROI mean CT value/image noise; (2)
CNR = (ROI mean CT value - mean CT value at the same layer of brain
parenchyma)/image noise.
Image noise = standard deviation of the measurement
value by CT within the ROI range. Calcification should be avoided
to the greatest extent in ROI selections and its area should be
over one-half of the lumen area (Fig. 1A
and B).
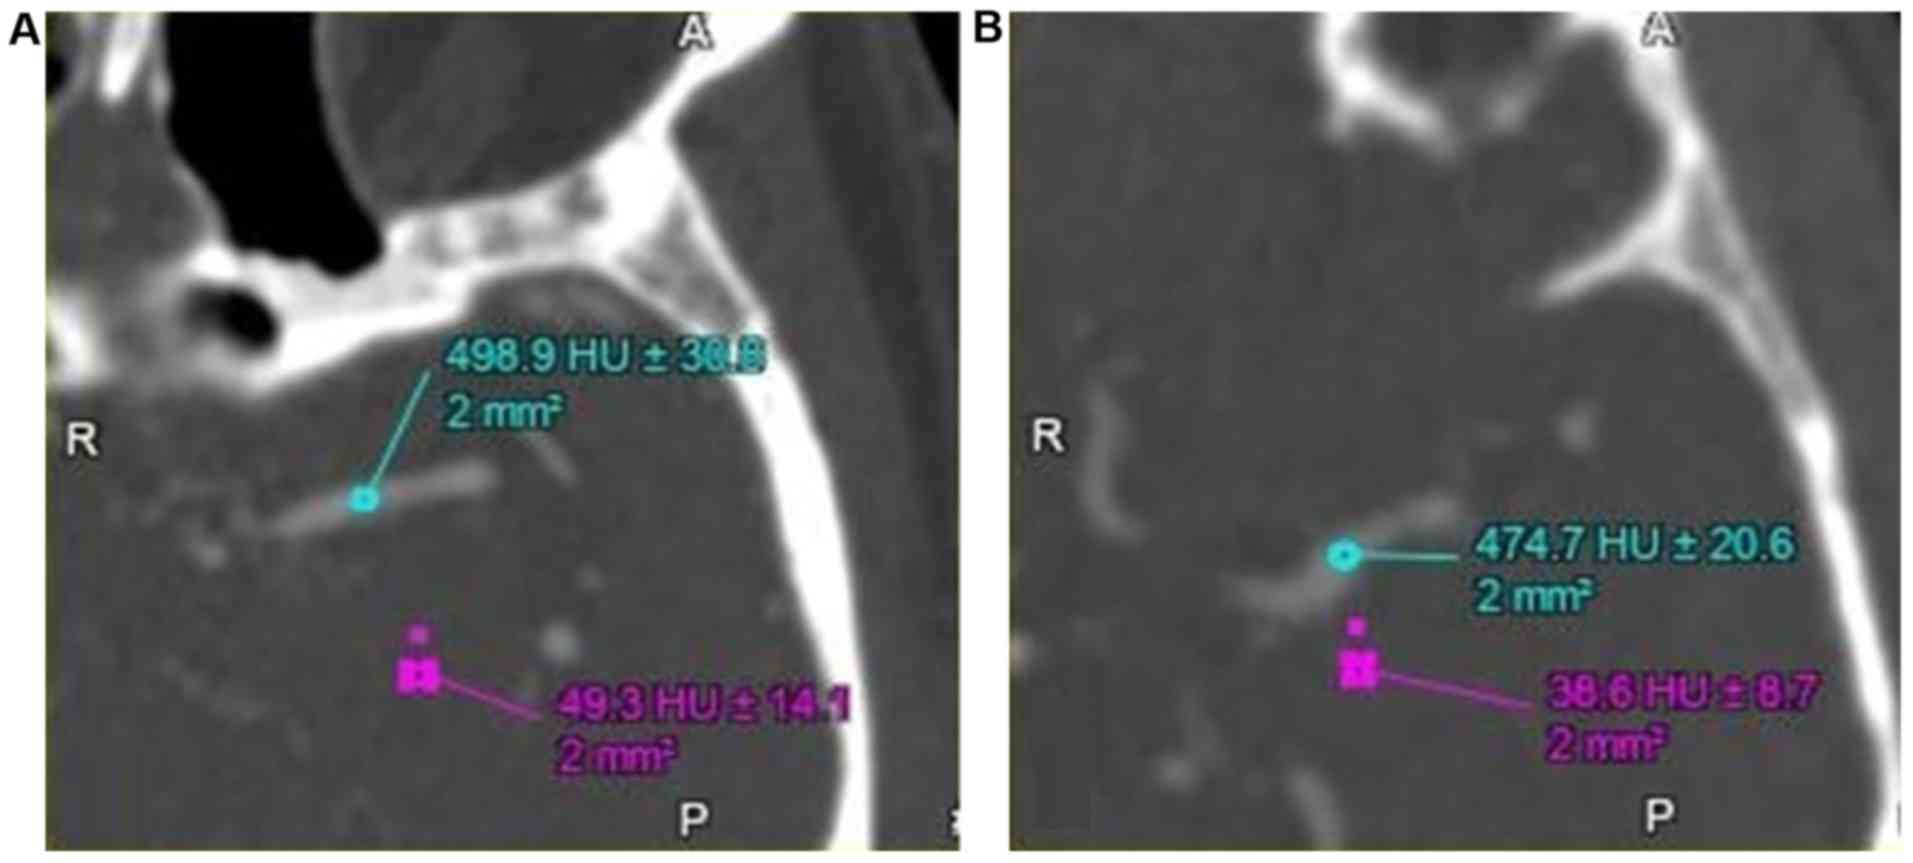 | Figure 1.The objective evaluation of the image
quality. (A) A 71-year-old male presented with sudden dizziness for
no obvious cause 2 h before evaluation, accompanied with
salivation. The figure shows the horizontal axis surface at the
arterial M1 segment of the brain of a representative patient in
group A. Tube voltage, 100 kV; contrast agent, iohexol (350 mg
I/ml), reconstructed with FBP. An area of 2 mm2 was
selected as the ROI, and the CT value at the arterial M1 segment in
the left brain was measured as 498.9 HU±30.8 and the CT value of
the brain parenchyma on the same layer was 49.3 HU±30.8. (B) A
59-year-old male presented with sudden double vision, accompanied
with dizziness and headache. The figure shows the horizontal axis
surface at the arterial M1 segment of the brain of a representative
patient in group B. Tube voltage, 80 kV; contrast agent, iodixanol
(270 mg I/ml), reconstructed with algebraic reconstruction
technique. An area of 2 mm2 was selected as the ROI, and
the CT value at the arterial M1 segment in the left brain was
measured as 474.7 HU±20.6 and the CT value of the brain parenchyma
on the same layer was 38.6 HU±8.7. FBP, filtered back projection;
ROI, region of interest; CT, computed tomography. |
ii) Subjective evaluation. Two experienced
radiologists independently completed the image quality rating
without knowledge of the groupings, and they adopted a 3-level
scoring system: A score of 3 indicated excellent image quality with
obvious pseudo-color difference, the abnormal perfusion area could
be easily identified and the diagnosis was clear; a score of 2
indicated general image quality, relatively obvious pseudo-color
difference and the abnormal perfusion area could be identified by
adjusting the contrast; a score of 1 indicated poor image quality,
blurred pseudo-color difference and the abnormal perfusion area or
split layer in the image could not be identified after contrast
adjustment. CTP images could not be generated and diagnostic needs
were not met (7). The consistency of
image quality evaluated by the two physicians was assessed by kappa
(κ) analysis. κ value, 0.8–1.0 indicated the consistency was
excellent; 0.61–0.8 indicated the consistency was better; 0.41–0.6
indicated the consistency was ordinary; and <0.4 indicated poor
consistency.
The matching degree between the abnormal area shown
in the images and the symptoms of patients were evaluated, combined
with the clinical symptoms of patients according to whole brain CTA
and CTP images. The matching degree was evaluated with a 0–2 level
scoring system: A score of 2 indicated the CTP hypoperfusion area
occurred in the responsible lesion (CBV and CBF were decreased, MTT
and TTP were extended), and stenosis or occlusion occurred in the
corresponding artery; a score of 1 indicated CTP hypoperfusion
occurred in the responsible lesion (CBV and CBF were decreased, MTT
and TTP were extended), but no obvious stenosis or occlusion
occurred in the corresponding artery, or stenosis of the
responsible artery occurred but a CTP low perfusion area was not
shown; a score of 0 indicated the symptoms of patients were
distinct but CTP and CTA were negative (8) (Figs. 2
and 3).
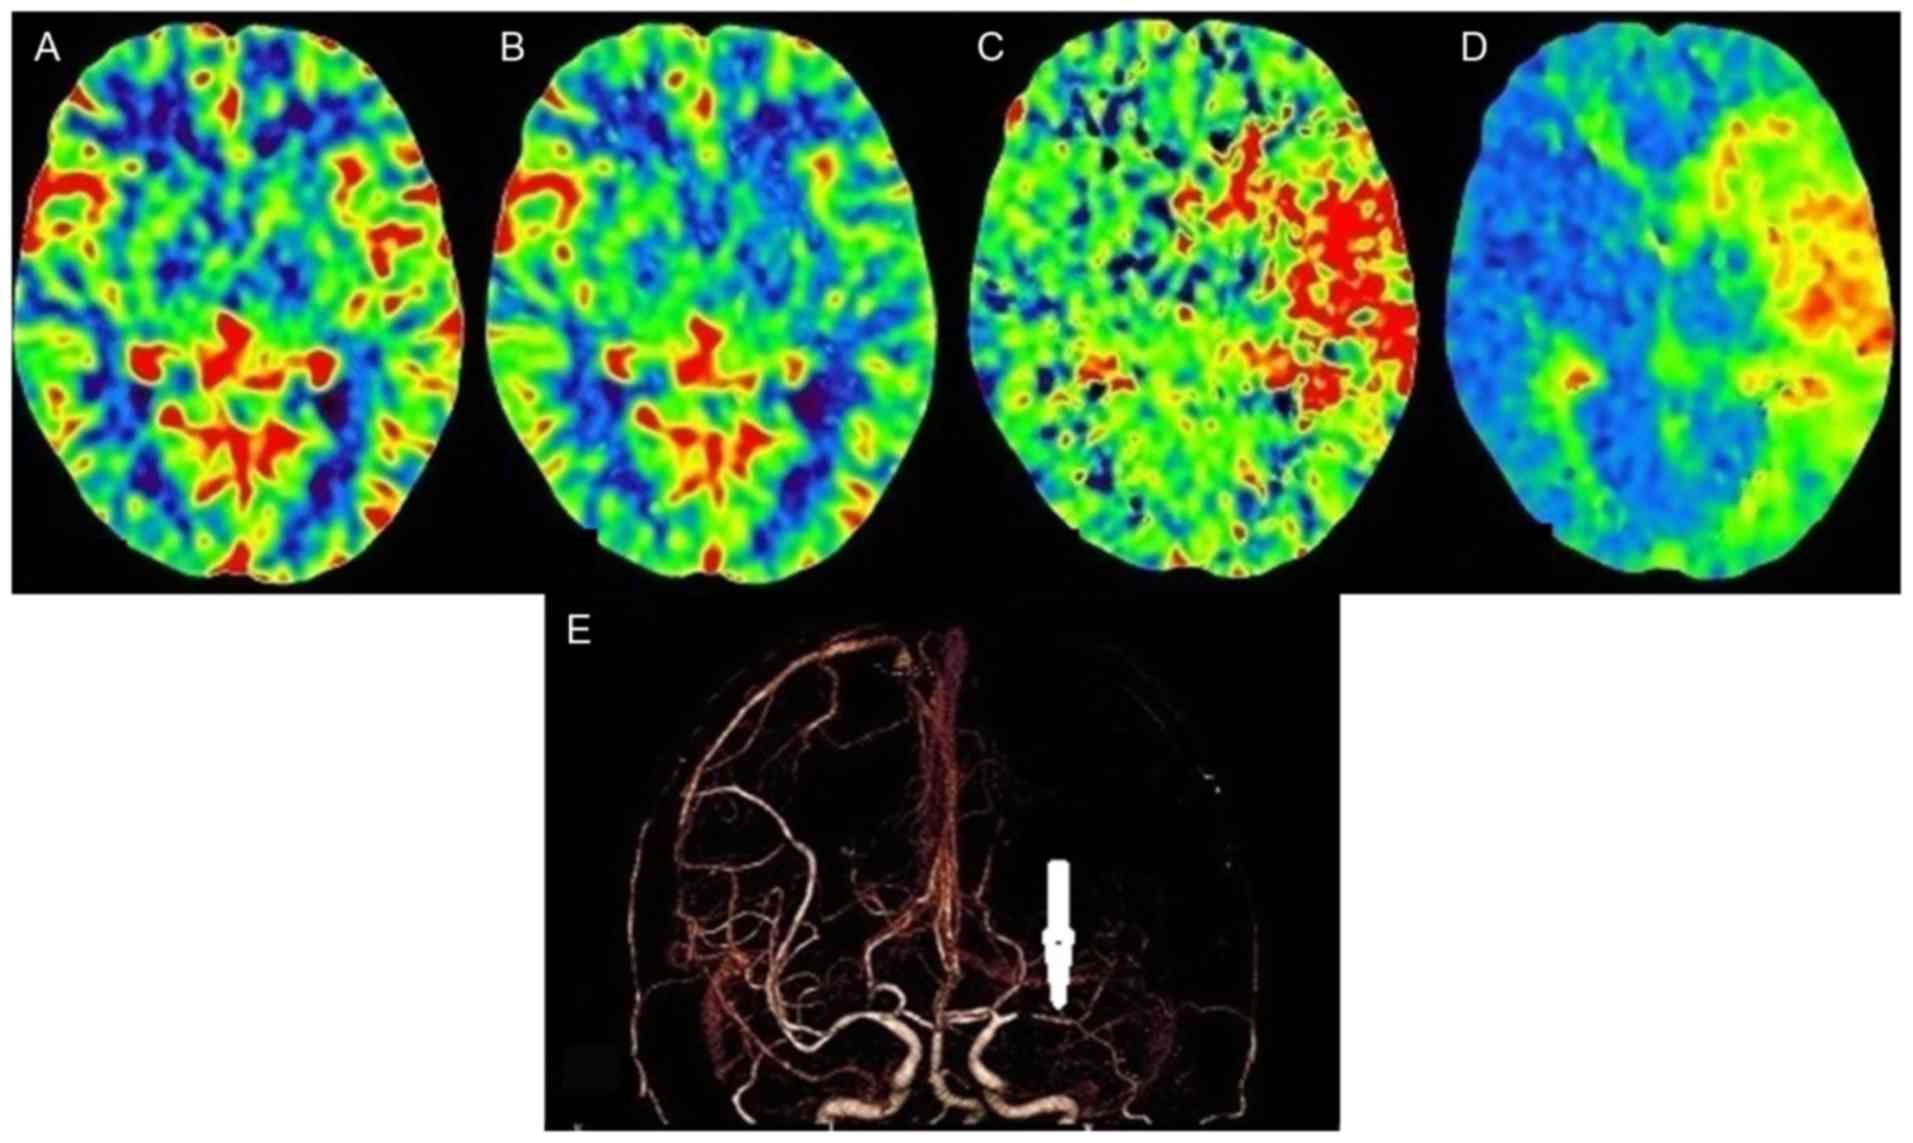 | Figure 2.A 55-year-old male presented with
slurred speech, accompanied with right limb weakness for 3 h. The
scanning scheme in group A (100 kV, 350 mg I/ml iohexol,
reconstructed by FBP) was used. The subjective image quality score
by two physicians was 3; the clinical symptoms were positive, CTP
and CTA were consistent with the clinical symptoms, the matching
rate score of the clinical symptoms and imaging diagnosis rate was
2. (A) The cerebral perfusion CBV image shows that the CBV of the
frontotemporal parietal lobes on both sides were basically
symmetrical. (B) The cerebral perfusion CBF image shows that CBF of
the frontotemporal parietal lobes on both sides were substantially
symmetrical. (C) The cerebral perfusion MTT image shows the left
frontotemporal lobe MTT was extended (compared with the opposite
side, there was a large area of red time extension on the left
frontotemporal lobe and the time was short to the extent of long
pseudo-color change: Blue → green → yellow → red). (D) The cerebral
perfusion TTP image shows the left frontotemporal lobe TTP was
extended (there was a large area of red and yellow time extension
area on the left frontotemporal lobe). (E) CTA image shows there
was a distal occlusion (arrow) at arterial M1 segment of the left
brain. FBP, filtered back projection; CTP, computed tomography
perfusion; CTA, CT angiography; MTT, mean transit time. |
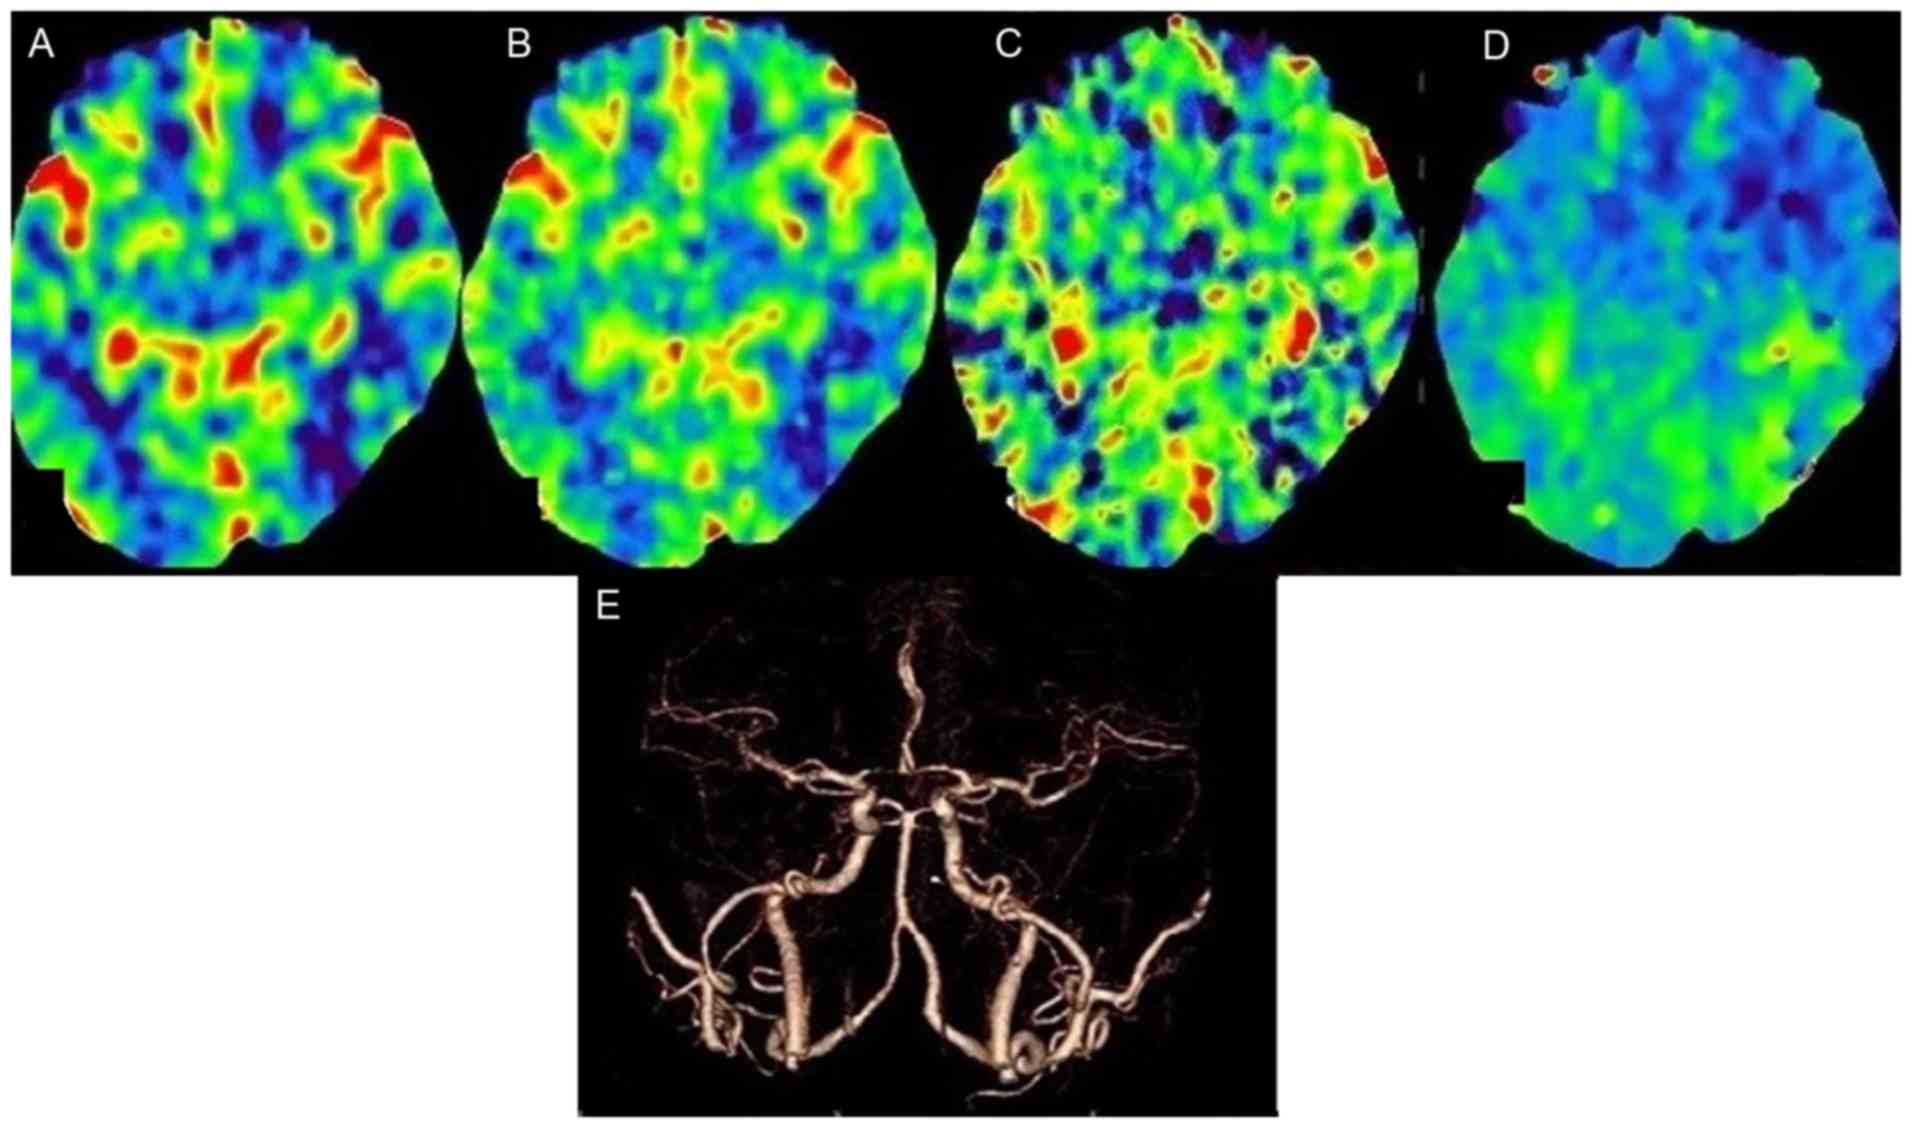 | Figure 3.A 50-year-old male, presented with
dizziness, accompanied with nausea for no obvious cause 2.5 h
before examination. Group B (80 kV, 270 mg I/ml iodixanol,
reconstructed by ART). The subjective image quality score by the
two physicians was 2; the clinical symptoms were positive, CTP was
positive, CTA was negative and the matching degree score of the
clinical symptoms and imaging diagnosis was 1. (A) The CBV image
shows the CBVs of the frontotemporal parietal lobe on both sides
were basically symmetrical. (B) The CBF image shows the CBFs of the
frontotemporal parietal lobe on both sides were substantially
symmetrical. (C) The cerebral perfusion MTT image shows the MTT of
the frontotemporal lobes on both side was substantially symmetrical
(D) The cerebral perfusion transit TTP image shows the right
frontotemporal lobe TTP was extended compared with the left (there
was partial green time extension area on the right frontotemporal
lobe relative to the left original blue zone). (E) CTA image shows
there was no significant arterial stenosis in the brain. ART,
algebraic reconstruction technique; CTP, computed tomography
perfusion; CTA, CT angiography; CBV, cerebral blood volume; CBF,
cerebral blood flow; MTT, mean transit time; TTP, time to peak. |
Effective dose (ED) of radiation and
iodine intake
The dose length product (DLP) of all patients was
recorded and the ED values were calculated according to formula
[3]. [3] ED = DLP × k; k, conversion factor; in the present study,
k = 0.0021 mSv/(mGy·cm). Formula [4] was used to calculate the
iodine intakes of the patients in both groups. [4] Iodine intake =
iodine concentration × contrast agent dose.
The display rate of infarction
lesions
The number of patients diagnosed with acute cerebral
infarctions were recorded in the two groups and the infarct display
rates were compared.
The adverse reactions of contrast
agents
Patients were asked about their comfort within 15–20
min after scanning. Simultaneously, a variety of adverse reactions
were recorded within 20 min after scanning and within 3 days during
the follow-up period.
Statistical analysis
SPSS 16.0 statistical software (SPSS, Inc., Chicago,
IL, USA) was used for data analysis. Measurement data are expressed
as mean ± SD. Comparisons of measurement data between groups were
by t-test. Comparisons of subjective image scores and qualitative
data were by χ2 test. P<0.05 was considered to
indicate a statistically significant difference.
Results
The general parameters and comparisons of the 59
patients are shown in Table I. The
differences in age, gender and BMI between the two groups were not
statistically significant (P>0.05).
The comparison of the CT value, SNR and CNR at the
peak of the arterial M1 segment in the brain between groups A and B
is shown in Table III. The
differences in CT value, SNR and CNR between the two groups were
not statistically significant (P>0.05).
| Table III.Comparison of CT value, SNR and CNR at
arterial M1 segment of the brain between groups A and B (mean ±
SD). |
Table III.
Comparison of CT value, SNR and CNR at
arterial M1 segment of the brain between groups A and B (mean ±
SD).
|
| Total value | BMI <23
kg/m2 subgroup | BMI ≥23
kg/m2 subgroup |
|---|
|
|
|
|
|
|---|
| Indicator | Group A | Group B | P-value | Group A | Group B | P-value | Group A | Group B | P-value |
|---|
| CT value (HU) | 495.7±125.4 | 496.0±125.2 | 0.993 | 548.5±125.6 | 512.9±145.2 | 0.550 | 466.4±118.6 | 485.3±113.6 | 0.623 |
| SNR | 20.9±11.5 | 17.9±7.8 | 0.234 | 21.3±10.2 | 16.3±6.8 | 0.178 | 20.7±12.4 | 18.9±8.3 | 0.609 |
| CNR | 18.7±10.3 | 15.8±7.0 | 0.209 | 19.4±4.5 | 14.4±6.2 | 0.156 | 18.4±10.9 | 16.7±7.6 | 0.600 |
The evaluations of image quality of groups A and B
by the two physicians were consistent (group A, κ value was 0.651,
P<0.001; group B, κ value was 0.760, P<0.001). The
differences in image quality between groups A and B were not
statistically significant (physician 1, χ2=3.345,
P>0.05; physician 2, χ2=1.272, P>0.05; Table IV). In the evaluation of matching
degree of image display and symptoms, the difference between groups
A and B was not statistically significant (P>0.05) (Table V and Figs.
2 and 3).
| Table IV.CTP image quality scores and
comparison between groups A and B by two physicians. |
Table IV.
CTP image quality scores and
comparison between groups A and B by two physicians.
|
| Group A | Group B |
|
|
|---|
|
|
|
|
|
|
|---|
| Score | 1 | 2 | 3 | 1 | 2 | 3 | χ2 | P-value |
|---|
| Physician 1 | 1 | 11 | 16 | 0 | 7 | 24 | 3.345 | 0.188 |
| Physician 2 | 1 | 10 | 17 | 0 | 10 | 21 | 1.272 | 0.529 |
| Table V.Matching degree score and comparison
of the image display and symptoms between groups A and B. |
Table V.
Matching degree score and comparison
of the image display and symptoms between groups A and B.
| Groups | Score 2 | Score 1 | Score 0 |
|---|
| Group A | 11 | 6 | 11 |
| Group B | 13 | 9 | 9 |
DLP, ED, contrast agent dose and iodine intake in
groups A and B are shown in Table
VI. The ED decreased by 5.48 mSv (45%) in group B compared with
group A. Iodine intake in group B was reduced by 4,000 mg (23%)
compared with groups A (Table
VI).
| Table VI.Comparison of indicators between
groups A and B. |
Table VI.
Comparison of indicators between
groups A and B.
| Indicator | Group A | Group B |
|---|
| Tube voltage
(kV) | 100 | 80 |
| DLP (mGy·cm) | 5,743.50 | 3,131.10 |
| ED (mSv) | 12.06 | 6.58 |
| Contrast agent dose
(ml) | 50 | 50 |
| Iodine intake
(mg) | 17,500 | 13,500 |
Among 28 patients in group A, there were eight
without acute infarct, 15 with one infarct, and five with two
infarcts. Among 31 patients in group B, there were nine diagnosed
without acute infarct, 18 with one infarct, three with two infarcts
and one with three infarcts. The results showed that the rate of
diagnosis of infarcts was not statistically significant between
groups A and B (χ2=1.683, P>0.05) (Table VII).
| Table VII.Comparison of diagnosis rate of acute
infarct between groups A and B. |
Table VII.
Comparison of diagnosis rate of acute
infarct between groups A and B.
|
| Group A | Group B |
|---|
|
|
|
|
|---|
| Groups Scores | 0 | 1 | 2 | 3 | 0 | 1 | 2 | 3 |
|---|
| No. of lesions | 8 | 15 | 5 | 0 | 9 | 18 | 3 | 1 |
The 59 patients were without extravasation of
contrast agent during scanning. There were no significant allergic
reactions within 15–20 min after scanning. Within 3 days during the
follow-up period, four patients had moderate allergic reactions
[two patients in group A (2/28, 7.1%), two patients in group B
(2/31, 6.5%)]. Two patients manifested with facial rash and
swelling (one patients in each group), one patient manifested
abdominal urticaria (group A) and one with vomiting (group B).
Discussion
The 320-slice whole brain CTP is a form of
‘one-stop’ CT examination for hyperacute cerebral infarction that
includes the joint application of routine CTP, CTA and CTV. Some
refer to it as a multi-mode CT examination (9). However, because multiple perfusion
images require continuous exposure, subjects will suffer from
higher radiation doses. In recent years, reducing the radiation
dose has been a focus of international research (10–12).
Recent studies (13–15) show that low kV scanning can cause
average X-ray photon energy closer to the iodine K-edge and
decrease Compton scattering, so that CT values will be increased,
while radiation doses will be reduced.
With increasing application of contrast agents, the
incidence of contrast-induced nephropathy (CIN) has significantly
increased. According to a previous study, in addition to the
osmotic pressure factor, the viscosity of contrast agents are a key
factor in determining the incidence of CIN (16). Therefore, it is worth investigating
how the isotonic contrast agent, iodixanol can be modified by
reducing its viscosity to make it closer to physiological
characteristics, while maintaining its isotonic characteristics.
According to the isotonic iodine effect, the dose of contrast agent
must be increased to make 270 mg I/ml iodixanol reach the
development effect of 350 mg I/ml iohexol, and the latter increase
will lead to increased risk of CIN (17). In the present study, it was shown
that the low kV scheme (group B) X-ray output energy was closer to
the 33 keV iodine K-edge, and no decrease in intracranial CT value
was observed by comparing different kV scanning schemes between the
two groups.
With the progress of technology, ART is increasingly
applied in the CT reconstruction scheme. The latest ART
reconstruction can not only effectively reduce the image noise and
improve image SNR and CNR, thus maintaining or even improving the
image quality, but can also make up for the crease in image noise
and decrease in image quality from low kV, thereby reducing the ED
(17).
The results of the present study showed that the
differences in CT value, SNR, CNR, CTP and CTA subjective image
quality evaluations between group B (iodixanol, 270 mg I/ml) and 80
kV scanning scheme combined with ART reconstruction) and group A
(iohexol, 350 mg I/ml) and 100 kV scanning scheme combined with FBP
reconstruction) were not statistically significant (P>0.05). All
imaging modalities met the needs of clinical diagnosis; there was
no significant difference in the capacity of finding acute infarcts
between the groups (P>0.05); the ED and iodine intake in group B
(dual low-dose group) were significantly lower than in group A.
Therefore, the application of dual low-dose scanning scheme
combined with iterative reconstruction techniques can reduce ED
suffered by patients, reduce intake of iodine, meet the needs of
clinical diagnosis and minimize possible side effects.
The limitations of the present study were: i) The
partial artery lumens in the brain were small, ROI selection
generated artifacts easily because of the partial volume effect;
ii) the sample size was small. Large sample sizes are required for
further confirmation; and iii) in evaluating patients with
intracranial arterial stenosis, the comparison was not made with
the gold standard (DSA) control, therefore its diagnostic accuracy
of stenosis could not be evaluated.
References
|
1
|
Jeng JS and Yip PK: Epidemiology of
cerebrovascular disease inthe elderly in East Asia. Geriatr
Gerontol Int. 4:S198–S201. 2004. View Article : Google Scholar
|
|
2
|
Fu J, Chen WJ, Wu GY, Cheng JL, Wang MH,
Zhuge Q, Li JC, Zhang Q, Zhang Y, Xia NZ, et al: Whole-brain
320-detector row dynamic volume CT perfusion detected crossed
cerebellar diaschisis after spontaneous intracerebral hemorrhage.
Neuroradiology. 57:179–187. 2015. View Article : Google Scholar : PubMed/NCBI
|
|
3
|
National Lung Screening Trial Research
Team, ; Aberle DR, Adams AM, Berg CD, Black WC, Clapp JD,
Fagerstrom RM, Gareen IF, Gatsonis C, Marcus PM and Sicks JD:
Reduced lung-cancer mortality with low-dose computed tomographic
screening. N Eng J Med. 365:395–409. 2011. View Article : Google Scholar
|
|
4
|
Kulkarni NM, Uppot RN, Eisner BH and
Sahani DV: Radiation dose reduction at multidetector CT with
adaptive statistical iterative reconstruction for evaluation of
urolithiasis: how low can we go? Radiology. 265:158–166. 2012.
View Article : Google Scholar : PubMed/NCBI
|
|
5
|
Halliburton SS, Abbara S, Chen MY, Gentry
R, Mahesh M, Raff GL, Shaw LJ and Hausleiter J; Society of
Cardiovascular Computed Tomography: SCCT guidelines on radiation
dose and dose-optimization strategies in cardiovascular CT. J
Cardiovasc Comput Tomogr. 5:198–224. 2011. View Article : Google Scholar : PubMed/NCBI
|
|
6
|
Nakaura T, Nakamura S, Maruyama N, Funama
Y, Awai K, Harada K, Uemura S and Yamashita Y: Low contrast agent
and radiation dose protocol for hepatic dynamic CT of thin adults
at 256-detector row CT: effect of low tube voltage and hybrid
iterative reconstruction algorithm on image quality. Radiology.
264:445–454. 2012. View Article : Google Scholar : PubMed/NCBI
|
|
7
|
Chen GZ, Zhang LJ, Schoepf UJ, Wichmann
JL, Milliken CM, Zhou CS, Qi L, Luo S and Lu GM: Radiation dose and
image quality of 70 kVp cerebral CT angiography with optimized
sinogram-affirmed iterative reconstruction: comparison with 120 kVp
cerebral CT angiography. Eur Radiol. 25:1453–1463. 2015. View Article : Google Scholar : PubMed/NCBI
|
|
8
|
Escudero D, Otero J, Marqués L, Parra D,
Gonzalo JA, Albaiceta GM, Cofiño L, Blanco A, Vega P, Murias E, et
al: Diagnosing brain death by CT perfusion and multislice CT
angiography. Neurocrit Care. 11:261–271. 2009. View Article : Google Scholar : PubMed/NCBI
|
|
9
|
Nakayama YI, Awai K, Funama Y, Liu D,
Nakaura T, Tamura Y and Yamashita Y: Lower tube voltage reduces
contrast material and radiation doses on 16-MDCT aortography. AJR
Am J Roentgenol. 187:490–497. 2006. View Article : Google Scholar
|
|
10
|
Marin D, Nelson RC, Schindera ST, Richard
S, Youngblood RS, Yoshizumi TT and Samei E: Low-tube-voltage,
high-tube-current multidetector abdominal CT: improved image
quality and decreased radiation dose with adaptive statistical
iterative reconstruction algorithm - initial clinical experience.
Radiology. 254:145–153. 2010. View Article : Google Scholar : PubMed/NCBI
|
|
11
|
Heyer CM, Mohr PS, Lemburg SP, Peters SA
and Nicolas V: Image quality and radiation exposure at pulmonary CT
angiography with 100- or 120-kVp protocol: prospective randomized
study. Radiology. 245:577–583. 2007. View Article : Google Scholar : PubMed/NCBI
|
|
12
|
Ketelsen D, Horger M, Buchgeister M,
Fenchel M, Thomas C, Boehringer N, Schulze M, Tsiflikas I, Claussen
CD and Heuschmid M: Estimation of radiation exposure of 128-slice
4D-perfusion CT for the assessment of tumor vascularity. Korean J
Radiol. 11:547–552. 2010. View Article : Google Scholar : PubMed/NCBI
|
|
13
|
Tomizawa N, Nojo T, Akahane M, Torigoe R,
Kiryu S and Ohtomo K: AdaptiveIterative dose reduction in coronary
CT angiography using 320-row CT: assessment of radiation dose
reduction and image quality. J Cardiovasc Comput Tomogr. 6:318–324.
2012. View Article : Google Scholar : PubMed/NCBI
|
|
14
|
Wang R, Schoepf UJ, Wu R, Reddy RP, Zhang
C, Yu W, Liu Y and Zhang Z: Image quality and radiation dose of low
dose coronary CT angiography in obese patients: sinogram affirmed
iterative reconstruction versus filtered back projection. Eur J
Radiol. 81:3141–3145. 2012. View Article : Google Scholar : PubMed/NCBI
|
|
15
|
Hirata M, Sugawara Y, Fukutomi Y, Oomoto
K, Murase K, Miki H and Mochizuki T: Measurement of radiation dose
in cerebral CT perfusion study. Radiat Med. 23:97–103.
2005.PubMed/NCBI
|
|
16
|
Dittrich R, Akdeniz S, Kloska SP, Fischer
T, Ritter MA, Seidensticker P, Heindel W, Ringelstein EB and Nabavi
DG: Low rate of contrast-induced nephropathy after CT perfusion and
CT angiography in acute stroke patients. J Neurol. 254:1491–1497.
2007. View Article : Google Scholar : PubMed/NCBI
|
|
17
|
Zheng M, Liu Y, Wei M, Wu Y, Zhao H and Li
J: Low concentration contrast medium for dual-source computed
tomography coronary angiography by a combination of iterative
reconstruction and low-tube-voltage technique: feasibility study.
Eur J Radiol. 83:e92–e99. 2014. View Article : Google Scholar : PubMed/NCBI
|


