Introduction
Diabetic retinopathy (DR), is a major complication
of retinal vascular disease in patients with diabetes mellitus,
which can result in blindness (1).
Epidemiological studies have reported that approximately 250
million people worldwide suffer from diabetes; in rural areas of
China, approximately 43% of patients have varying degrees of DR, of
which 6.3% suffer from severe visual impairment (2). In the US population, approximately 86%
of patients with type 1 diabetes and 40% of patients with type 2
diabetes have varying degrees of DR (3,4). A high
serum glucose state can cause damage to the retina, retinal
capillary cell inflammation, oxidative stress and other reactions
leading to abnormal capillary function, ischemia and eventual
angiogenesis (1,5).
Signal transducer and activator of transcription 3
(STAT3), is one of the members of a family of signal transducers
and activators of transcription, that function by regulating cell
growth, differentiation and angiogenesis and participates in the
pathogenesis of DR (6). Given the
sizeable number of patients with diabetes and the prevalence of DR,
other than actively controlling serum glucose levels, there is no
effective treatment that can reverse DR progression (7). Pueraria is a leguminous perennial
plant, which contains both starch and flavonoids. The highest
amount of the active flavonoid ingredient is puerarin; which has
lipid-lowering, anti-oxidation, oxygen free radical scavenging and
other pharmacological effects (8).
Puerarin, has been shown to be effective in the treatment of
cerebral ischemia (9), angina,
myocardial infarction (10) and
other ischemic diseases. In recent years, many studies have
reported (11,12) that puerarin has a positive effect in
the treatment of diabetes and its complications. Therefore, in this
study, a diabetic mouse model was induced by streptozotocin (STZ),
and the protective effect of puerarin on DR was observed by
measuring changes of blood glucose, oxidative stress and STAT3
expression; its mechanism of action was also studied for future
potential clinical application of puerarin.
Materials and methods
Forty specific pathogen free (SPF)-grade
Sprague-Dawley rats of 8–10 weeks of age, half male and half
female, weight 200–220 g, were purchased from the Shanghai Lake
Experimental Animal Center [license number: SCXK (Shanghai)
2012-0002]. Each animal with a normal fundus examination was
randomly divided into 4 groups (10 per group); normal control (NC),
diabetes model (DM), low dose puerarin (LP) and high dose puerarin
group (HP). All rats were housed in the SPF system and were fed a
normal diet. Streptozotocin (STZ) (Sigma-Aldrich, St. Louis, MO,
USA) induction was used to establish the diabetic rat model. Rats
were fasted for 12 h before modeling, and STZ [10 g/l solution with
0.1 mmol/LPBS buffer (pH 4.5)] was injected intraperitoneally at a
dosage of 60 mg/kg. Seventy-two hours after injection, tail vein
blood was collected for rapid blood glucose determination (if the
tail vein blood glucose for rapid/l, the modeling was determined
successful). After successful modeling, rats from each group were
given intragastric administration once a day for 4 weeks; the NC
and DM groups were given sterile normal saline (10 ml/kg), the LP
group was given 250 mg/kg puerarin (Beijing Sihuan Pharmaceutical
Co., Ltd., Beijing, China; Chinese medicine H20055195); and the HP
group was given 500 mg/kg puerarin (13). At the end of the second and fourth
week of intragastric administration, tail vein blood glucose was
determined. The study was approved by the Ethics Committee of the
Eye Hospital of Wenzhou Medical University.
The determination of electroretinogram (visual
electrophysiological detector; Chongqing Kanghua Co., Ltd.,
Chongqing, China)] was performed before modeling and at 4 weeks
before sacrifice. Rats were subjected to dark adaptation for 30 min
and were anesthetized with intraperitoneally injected 3%
pentobarbital sodium (40 mg/kg) followed by 0.5% of
tropicamide/phenylephrine for ocular dilation. A ground electrode
was connected to the tip of the ear skin, and the reference
electrode was connected to the midpoint of the eyes subcutaneously.
Then, white light shined for 200 ms, at an intensity of 10
cds/m2, and the b-wave amplitude was recorded when the
strongest reaction of the eyes was detected.
Prior to sacrifice, and after electroretinogram
determination, abdominal aorta blood was drawn, and centrifuged to
isolate serum that was stored at −80°C for later determination of
serum insulin, superoxide dismutase (SOD), malondialdehyde (MDA),
and total anti-oxidation capacity (T-AOC) [using a kit (Nanjing
Institute of Bioengineering, Nanjing, China)]. Both bulbus oculi
were removed and placed in ice saline. Under the surgical
microscope (Suzhou Liuliu vision Co., Ltd., Suzhou, China), both
sides of retinal tissues were separated and stored at −80°C; one
side was used for the determination of SOD, MDA and T-AOC, and the
other side was used for the determination of STAT3 expression.
SOD, MDA, T-AOC and insulin in each group was
determined from serum from each rat using appropriate kits and the
manufacturers protocol. The level of SOD was measured at 550 nm,
level of MDA was measured at 532 nm, and the level of T-AOC was
measured at 520 nm by continuous wavelength multi-functional
microplate reader (Continuous wavelength multifunctional microplate
reader; Tecan Austria GmbH, Grödig, Austria). The determination of
insulin (insulin ELISA kit; ALPCO, Salem, NH, USA) was determined
per the kit protocol, and continuous wavelength multi-functional
microplate reader was used to measure OD value; a standard curve
was generated and insulin concentration was calculated.
Determination of the levels of SOD, MDA and T-AOC in
retinal tissue homogenate of each group were determine. After the
retinal tissue was weighed, normal ice saline was added at a ratio
of 1:99, and the supernatant was collected after the homogenate was
centrifuged. The ingredients were added according to the SOD, MDA
and T-AOC assay kits and the specific determination method was the
same as the one for serum.
Extraction of retinal RNA, and the reverse
transcription (reverse transcription kit; Toyobo Co., Ltd., Tokyo,
Japan) of retinal tissue was performed; an appropriate amount of
TRIzol reagent (Takara Bio, Shiga, Japan) was added to extract
total RNA. Ultraviolet spectrophotometer (ultrasonic ultraviolet
spectrophotometer; Thermo Fisher Scientific, Waltham, MA, USA) was
used to determine RNA concentration and purity. RNA underwent
reverse transcription as follows: 2 µg of RNA underwent heat
denaturation for 5 min at 65°C, and then immediately put on ice for
cooling; then 4 µl of 5X RT Master Mix was added, followed by DEPC
treated water to reach a total volume of 20 µl with reaction
parameters were 37°C 15 min, 52°C 5 min, 98°C 5 min. Real-time PCR
was used to determination retinal STAT3 mRNA expression. The
reaction system was as follows: 2 µl cDNA, 0.5 µl upstream and
downstream primers (Table I for
STAT3 and GAPDH primer sequences) and 12.5 µl 2X SYBR-Green PCR
Master Mix (SYBR-Green PCR Master Mix; Takara Bio) and ultrapure
water was added to reach a total volume of 25 µl. Samples were
analyzed a by real-time fluorescence quantitative PCR machine
(real-time fluorescence quantitative PCR; Eppendorf, Hamburg,
Germany); reaction parameters were as follows: 95°C for 30 sec,
95°C for 5 sec, and 60°C for 30 sec for 40 cycles, and the
amplification curves and Ct values for each reaction were read
[GAPDH (GAPDH primer; Shanghai Biomedical Engineering Co., Ltd.,
Shanghai, China) was used as the reference, the relative
quantification 2−∆∆Ct method was used to compare the
expression of each gene].
 | Table I.Primer sequences. |
Table I.
Primer sequences.
| Gene | Length (bp) | Primer sequence |
|---|
| STAT3 | 112 | Forward:
5-CACCTTGGATTGAGAGTCAAGAC-3 |
|
|
| Reverse:
5-AGGAATCGGCTATATTGCTGGT-3 |
| GAPDH | 95 | Forward:
5-AGGTCGGTGTGAACGGATTTG-3 |
|
|
| Reverse:
5-GGGGTCGTTGATGGCAACA-3 |
ELISA detection of retinal STAT3 protein was
performed using a kit (STAT3 ELISA kit; R&D Systems,
Minneapolis, MN, USA), according to the manufacturers protocol. To
an appropriate amount of retina by weight was added normal saline
for homogenization; samples were centrifuged and the supernatant
separated for ELISA. The OD value was measured by a continuous
wavelength multifunctional microplate reader, a standard curve was
drawn and the STAT3 protein content of each sample was
calculated.
Results were statistically compared and shown as
mean ± SD, using the SPSS 20.0 statistical software (IBM, Armonk,
NY, USA). An independent sample t-test was used for comparison
between two groups, and one-way ANOVA was used to compare between
multiple groups. P<0.05 was used as the threshold to determine
statistical significance.
Results
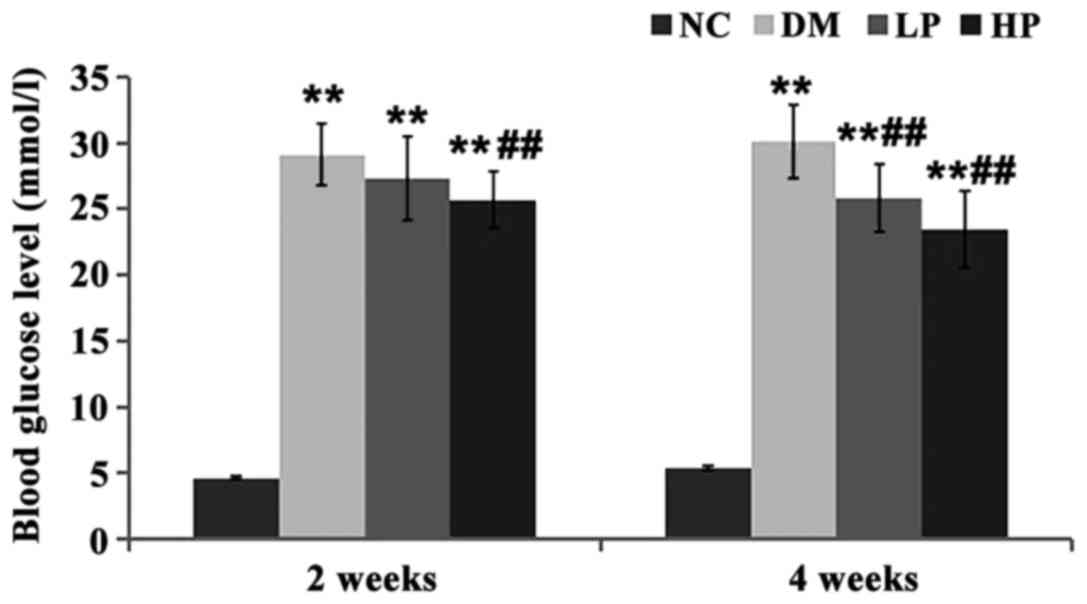
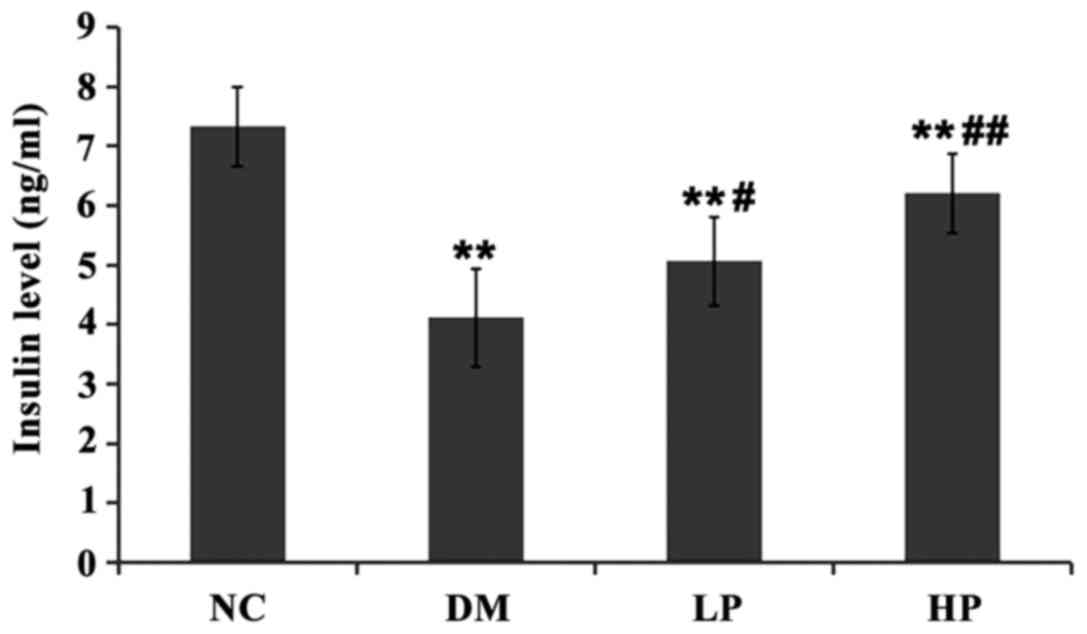
After STZ induction, the levels of blood glucose and
insulin (Figs. 1 and 2) in the DM, LP and HP groups were
significantly higher than those in the NC group (P<0.01). The
blood glucose in the puerarin group was significantly lower than
that in the DM group (P<0.01), and the insulin level was
significantly higher, especially in the HP group (P<0.05).
There was no significant difference in b-wave
amplitude of electroretinogram (Table
II) between the groups before modeling (P>0.05). After
treatment, the amplitude of b-wave of electroretinogram in the DM
and LP groups were significantly lower than that in the NC group
(P<0.01). Compared to the DM group, the amplitude of b-wave of
electroretinogram in the LP and HP groups was significantly higher
(P<0.05), where the HP group showed a level close to normal
(P>0.05).
| Table II.The comparison of b-wave amplitude of
rat electroretinogram (mean ± SD, µV). |
Table II.
The comparison of b-wave amplitude of
rat electroretinogram (mean ± SD, µV).
| Group | Before modeling | After treatment |
|---|
| NC | 183.24±16.10 | 178.73±19.21 |
| DM | 176.19±19.21 |
124.04±21.98a |
| LP | 175.66±21.53 |
147.56±18.26a,b |
| HP | 186.08±18.45 |
163.30±22.15c |
The serum levels of SOD, MDA and T-AOC levels in
rats were compared (Table III).
The activity of SOD in the DM and LP groups was significantly lower
than that in the NC group (P<0.01). The MDA content was
significantly higher than that in the NC group (P<0.01). The SOD
activity in the LP and HP groups was significantly higher than in
the DM group (P<0.01), and the MDA level in those two groups was
significantly lower than in the DM group (P<0.05). There was no
significant difference between the HP group and the NC group
(P>0.05). There was no significant difference in the serum T-AOC
level among the groups (P>0.05).
| Table III.Comparison of serum SOD, MDA and T-AOC
levels in rats (mean ± SD). |
Table III.
Comparison of serum SOD, MDA and T-AOC
levels in rats (mean ± SD).
| Group | SOD (U/ml) | MDA (µmol/l) | T-AOC (U/ml) |
|---|
| NC | 124.07±12.13 | 18.02±3.28 | 14.54±1.86 |
| DM |
83.22±10.25a |
27.10±2.09a | 12.48±1.67 |
| LP |
98.91±9.38a,c |
24.63±1.96a,b | 13.79±2.00 |
| HP |
115.60±11.25c |
20.79±2.55c | 12.93±1.58 |
The SOD, MDA and T-AOC levels in rat retinal tissues
were compared (Table IV). The
activity of SOD in the DM and LP groups was significantly lower
than that in the NC group (P<0.01), but the MDA content was
significantly higher than that in the NC group (P<0.01); the
activity of SOD in the LP and HP groups was significantly higher
than in the DM group (P<0.01) but the MDA level was
significantly lower than in the DM group. There was no significant
difference between the HP group and the NC group (P>0.05). The
T-AOC in retina tissues in the DM group was significantly lower
than that in the NC group (P<0.01). Retinal T-AOC was
significantly higher in the HP group than in the DM group
(P<0.05), while the effect of low-dose puerarin did not achieve
statistical significance.
| Table IV.Comparison of SOD, MDA and T-AOC
levels in rat retinal tissues (mean ± SD). |
Table IV.
Comparison of SOD, MDA and T-AOC
levels in rat retinal tissues (mean ± SD).
| Group | SOD (U/mg) | MDA(µmol/g) | T-AOC (U/mg) |
|---|
| NC | 159.20±13.27 | 5.57±0.66 | 2.46±0.41 |
| DM |
117.36±14.13a |
9.20±1.00a |
1.82±0.33a |
| LP |
135.78±12.08a,c |
7.61±0.87a,c | 1.95±0.37 |
| HP |
147.60±13.46c |
6.43±1.12c |
2.29±0.32b |
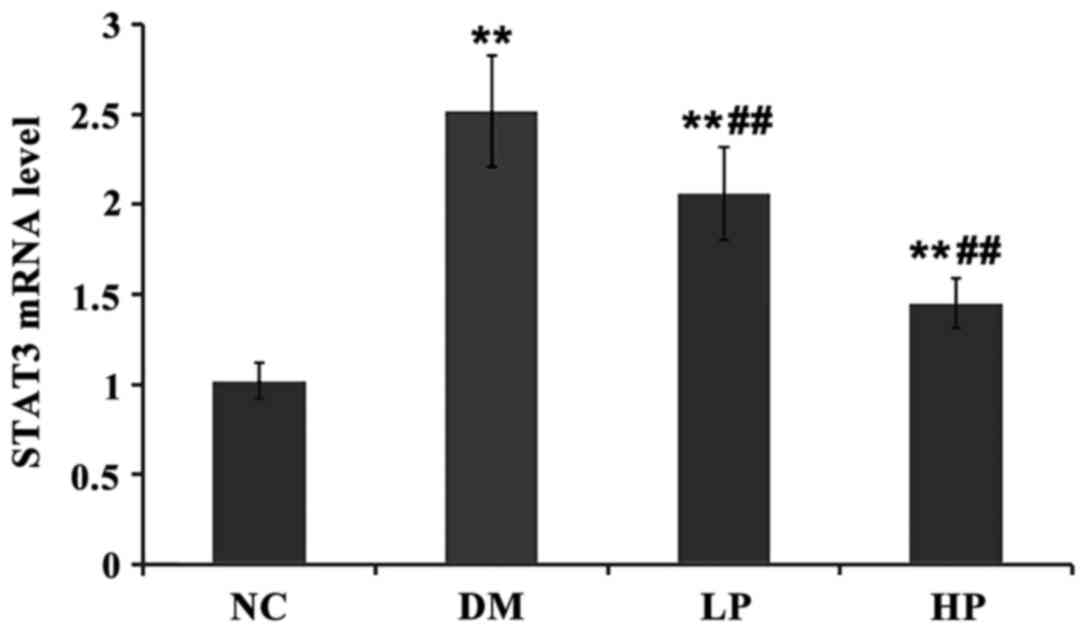
The level of STAT3 mRNA in rat retinal tissue
between groups was compared (Fig.
3). Compared with the NC group, STAT3 mRNA levels in the DM, LP
and HP groups were significantly higher (P<0.01). Compared with
the DM group, STAT3 mRNA levels in the LP and HP groups were
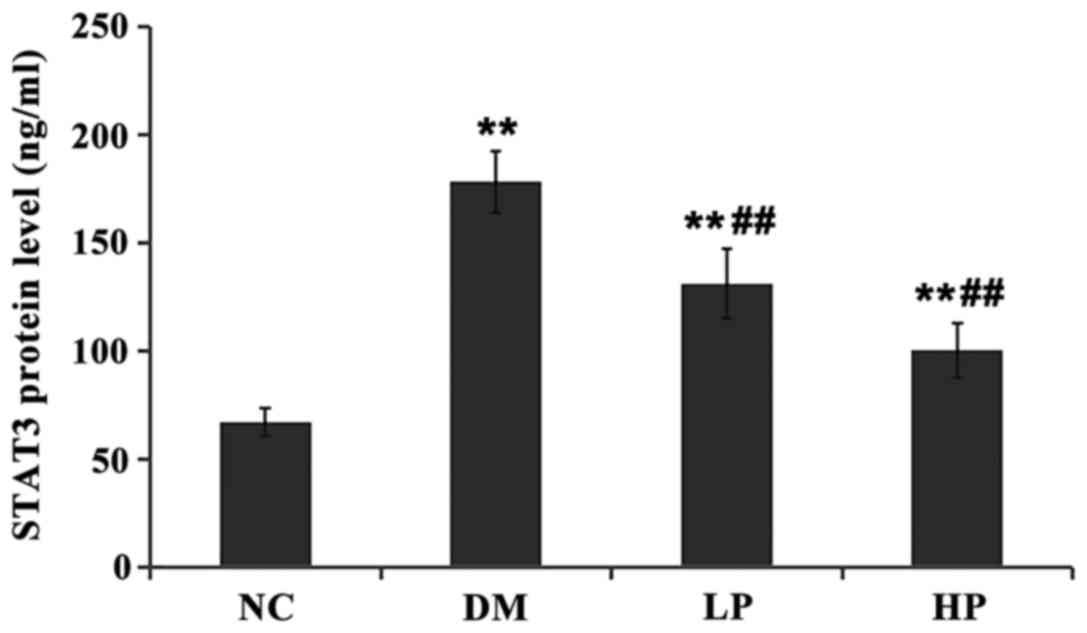
significantly lower (P<0.01). The protein level of STAT3 in rat
retinal tissue was compared (Fig.
4). Compared with the control group, the STAT3 protein levels
in the DM, LP and HP groups were significantly higher
(P<0.01).
Discussion
As the incidence of type 2 diabetes continues to
increase, so does the complication of DR. Due to an abnormal
sustained high serum glucose state, a proliferation in both
vascular smooth muscle cells and endothelial cells occurs, along
with an increase in vascular permeability. The high glucose state
also activates the body's stress and inflammatory responses that
can further cause ganglion cell damage and apoptosis (14,15). DR,
as a complication from diabetes, is a small vessel disease. The
current understanding of the pathogenesis of DR is due to a large
number of glycosylated products deposited in the retinal
capillaries, basement membrane and peripheral cells, that cause
retinal inflammation and oxidative stress response, resulting in
platelets chemotaxis. Leukocytes and platelet aggregation occurs in
the retinal localized vessels, eventually leading to retinal
vascular occlusion (16). Subsequent
inflammation and oxidative stress are key to the occurrence and
development of DR (17). The
sustained high serum glucose state can inhibit the antioxidant
system in vivo, causing the antioxidant enzymes to
glycosylate, antioxidant enzyme (e.g. catalase, SOD) activity to
decrease resulting in a weakened system for of free radical
scavenging (18). This study also
confirmed that the serum and retinal tissue of DM rats showed lower
SOD and T-AOC levels, lipid peroxidation product (MDA) accumulation
and severe oxidative stress in the body.
Its mechanism puerarin in the modulation of diabetes
and DR includes a hypoglycemic effect, improvement of insulin
resistance, decreased oxidative stress, promotion of retinal
microcirculation, improvement of blood rheology, inhibition of
platelet aggregation, and reduction in plasma viscosity, thereby
inhibiting thrombosis (19).
Concurrently, puerarin can improve the microcirculation in retinal
tissue, reduce the expression of inflammatory mediators during
retinal damage, and, therefore, protect the retina ultrastructure
(8,20). Chen et al (21) found that puerarin can increase the
activity of SOD in serum and retinal tissue of DM rats, increase
the levels of glutathione peroxidase, catalase and nitric oxide,
decrease the level of MDA in DM rats, and improve the animals
antioxidant capacity. Results from this investigation, also
observed that puerarin can reduce blood glucose in DM rats,
increase insulin levels, increase serum and retinal SOD activity in
DM rats, improve retinal T-AOC content, and reduce MDA in serum and
retinal tissue (more so with the higher dose used). These results
suggest that puerarin can enhance the antioxidant capacity of the
retina, and thus play a protective role for visual function.
The electroretinogram b-wave originates from the
outer layer of the retina, and its changes can reflect the
functional status of the retinal neurons downstream from the
retinal ganglion (22). An animal
study found that (22), using the
STZ-induced DM rat model, b-wave amplitude started decreasing 2
weeks after modeling. Results from this investigation also observed
that 4 weeks after the modeling, DM rats showed a significant
decrease in b-wave amplitude, indicating early retinal nerve cell
damage. After puerarin intervention, the amplitude of retinal
b-wave was significantly higher than that of DM group, suggesting
that puerarin had a protective effect on the retinal neurons.
STAT3 is a DNA-binding cytoplasmic transcription
factor that is involved in nuclear translocation phosphorylation,
and is widely expressed in the retina and other tissues (23). STAT3 is activated by dimerization or
targeted phosphorylation, and then participates in signaling
pathways such as the JAK/STAT signaling pathway (23) which is involved in a series of
biological functional roles (6).
STAT3 is also involved in the occurrence and development of DR.
Joussen et al (24) found
that in early DM rat retina, STAT3 increased after the first day,
reached the peak after 1 week and decreased gradually in following
weeks. One explanation that DR causes visual impairment is that due
to the increase in retinal capillary permeability, which leads to
inflammation and retinal edema, ultimately causing visual
impairment. In this process, vascular endothelial growth factor
plays a key role (25). That study
found that under high glucose toxicity, activity of reactive oxygen
species are increased, causing phosphorylation of retinal capillary
endothelial cells in JAK2/STAT3, thereby increasing the expression
of vascular endothelial growth factor. By inhibiting the
phosphorylation of JAK2/STAT3, the expression of vascular
endothelial growth factor can be reduced, thereby preventing the
occurrence of DR (26). Results from
this investigation found that STAT3 in DM rats was significantly
higher than in normal rats, and puerarin can effectively inhibit
the expression of STAT3, and play a role in reducing DR. The
mechanism of the effect is hypothesized to be due to inhibition of
the phosphorylation of JAK2/STAT3, thereby reducing the expression
of vascular endothelial growth factor and the inflammation of the
retina, and that results in preventing the occurrence of DR.
In summary, puerarin can decrease the blood glucose
of DM rats, increase the level of insulin, increase the activity of
SOD in serum and retina of DM rats, increase the content of T-AOC
in the retina, decrease the content of MDA in the serum and retina,
and therefore enhance the antioxidant ability of the retina.
Concurrently, puerarin can significantly inhibit the expression of
STAT3, and play a role in reducing DR. The occurrence of DR
involves a variety of factors and complex regulatory mechanisms,
which include the role of inflammatory cytokines, and the details
of the specific cell signaling pathways require further
investigation. Controlled clinical trials are needed to determine
if these effects from puerarin in the animal model translate to
comparable results in diabetic patients.
Acknowledgements
The present study was supported by the Wenzhou
Science and Technology Planning Project in the Public Interest
(Y20150372).
References
|
1
|
Frank RN: Diabetic retinopathy. N Engl J
Med. 350:48–58. 2004. View Article : Google Scholar : PubMed/NCBI
|
|
2
|
Wang FH, Liang YB, Zhang F, Wang JJ, Wei
WB, Tao QS, Sun LP, Friedman DS, Wang NL and Wong TY: Prevalence of
diabetic retinopathy in rural China: The Handan Eye Study.
Ophthalmology. 116:461–467. 2009. View Article : Google Scholar : PubMed/NCBI
|
|
3
|
Kempen JH, OColmain BJ, Leske MC, Haffner
SM, Klein R, Moss SE, Taylor HR and Hamman RF: Eye Diseases
Prevalence Research Group: The prevalence of diabetic retinopathy
among adults in the United States. Arch Ophthalmol. 122:552–563.
2004. View Article : Google Scholar : PubMed/NCBI
|
|
4
|
Roy MS, Klein R, OColmain BJ, Klein BEK,
Moss SE and Kempen JH: The prevalence of diabetic retinopathy among
adult type 1 diabetic persons in the United States. Arch
Ophthalmol. 122:546–551. 2004. View Article : Google Scholar : PubMed/NCBI
|
|
5
|
Arden GB and Sivaprasad S: The
pathogenesis of early retinal changes of diabetic retinopathy. Doc
Ophthalmol. 124:15–26. 2012. View Article : Google Scholar : PubMed/NCBI
|
|
6
|
Zhong Z, Wen Z and Darnell JE Jr: Stat3: A
STAT family member activated by tyrosine phosphorylation in
response to epidermal growth factor and interleukin-6. Science.
264:95–98. 1994. View Article : Google Scholar : PubMed/NCBI
|
|
7
|
Chistiakov DA: Diabetic retinopathy:
Pathogenic mechanisms and current treatments. Diabetes Metab Syndr.
5:165–172. 2011. View Article : Google Scholar : PubMed/NCBI
|
|
8
|
Chang Y, Hsieh CY, Peng ZA, Yen TL, Hsiao
G, Chou DS, Chen CM and Sheu JR: Neuroprotective mechanisms of
puerarin in middle cerebral artery occlusion-induced brain
infarction in rats. J Biomed Sci. 16:92009. View Article : Google Scholar : PubMed/NCBI
|
|
9
|
Wang N, Zhang Y, Wu L, Wang Y, Cao Y, He
L, Li X and Zhao J: Puerarin protected the brain from cerebral
ischemia injury via astrocyte apoptosis inhibition.
Neuropharmacology. 79:282–289. 2014. View Article : Google Scholar : PubMed/NCBI
|
|
10
|
Wang X, Li S, Li J, Li C and Zhang Y: De
novo transcriptome sequencing in Pueraria lobata to identify
putative genes involved in isoflavones biosynthesis. Plant Cell
Rep. 34:733–743. 2015. View Article : Google Scholar : PubMed/NCBI
|
|
11
|
She S, Liu W, Li T and Hong Y: Effects of
puerarin in STZ-induced diabetic rats by oxidative stress and the
TGF-β1/Smad2 pathway. Food Funct. 5:944–950. 2014. View Article : Google Scholar : PubMed/NCBI
|
|
12
|
Zhong Y, Zhang X, Cai X, Wang K, Chen Y
and Deng Y: Puerarin attenuated early diabetic kidney injury
through down-regulation of matrix metalloproteinase 9 in
streptozotocin-induced diabetic rats. PLoS One. 9:e856902014.
View Article : Google Scholar : PubMed/NCBI
|
|
13
|
Mao CP and Gu ZL: Experimental effect of
puerarin on the formation of advanced glycation end products and
expression of RAGE in the arota or diabetic rats. Chin Pharm
Bulletin. 20:393–397. 2005.
|
|
14
|
Hampton BM, Schwartz SG, Brantley MA Jr
and Flynn HW Jr: Update on genetics and diabetic retinopathy. Clin
Ophthalmol. 9:2175–2193. 2015.PubMed/NCBI
|
|
15
|
Kovacs K, Marra KV, Yu G, Wagley S, Ma J,
Teague GC, Nandakumar N, Lashkari K and Arroyo JG: Angiogenic and
inflammatory vitreous biomarkers associated with increasing levels
of retinal ischemia. Invest Ophthalmol Vis Sci. 56:6523–6530. 2015.
View Article : Google Scholar : PubMed/NCBI
|
|
16
|
Chen Y: The pathologic mechanism of
diabetic retinopathy. Int J Ophthalmol. 6:433–435. 2006.
|
|
17
|
Du XL, Edelstein D, Rossetti L, Fantus IG,
Goldberg H, Ziyadeh F, Wu J and Brownlee M: Hyperglycemia-induced
mitochondrial superoxide overproduction activates the hexosamine
pathway and induces plasminogen activator inhibitor-1 expression by
increasing Sp1 glycosylation. Proc Natl Acad Sci USA. 97:pp.
12222–12226. 2000, View Article : Google Scholar : PubMed/NCBI
|
|
18
|
Maritim AC, Sanders RA and Watkins JB III:
Diabetes, oxidative stress, and antioxidants: A review. J Biochem
Mol Toxicol. 17:24–38. 2003. View Article : Google Scholar : PubMed/NCBI
|
|
19
|
Wu K, Liang T, Duan X, Xu L, Zhang K and
Li R: Anti-diabetic effects of puerarin, isolated from Pueraria
lobata (Willd.), on streptozotocin-diabetogenic mice through
promoting insulin expression and ameliorating metabolic function.
Food Chem Toxicol. 60:341–347. 2013. View Article : Google Scholar : PubMed/NCBI
|
|
20
|
Li JC, Jiang YX, Zhang SY, Wang L, Ouyang
YS and Qi ZH: Evaluation of renal artery stenosis with hemodynamic
parameters of Doppler sonography. J Vasc Surg. 48:323–328. 2008.
View Article : Google Scholar : PubMed/NCBI
|
|
21
|
Chen F, Zhang HQ, Zhu J, Liu KY, Cheng H,
Li GL, Xu S, Lv WH and Xie ZG: Puerarin enhances superoxide
dismutase activity and inhibits RAGE and VEGF expression in retinas
of STZ-induced early diabetic rats. Asian Pac J Trop Med.
5:891–896. 2012. View Article : Google Scholar : PubMed/NCBI
|
|
22
|
Li Q, Zemel E, Miller B and Perlman I:
Early retinal damage in experimental diabetes:
Electroretinographical and morphological observations. Exp Eye Res.
74:615–625. 2002. View Article : Google Scholar : PubMed/NCBI
|
|
23
|
Calò V, Migliavacca M, Bazan V, Macaluso
M, Buscemi M, Gebbia N and Russo A: STAT proteins: From normal
control of cellular events to tumorigenesis. J Cell Physiol.
197:157–168. 2003. View Article : Google Scholar : PubMed/NCBI
|
|
24
|
Joussen AM, Huang S, Poulaki V, Camphausen
K, Beecken WD, Kirchhof B and Adamis AP: In vivo retinal gene
expression in early diabetes. Invest Ophthalmol Vis Sci.
42:3047–3057. 2001.PubMed/NCBI
|
|
25
|
Caldwell RB, Bartoli M, Behzadian MA,
El-Remessy AE, Al-Shabrawey M, Platt DH, Liou GI and Caldwell RW:
Vascular endothelial growth factor and diabetic retinopathy: Role
of oxidative stress. Curr Drug Targets. 6:511–524. 2005. View Article : Google Scholar : PubMed/NCBI
|
|
26
|
Ushio-Fukai M, Tang Y, Fukai T, Dikalov
SI, Ma Y, Fujimoto M, Quinn MT, Pagano PJ, Johnson C and Alexander
RW: Novel role of gp91(phox)-containing NAD(P)H oxidase in vascular
endothelial growth factor-induced signaling and angiogenesis. Circ
Res. 91:1160–1167. 2002. View Article : Google Scholar : PubMed/NCBI
|