Introduction
Ankylosing spondylitis (AS) is an immune-mediated
arthritis and is the prototypic member of a group of conditions
known as spondyloarthropathies, which also includes reactive
arthritis, psoriatic arthritis and enteropathic arthritis (1). Several features, such as synovitis,
chondroid metaplasia, cartilage destruction and subchondral bone
marrow changes, are commonly observed in the joints of patients
with AS (2). Due to the complex
progression of the joint remodeling process, clinical research has
not systematically evaluated histopathological changes (3), and no clear sequence of the
pathological mechanism has been obtained for this disease.
With the development of high throughput technology
and gene data analysis over the past decade, rapid progress has
been made in the discovery of genetic associations with AS, which
has provided novel insights on the aetiopathogenesis of the disease
(4). It had been demonstrated that
~90% of patients with AS expressed the human leukocyte antigen-B27
genotype (5). A study by Lin et
al (6) investigated the
pathophysiological significance of interleukin-27 and vascular
endothelial growth factor in AS. In addition, the Wnt pathway was
revealed to have a critical contributing role in the unique
pathology and bony fusion in AS (7).
However, these studies did not identify an effective clinical
target therapy or the underlying molecular mechanism of AS.
Therefore, the aim of the present study was to
identify differential modules between AS and healthy controls by
integrating network analysis, module inference and the attract
method, and provide insights on the pathological mechanism and
future studies of AS. Here, network analysis may provide
significant instructions for mining unknown connections in
incomplete networks. Although the data of large-scale protein
interactions continue to accumulate, a certain number of
significant interactions are not tested (8). This type of difficulty may be resolved
to some extent by utilizing sub-network or module inferences of the
complex network (9). Meanwhile,
attract is a knowledge-driven analytical approach for identifying
and annotating the gene sets that best discriminate between cell
phenotypes (10), and thus the
present study utilized this to identify differential modules
between the AS and healthy groups.
Materials and methods
Identification of differential modules
between AS patients and healthy controls
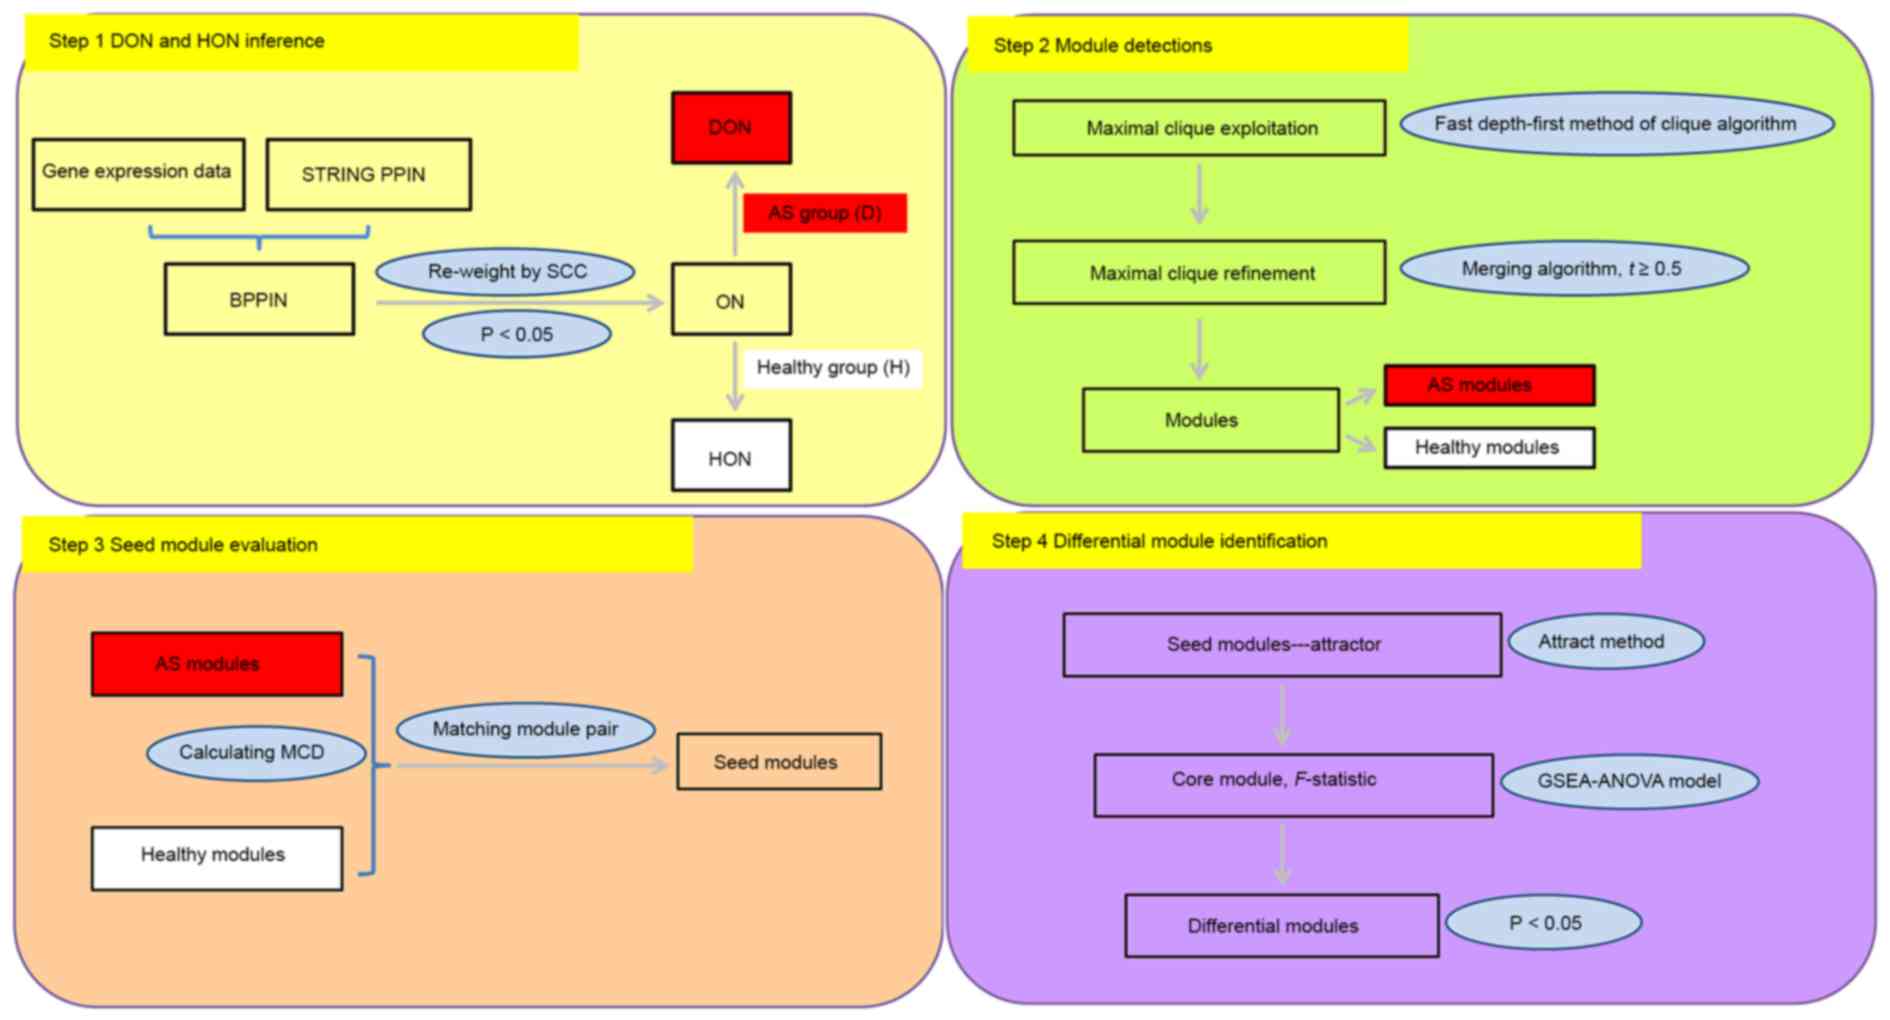
The identification of differential modules between
AS patients and healthy controls comprised four steps (Fig. 1): Disease objective network (DON) and
healthy objective network (HON) inference dependent on gene
expression data using the Search Tool for the Retrieval of
Interacting Genes/Proteins (STRING, https://string-db.org/), the protein-protein
interaction network (PPIN) and Spearman's correlation coefficient
(SCC); module detection by using the clique-merging algorithm; seed
module evaluation through module correlation density (MCD)
calculation and module pair match; and differential module
identification based on the attract method.
DON and HON inference
Gene expression data
Gene expression data of E-GEOD-25101 for AS patients
and healthy controls was recruited from the ArrayExpress database
(https://www.ebi.ac.uk/arrayexpress/).
E-GEOD-25101 consisted of 16 AS samples and 16 healthy samples in
total, and was presented on an A-MEXP-1171-Illumina HumanHT-12 v.
3.0 Expression BeadChip Platform (Illumina, Inc., San Diego, CA,
USA). Subsequently, the following standard procedures were
conducted to control the quality of the data: Background correction
based on the Robust Multi-array Average (RMA) algorithm (11); normalization according to the
quantile based algorithm (12);
probe correction by the Micro Array Suite (MAS) algorithm (13); and expression summarization using the
median polish method (11). By
converting the preprocessed data on probe level into gene symbol
measures, a total of 11,587 genes were obtained in the gene
expression data for further exploitation.
Background protein-protein interaction
network (BPPIN) extraction
A dataset of literature-curated human PPIN from the
STRING database was utilized, comprising 16,730 genes and 1,048,576
interactions (14). Genes or
interactions without an expression value or duplicated self-loops
were removed. The remaining largest connected component with a
score >0.8 was kept as the global PPIN, which was composed of
5,665 nodes and 28,176 edges. To make the global PPIN more
confident and reliable, intersections between the global PPIN and
gene expression data were taken, and the intersected network was
termed BPPIN.
DON and HON construction
For the purpose of re-weighting gene interactions in
the BPPIN of the AS and healthy conditions, SCC was implemented
(15). SCC is a measure of the
correlation between two variables, giving a value between −1 and
+1, inclusive. The SCC (x, y) was calculated using the
following formula:
SCC(x,y)=1n-1∑i=1n(g(x,i)-g¯(x)σ(x))·(g(y,i)-g¯(y)σ(y))
Where n was the number of samples of the gene
expression data; g (x, i) or g (y, i)
was the expression level of gene x or y in the sample
i under a specific condition; and g(x) or
g(y) represented the mean expression level of gene
x or y.
If SCC (x, y) had a positive value,
there was a positive linear correlation between x and
y. For an interaction between gene x and y,
the absolute SCC value was denoted as its weight value. Only the
interactions with P<0.05 were selected to construct the
objective network. DON was for disease (AS group) and HON was for
the healthy group.
Module detection
Identifying modules from DON and HON for the disease
and healthy groups was conducted using the clique-merging algorithm
(16,17). This process predominantly included
two steps: Exploring maximal cliques using the clique algorithm and
refining or merging maximal cliques with high overlap.
Maximal clique exploration
The cliques algorithm proposed by Tomita et
al (18) was applied to search
maximal cliques. It utilized a depth-first search strategy to
enumerate all maximal cliques and effectively removed non-maximal
cliques during the enumeration process. The score of a clique,
C, was defined as its weighted interaction density
(WID):
WID(C)=∑x∈C,y∈Cw(x,y)|C|*(|C|-1)
Where w (x, y) represented the weight
of the interaction between gene x and y. Due to
cliques with a too small or large number of genes was difficult and
meaningless to study; therefore, cliques with node amount <4
were discarded (19). Furthermore,
maximal cliques were obtained by ranking the cliques on the basis
of WID in descending order.
Maximal clique refinement
Various maximal cliques may overlap with one another
as thousands of them were generated from a DON or HON. The highly
overlapped maximal cliques must be merged to reduce the result
size. For every clique Ci, it was checked whether
another clique Cj existed such that
Cj had a lower score than Ci
and
|Ci∩Cj|/|Cj|
≥t, where t=0.5 was a predefined threshold for
overlapping (20). If such
Cj existed, the inter-connectivity scores between
Ci and Cj were used to decide
whether to remove Cj or merge
Cj with Ci. The refined maximal
cliques were denoted as modules. Notably, modules were identified
based on DON and HON for the disease group and healthy group,
respectively.
Seed module evaluation
In the present study, AS and healthy modules were
matched, which ensured that the module pairs had the same or
similar gene composition but different interactions. The Jaccard
index (21), which is the ratio of
intersection over union for two sets, was applied to evaluate the
matching degree. The modules with Jaccard score ≥0.5 were
considered to be seed modules.
Meanwhile, the set of disease modules was expressed
as Di, and Hj was used for the
healthy module set. In order to further evaluate the relationships
among seed modules, MCD was utilized. For disease module set
Di, MCD was computed according to following
equation:
MCD(Si)=∑x,y∈siSCC((x,y),M)|Si|*(|Si|-1)
Of which M was a similarity graph to perform
a maximum weight bipartite matching (22). MCD of healthy modules,
MCD(Hj), was calculated similarly. The modules
were ranked in non-increasing order of their absolute differential
density, ∆C =
|MCD(Dj)-MCD(Hj)|.
Differential module identification
using the attract method
To identify altered modules between AS patients and
healthy controls more accurately than seed modules, differential
modules were identified utilizing the attract method, which is a
knowledge-driven analytical approach for identifying and annotating
gene sets (10). The method may be
summarized in four steps (23):
Determining core modules that discriminated most strongly between
cell types or experimental groups of interest; finding different
synexpression groups that were present within a core attractor
module; identifying sets of genes that demonstrated highly similar
profiles to the synexpression groups within an attractor module;
and testing for functional enrichment for each of the synexpression
groups to detect any potentially shared modules.
In the present study, each seed module was regarded
to an attractor. Based on the attract method, a gene set enrichment
analysis-analysis of variance (GSEA-ANOVA) model was utilized to
assess module level data and investigate differential modules
between the AS group and healthy group. The core module was
identified through the F-statistic, for gene x,
F(x) was computed as follows:
F(x)=1K-1∑k=1Krk[u·k(x)-u··(x)]21N-K∑k=1K∑v=1rv[uvk(x)-u··(x)]2
Where v represented the corresponding
expression value in each replicate sample; rk
represented each cell type k = 1, …, K; u
represented the mixed effect model; and N represented the
total number of samples. Large values of the F-statistic
indicated a strong association, whereas a small F-statistic
suggested that the gene demonstrated minimal cell type-specific
expression changes. To make the F-statistic more reliable,
t-tests were used to correct the log2-transformed
F-statistics and obtain P-values for each potentially shared
module that originated from synexpression groups. By adjusting
their P-values on the basis of false discovery rate (24), the modules with P<0.05 were
defined as differential modules between AS and controls.
Results
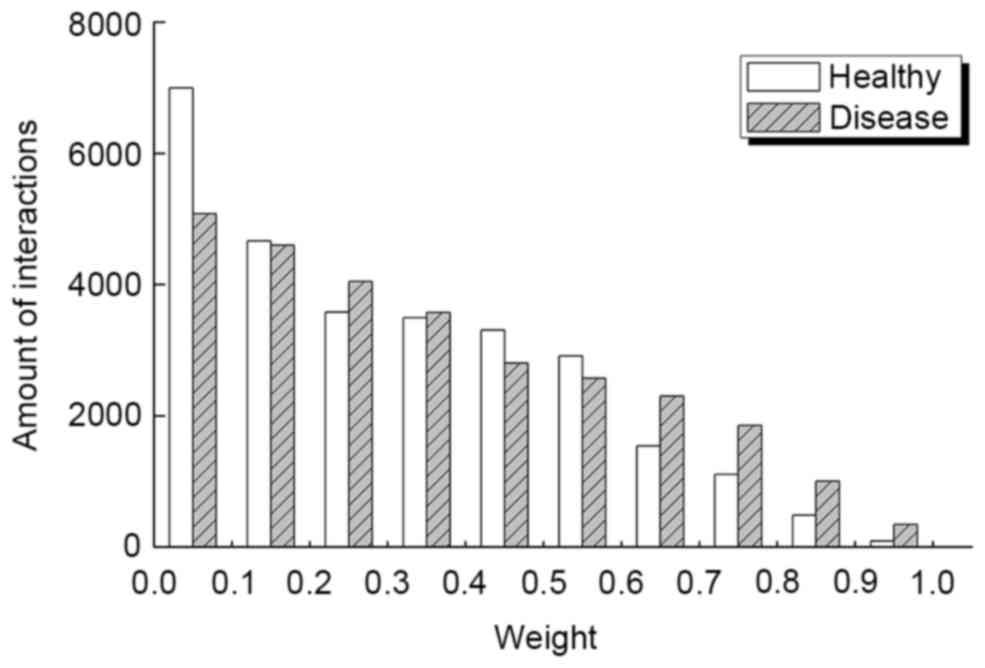
DON and HON
By integrating gene expression data, STRING PPIN
and SCC-related analysis, the DON and HON that displayed an equal
number of nodes (5,301) and interactions (28,176) for the disease
group and healthy group were identified. However, the weight
distributions for the two networks were different, as demonstrated
in Fig. 2. Results indicated that
there were marked differences between the healthy and disease
groups in the section of 0–0.1 and 0.6–1.0. When examining these
interactions more carefully, the average weight for DON and HON was
0.332 and 0.317, respectively.
Module detections
In the present study, a clique-merging algorithm
was implemented to identify modules from DON and HON separately. A
total of 4,601 and 4,841 maximal cliques were detected for the
disease group and healthy group, respectively, based on the fast
depth-first method of the clique algorithm. With the thresholds of
node amount> 4, 677 disease maximal cliques and 910 healthy
maximal cliques were obtained. Subsequently, these cliques were
refined by merging algorithm with t≥0.5 to form modules. A
total of 21 modules were gained for the disease group, while 20
modules were identified for the healthy group. The compositions for
modules were demonstrated in Tables
I (disease group) and II
(healthy group).
 | Table I.Module properties of disease
group. |
Table I.
Module properties of disease
group.
| Module | Count | Genes |
|---|
| 1 | 9 | RPL35, RPS13,
EEF1B2, RPS5, RPL6, RPL18A, RPL19, RPL27, RPLP0 |
| 2 | 12 | RPL35, RPS13,
RPS20, RPL6, RPS5, RPS19, RPL18A, RPS16, RPL27, RPL36, EIF3K,
RPS6 |
| 3 | 5 | RPL35, RSL24D1,
EEF1B2, EIF3E, RPL30 |
| 4 | 8 | PSMA4, PSMA2,
PSMA3, PSMA6, PSMD5, PSMD10, RBX1, PSME3 |
| 5 | 5 | NDUFAB1,
NDUFAB3, NDUFB2, NDUFB5, NDUFA4 |
| 6 | 8 | RPL35, RPS13,
SRP54, SEC61B, RPL36, RPN2, RPS19, RPL23 |
| 7 | 5 | SF3A1, FUS,
SRSF9, SRSF1, SNRPG |
| 8 | 5 | PSMA2, SHFM1,
PSMA6, PSMB1, PSMD1 |
| 9 | 8 | RPL35, RPS13,
TRAM1, SEC61B, SPCS1, RPL36, RPL27, SRPR |
| 10 | 6 | PSMD10, PSMA2,
PSMD11, PSMA6, SEC61B, PSMD1 |
| 11 | 8 | PSMA4, PSMA2,
PSMA3, PSMC4, PSMD5, PSMB1, SEC61B, UBC |
| 12 | 8 | EIF3D, RPL18A,
EIF3G, EIF3E, EIF3K, RPL36, RPS19, RPL5 |
| 13 | 5 | SNRNP70, SF3B6,
FUS, SUGP1, SRSF4 |
| 14 | 6 | PSMA3, PSMA2,
PSMA6, CCND1, CDKN1B, PSMD1 |
| 15 | 5 | AURKA, NUSAP1,
NCAPG, GINS2, CCNB2 |
| 16 | 5 | RBX1, SKP1,
SARS2, FBXO44, FBXL3 |
| 17 | 6 | PSMD8, PSMD10,
PSMA2, PSMC3, CDKN1B, SKP1 |
| 18 | 5 | POLR2I, SF3B6,
FUS, SRSF1, YBX1 |
| 19 | 6 | EIF3D, RPL18A,
EIF3G, RPL18, EIF4B, RPS3 |
| 20 | 5 | ARHGAP4, RHOQ,
RAC2, ARAP3, ARHGEF2 |
| 21 | 5 | CEBPZ, WDR12,
NIP7, RSL24D1, BRIX1 |
| Table II.Module properties of healthy
group. |
Table II.
Module properties of healthy
group.
| Module | Count | Genes |
|---|
| 1 | 5 | RPL35, RSL24D1,
EIF3E, EEF1B2, RPL11 |
| 2 | 5 | CEBPZ, WDR12,
NIP7, RSL24D1, BRIX1 |
| 3 | 8 | RPL35, RPL6,
EEF1B2, RPS13, RPS5, RPL18A, EIF3E, RPL4 |
| 4 | 7 | PSMA4, PSMA6,
PSMB1, PSMA2, PSMB7, RBX1, ANAPC10 |
| 5 | 6 | RPL35, RPL6,
RPL8, EIF3D, EIF3E, RPL31 |
| 6 | 10 | RPL35, RPL6,
RPL8, RPS16, RPL18A, RPS5, EIF3K, EIF3E, RPL18, RPL12 |
| 7 | 6 | PSMD10, PSMA2,
PSMA6, PSMB1, SHFM1, PSMC6 |
| 8 | 5 | NDUFAB1, NDUFB2,
NDUFB5, NDUFB3, NDUFA4 |
| 9 | 7 | RPL35, RPL6,
RPL8, RPL39, RPS13, RPL27, RPS20 |
| 10 | 6 | RPL19, RPS16,
RPS5, RPL18A, RPL36, RPS6 |
| 11 | 6 | PSMD10, PSMA2,
CDKN1B, SKP1, PSMD11, PSMC6 |
| 12 | 6 | AAAS, NUP37,
NUP107, NUPL2, SRSF1, UPF3B |
| 13 | 5 | SSR1, RPS20,
TRAM1, RPL27, RPL9 |
| 14 | 6 | RPL35, RPL6,
TRAM1, RPS20, SEC61B, RPL4 |
| 15 | 8 | PSMA4, PSMA6,
PSMB1, PSMA2, PSMD10, PSMA3, SEC61B, PSMC2 |
| 16 | 8 | RPL35, RPS14,
RPS5, RPS16, RPL8, RPS13, RPS20, RPL36 |
| 17 | 5 | RPS19, RPL18A,
RPL19, RPS12, RPS11 |
| 18 | 5 | RPS19, RPL18A,
RPL19, RPS12, RPS11 |
| 19 | 6 | RBX1, PSMD3,
PSMB1, PSMD10, PSMA2, SKP1 |
| 20 | 5 | SF3B6, SRSF1,
SNRPB2, SUGP1, SNRNP200 |
Seed module evaluation
A seed module was defined as the modules between
two groups with a Jaccard score ≥0.5. Based on this, six seed
modules were obtained (Table III).
To further explore the correlations of the seed modules across the
AS and normal groups, MCD and differential density ΔC was
computed. Seed module 1 had the highest ΔC of 0.077 and
Jaccard score of 1.000, followed by seed module 2 (ΔC=0.056;
Jaccard score=0.667), seed module 3 (ΔC=0.024; Jaccard
score=0.500), seed module 4 (ΔC=0.017; Jaccard score=0.572),
seed module 5 (ΔC=0.016; Jaccard score=0.545) and seed
module 3 (ΔC=0.007; Jaccard score=1.000). Seed module 1 was
composed of six genes, including CEBPZ, WDR12, NIP7, RSL24D1
and BRIX1, and seed module 6 included NDUFAB1, NDUFAB3,
NDUFB2, NDUFB5 and NDUFA4.
| Table III.Properties of seed modules. |
Table III.
Properties of seed modules.
|
| Module |
| MCD |
|
|---|
|
|
|
|
|
|
|---|
| Seed module | Disease | Healthy | Jaccard score | Healthy | Disease | ∆C |
|---|
| 1 | 21 | 2 | 1.000 | 0.402 | 0.325 | 0.077 |
| 2 | 3 | 1 | 0.667 | 0.449 | 0.393 | 0.056 |
| 3 | 17 | 11 | 0.500 | 0.368 | 0.345 | 0.024 |
| 4 | 8 | 7 | 0.572 | 0.386 | 0.369 | 0.017 |
| 5 | 1 | 3 | 0.545 | 0.400 | 0.416 | 0.016 |
| 6 | 5 | 8 | 1.000 | 0.382 | 0.375 | 0.007 |
Differential modules
To further investigate significant modules based on
seed modules for AS, a GSEA-ANOVA model in the attract method was
employed, which also provided a way to gauge which genes were
informative for a particular set of cell types. Unlike other GSEA
implementations that only allow for two-class comparisons, this
ANOVA-based approach tests for differences between multiple classes
(24). Supposing that each seed
module was an attractor, the differential modules were identified
by combining the core module identified through the
F-statistic and P<0.05, of which the F-statistic
captured the strength of the association observed in a gene's
expression over the different groups and P evaluated the
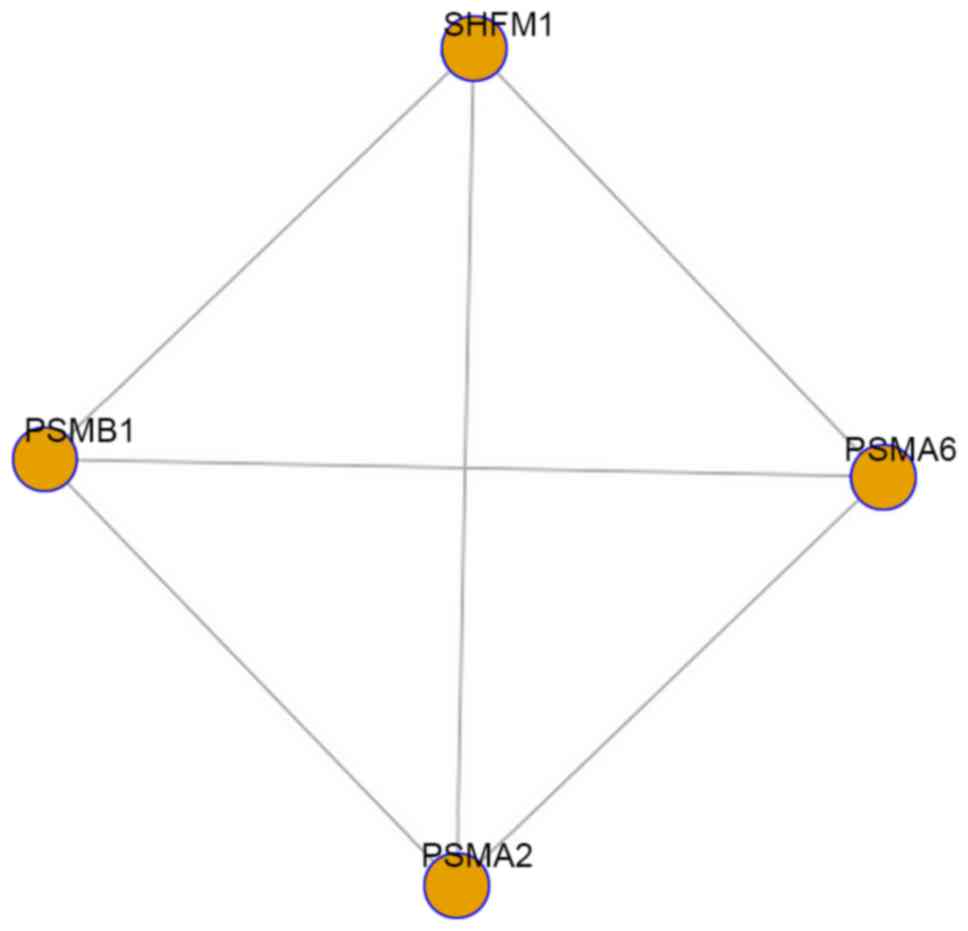
significant difference across the two groups. In the present study,
a total of one differential module (P=0.015) was obtained between
the AS and healthy groups, which was composed of four nodes
(PSMA2, SHFM1, PSMA6 and PSMB1) and six edges
(Fig. 3). The differential module
and its composite genes may have a more significant role than the
other modules and genes in the progression of AS and be potential
biomarkers for targeted treatment for patients with AS.
Discussion
In the present study, firstly, the DON and HON from
the BPPIN of the AS and healthy conditions based on gene expression
data, STRING PPIN and SCC, respectively, were extracted. There were
5,301 nodes and 28,176 interactions both in DON and HON; however,
the weight distribution of the two networks was different.
Secondly, disease and healthy modules were detected from the DON
and HON utilizing a clique-merging algorithm. A total of 20 and 21
modules were detected for the AS group and healthy group
separately, respectively. Thirdly, seed modules were identified on
the basis of a Jaccard score ≥0.5, and six seed modules were
obtained. The seed modules were ranked in descending order of
ΔC, and seed module 1 had the highest ΔC of 0.077 and
Jaccard score of 1.000. Finally, taking each seed module as an
attractor, differential modules were identified using a GSEA-ANOVA
model in the attract method. A total of one differential module
with P=0.015 was obtained between the AS and healthy group.
Traditionally, studies tend to regard
differentially expressed genes (DEGs) between normal and disease
samples as biomarkers and pathogenic genes; however, DEGs alone may
lead to false positives while identifying key genes involved in a
disease, as some genes are not involved in the pathway or module of
pathogenic genes even though they demonstrate notable expression
alterations (25). Studies have
indicated that the most significant genes and modules obtained from
different studies for a particular disease are typically
inconsistent (26). To overcome this
problem, one may evaluate pathogenic genes or modules for disease
association using a network strategy (27). Therefore, in the present study,
modules from DON and HON were identified, which made the results
more stable and reliable. Following this, differential modules
between the AS condition and healthy controls were identified,
which provided potential target biomarkers for patients suffering
from AS.
The differential module was composed of four nodes
(PSMA2, SHFM1, PSMA6 and PSMB1) and six edges, of
which PSMA2, PSMA6 and PSMB1 belonged to the
proteasome subunit family. Proteasomes are protein complexes in
eukaryotic cells and cleave peptides in an adenosine
5′-triphosphate-/ubiquitin-dependent process in a non-lysosomal
pathway, some of which are involved in presentation by major
histocompatibility complex class I molecules (28). Upregulation of proteins involved in
inflammation and the ubiquitin proteasome pathway have been
identified in AS (29), and may have
an important role for B27 positive individuals in the development
of AS (30). It had been
demonstrated that proteasome inhibition aggravated tumor necrosis
factor-mediated bone resorption (31). Furthermore, a study by Zhao et
al (32) reported that
PSMA6 had the potential to be a biomarker for AS by
utilizing bioinformatics approaches. Therefore, in the present
study, the proteasome family was closely associated with AS, and it
is possible to infer that the differential module had a notable
role in the progression of AS.
In conclusion, the present study identified one
differential module with four nodes (PSMA2, SHFM1, PSMA6 and
PSMB1) between AS patients and healthy controls. The present
findings may provide insight on the underlying pathological
mechanism of AS. Further study should focus on the validation of
these mechanisms.
References
|
1
|
Chen J and Liu C: Sulfasalazine for
ankylosing spondylitis. Cochrane Database Syst Rev: CD004800. 2005.
View Article : Google Scholar
|
|
2
|
Bleil J, Maier R, Hempfing A, Schlichting
U, Appel H, Sieper J and Syrbe U: Histomorphologic and
histomorphometric characteristics of zygapophyseal joint remodeling
in ankylosing spondylitis. Arthritis Rheumatol. 66:1745–1754. 2014.
View Article : Google Scholar : PubMed/NCBI
|
|
3
|
Sykes M, Doll H and Gaffney K: Comment on:
‘Diagnostic delay in patients with rheumatoid arthritis, psoriatic
arthritis and ankylosing spondylitis: Results from the Danish
nationwide DANBIO registry’ by Sørensen et al. Ann Rheum
Dis. 73:e442014. View Article : Google Scholar : PubMed/NCBI
|
|
4
|
Brown MA, Kenna T and Wordsworth BP:
Genetics of ankylosing spondylitis-insights into pathogenesis. Nat
Rev Rheumatol. 12:81–91. 2016. View Article : Google Scholar : PubMed/NCBI
|
|
5
|
Colbert RA, Tran TM and Layh-Schmitt G:
HLA-B27 misfolding and ankylosing spondylitis. Mol Immunol.
57:44–51. 2014. View Article : Google Scholar : PubMed/NCBI
|
|
6
|
Lin TT, Lu J, Qi CY, Yuan L, Li XL, Xia LP
and Shen H: Elevated serum level of IL-27 and VEGF in patients with
ankylosing spondylitis and associate with disease activity. Clin
Exp Med. 15:227–231. 2015. View Article : Google Scholar : PubMed/NCBI
|
|
7
|
Corr M: Wnt signaling in ankylosing
spondylitis. Clin Rheumatol. 33:759–762. 2014. View Article : Google Scholar : PubMed/NCBI
|
|
8
|
Nibbe RK, Chowdhury SA, Koyutürk M, Ewing
R and Chance MR: Protein-protein interaction networks and
subnetworks in the biology of disease. Wiley Interdiscip Rev Syst
Biol Med. 3:357–367. 2011. View Article : Google Scholar : PubMed/NCBI
|
|
9
|
Wu Y, Jing R, Jiang L, Jiang Y, Kuang Q,
Ye L, Yang L, Li Y and Li M: Combination use of protein-protein
interaction network topological features improves the predictive
scores of deleterious non-synonymous single-nucleotide
polymorphisms. Amino Acids. 46:2025–2035. 2014. View Article : Google Scholar : PubMed/NCBI
|
|
10
|
Mar JC, Matigian NA, Quackenbush J and
Wells CA: Attract: A method for identifying core pathways that
define cellular phenotypes. PLoS One. 6:e254452011. View Article : Google Scholar : PubMed/NCBI
|
|
11
|
Irizarry RA, Bolstad BM, Collin F, Cope
LM, Hobbs B and Speed TP: Summaries of affymetrix GeneChip probe
level data. Nucleic Acids Res. 31:e152003. View Article : Google Scholar : PubMed/NCBI
|
|
12
|
Bolstad BM, Irizarry RA, Astrand M and
Speed TP: A comparison of normalization methods for high density
oligonucleotide array data based on variance and bias.
Bioinformatics. 19:185–193. 2003. View Article : Google Scholar : PubMed/NCBI
|
|
13
|
Bolstad B: affy: Built-in processing
methods. 2013.
|
|
14
|
Jensen LJ, Kuhn M, Stark M, Chaffron S,
Creevey C, Muller J, Doerks T, Julien P, Roth A, Simonovic M, et
al: STRING 8-a global view on proteins and their functional
interactions in 630 organisms. Nucleic Acids Res. 37:(Database
Issue). D412–D416. 2009. View Article : Google Scholar : PubMed/NCBI
|
|
15
|
Szmidt E and Kacprzyk J: The spearman rank
correlation coefficient between intuitionistic fuzzy setsIEEE
international conference on intelligent systems, is 2010. 7–9–July.
2010, University of Westminster; London: pp. 276–280, 2010.
View Article : Google Scholar
|
|
16
|
Liu G, Wong L and Chua HN: Complex
discovery from weighted PPI networks. Bioinformatics. 25:1891–1897.
2009. View Article : Google Scholar : PubMed/NCBI
|
|
17
|
Srihari S and Leong HW: A survey of
computational methods for protein complex prediction from protein
interaction networks. J Bioinform Comput Biol. 11:12300022013.
View Article : Google Scholar : PubMed/NCBI
|
|
18
|
Tomita E, Tanaka A and Takahashi H: The
worst-case time complexity for generating all maximal cliques and
computational experiments. Theoretical Computer Sci. 363:28–42.
2006. View Article : Google Scholar
|
|
19
|
Sriganesh S and Ragan MA: Systematic
tracking of dysregulated modules identifies novel genes in cancer.
Bioinformatics. 29:1553–1561. 2013. View Article : Google Scholar : PubMed/NCBI
|
|
20
|
Srihari S and Ragan MA: Systematic
tracking of dysregulated modules identifies novel genes in cancer.
Bioinformatics. 29:1553–1561. 2013. View Article : Google Scholar : PubMed/NCBI
|
|
21
|
Bouchard M, Jousselme AL and Doré PE: A
proof for the positive definiteness of the Jaccard index matrix.
Int J Approximate Reasoning. 54:615–626. 2013. View Article : Google Scholar
|
|
22
|
Gabow HN: An efficient implementation of
Edmonds' algorithm for maximum matching on graphs. J ACM (JACM).
23:221–234. 1976. View Article : Google Scholar
|
|
23
|
Mar J: 2011.attract: Methods to Find the
Gene Expression Modules that Represent the Drivers of Kauffman's
Attractor Landscape. Package version 1.18.0.
|
|
24
|
Benjamini Y and Hochberg Y: Controlling
the false discovery rate: A practical and powerful approach to
multiple testing. J Royal Statistical Soc Series B
(Methodological). 10:289–300. 1995.
|
|
25
|
Göhre V and Robatzek S: Breaking the
barriers: Microbial effector molecules subvert plant immunity. Annu
Rev Phytopathol. 46:189–215. 2008. View Article : Google Scholar : PubMed/NCBI
|
|
26
|
Ein-Dor L, Kela I, Getz G, Givol D and
Domany E: Outcome signature genes in breast cancer: Is there a
unique set? Bioinformatics. 21:171–178. 2005. View Article : Google Scholar : PubMed/NCBI
|
|
27
|
Zhang L, Li S, Hao C, Hong G, Zou J, Zhang
Y, Li P and Guo Z: Extracting a few functionally reproducible
biomarkers to build robust subnetwork-based classifiers for the
diagnosis of cancer. Gene. 526:232–238. 2013. View Article : Google Scholar : PubMed/NCBI
|
|
28
|
Wu X, Zhao SH, Yu M, Zhu ZM, Wang H, Wang
HL and Li K: Physical mapping of four porcine 20S proteasome core
complex genes (PSMA1, PSMA2, PSMA3 and PSMA6). Cytogenet Genome
Res. 108:3632005. View Article : Google Scholar
|
|
29
|
Wright C, Edelmann M, diGleria K,
Kollnberger S, Kramer H, McGowan S, McHugh K, Taylor S, Kessler B
and Bowness P: Ankylosing spondylitis monocytes show upregulation
of proteins involved in inflammation and the ubiquitin proteasome
pathway. Ann Rheum Dis. 68:1626–1632. 2009. View Article : Google Scholar : PubMed/NCBI
|
|
30
|
Wang GC, Zhao MJ and Wu DH: The expression
of proteasome gene in the patients with ankylosing spondylitis.
Chin J Rheumatol. 2003.(In Chinese).
|
|
31
|
Kireva T, Polzer K, Neubert K, Meister S,
Frey B, Baum W, Distler JH, Schett G, Voll RE and Zwerina J:
Proteasome inhibition aggravates tumour necrosis factor-mediated
bone resorption. Annals Rheumatic Dis. 69:61–75. 2010. View Article : Google Scholar
|
|
32
|
Zhao H, Wang D, Fu D and Xue L: Predicting
the potential ankylosing spondylitis-related genes utilizing
bioinformatics approaches. Rheumatol Int. 35:973–979. 2015.
View Article : Google Scholar : PubMed/NCBI
|