Introduction
Diabetes is a serious public health concern
worldwide. In China, the number of adults with diabetes or
pre-diabetes (age ≥20) was 114 and 493 million in 2010,
respectively (1); type II diabetes
accounted for 90% of these cases (2). Absolute insulin deficiency, or insulin
resistance may lead to elevated blood glucose levels in patients
with diabetes (3). The
phosphoinositide-3-kinase/protein kinase B (PI3K/Akt) signaling
pathway is critical to insulin function (4). Previous studies have revealed that any
dysregulation in the expression, structure and function of proteins
in the PI3K/Akt signaling pathway disrupts insulin signal
transduction and weakens the physiological effects of insulin,
which leads to insulin resistance and metabolic disorders (5,6).
Gluconeogenesis is the process by which non-sugar precursors,
including lactic acid, glycerol and raw sugar amino acids, are
converted into glucose (7). Half of
all glucose consumed by the body and used as energy for vital
organs is produced via gluconeogenesis (8).
Gluconeogenesis primarily occurs in the liver, and
hepatic gluconeogenesis determines fasting blood glucose (FBG)
levels and serves a key role in the conservation of sugar (9). Phosphoenolpyruvate carboxykinase
(PEPCK) and glucose 6-phosphatase (G6Pase) are important
rate-limiting enzymes that regulate hepatic gluconeogenesis
(10). Forkhead box protein O1
(FoxO1) is a transcription factor that is negatively regulated by
insulin signaling and is important for the regulation of liver
metabolism (11). Liver hormones
regulate FoxO1 activity to modulate PEPCK and G6Pase gene
expression (12).
The drugs commonly used to treat type 2 diabetes are
insulin, biguanide and sulfonylureas (13). As the disease progresses, the
prolonged administration of these drugs may cause side effects,
including metabolic imbalance, gastrointestinal systemic damage,
kidney and liver damage and tumorigenesis (13). Therefore, there is an urgent need for
novel agents that improve the symptoms of diabetes and stabilize
blood sugar. Several previous studies have demonstrated that
numerous traditional Chinese medicines (TCMs), including Si-haung
Hypoglycemic Granules and Rhizoma Coptidis apozem, promote glucose
and lipid metabolism by regulating the insulin signal transduction
pathway (14,15). Previous studies have demonstrated
that dendrobium mixture (DMix) significantly alleviates the
clinical symptoms of diabetes, corrects impaired glucose tolerance
and improves insulin resistance (16,17). In
addition, all patients with diabetes who were treated with DMix
took significantly fewer western medications at a 5-year follow-up,
which suggests that this treatment may have a better efficacy than
metformin, which is the most common hyperglycemic agent of
biguanide (16,17).
In the present study, a rat model of type II
diabetes was established using a high-fat and high-sugar diet with
intraperitoneal injections of streptozotocin (STZ). The rat model
was used to investigate the molecular mechanisms by which DMix
regulates the insulin signaling pathway to inhibit gluconeogenesis
and improve sugar conservation.
Materials and methods
Research subjects
A total of 47 Specific-pathogen-free (SPF) healthy
female Wistar rats (age, 2.5 months) weighing 200±20 g were
purchased from Shanghai Laboratory Animal Center (Shanghai, China).
The animals were housed at the Experimental Animal Center at the
Fujian University of TCM (Fuzhou, China) in an SPF grade laboratory
at room temperature (25°C) with 80% relative humidity. A total of
five rats were housed per cage in a 12-h light/dark cycle with free
access to food and water. The basic animal feed and the high-fat
feed were purchased from the Experimental Animal Center at the
Fujian University of TCM. Based on a previous study (12), the high-fat feed comprised 60.7%
basic feed, 10% lard, 15% sucrose, 10% egg yolk powder, 4%
cholesterol and 0.3% cholate.
Experimental reagents
DMix (15 g dendrobium, 20 g astragalus, 8 g
schisandra, 15 g pueraria, 15 g salvia, 15 g rehmannia and 8 g
earthworms) was purchased from Guoyitang Clinic, Fujian University
of TCM. Metformin (glucophage) tablets were purchased from the
Sino-American Shanghai Squibb Pharmaceutical Co., Ltd. (Shanghai,
China), with a production specification of 0.85 g/tablet (national
medicine approval number H20023370). The other experimental
reagents included an insulin ELISA detection kit (cat no. F6403;
Westang Biotechnology Co., Ltd., Shanghai, China), a blood glucose
meter and blood glucose strips (Yuyue Medical Equipment &
Supply Co., Ltd. (Nanjing, China), TRIzol reagent (Invitrogen;
Thermo Fisher Scientific, Inc., Waltham, MA, USA), anhydrous
ethanol and isopropyl alcohol. Agarose was purchased from
Sigma-Aldrich (Merck, KGaA, Darmstadt, Germany). The following
antibodies were used: Insulin receptor (InsR, cat. no. 3025), Akt
(cat. no. 4685) and phosphorylated (p)-Akt (cat. no. 9611) (all
Cell Signaling Technology, Inc., Danvers, MA, USA), anti-β-actin
(cat. no. SAB1305567; Sigma-Aldrich; Merck KGaA), PI3K, p-PI3K,
FoxO1, PEPCK and G6pase (all Abcam, Cambridge, MA, USA). A
SYBR-Green I quantitative PCR kit (Takara Bio, Inc., Otsu, Japan)
was purchased from Thermo Fisher Scientific, Inc. and PCR primers
were produced by Invitrogen (Thermo Fisher Scientific, Inc.).
Grouping and processing
A total of 47 female Wistar rats were used. Of
these, 11 rats were fed a basic diet and made up the healthy
control group (CTR group). The remaining rats were fed a
high-fat/high-sugar diet for 6 weeks, followed by two
intraperitoneal injections of streptozotocin (STZ, 25 mg/kg) once
per day. Rats with FBG levels >7.0 mmol/l or random blood
glucose levels >16.7 mmol/l on 2 consecutive days were selected
as the diabetic models. Following stratification by body weight and
blood sugar, the 36 diabetic rats were randomly divided into three
groups of 12 as follows: The model group, the DMix group and the
metformin group (positive control). The present study was approved
by the Ethics Committee of Fujian University of TCM.
The healthy control rats were fed a basic diet and
received normal saline by gavage. The model group of diabetic rats
were fed a basic diet and received normal saline by gavage. The
DMix group of diabetic rats was fed a basic diet and received DMix
(17.2 g/kg/day) by gavage. The metformin group of diabetic rats was
fed a basic diet and received metformin (100 mg/kg/day) by gavage.
Following 12 weeks of treatment all animals were fasted without
water for 1 night and all rats were subsequently weighed at 8.00 am
and then anaesthetized using intraperitoneal 10% urethane (1,000
mg/kg). Rapid laparotomy was performed prior to sample collection.
Blood was collected from the abdominal aorta, centrifuged at 1,625
× g for 20 min at room temperature to collect serum and preserved
at −20°C for later experiments. The livers from all rats were
collected, dissected and divided. Liver tissue (100 mg) was placed
into 1.5 ml Eppendorf tubes, snap frozen in liquid nitrogen and
stored at −80°C for reverse transcription-quantitative polymerase
chain reaction (RT-qPCR) and western blot analysis. The remaining
tissue was fixed in 4% paraformaldehyde at 4°C for 72 h. for
histopathological examination using hematoxylin and eosin (H&E)
staining.
Hematoxylin & eosin (H&E)
staining
H&E histology was performed to examine the
histopathological changes in the liver. Liver tissues were
dissected and fixed in 4% paraformaldehyde at 4°C for 72 h,
dehydrated and embedded in paraffin blocks. Liver sections (3 mm)
were sliced backward from the optic chiasma. Sections were
deparaffinized and hydrated with decreasing concentrations of
alcohol, stained with H&E (Stained with Hematoxylin for 5 min
at room temperature and 0.5% eosin for 1 min at room temperature),
and observed using a light microscope (DFC310 FX; Leica, Wetzlar,
Germany) at magnification, ×200.
Measurements
Blood glucose was measured using the glucose oxidase
method according to the protocol of a previous study (18). Serum triglycerides (TG), total
cholesterol (Tch), low-density lipoprotein-cholesterol (LDL-C),
alanine transaminase (ALT), aspartate transaminase (AST) and
glycosylated serum protein (GSP) levels were measured using an
automated LX-20 Pro biochemistry analyzer (Beckman Coulter, Inc.,
Brea, CA, USA). Insulin ELISA kits were used to measure fasting
insulin (FIN) levels and the homeostasis model assessment of
insulin resistance (HOMA-IR) was used to quantify glycosylated
hemoglobin. HOMA-IR, which indicates the degree of insulin
resistance, was calculated according to the following equation:
HOMA-IR=(FBG × FIN)/22.5.
RT-qPCR
RT-qPCR was used to measure InsR, FoxO1, PEPCK and
G6Pase gene expression. A total of 100 mg of frozen liver tissue
was homogenized to extract total RNA using TRIzol®
(Thermo Fisher Scientific, Inc.). RNA integrity was tested by
electrophoresing the RNA in a denaturing formaldehyde gel. Total
RNA was then reverse transcribed into cDNA using a PrimeScriptTM II
1st Strand cDNA Synthesis kit (Takara Bio, Inc.). The following
primers were used for RT-qPCR: InsR forward,
5′-TTTTTGTCCCCAGGCCATCC-3′ and reverse, 5′-CCTGTGCTCCTCCTGACTTG-3′;
Foxo1 forward, 5′-CCCAGGCCGGAGTTTAACCA-3′ and reverse,
5′-AGCAGGCTCAGGTTGCTCAT-3′; PEPCK forward,
5′-GGAAGCGGATACGGTGGGAA-3′ and reverse, 5′-GGAAGGCTGCTGCCAGGTAT-3′;
G6Pase forward, 5′-GCTCCTGGGACAGACACACA-3′ and reverse,
5′-CCACACTGGGTTGCACAAGG-3′; and GAPDH forward,
5′-GTTACCAGGGCTGCCTTCTC-3′ and reverse, 5′-GGGTTTCCCGTTGATGACC-3′
as the reference gene. Probe primers were designed from the
conserved sequences of target genes obtained from Invitrogen
(Thermo Fisher Scientific, Inc.), and were used to generate PCR
products with a SYBR Green I quantitative PCR kit (Takara Bio Inc.)
and amplify target genes. An ABI7500 Real-Time PCR system (Applied
Biosystems; Thermo Fisher Scientific, Inc.) was used to analyze
copy numbers with the following thermocycling conditions:
Denaturation, 95°C for 10 sec; 30 cycles at 95°C for 10 sec; 60°C
for 20 sec; 95°C for 60 sec; 55°C for 30 sec; and 95°C for 30 sec.
The results were determined using the 2−ΔΔCq method
(19).
Western blot analysis
Western blotting was used to determine the total
protein expression of InsR, PI3K, Akt, FoxO1, PEPCK and G6Pase, as
well as the phosphorylation of PI3K and Akt. A total of 100 µg
purified protein extract was separated by 12% SDS-PAGE gel and
transferred to nitrocellulose membranes. Non-specific proteins were
blocked with bovine serum albumin (Beijing Solarbio Science &
Technology Co., Ltd., Beijing, China) for 1 h at room temperature
and the membranes were incubated with primary antibodies (1:1,000)
overnight at 4°C. The membranes were washed with TBS-Tween solution
and subsequently incubated for 1 h at room temperature with
horseradish peroxidase (HRP)-labeled secondary antibodies (1:500,
anti-rabbit IgG, cat. no. ZB-2301; anti-mouse IgG, cat. no.
ZB-2305; each, OriGene Technologies, Inc., Rockville, MD, USA). The
membranes were then washed twice. β-actin was used as the internal
control. The band intensity was developed using an enhanced
chemiluminescence-Plus kit (cat. no. RPN2132; GE Healthcare Life
Sciences, Little Chalfont, UK). Images were taken with a Bio-Image
Analysis system (Bio-Rad Laboratories, Inc., Hercules, CA, USA) and
the bands were analyzed using ImageJ software (1.48 u) National
Institutes of Health, Bethesda, MD, USA).
Statistical analysis
The experimental data was analyzed using SPSS 19.0
(SPSS, Inc., Chicago, IL, USA) and are presented as the mean ±
standard deviation. All experiments were performed in triplicate.
One-way analysis of variance was used to compare the mean values of
samples across multiple groups. An LSD post-hoc test and Dunnett's
T3 post-hoc test were also subsequently performed. P<0.05 was
considered to indicate a statistically significant result.
Results
General condition of animals during
the construction of the rat model
The healthy control rats were active with clean,
well-groomed hair. They exhibited no significant changes in
urination and bowel movement frequency compared with the diabetic
model groups (data not shown). The diabetic model rats were
observed to be less active, with duller hair. Their intake of food
and water increased significantly compared with the control rats,
as did their frequency of urination and bowel movements (data not
shown). No diarrhea or deaths occurred across all groups.
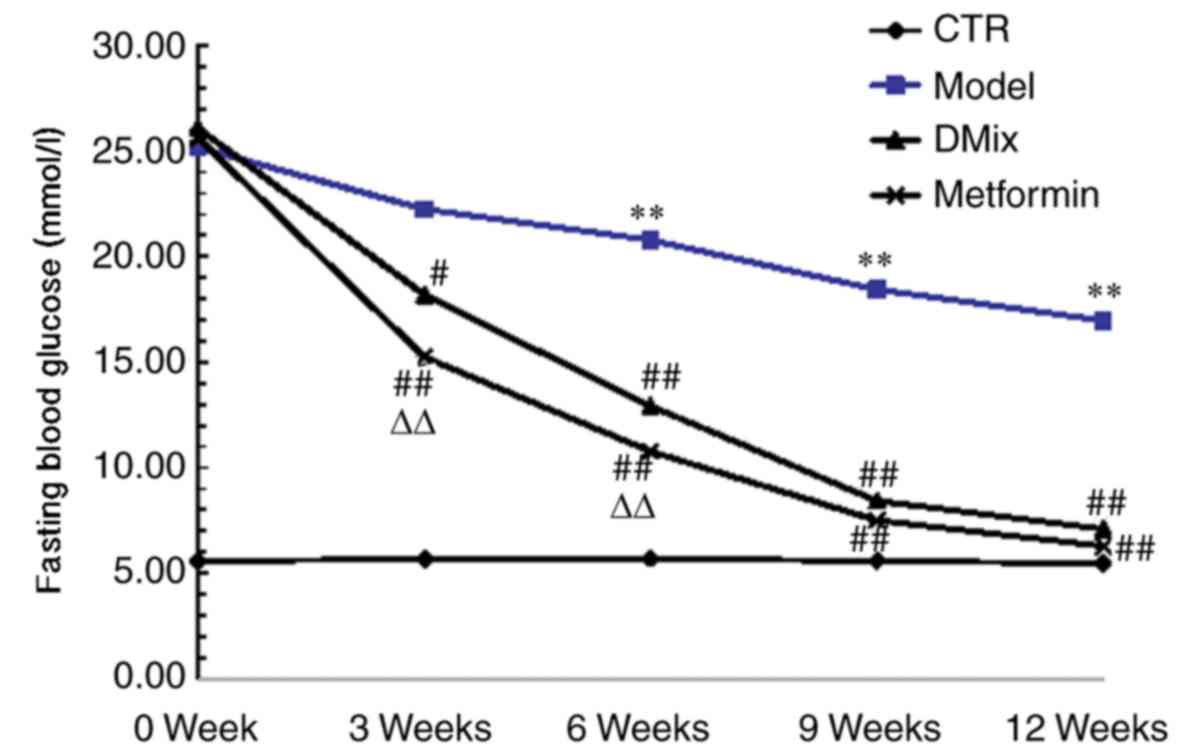
Changes in serum glucose and lipid
metabolism FBG
Following 6 weeks of a high-fat/high-sugar diet and
two intraperitoneal injections of STZ, the blood glucose levels of
all diabetic rats were >25 mmol/l. There were no significant
differences in blood glucose level among the different diabetic
groups prior to treatment (data not shown). However, the FBG levels
in the model group diabetic rats were significantly higher compared
with the healthy control rats at 6, 9 and 12 weeks (P<0.01;
Fig. 1). Following the
administration of DMix and metformin, the FBG levels of the rats
were significantly reduced at 3 (P<0.05 for DMix; P<0.01 for
metformin), 6, 9 and 12 weeks (all P<0.01) compared with the
diabetic model group. The FBG levels were significantly lower in
the metformin group at 3 and 6 weeks compared with the DMix group
(P<0.01), but no significant differences were observed between
the two groups at 9 and 12 weeks.
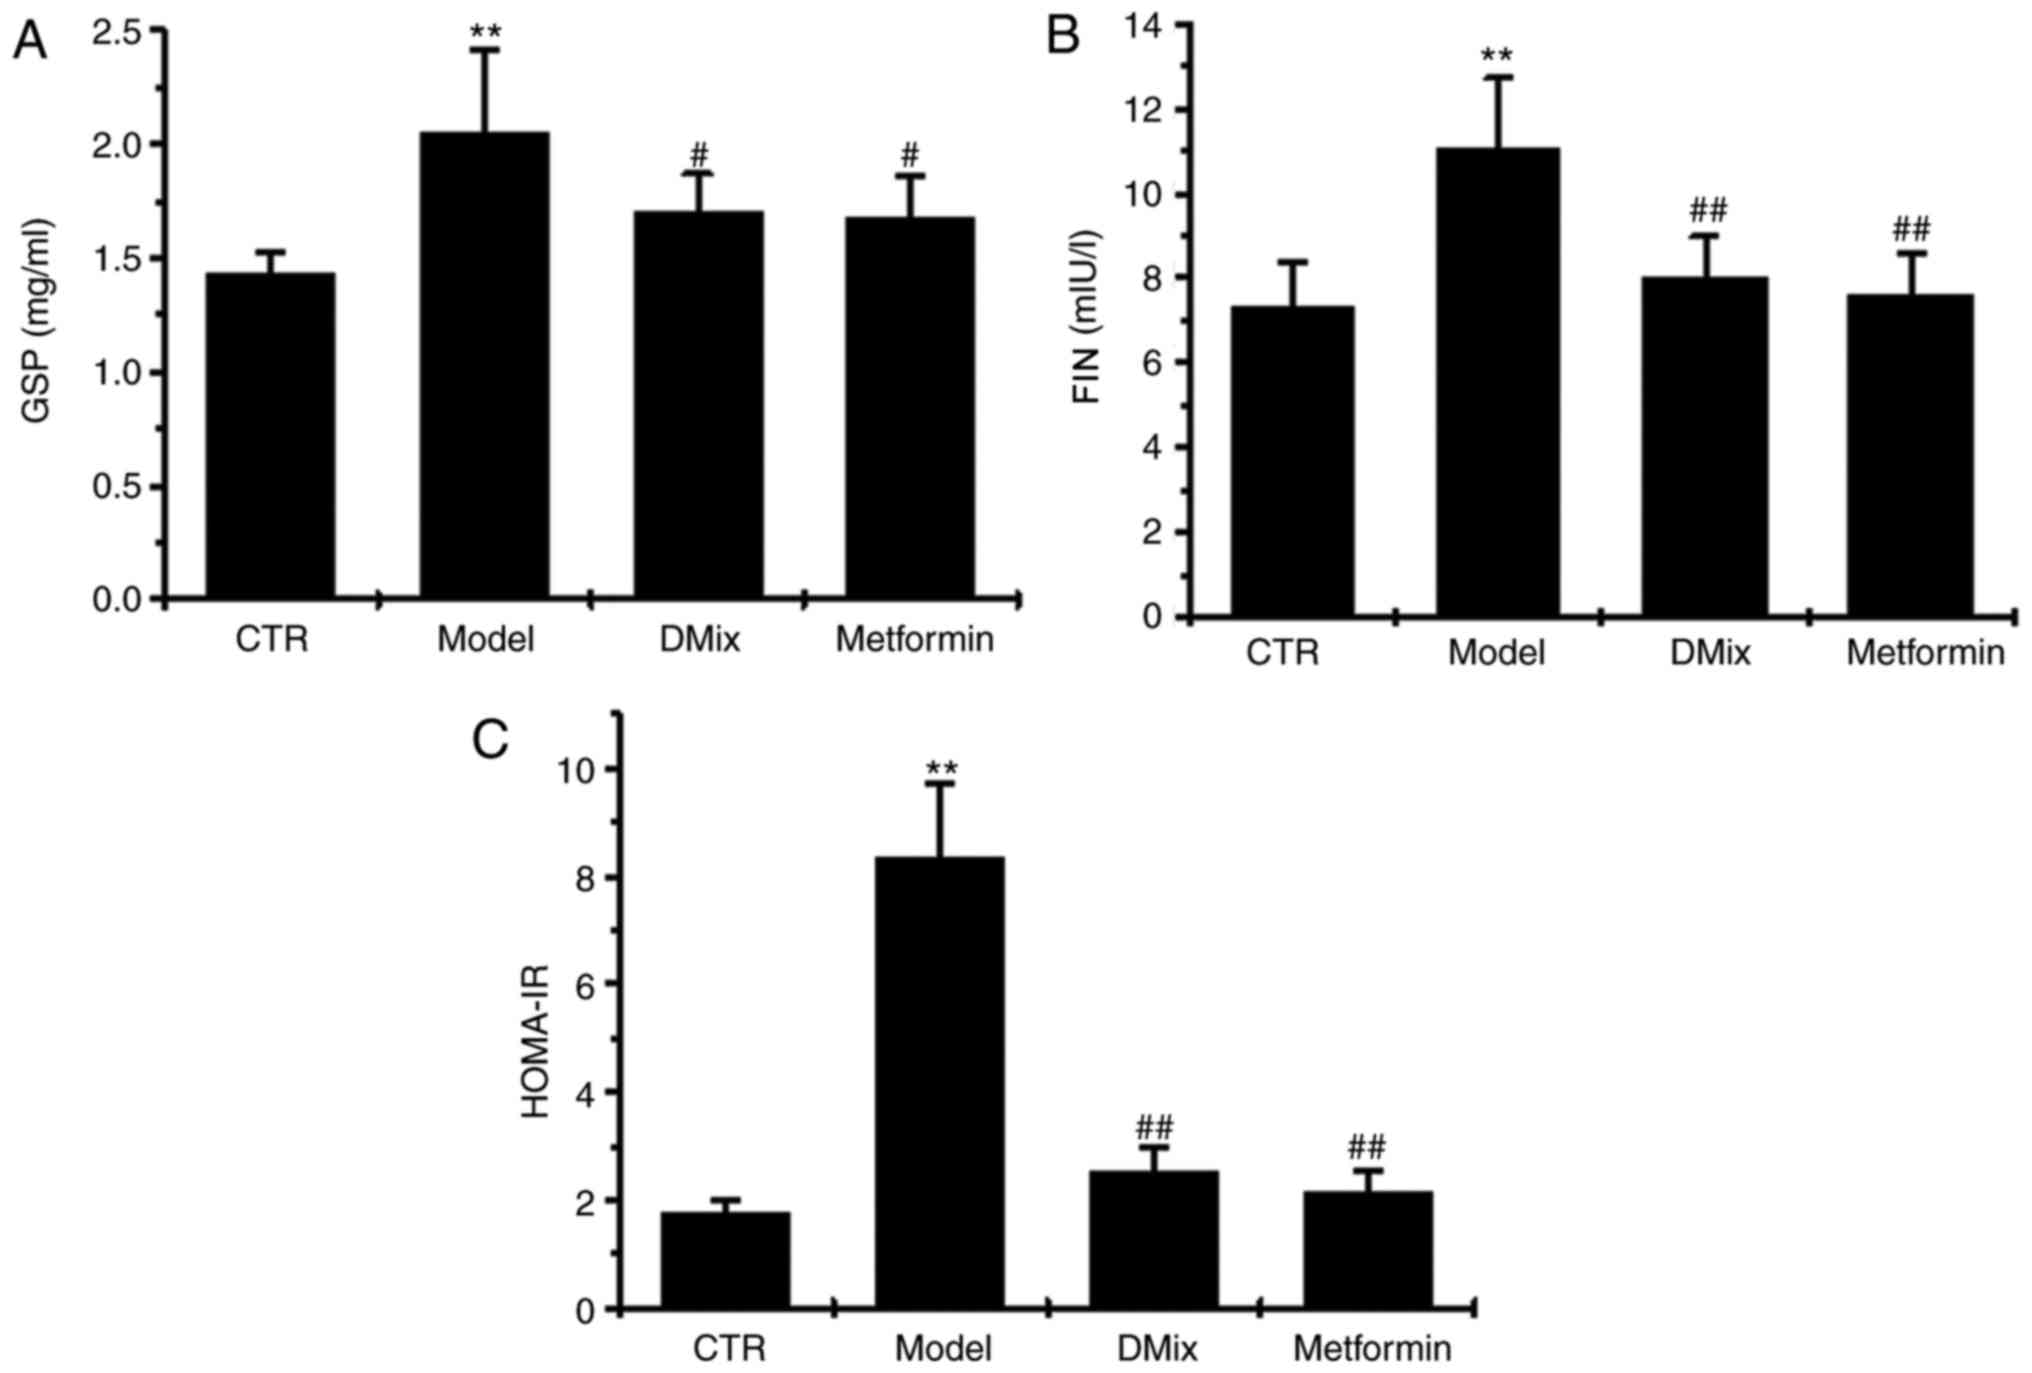
GSP, FIN and HOMA-IR
Following 12 weeks of treatment, GSP, FIN and
HOMA-IR were significantly elevated in the diabetic model group
compared with the control group (P<0.01; Fig. 2). However, GSP, FIN and HOMA-IR were
significantly lower in the DMix and metformin groups compared with
the diabetic model group (P<0.05 for GSP; P<0.01 for FIN and
HOMA-IR).
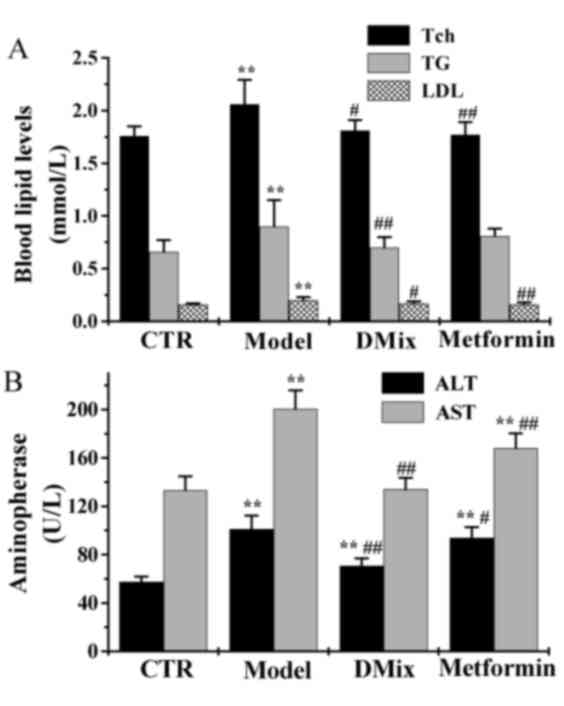
Tch, TG, LDL, ALT and AST
Following 12 weeks of treatment the Tch, TG and LDL
levels were significantly elevated in the diabetic model group
compared with the control group (P<0.01; Fig. 3A). However, the Tch, TG and LDL
levels were significantly lower in the DMix group compared with the
diabetic model group (P<0.05 for Tch and LDL; P<0.01 for TG),
and were very similar to that of the control group (P>0.05). In
the metformin group, the Tch and LDL levels were significantly
lower compared with the diabetic model group (P<0.01), and were
very similiar to the healthy controls (P>0.05). The ALT and AST
levels were significantly elevated in the diabetic model group
compared with the healthy control group (P<0.01; Fig. 3B). The levels of ALT and AST were
significantly lower in the DMix (P<0.01) and metformin
(P<0.05 for ALT; P<0.01 for AST) groups compared with the
diabetic model group. ALT levels were significantly higher in the
DMix and the metformin group compared with the healthy control
group (P<0.01). The AST levels in the DMix group were also very
similar to the healthy controls (P>0.05). However, the metformin
group demonstrated significantly higher levels compared with the
healthy control group (P<0.01).
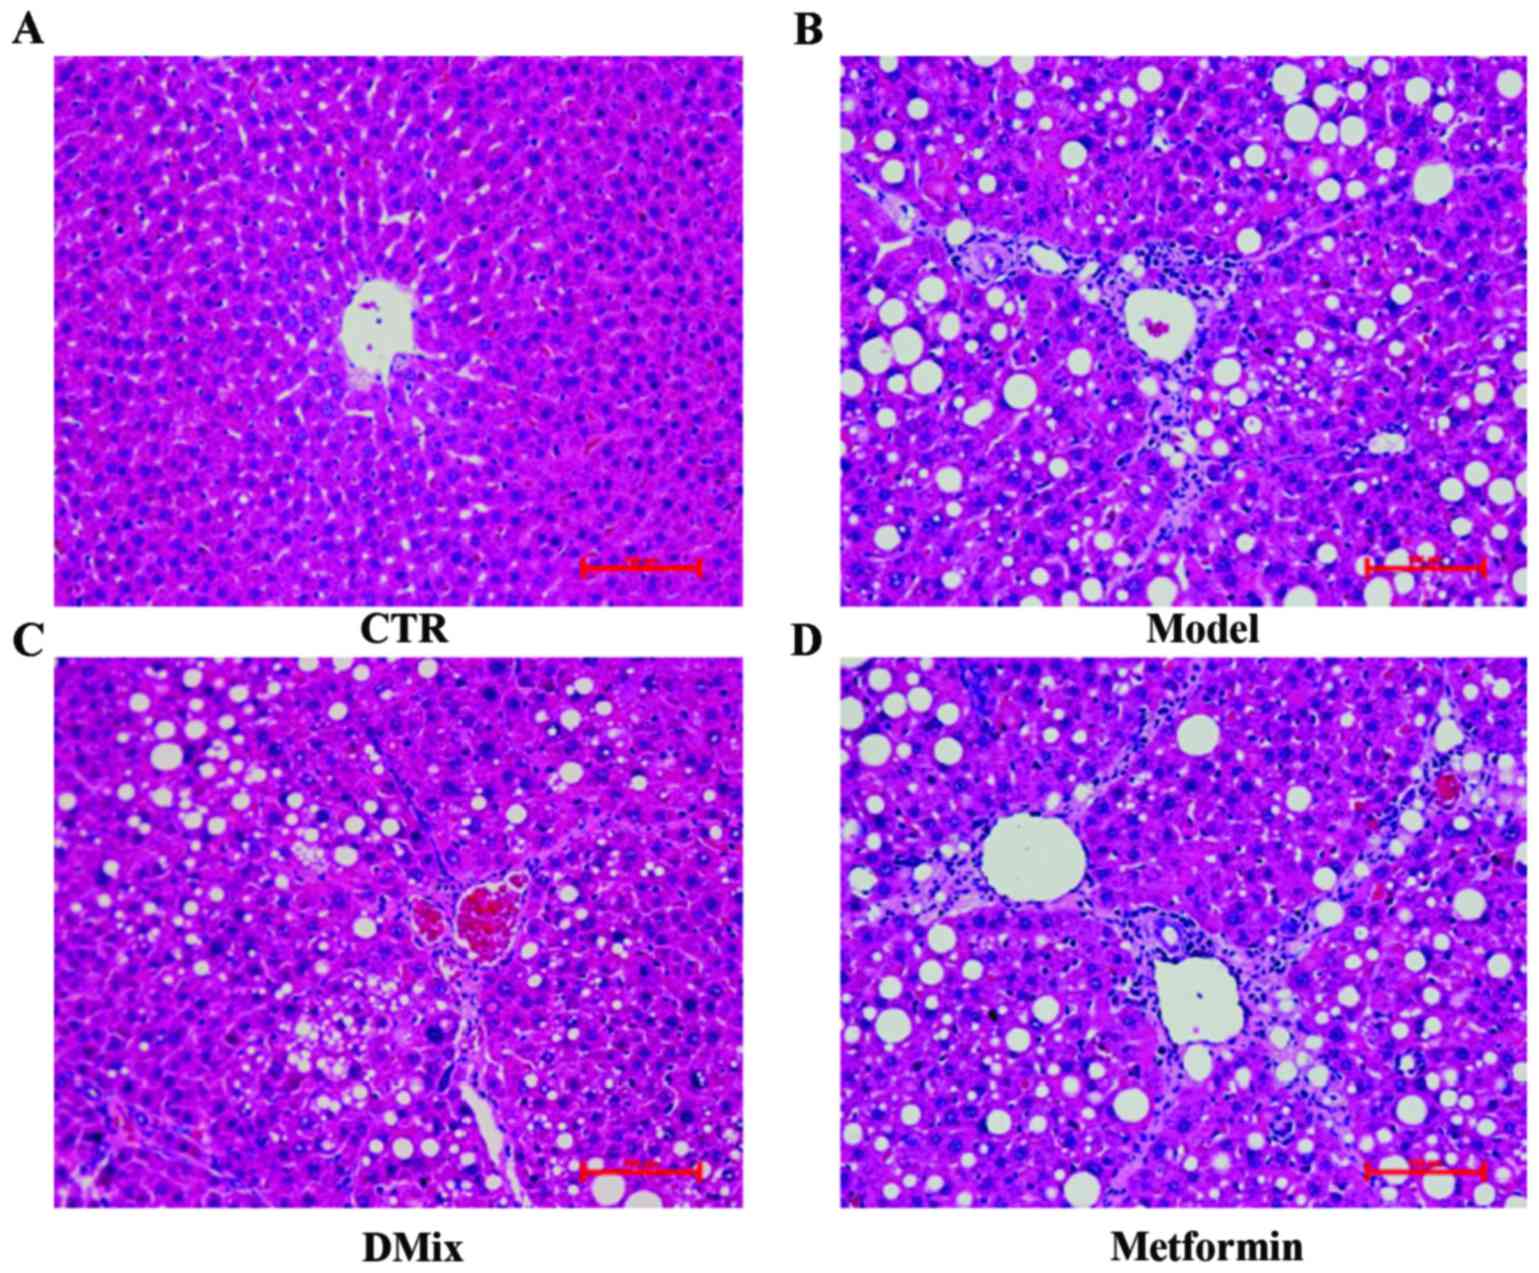
Liver histopathology
The H&E stained liver tissues were examined by
light microscopy (Fig. 4). This
revealed that the majority of the rat livers from the healthy
control group had a clear lobular structure and evenly sized
hepatocytes radially distributed from the center of the central
veins (Fig. 4A). In all of the
healthy livers, the hepatic cord was arranged neatly. The small
arteries, veins and bile ducts had a normal structure in the portal
area and the sinusoids were clearly visible. In all rat livers form
the diabetic model group, the hepatocytes exhibited an altered
shape with unclear cell contours (Fig.
4B). In these livers, the cord-like arrangement of the liver
lobule had disappeared and the connections between hepatocytes were
loose. In addition, diabetic model rats had an enlarged hepatic
sinus, notable inflammatory cell exudation, connective tissue
hyperplasia and an abnormal structure of the central veins and
portal area. The rat livers from the DMix group had neatly arranged
hepatocytes and the structure of the hepatic cord and the hepatic
sinuses was improved compared with the untreated diabetic rats
(Fig. 4C). The DMix rats exhibited
no clear inflammatory cell infiltrations and collagen connective
tissue hyperplasia was rare. The diabetic rats treated with
metformin had a crooked hepatic cord structure, expanded hepatic
sinuses and connective tissue hyperplasia in part of the portal
area (Fig. 4D).
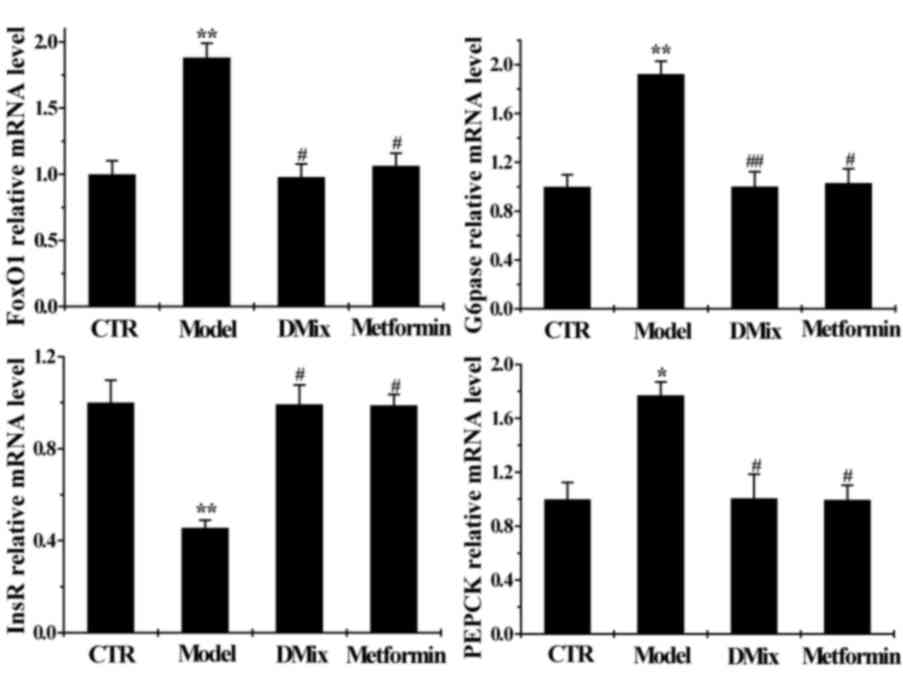
Effect of DMix on hepatic InsR, FoxO1,
PEPCK and G6Pase mRNA expression
The mRNA expression of InsR was significantly lower
in the diabetic model group compared with the healthy control group
(P<0.01), whereas FoxO1 (P<0.01), PEPCK (P<0.05) and
G6Pase (P<0.01) mRNA expression was significantly higher
compared with the control group (Fig.
5). InsR mRNA expression was significantly higher in the DMix
and metformin groups compared with the diabetic model group
(P<0.05), while FoxO1 (P<0.05), PEPCK (P<0.05) and G6Pase
(P<0.01 for DMix; P<0.05 for metformin) mRNA expression was
significantly lower in the DMix group compared with the diabetic
model group. The DMix and metformin mRNA levels were similar to
those of the healthy controls.
Effect of DMix on hepatic InsR, PI3K,
p-PI3K, Akt, p-Akt, FoxO1, PEPCK and G6Pase protein expression
There were no notable differences in the PI3K and
Akt expression levels in the diabetic model group compared with the
healthy control group (Fig. 6A).
However, p-PI3K/PI3K, p-Akt/Akt and InsR expression levels were
significantly lower in the diabetic model group compared with the
healthy control group (P<0.05; Fig.
6B-D). The FoxO1, PEPCK and G6Pase expression levels were
significantly higher in the diabetic model group compared with the
healthy control group (P<0.05; Fig.
6C and D). The levels of p-PI3K/PI3K (P<0.01), p-Akt/Akt
(P<0.05) and InsR (P<0.05 for DMix; P<0.01 for metformin)
protein expression were significantly higher in the DMix and
metformin groups compared with the diabetic model group, whereas
the FoxO1 (P<0.01), PEPCK (P<0.05) and G6Pase (P<0.05 for
DMix; P<0.01 for metformin) levels were significantly lower.
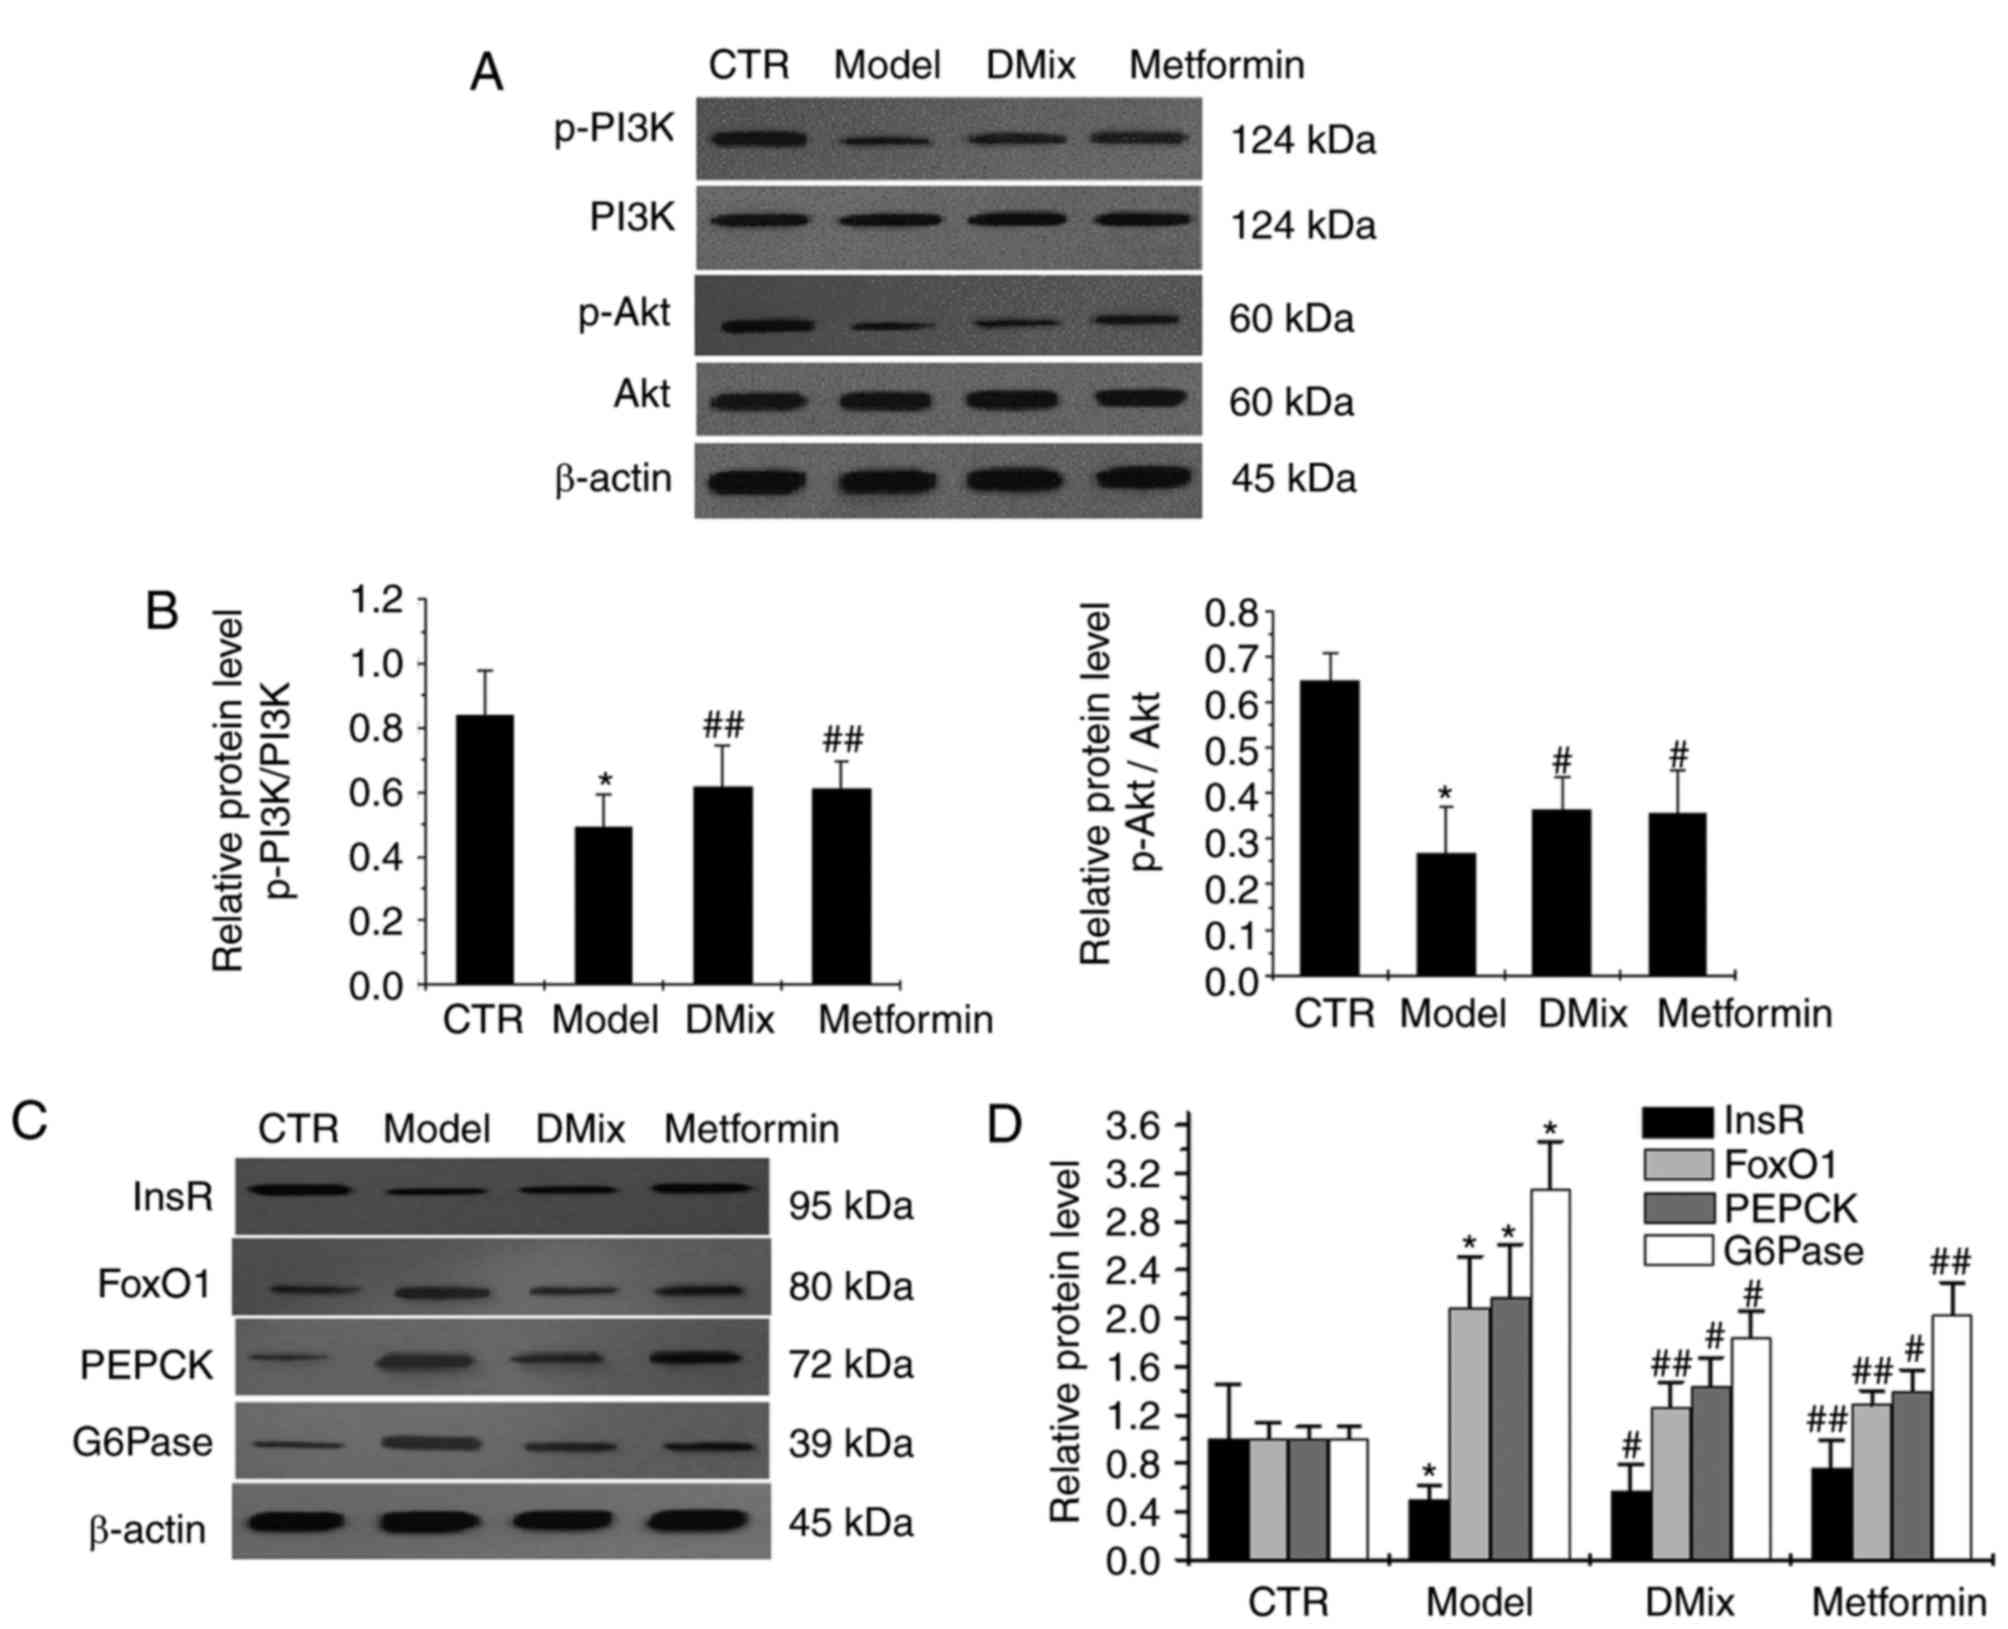 | Figure 6.Protein expression levels of PI3K,
p-PI3K, Akt, p-Akt, InsR, FoxO1, PEPCK and G6Pase as measured by
western blot analysis. (A) Western blot analysis of the proteins.
The western blot was quantified and the (B) p-PI3K/PI3K and
p-Akt/Akt results are presented as bar charts. (C) Western blot
analysis of InsR, FoxO1, PEPCK and G6Pase. (D) The western blot was
quantified and presented as a bar chart; the band intensity was
normalized to β-actin. *P<0.01 vs. CTR group;
#P<0.05 and ##P<0.01 vs. Model group.
CTR, control; PI3K, phosphoinositide-3-kinase; Akt, protein kinase
B; InsR, insulin receptor β; FoxO1, forkhead box protein O1; PEPCK,
phosphoenolpyruvate carboxykinase; G6Pase, glucose 6-phosphatase;
p-, phosphorylated. |
Discussion
Diabetes may cause acute and chronic complications,
which makes it a public health issue that requires global attention
(20). The establishment of
appropriate diabetic animal models is important for studying the
pathogenesis of diabetes. STZ destroys islet β cells and a low dose
of STZ combined with a high-fat diet is the most common way to
induce diabetes in rodents (21,22). A
previous in vivo study by the authors demonstrated that rats
fed 6 weeks of a high-fat/high-sugar diet combined with two
intraperitoneal injections of low-dose STZ, effectively established
a stable and affordable rat model of diabetes (23). The same method was used in the
present study to establish the Wistar rat model of diabetes.
Based on its clinical manifestations and features,
diabetes is categorized as a dispersion-thirst disease in TCM
(24). The incidence of diabetes is
multifactorial and may be associated with genetic (25), environmental (26), dietary (27), lifestyle (27) factors. In TCM, type II diabetes may
be treated with the Nourishing-‘yin’, Tonifying-‘qi’ method
(28) or the Nourishing-‘yin’,
Tonifying-qi, activating-blood (promoting blood flow) methods
(29).
The DMix was prepared according to TCM theory and
consisted of dendrobium, astragalus, salvia, rehmannia, pueraria,
schisandra and earthworms. TCM suggests that this combination
should promote body fluid production, eliminate dryness-heat and
promote systemic blood flow, therefore, DMix may effectively
prevent and treat type II diabetes and its complications (15,16)
A previous study by the authors revealed that 1,339
of the 41,023 liver genes examined were expressed differently in a
rat model of diabetes compared with healthy rats (24). However, only 380 genes were expressed
differently in diabetic rats treated with DMix compared with
healthy rats. This indicates that the healthy expression of ~1,000
genes was restored by DMix treatment (24). The previous study also suggested that
DMix affected gene transcriptomes in vivo supporting the use
of DMix as a potential treatment of Type II diabetes. Metformin,
used here as a representative biguanide is an oral antidiabetic
drug that lowers insulin resistance in vivo, improves
hyperinsulinemia, minimizes liver gluconeogenesis and promotes the
uptake and utilization of glucose in peripheral insulin-sensitive
tissues (17). These effects lead to
a reduction in blood glucose levels (30). Metformin was used in the present
study as a positive control.
Animals in the diabetic model group had a
significantly elevated FBG compared with the healthy control rats,
but treatment with DMix or metformin significantly reduced FBG in
the diabetic rats compared with the diabetic model rats at 3, 6, 9
and 12 weeks after treatment. The FBG levels were significantly
lower in the metformin group at 3 and 6 weeks compared with the
DMix group, but no significant differences between the two groups
were observed at 9 and 12 weeks. This suggests that metformin had a
faster hypoglycemic effect, whereas the hypoglycemic effect of DMix
was more stable. GSP, a sensitive indicator of recent blood glucose
levels is not affected by the current blood glucose concentration
and instead reflects blood glucose levels over the previous 2–3
weeks. It was revealed that GSP was significantly elevated in the
diabetic model group compared with the healthy control group. In
addition, GSP levels were significantly lower in rats treated with
DMix or metformin, which suggests that the hypoglycemic effect of
DMix was similar to metformin.
The results indicated that Tch, TG and LDL levels
were significantly elevated in the diabetic model group compared
with the healthy control group. However, the levels of Tch, TG and
LDL were significantly reduced following treatment with DMix
compared with the model group. However only the levels of Tch and
LDL were significantly reduced following treatment with metformin.
A previous study demonstrated that in addition to reducing blood
sugar levels, metformin significantly reduced cholesterol and LDL-C
levels (31), which is consistent
with the findings of the present study. Clinical complications of
diabetes may involve multiple systems and organs, including the
liver (32). A previous study
revealed that the incidence of liver disease is 21–78% in type I
and II diabetes and the risk of suffering mortality due to liver
disease is higher for patients with type II diabetes compared with
the general population (33). T2DM
promotes the progression of NAFLD to NASH, liver fibrosis and liver
cancer (34). In addition, it
increases mortality rate associated with the liver (34). The correlation between high alanine
ALT levels and reduced hepatic insulin sensitivity may be used to
predict the development of type II diabetes (35). In the present study, ALT and AST
levels were significantly elevated in the model group compared with
the control group. Examination of the liver histopathology of
diabetic rats revealed changes in the shape of the hepatocytes, a
loss of the cord-like arrangement in the liver lobule, an enlarged
hepatic sinus and an abnormal structure in the central vein and
portal area. This suggests that liver damage in diabetic rats may
be associated with inflammatory damage caused by dysregulated
glucose and lipid metabolism, and by prolonged stimulation with
high glucose. The ALT and AST levels in diabetic rats treated with
DMix or metformin were significantly reduced 12 weeks after
treatment compared with the diabetic model group. Liver
histopathological examinations in diabetic rats treated with DMix
or metformin revealed neatly arranged hepatocytes and improved
hepatic cord and hepatic sinus structures. These observations
suggest that DMix reduced elevated transaminase levels, improved
liver histopathology and exerted a protective function on the
liver. This is associated with the improvement of glycolipid
metabolism in diabetic rats by DMix and the reduction of liver
damage by hyperglycemia and hyperlipidemia.
A previous study demonstrated that hyperinsulinemia
is an initiator of insulin resistance (36). Sustained high insulin levels may
reduce the expression of insulin receptors in peripheral tissues
reducing intracellular glucose utilization and further increasing
insulin secretion via feedback stimulation (37). In the present study it was observed
that insulin levels and insulin resistance were significantly
increased in diabetic model rats compared with the healthy control
rats, suggesting that hyperinsulinemia and insulin resistance had
successfully been induced in the model rats. Compared with the
diabetic model rats, the insulin levels and the insulin resistance
index were significantly lower in the diabetic rats treated with
DMix. This suggests that DMix treatment significantly alleviated
hyperinsulinemia and significantly reduced insulin resistance.
The binding of insulin to InsR activates the
PI3K/Akt signaling pathway and mediates insulin metabolism in
peripheral tissues, including the liver and skeletal muscle
(38). InsR is responsible for
initiating intracellular insulin transmembrane signal transduction
(37). Abnormal InsR expression or
phosphorylation affect normal insulin signal transduction and these
abnormalities induce insulin resistance and glucose metabolism
disorders (39). Akt is critical for
metabolism and cell growth (5). PI3K
(23) functions as a second
messenger to activate downstream Akt (40). In the present study, it was revealed
that the phosphorylation of InsR, PI3K and Akt was significantly
lower in the livers of diabetic model rats compared with the
healthy controls. This may be associated with reduced InsR
expression, leading to decreased signal transduction. This suggests
that high blood glucose and insulin levels inhibited Akt activity,
consistent with the findings of Tomas et al (41). InsR, p-PI3K/PI3K and p-Akt/Akt levels
were significantly upregulated in diabetic rats following DMix
treatment compared with the diabetic model rats, suggesting that
DMix may partly regulate PI3K/Akt signaling, improve glucose and
lipid metabolism and reduce insulin resistance in a rat model of
diabetes.
FoxO factors are involved in a range of biological
processes, including cell proliferation, apoptosis and energy
metabolism (42). The transcription
factor FoxO1 promotes the gene expression of key gluconeogenesis
enzymes by binding to specific promoters (43). PEPCK is a rate-limiting enzyme
critical to the first step of gluconeogenesis, where it is pivotal
in the conversion of oxaloacetate to phosphorylate pyruvate
(44). PEPCK levels in the livers of
PEPCK transgenic mice are ~7-fold higher than in normal mice,
leading to a significant increase in gluconeogenesis (45). The enzyme G6Pase helps to catalyze
the hydrolysis of 6-phosphate glucose into glucose (46), the final step of gluconeogenesis.
Therefore, increased G6Pase activity directly affects glycogen
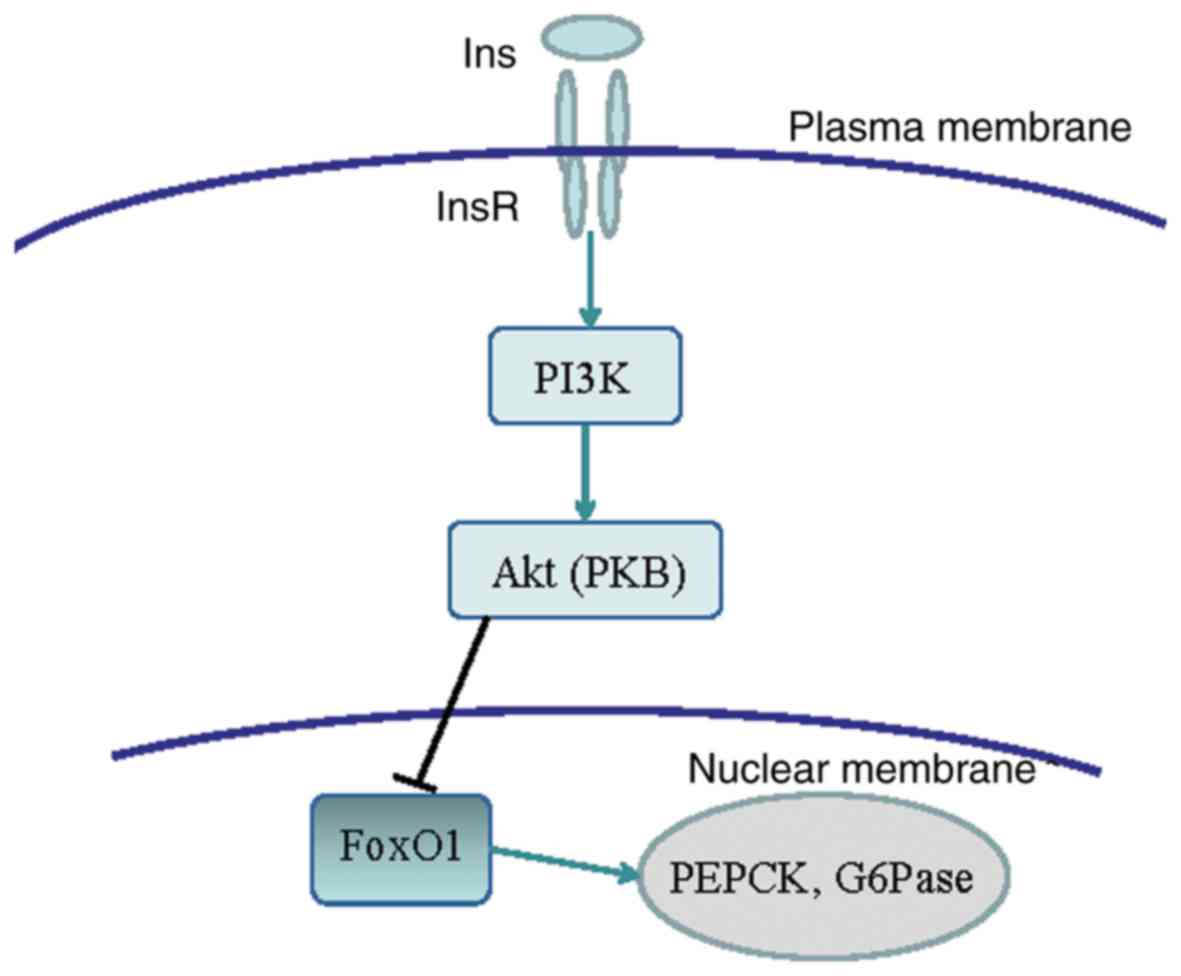
output. The binding of insulin to InsR activates the PI3K/Akt
signaling pathway, which inactivates the phosphorylation of the
downstream signaling molecule FoxO1 and induces its degradation.
This reduces the expression of PEPCK and G6Pase enzymes associated
with gluconeogenesis, and inhibits gluconeogenesis. The signal
pathway is shown in Fig. 7 (11,12). In
the present study, it was revealed that FoxO1, PEPCK and G6Pase
protein expression was significantly upregulated in the livers of
diabetic model rats compared with the healthy control rats. The
authors hypothesized that the reduced activity of InsR, p-PI3K and
p-Akt decreased FoxO1 degradation, subsequently increasing the
expression of the gluconeogenic enzymes PEPCK and G6Pase and
resulting in an increased hepatic glucose output in the diabetic
rats. In the present study, DMix significantly decreased FoxO1,
PEPCK and G6Pase protein expression levels in the diabetic rats,
thereby suppressing gluconeogenesis and improving glucose
metabolism.
The results indicated that DMix treatment
significantly reduced the levels of blood glucose, blood lipid, GSP
and insulin in diabetic rats. These effects may be caused by an
increase in the gene and protein expression of InsR, p-PI3K and
p-Akt in the insulin signaling pathway, and a reduction in the gene
and protein expression of FoxO1, PEPCK and G6Pase. The results
suggest that DMix suppressed gluconeogenesis, improved insulin
resistance and effectively treated and prevented diabetes by
regulating the gene and protein expression of key molecules in the
insulin signaling pathway. Insulin levels in the blood are
regulated by insulin secretion and insulin clearance, and
receptor-mediated endocytosis is considered the primary mechanism
of insulin clearance (47).
Therefore, in addition to suppressing insulin secretion, DMix may
reduce hyperinsulinemia by promoting the degradation and
endocytosis of insulin. However, further study is required to
investigate this.
Acknowledgements
The authors would like to thank Professor Shi Hong
for her professional instruction.
Funding
The present study was supported by The National
Natural Science Foundation of China (grant no. 81503438), The
Project of the Department of Health of Fujian Province (grant no.
2014-1-69) and The Key Project of the Fujian Education Department
(grant no. JA15228).
Availability of data and materials
The datasets used and/or analyzed during the current
study are available from the corresponding author on reasonable
request.
Authors' contributions
XL and HS conceived and designed the present study.
XL, YC, XW, JZ, WY and MW performed the experiments. XL wrote and
HS reviewed the manuscript. All authors read and approved the final
version of the manuscript.
Ethics approval and consent to
participate
The present study was approved by the Ethics
Committee of Fujian University of Traditional Chinese Medicine
(Fuzhou, China).
Consent for publication
Not applicable.
Competing interests
The authors declare that they have no competing
interests.
References
|
1
|
Xu Y, Wang L, He J, Bi Y, Li M, Wang T,
Wang L, Jiang Y, Dai M, Lu J, et al: Prevalence and control of
diabetes in chinese adults. JAMA. 310:948–959. 2013. View Article : Google Scholar : PubMed/NCBI
|
|
2
|
Boj SF, van Es JH, Huch M, Li VS, José A,
Hatzis P, Mokry M, Haegebarth A, van den Born M, Chambon P, et al:
Diabetes risk gene and Wnt effector Tcf7l2/TCF4 controls hepatic
response to perinatal and adult metabolic demand. Cell.
151:1595–1607. 2012. View Article : Google Scholar : PubMed/NCBI
|
|
3
|
Gao J, Duan C and Li LJ: The pathogenesis
mechanisms of type 2 diabetes mellitus. Medical Recapitulate.
21:3935–3938. 2015.(In Chinese).
|
|
4
|
Steinbrunn T, Stühmer T, Sayehli C,
Chatterjee M, Einsele H and Bargou RC: Combined targeting of
MEK/MAPK and PI3K/Akt signalling in multiple myeloma. Br J
Haematol. 159:430–440. 2012. View Article : Google Scholar : PubMed/NCBI
|
|
5
|
Bence KK: Hepatic PTP1B deficiency: The
promise of a treatment for metabolic syndrome. J Clin Metab
Diabetes. 1:27–33. 2010.PubMed/NCBI
|
|
6
|
Hojlund K: Metabolism and insulin
signaling in common metabolic disorders and inherited insulin
resistance. Dan Med J. 61:B48902014.PubMed/NCBI
|
|
7
|
Yang X and Su Dongming D: Effects of HRD1
expression in hepatic gluconeogenesis. Jiangsu Med J. 13:908–911.
2017.(In Chinese).
|
|
8
|
Enes P, Panserat S, Kaushik S and
Oliva-Teles A: Nutritional regulation of hepatic glucose metabolism
in fish. Fish Physiol Biochem. 35:519–539. 2009. View Article : Google Scholar : PubMed/NCBI
|
|
9
|
Staehr P, Hother-Nielsen O and
Beck-Nielsen H: The role of the liver in type 2diabetes. Rev Endocr
Metab Disord. 5:105–110. 2004. View Article : Google Scholar : PubMed/NCBI
|
|
10
|
Houde VP, Brule S, Festuccia WT, Blanchard
PG, Bellmann K, Deshaies Y and Marette A: Chronic rapamycin
treatment causes glucose intolerance and hyperlipidemia by
upregulating hepatic gluconeogenesis and impairing lipid deposition
in adipose tissue. Diabetes. 59:1338–1348. 2010. View Article : Google Scholar : PubMed/NCBI
|
|
11
|
Gross DN, Wan M and Birnbaum MJ: The role
of FoxO in the regulation of metabolism. Curr Diab Rep. 9:208–214.
2009. View Article : Google Scholar : PubMed/NCBI
|
|
12
|
Wang Q, Wang N, Dong M, Chen F, Li Z and
Chen Y: GdC13 reduces Hyperglycaemia through Akt/FoxOl-induced
suppression of hepatic gluconeogenesis in Type 2 diabetic mice.
Clin Sci (Lond.). 127:91–100. 2014. View Article : Google Scholar : PubMed/NCBI
|
|
13
|
Tang WL, Wang YM, Du WM, Chen BY and Cheng
NN: Analysis of adverse drug reaction of antidiabetic agents
according to documents within forty-two years in China. Chin J New
Drugs Clin Rem. 21:753–768. 2002.(In Chinese).
|
|
14
|
Zhu Y, Song C, Huo H, et al: Research of
traditional chinese medicine in treating type diabetes and insulin
resistance. World Chin Med. 10:135–137. 2015.(In Chinese).
|
|
15
|
Ke Z, Hou X and Jia X: Application idea
and method discussion of Chinese materia medica with hypoglycemic
effect based on active ingredients. Chin Traditional Herbal Drugs.
47:1797–1805. 2016.(In Chinese).
|
|
16
|
Shi H, Zhang X, Cui Yi, et al: Clinical
sequential treatment and experimental studies of DC for diabetes
mellitus. Clinical J Chin Med. 5:1–3. 2013.(In Chinese).
|
|
17
|
Xin J, Wang Q, Chen L, et al: Clinical
sequential treatment and experimental studies on the effect of
dendrobium powder on insulin resistance in type 2 diabetes
mellitus. China Modern Doctor. 48:58–59. 2010.(In Chinese).
|
|
18
|
Liu Y and He R: Fasting induces a high
level of 3-nitrotyrosine in the brain of rats. Neurosci Lett.
472:204–209. 2010. View Article : Google Scholar : PubMed/NCBI
|
|
19
|
Livak KJ and Schmittgen TD: Analysis of
relative gene expression data using real-time quantitative PCR and
the 2(-Delta Delta C(T)) method. Methods. 25:402–408. 2001.
View Article : Google Scholar : PubMed/NCBI
|
|
20
|
Whiting DR, Guariguata L, Weil C and Shaw
J: IDF diabetes atlas: Global estimates of the prevalence of
diabetes for 2011 and 2030. Diabetes Res Clin Pract. 94:311–321.
2011. View Article : Google Scholar : PubMed/NCBI
|
|
21
|
Wang J, Shen X, Fu C, et al: Type2 rat
diabetic models induced by high-fat feeding combined with
Streptozocin. Jilin Med J. 32:629–633. 2011.(In Chinese).
|
|
22
|
Matteucci E and Giampietro O: Proposal
open for discussion: Defining agreed diagnostic Procedures in
experimental diabetes research. J Ethnopharmacol. 115:163–172.
2008. View Article : Google Scholar : PubMed/NCBI
|
|
23
|
Lin X, Wang Q, Xin J, et al: The study of
establishing a highly stable and successful diabetic rat model.
Chin J Gerontology. 5:2051–2054. 2013.(In Chinese).
|
|
24
|
Bai X, Huang Y and Xu Y: The knowledge of
modern physicians on diabetes pathogenesis of tcm. Guangming J Chin
Med. 30:206–209. 2015.(In Chinese).
|
|
25
|
Xu Q, Liu Y, Cong YB, Zheng YY, Zhang JP
and Shi H: Gene expression and microarray investigation of
dendrobium mixture as progressive therapy for the treatment of type
2 diabetes mellitus. Tropical J Pharmaceutical Res. 12:195–201.
2013.
|
|
26
|
Patel DK, Kumar R, Laloo D and Hemalatha
S: Diabetes mellitus: An overview on its pharmacological aspects
and reported medicinal plants having antidiabetic activity. Asian
Pac J Trop Biomed. 2:411–420. 2012. View Article : Google Scholar : PubMed/NCBI
|
|
27
|
Li X, Li S, Huang T and Bai H: Effect of
aerobic exercise and diet intervention on male college students
with variants of FTO gene. J Shanghai University Sport. 38:95–99.
2014.(In Chinese).
|
|
28
|
Zhang Y: Clinical study on Ziyin Yiqi
pills in treatment of diabetic nephropathy. China J Chin Med.
20:1593–1594. 2015.
|
|
29
|
Yu WZ, Chen LJ and Shi H: Effect of the
method of nourishing-‘yin’, Tonifying-‘qi’ and activating-blood on
caspase-3 mrna expression in pancreas of aged diabetic rats.
Lishizhen Medicine and Materia Medica Res. 23:2040–2042. 2012.(In
Chinese).
|
|
30
|
Stumvoll M, Nurjhan N, Perriello G, Dailey
G and Gerich JE: Metabolic effects of metformin in
non-insulin-dependent diabetes mellitus. N Engl J Med. 333:550–554.
1995. View Article : Google Scholar : PubMed/NCBI
|
|
31
|
Wulffelé MG, Kooy A, de Zeeuw D, Stehouwer
CD and Gansevoort RT: The effect of metformin on blood pressure,
plasma cholesterol and triglycerides in type 2 diabetes mellitus: A
systematic review. J Intern Med. 256:1–14. 2004. View Article : Google Scholar : PubMed/NCBI
|
|
32
|
Nakahara T, Hyogo H, Yoneda M, Sumida Y,
Eguchi Y, Fujii H, Ono M, Kawaguchi T, Imajo K, Aikata H, et al:
Type 2 diabetes mellitus is associated with the fibrosis severity
in patients with nonalcoholic fatty liver disease in a large
retrospective cohort of Japanese patients. J Gastroenterol.
49:1477–1484. 2014. View Article : Google Scholar : PubMed/NCBI
|
|
33
|
Zhou YJ, Li YY, Nie YQ, Huang CM and Cao
CY: Natural course of nonalcoholic fatty liver disease in southern
China: A prospective cohort study. J Dig Dis. 13:153–160. 2012.
View Article : Google Scholar : PubMed/NCBI
|
|
34
|
Bhaha N, Younes R and Bugianesi E:
Epidemiology and natural history of patients with NAFLD. Curr Pharm
Des. 19:5169–5176. 2013. View Article : Google Scholar : PubMed/NCBI
|
|
35
|
Vozarova B, Stefan N, Lindsay RS, Saremi
A, Pratley RE, Bogardus C and Tataranni PA: High alanine
aminotransferase is associated with decreased hepatic insulin
sensitivity and predicts the development of type 2 diabetes.
Diabetes. 51:1889–1895. 2002. View Article : Google Scholar : PubMed/NCBI
|
|
36
|
Nolan CJ, Ruderman NB, Kahn SE, Pedersen O
and Prentki M: Response to Comments on Nolan: Insulin resistance as
a physiological defense against metabolic stress: Implications for
the management of subsets of type 2 diabetes. Diabetes. 64:673–686.
2015. View Article : Google Scholar : PubMed/NCBI
|
|
37
|
Gray SL, Donald C, Jetha A, Covey SD and
Kieffer TJ: Hyperinsulinemia precedes insulin resistance in mice
lacking pancreatic beta-cell leptin signaling. Endocrinology.
151:4178–1486. 2010. View Article : Google Scholar : PubMed/NCBI
|
|
38
|
Wang Y, Li B, Zhang W, Liu Y, Xue P, Ma J
and Li Y: Impaired PI3K Akt expression in liver and skeletal muscle
of ovariectomized rats. Endocrine. 44:659–665. 2013. View Article : Google Scholar : PubMed/NCBI
|
|
39
|
Wang YM, Lin XF, Shi CM, Lu L, Qin ZY, Zhu
GZ, Cao XG, Ji CB, Qiu J and Guo XR: α-Lipoic acid protects 3T3-L1,
adipocytes from NYGGF4 (PID1) overexpression-induced insulin
resistance through increasing phosphorylation of IRS-1 and Akt. J
Bioenerg Biomembr. 44:357–363. 2012. View Article : Google Scholar : PubMed/NCBI
|
|
40
|
Han K, Xu X, Chen G, Zeng Y, Zhu J, Du X,
Zhang Z, Cao B, Liu Z and Mao X: Identification of a promising PI3K
inhibitor for the treatment of multiple myeloma through the
structural optimization. J Hematol Oncol. 7:92014. View Article : Google Scholar : PubMed/NCBI
|
|
41
|
Tomas NM, Masur K, Piecha JC, Niggemann B
and Zänker KS: Akt and phospholipase Cγ are involved in the
regulation of growth and migration of MDA-MB-468 breast cancer and
SW480 colon cancer cells when cultured with diabetogenic levels of
glucose and insulin. BMC Res Notes. 5:2142012. View Article : Google Scholar : PubMed/NCBI
|
|
42
|
Ropelle ER, Pauli JR, Prada P, Cintra DE,
Rocha GZ, Moraes JC, Frederico MJ, da Luz G, Pinho RA, Carvalheira
JB, et al: Inhibition of hypothalamic Foxo1 expression reduced food
intake in diet-induced obesity rats. J Physiol. 587:2341–2351.
2009. View Article : Google Scholar : PubMed/NCBI
|
|
43
|
Fabbrini E, Sullivan S and Klein S:
Obesity and nonalcoholic fatty liver disease: Biochemical,
metabolic, and clinical implications. Hepatology. 51:679–689. 2010.
View Article : Google Scholar : PubMed/NCBI
|
|
44
|
Gómez-Valadés AG, Vidal-Alabró A, Molas M,
Boada J, Bermúdez J, Bartrons R and Perales JC: Overcoming
diabetes-induced hyperglycemia through inhibition of hepatic
phosphoenolpyruvate carboxykinase (GTP) with RNAi. Mol Ther.
13:401–410. 2006. View Article : Google Scholar : PubMed/NCBI
|
|
45
|
Kim YK, Lee GS, Jung EM, Hyun SH, Hwang WS
and Jeung EB: Generation of fibroblasts overexpressing
liver-specific PEPCK in a miniature pig model of human type 2
diabetes mellitus. Mol Med Rep. 6:45–50. 2012.PubMed/NCBI
|
|
46
|
Hutton JC and O'Brien RM:
Glucose-6-phosphatase catalytic subunit gene family. J Biol Chem.
284:29241–29245. 2009. View Article : Google Scholar : PubMed/NCBI
|
|
47
|
Costa-Júnior JM, Ferreira SM, Protzek AO,
Santos GJ, Cappelli AP, Silveira LR, Zoppi C, de Oliveira CA,
Boschero AC, Carneiro EM and Rezende LF: Endurance training
inhibits insulin clearance and IDE expression in Swiss mice. PLoS
One. 10:e01188092015. View Article : Google Scholar : PubMed/NCBI
|