Introduction
According to the data published by the World Health
Organization (WHO), cardiovascular disease has become the number
one cause of death at present, ranking second preceded only by
malignant tumor in the number of deaths due to cardiovascular and
cerebrovascular diseases in China (1). Coronary heart disease (CHD), which
causes cardiac dysfunction in patients, is a very common disease in
cardiovascular medicine and one of the leading causes of death
worldwide (2). Studies have reported
that the incidence of CHD has declined in developed countries, but
increased in developing countries in recent years, which may be due
to changes in dietary patterns caused by economic development
(3). The consumption of high-fat
diet and low cholesterol plays a very important role in the
pathogenesis of CHD (4). According
to the findings of the WHO in 2011, the incidence of CHD is ~8% in
China and its mortality rate ranks second in the world (5). Therefore, the treatment of CHD has
become one of the problems that medical researchers urgently need
to solve.
At present, drug treatment and surgery are the
methods for the clinical treatment of CHD. Surgical treatment
mainly reconstructs blood supply through percutaneous coronary
intervention (PCI) (6). PCI is a
treatment method that clears narrow or even occluded coronary lumen
using cardiac catheterization technique, thus improving myocardial
blood flow perfusion. PCI is widely used in clinical practice due
to its ideal effect on CHD, its minimal trauma to the patient,
which minimizes the damage to the patient's recovery of myocardial
blood flow reconstruction, and the emergence of lower price stents
in recent years (7). Nevertheless,
myocardial no-reflow still occurs to some patients after PCI in
clinic. It is very complicated to cause postoperative no-reflow in
patients, including inflammatory reaction, vascular injury, immune
response, oxidative stress and other factors (7). CD69 is one of the molecules that first
expressed on the surface of activated T lymphocytes of the immune
system and is stable in normal human patients (8). Early growth response 1 (EGR1), which is
one of the immediate early family members, exists extensively in
human cells, and its family members all have zinc finger structure
coding regions and have a high homology. Studies have shown that
EGR1 plays an important role in cell growth, differentiation,
proliferation and inflammatory reaction (9). In addtion, we found that CD69 and EGR1
had differential expression in CHD patients through CEO database
screening, but there was no clear conclusion whether they had an
effect on the patient's postoperative blood flow.
Therefore, this study will analyze the association
between CD69 and EGR1 levels and CHD patients without reflow after
PCI.
Patients and methods
Patient data
In this study, 156 CHD patients undergoing PCI from
September 2014 to December 2016 in People's Hospital of Hunan
Province (Changsha, China) were collected and divided into reflow
group (group A) and no-reflow group (group B) according to the
patient's postoperative blood flow. Seventy-two patients in group
A, including 35 males and 37 females, aged from 45 to 78 years with
a mean age of 65.3±10.3 years; 84 patients in group B, including 44
males and 40 females, aged from 45 to 79 years with a mean age of
66.9±9.9 years; both groups of patients met the CHD diagnostic
criteria of American Society of Cardiology (10). Another 70 volunteers for normal
physical examination in the same period were selected as control
group (group C), including 34 males and 36 females, aged from 45 to
78 years with a mean age of 65.3±10.3 years. This study was
approved by the Medical Ethics Committee of People's Hospital of
Hunan Province, and patients or their family members signed the
informed consent.
Inclusion and exclusion criteria
Inclusion criteria
Patients who were not treated with glucocorticoid
within 1 month after undergoing PCI; patients who do not suffer
from autism, memory impairment or hearing impairment; patients who
cooperate with follow-up and patients who have complete clinical
information.
Exclusion criteria
Patients who suffer from malignant tumor, chronic
infection, pulmonary embolism, or immune dysfunction; patients who
have received blood transfusion before operation and have been
treated with thrombolytic therapy; patients who suffer from acute
myocarditis or pericarditis.
Methods
Main reagents and instruments
TRIzol, 2X SYBR-Green qPCR mix, RevertAid™ Premium
First Strand cDNA Synthesis kit, Hank's liquid,
penicillin-streptomycin double antibodies and PBS were purchased
from Invitrogen; Thermo Fisher Scientific, Inc. (cat. nos.
15596018, 4309155, K1621, 88284, 15070063 and 10010049; Waltham,
MA, USA); reverse transcription kit from Takara Biotechnology Co.,
Ltd. (RNA to cDNA EcoDry™ Premix Double Primed; cat. no. 639549;
Beijing, China); quantitative PCR kit from Takara Bio, Inc. (Otsu,
Japan); CD69 monoclonal antibody (mouse anti-human phycoerythrin
marker), CD3 monoclonal antibody (mouse anti-human activating
protein), CD4 monoclonal antibody (BD Horizon™ BV510 mouse
anti-human) and PE-labeled mouse IgG1 CD69 isotype control from BD
Biosciences (dilution, 1:400; cat. nos. 560738, 552852, 562971 and
557908; Franklin Lakes, NJ, USA); erythrocyte splitting liquor from
Tiangen Biotech Co., Ltd. (cat. no. RT122; Beijing, China); ABI
Prism 7900 PCR instrument from Applied Biosystems (Thermo Fisher
Scientific, Inc., Foster City, CA, USA), BD FACSCanto™ II flow
cytometry from BD Biosciences.
Patient biochemical indicators and
clinical data collection
In this study, the patient's sex, age, smoking,
alcoholism and biochemical indicators were collected: Expressions
of total cholesterol (TC), triglyceride (TG), high-density
lipoprotein (HDL-C), low-density lipoprotein (LDL-C), lipoprotein a
(Lpa), fasting blood glucose (FBG), glycosylated hemoglobin
(HbA1c), high-sensitivity C-reactive protein (hs-CRP) and serum
creatinine (Scr).
Sample collection
In this study, 5 ml of fasting venous blood was
extracted from patients in group A and B at 1 h before, 5 min, 2 h
and 6 months after operation twice. They were collected using
EDTA-Na2 for detection of the expression levels of CD69 and EGR1.
Fasting venous blood (5 ml) was extracted from patients in group C
at the same period twice.
CD69 detection
The venous whole blood collected with EDTA-Na2 tube
was mixed with Hanks solution at 1:1, and then the mixture was
superimposed on the surface of the 8 ml lymphocyte separating
liquid, and centrifuged at 543 × g for 15 min at 25°C. The
lymphocytes (circular milky white) on the second layer were
collected after centrifugation, put into a test tube (containing 10
ml of Hanks solution), mixed and centrifuged again at 543 × g for
20 min at 25°C. The supernatant was discarded, the precipitate was
left, and the cells were resuspended and washed. Finally, the cell
concentration was adjusted to 1×10⁶/ml using 10%
RPMI-1640 medium, the resuspended suspension was added to a 24-well
plate (1 ml for per well), and 100 µl/ml of penicillin, 100 µl/ml
of streptomycin and a stimulant PHA 20 µg/ml were added and mixed.
The mixture was incubated (37°C, 5% CO2 incubator for 20
h), resuspended and adjusted to 1×10⁶/ml using PBS. Two
cell suspensions (100 µl) were taken into the sample tube, and one
was added with each 10 µl of CD3, CD4, and CD69 monoclonal
antibodies and another with each 10 µl of CD3 monoclonal antibody,
CD4 monoclonal antibody and CD69 isotype. They were incubated for
20 min without light. After staining, 2 ml of erythrocyte splitting
liquor were added to mix and stand for 10 min to avoid light and
lysed. The lysed tube was centrifuged at 1,370 × g for 5 min at
25°C. The supernatant was discarded, the cells were resuspended
with added 2 ml of PBS, and the resuspended suspension was
centrifuged again at 1,370 × g for 5 min at 25°C. Non-tuberculous
antibodies were removed, the supernatant was discarded, and 0.5 ml
of PBS was added for resuspension. Flow cytometry was used for
detection of the expression level of CD69 in
CD3+CD4+ T cells.
EGR1 detection
A vacuum blood collection tube (EDTA-Na2) was used
for the extraction of 5 ml of fasting venous whole blood from the
patient and the extracted blood was centrifuged at 1,370 × g at
25°C for 30 min. The supernatant was discarded, transferred to an
EP tube and placed in a refrigerator at −80°C for preservation. The
frozen plasma was extracted for total RNA extraction using TRIzol
reagent, and the extraction procedure was performed according to
the kit instruction. The UV spectrophotometer was used for
detection of RNA concentration and purity, and the quality of total
RNA extracted was analyzed using 1% denaturing agarose gel
electrophoresis. Reverse transcription procedure was performed
strictly in accordance with the reverse transcription kit
instruction. EGR1 primers detected by RT-qPCR were designed and
synthesized by Shanghai Shenggong Biotechnology Co., Ltd.
(Shanghai, China) (Table I). The
reaction system was configured using the PCR reaction kit (2X SYBR
Green qPCR Mix) as follows: Upstream primer 0.2 µl, downstream
primer 0.2 µl, cDNA 1 µl, 2X SYBR Select Master Mix 5 µl,
supplemented with double distilled water to 10 µl; ABI PRISM 7900
PCR instrument was used for amplification. Reaction conditions were
pre-denaturation at 95°C for 2 min, 95°C for 15 sec, 60°C for 60
sec, 95°C for 15 sec, a total of 40 cycles. GAPDH was used as an
internal reference in the experiment for a total of three times.
The results were analyzed using 2−ΔCq method (11,12).
 | Table I.Primer sequences. |
Table I.
Primer sequences.
| Genes | Upstream primer | Downstream
primer |
|---|
| EGR1 |
5′-CCCTTGCTCCCTTCAATGCT-3′ |
5′-CGAAATCCATGGCACAGACAC-3′ |
| GAPDH |
5′-AGCCACATCGCTCAGACA-3′ |
5′-TGGACTCCACGACGTACT-3′ |
Statistical analysis
In this study, SPSS 20.0 (IBM Corp., Armonk, NY,
USA) statistical software package was used for analysis of the
collected data, and GraphPad Prism 7 (GraphPad Software, Inc., San
Diego, CA, USA) for drawing data images. All measurement data in
this study are expressed as mean ± standard deviation (mean ± SD).
The Student's t-test was used for comparison between the two groups
and variance analysis for analysis between groups. The counting
data are expressed in rate (%) and the χ2 test for
comparison between groups. Logistic multivariate regression was
used for analysis of the association between CD69, EGR1 and
coronary artery disease. P<0.05 was considered to indicate a
statistically significant difference.
Results
Comparison of data between two groups
of patients
Through comparison of the clinical data between two
groups of patients, it was found that there was no statistical
difference in sex, age, smoking and alcoholism between the groups
(P>0.05). Through further comparison of the biochemical
indicators between groups, it was found that there was no
statistical difference in TG, TC, HDL-C, LDL-C, HbAlc and FBG in
patients between group A and group B (P>0.05), but a statistical
difference in the expression levels of Lpa, hs-CRP and Scr between
the two groups (P<0.05) (Table
II).
| Table II.Clinical data of patients [n (%)]. |
Table II.
Clinical data of patients [n (%)].
| Groups | Group A (n=72) | Group B (n=84) | χ2/t | P-value |
|---|
| Sex |
|
|
| 0.748 |
| Male | 35 (48.61) | 44 (52.38) |
|
|
|
Female | 37 (51.39) | 40 (47.62) |
|
|
| Age (years) |
|
|
| 0.626 |
| ≥60 | 45 (62.50) | 49 (58.33) |
|
|
|
<60 | 27 (37.50) | 35 (41.67) |
|
|
| Smoking |
|
|
| 0.630 |
| Yes | 35 (48.61) | 45 (52.38) |
|
|
| No | 37 (51.39) | 39 (47.62) |
|
|
| Alcoholism |
|
|
| 0.703 |
| Yes | 15 (20.83) | 20 (23.81) |
|
|
| No | 57 (79.17) | 64 (76.19) |
|
|
| TC mmol/l | 1.62±0.85 | 1.58±0.77 | 0.308 | 0.758 |
| TG mmol/l | 4.68±0.92 | 4.72±0.84 | 0.284 | 0.777 |
| HDL-C mmol/l | 1.29±0.32 | 1.32±0.28 | 0.625 | 0.533 |
| LDL-C mmol/l | 2.24±0.74 | 2.29±0.61 | 0.463 | 0.644 |
| Lpa mg/l | 263.60±56.50 | 225.80±57.40 | 4.130 | 0.001 |
| FBG mmol/l | 5.74±1.35 | 5.63±0.99 | 0.585 | 0.559 |
| HbA1c % | 6.35±1.00 | 6.23±0.95 | 0.768 | 0.444 |
| hs-CRP mg/l | 5.54±2.57 | 3.76±2.41 | 4.460 | 0.001 |
| Scr umol/l | 73.50±16.40 | 60.30±15.60 | 5.145 | 0.001 |
Comparison of the CD69 expression at
different time-points between groups
The CD69 expression in groups was detected with flow
cytometry. Through comparison of the CD69 expression before
operation, at 5 min, 2 h and 6 months after operation and at
different time in the same group between the two groups, it was
found that there was no significant difference in the CD69
expression before and at 5 min after operation in patients between
group A and group B (P>0.05), but a statistical difference at 2
h after operation between them that was significantly decreased in
group A (P<0.05), and a difference at 6 months after operation
in patients between group A and group B (P<0.05). Through
pairwise comparison, it was found that there was a difference in
the CD69 expression between group A and group B and it
significantly decreased (P<0.05), there was no difference
between group A and group C (P>0.05), and group B was
significantly higher than that in group C (P<0.05). There was a
difference in the CD69 expression at different time-points in
patients in group A (P<0.05). It significantly decreased before
operation when compared with that at 5 min after operation, and
significantly increased when compared with that at 6 months after
operation, and there was a difference between groups (P<0.05),
but no difference when compared with that at 2 h after operation in
group A (P>0.05); there was a difference in the CD69 expression
at 5 min after operation when it significantly increased and at 2 h
and 6 months after operation in group A (P<0.05), and a
difference between at 2 h after operation when it was significantly
increased and at 6 months after operation in group A (P<0.05).
There were differences in the CD69 expression at different
time-points in patients in group B (P<0.05). The CD69 expression
significantly decreased before operation when compared with that at
5 min and 2 h after operation in group B (P<0.05), and
significantly increased when compared with that at 6 months after
operation, and there was a difference between groups (P<0.05);
there was a difference in the CD69 expression between at 5 min
after operation when it significantly increased and at 6 months
after operation in group B (P<0.05), but no difference when
compared with that at 2 h after operation (P>0.05), and there
was a difference between 2 h after operation when it significantly
increased and at 6 months after operation in group B (P<0.05)
(Fig. 1).
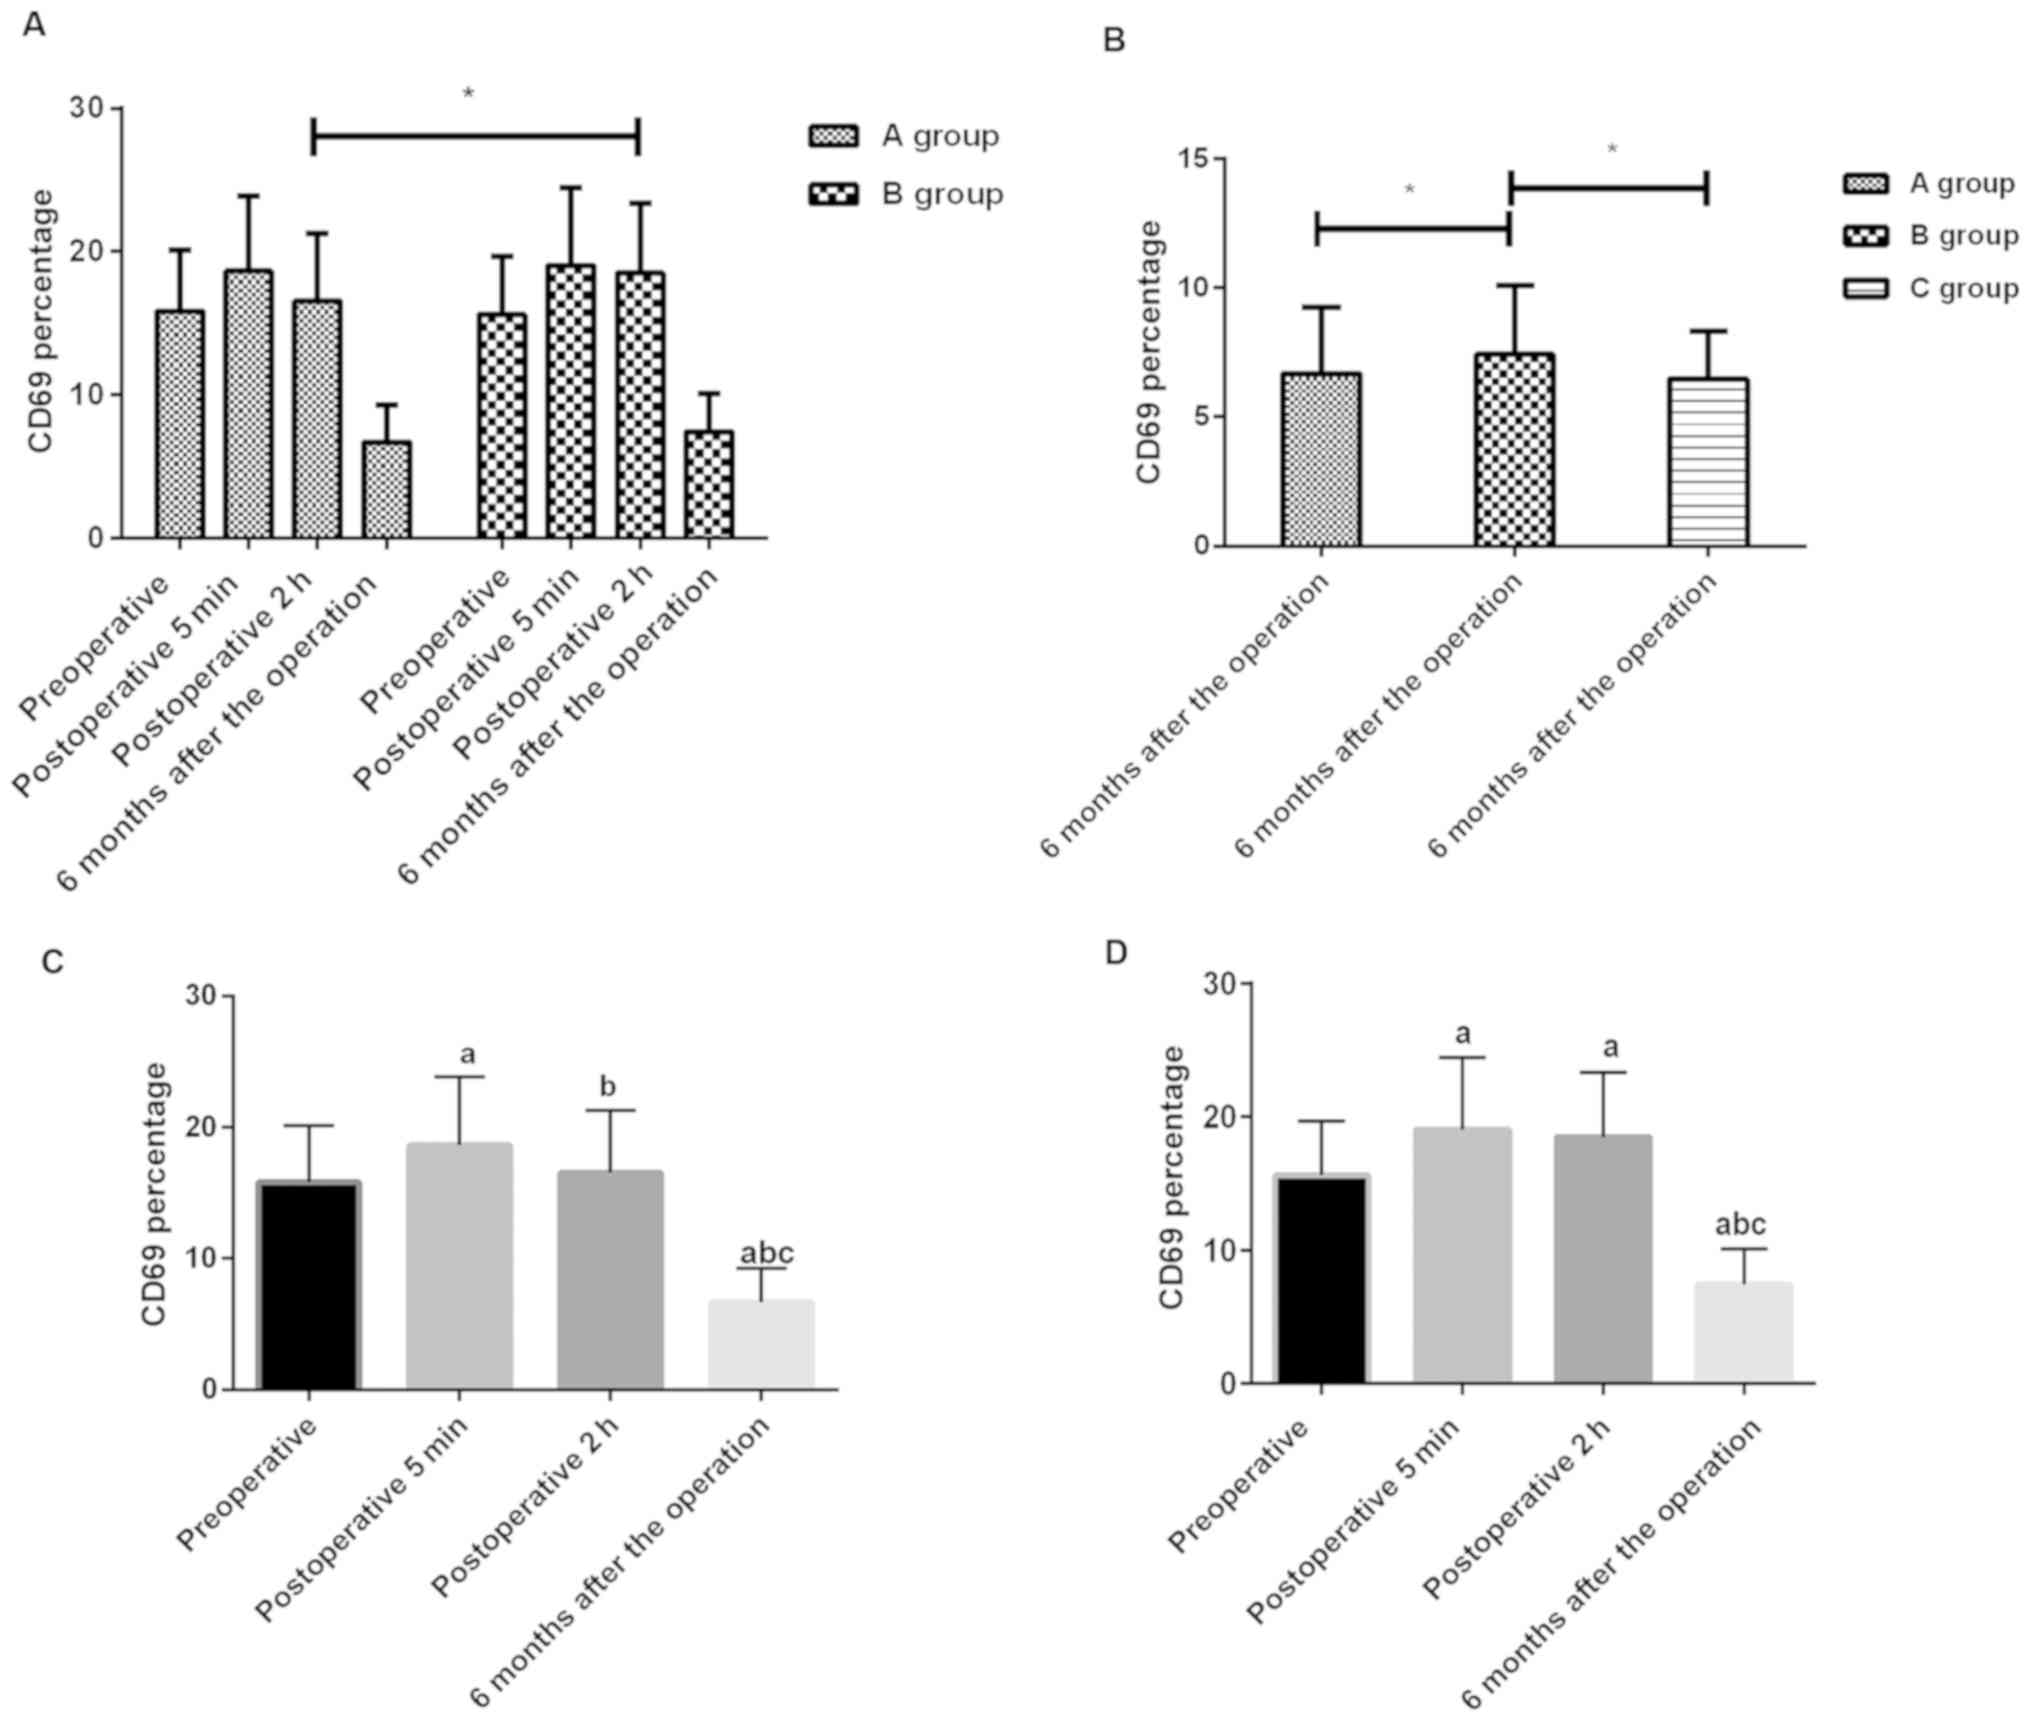 | Figure 1.(A) CD69 expression at different
time-points in group A and group B. Detection of flow cytometry
found that there was no significant difference in the CD69
expression before and at 5 min after operation in patients between
group A and group B (P>0.05), but a statistical difference
between them at 2 h after operation in group A was significantly
lower (P<0.05). (B) CD69 expression at 6 months after operation
in group A, B and C. Detection of flow cytometry found that there
was a difference in the CD69 expression at 6 months after operation
in patients between group A, group B and group C (P<0.05).
Through pairwise comparison, it was found that there was a
difference in the CD69 expression between group A and group B and
it significantly decreased (P<0.05), but no difference between
group A and group C (P>0.05), and group B was higher than that
in group C (P<0.05). *P<0.05. (C) There were differences in
the CD69 expression at different time-points in patients in group A
(P<0.05). The CD69 expression decreased before operation when
compared with that at 5 min after operation, and increased when
compared with that at 6 months after operation, and there was a
difference between groups (P<0.05), but no difference when
compared with that at 2 h after operation in group A (P>0.05);
there was a difference in the CD69 expression at 5 min after
operation when it significantly increased and at 2 h and 6 months
after operation in group A (P<0.05), and a difference between 2
h after operation when it significantly increased and at 6 months
after operation in group A (P<0.05). (D) There were differences
in the CD69 expression at different time-points in patients in
group B (P<0.05). The CD69 expression decreased before operation
when compared with that at 5 min and 2 h after operation in group B
(P<0.05), and increased when compared with that at 6 months
after operation, and there was a difference between groups
(P<0.05); there was a difference in the CD69 expression between
5 min after operation when it significantly increased and at 6
months after operation in group B (P<0.05), but no difference
when compared with that at 2 h after operation (P>0.05), and
there was a difference between 2 h after operation when it
significantly increased and at 6 months after operation in group B
(P<0.05). a, represents that there is a difference when compared
with before operation (P<0.05); b, represents that there is a
difference when compared with 5 min after operation (P<0.05);
and c, represents that there is a difference when compared with 2 h
after operation. |
Comparison of the EGR1 expression at
different time-points between groups
The EGR1 expression in groups was detected with
RT-qPCR. Through comparison of the EGR1 expression before
operation, at 5 min, 2 h and 6 months after operation between the
two groups, it was found that there was no significant difference
in the EGR1 expression before and at 5 min after operation in
patients between group A and group B (P>0.05), but a statistical
difference between them in it that at 2 h after operation in group
A was significantly higher than that in group B (P<0.05), and a
difference in it at 6 months after operation in patients between
group A, group B and group C (P<0.05). Through pairwise
comparison, it was found that the EGR1 expression in group A was
significantly higher than that in group B (P<0.05), and it in
group B was significantly lower than that in group C (P<0.05),
and there was no difference between group A and group C
(P>0.05). There were differences in the EGR1 expression at
different time-points in patients in group B (P<0.05). It
significantly decreased before operation when compared with that at
5 min after operation, and significantly increased at 2 h after
operation when compared with that at 6 months after operation, and
there was a difference between groups (P<0.05); there was a
difference in the EGR1 expression between 5 min after operation
when it significantly decreased and at 2 h, 6 months after
operation in group A (P<0.05), and a difference between 2 h
after operation when it significantly decreased and at 6 months
after operation in group A (P<0.05). There were differences in
the EGR1 expression at different time-points in patients in group B
(P<0.05). It significantly decreased before operation when
compared with that at 2 h and 6 months after operation in group B
(P<0.05), and significantly increased when compared with that at
5 min after operation, and there was a difference between groups
(P<0.05); there was a difference in the EGR1 expression between
5 min after operation when it significantly decreased and at 2 h, 6
months after operation in group B (P<0.05), and a difference
between at 2 h after operation when it significantly decreased and
at 6 months after operation in group B (P<0.05) (Fig. 2).
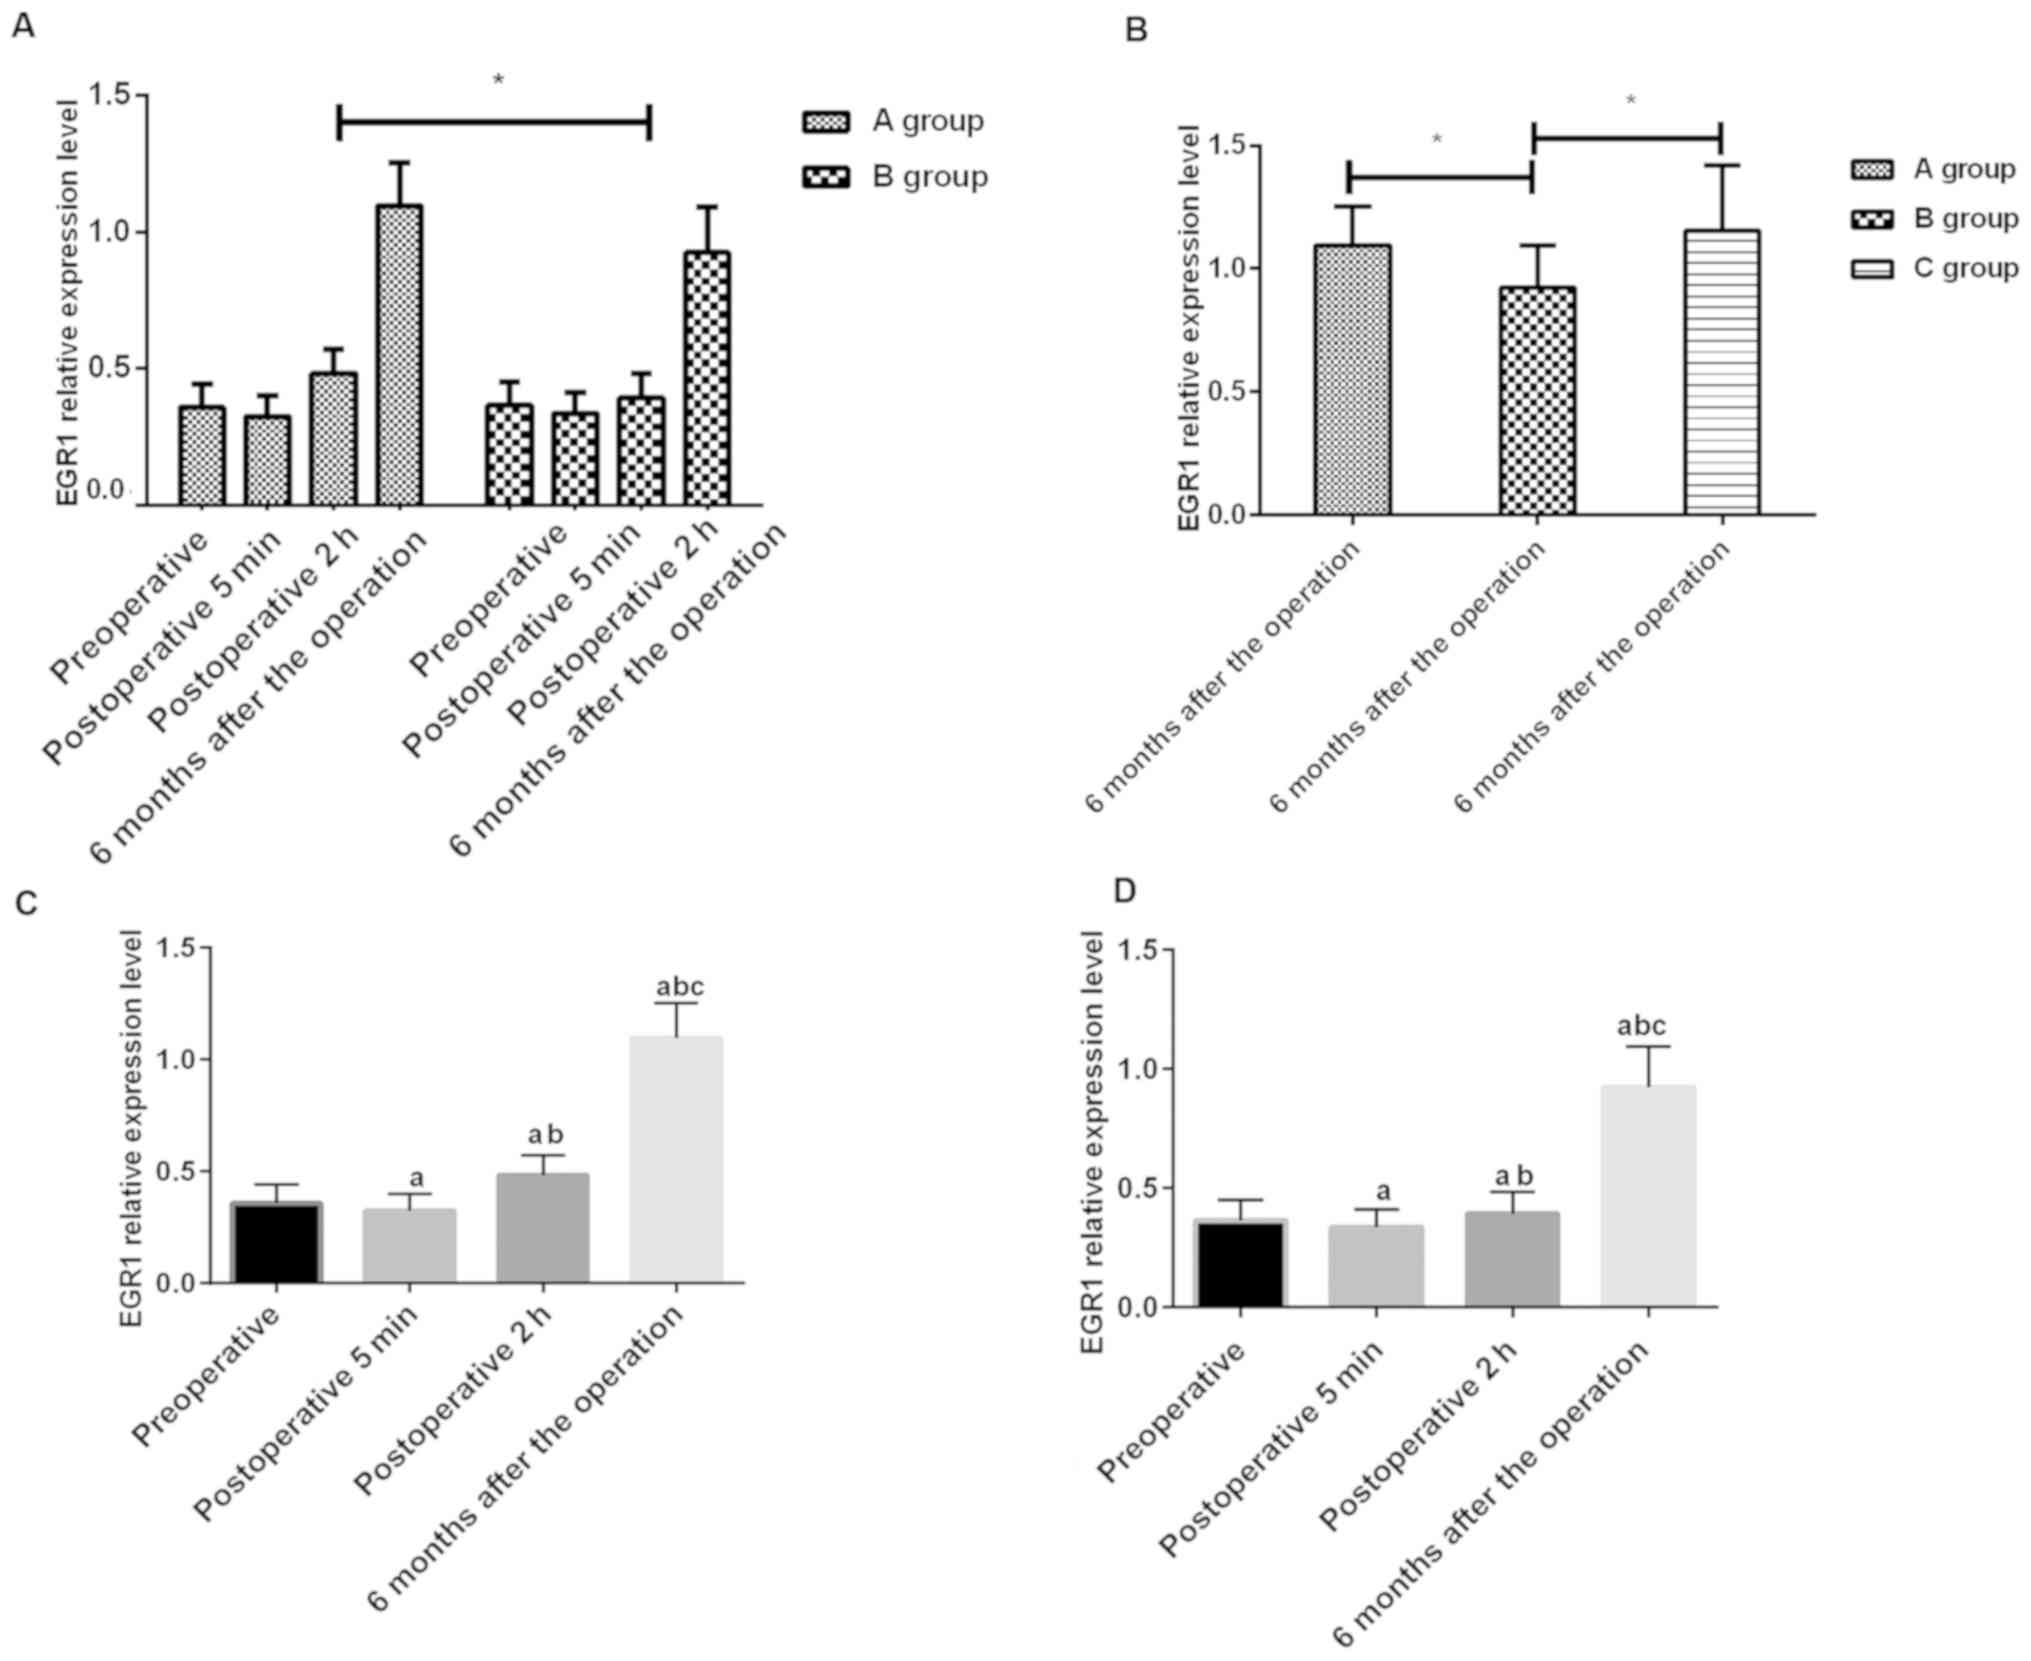 | Figure 2.(A) EGR1 expression at different
time-points in group A and group B. Detection of RT-qPCR found that
there was no significant difference in the EGR1 expression before
and at 5 min after operation in patients between group A and group
B (P>0.05), but a statistical difference between them at 2 h
after operation in group A was significantly lower (P<0.05). (B)
EGR1 expression at 6 months after operation in group A, B and C.
Detection of RT-qPCR found that there was a difference in the EGR1
expression at 6 months after operation in patients between group A,
group B and group C (P>0.05). Through pairwise comparison, it
was found that there was a difference in the EGR1 expression
between group A and group B and it significantly increased
(P<0.05), but no difference between group A and group C
(P>0.05), and group B was higher than that in group C
(P<0.05). *P<0.05. (C) There were differences in the EGR1
expression at different time-points in patients in group B
(P<0.05). It decreased before operation when compared with that
at 5 min after operation, and increased at 2 h after operation when
compared with that at 6 months after operation, and there was a
difference between groups (P<0.05); there was a difference in
the EGR1 expression between 5 min after operation when it
significantly decreased and at 2 h, 6 months after operation in
group A (P<0.05), and a difference between at 2 h after
operation when it significantly decreased and at 6 months after
operation in group A (P<0.05). (D) There were differences in the
EGR1 expression at different time-points in patients in group B
(P<0.05). It decreased before operation when compared with that
at 2 h and 6 months after operation in group B (P<0.05), and
increased when compared with that at 5 min after operation, and
there was a difference between groups (P<0.05); there was a
difference in the EGR1 expression between 5 min after operation
when it significantly decreased and at 2 h, 6 months after
operation in group B (P<0.05), and a difference between 2 h
after operation when it significantly decreased and at 6 months
after operation in group B (P<0.05). a, represents that there is
a difference when compared with before operation (P<0.05); b,
represents that there is a difference when compared with 5 min
after operation (P<0.05); and c, represents that there is a
difference when compared with 2 h after operation. |
Correlation analysis
Through inclusion of Lpa, hs-CRP, Scr, CD69 and
EGR1, logistic multivariate analysis found that CD69 (OR=6.424,
P=0.025) and EGR1 (OR=3.684, P=0.013) were independent risk factors
for patients after undergoing PCI (Table III).
| Table III.Logistic regression analysis. |
Table III.
Logistic regression analysis.
| Variables | Regression
coefficient | SD | P-value | OR | 95% CI |
|---|
| CD69 | 1.94 | 0.54 | 0.025 | 6.424 | 3.585–12.517 |
| EGR1 | 1.64 | 0.44 | 0.013 | 3.684 | 1.598–11.584 |
| Lpa | 1.25 | 0.18 | 0.084 | 2.849 | 2.154–3.484 |
| hs-CRP | 1.36 | 0.21 | 0.184 | 3.251 | 2.658–3.894 |
| Scr | 1.84 | 0.36 | 0.098 | 4.251 | 3.548–4.846 |
Discussion
With the development of society, the increasing
incidence of CHD disease has posed a serious threat to people's
lives and health, and the number of deaths due to CHD in Western
countries accounts for 30% of the total number and 50% or more of
cardiovascular deaths (13). The
mortality of CHD has gradually declined year by year, despite the
mandatory intervention of risk factors and effective secondary
prevention, but it still remains one of the most common causes of
death in the world. Studies have shown that the number of death due
to CHD exceeds that of all tumors, ranking first in the cause of
death (14). The main cause of CHD
is due to the formation of atherosclerosis on which chronic
inflammation has an induced effect. The report of Zhou et al
(15) showed that inflammatory
stimuli can accelerate the formation of atherosclerosis.
In recent years, ideal progress has been made in the
treatment of CHD owing to the explosive development of medical
level and equipment (16). As a main
method for the treatment of CHD patients in clinic currently,
compared with previous surgeries, PCI has a clear treatment
advantage that causes less harm to patients and can reach directly
to the lesions (17). However,
patients treated with PCI will undergo no-reflow phenomenon that
will lower the blood flow rate in the coronary artery, and more
serious blood flow obstruction, which makes it unable to achieve
the desired effect on the patient during the administration method.
The occurrence of no-reflow has a serious effect on the patient's
treatment effect and prognosis. However, there is no clear
statement about the occurrence of no-reflow phenomenon after PCI
(18). Some studies (19) have proposed that no-reflow is caused
by the participation of multiple factors, among which the main ones
are gene regulation and leukocyte aggregation.
In this study, through detection of the expression
of CD69 and EGR1 at different time-points in PCI patients, it was
found that there was no significant difference in the CD69
expression before and at 5 min after operation in patients between
group A and group B, but at 2 h after operation in patients in
group A was significantly lower than that in group B, suggesting
that the CD69 expression may be related to the patient's reflow
status. As one of the phytohemagglutinin-like receptor family
members that activate the early leukocyte receptor, CD69 can
express rapidly after activation and be detected on the surface of
different activated leukocyte subset. CD69 regulates the synthesis,
differentiation and inflammatory response of cells. For example,
CD69-deficient mouse can cause acute onset of collagen-induced
arthritis due to the overreaction of T-cell and B-cell to collagen
(20). Therefore, we speculated that
the overexpression of CD69 may be due to the accumulation of white
blood cells in patients with no-reflow after PCI. Patients in group
A, group B and normal control group (group C) were detected at 6
months after operation. There was a difference in the CD69
expression between group A in which it was significantly decreased
and group B, and a difference between group B and group C, but no
difference in patients between group A and group C. Thus, we can
initially demonstrate that there is a certain association between
CD69 and the patient's reflow status. In addition, detection of the
EGR1 expression in plasma of patients found that there was no
difference in the EGR1 expression before and at 5 min after
operation when it decreased between group A and group B, but at 2 h
after operation in group A was significantly higher than that in
group B. EGR1, which is widely expressed in human cells and has the
ability to express rapidly, belongs to the immediate early family
members that have a high homology (21).
Studies have shown that the EGR1 expression plays a
key role in cell proliferation, cell differentiation and
inflammatory response in signal pathways. For example, EGR-1 can
induce the expression of T-cell growth factor, IL-2 and TNF-α, and
TNF-α has an important effect on the body's emergency defense
response and anti-infection non-specific cellular immune response
(22). The damaged blood vessels
need to be reconstructed in the course of PCI, and the damage of
coronary endothelial cells causes massive release of inflammatory
factors (23), while the EGR1
expression may increase due to regulation of the release of
inflammatory factors. Through comparison between CD69 and EGR1 in
blood of patients in the two groups at 6 months after operation
compared with those in the same period, it was found that there was
a difference between them. There was no difference in the
expression of CD69 and EGR1 in patients between group A and group
C, suggesting that the recovery of the patients after operation was
good, and there was a difference in patients between group B in
which they increased and group C. Through longitudinal comparison
of the expression of CD69 and EGR1 in the two groups of patients,
it was found that indicators of them gradually returning to normal
levels over time, and there was a difference in patients between
group A in which the recovery was better than group B. Therefore,
logistic regression analysis of CD69 and EGR1 revealed that they
are independent risk factors for patients with or without reflow
after operation, which also proved the importance of CD69 and EGR1
in PCI operation.
However, there are some flaws in this study. First
of all, only detection of the EGR1 expression was performed, but
detection and prediction of downstream regulated genes were not
performed. The way in which EGR1 regulated its factors was unknown
to us, and the number of patients in this study was relatively
small and did not play a representative role. Therefore, we hope to
increase the number of samples in future studies, predict the
target genes through dual luciferase reporters, and increase the
number of detection items to further validate the results of this
study, thus obtaining more results to corroborate this
conclusion.
In conclusion, after undergoing PCI in CHD patients,
if there was an increase in CD69 level and a significant decrease
in EGR1 level in the early postoperative period, the patient may be
suspected of having no-reflow and checked in time to improve the
patient's therapeutic effect.
Acknowledgements
Not applicable.
Funding
No funding was received.
Availability of data and materials
The datasets used and/or analyzed during the present
study are available from the corresponding author on reasonable
request.
Authors' contributions
YX drafted the manuscript. YX and JP were mainly
devoted to collecting and interpreting the data. YX, JP, QL and CG
revised the manuscript. JP and QL were responsible for the concept
and design of the study. All authors read and approved the final
manuscript.
Ethics approval and consent to
participate
The study was approved by the Ethics Committee of
People's Hospital of Hunan Province (Changsha, China). Signed
informed consents were obtained from the patients or the
guardians.
Patient consent for publication
Not applicable.
Competing interests
The authors declare that they have no competing
interests.
References
|
1
|
Liu L, Mizushima S, Ikeda K, Nara Y and
Yamori Y; Cardiovascular Disease and Alimentary Comparison Study
Group, : Resting heart rate in relation to blood pressure: Results
from the World Health Organization-Cardiovascular Disease and
Alimentary Comparison study. Int J Cardiol. 145:73–74. 2010.
View Article : Google Scholar : PubMed/NCBI
|
|
2
|
Gillum RF, Mussolino ME and Madans JH:
Diabetes mellitus, coronary heart disease incidence, and death from
all causes in African American and European American women: The
NHANES I epidemiologic follow-up study. J Clin Epidemiol.
53:511–518. 2000. View Article : Google Scholar : PubMed/NCBI
|
|
3
|
Pradhan AD, Manson JE, Rossouw JE,
Siscovick DS, Mouton CP, Rifai N, Wallace RB, Jackson RD, Pettinger
MB and Ridker PM: Inflammatory biomarkers, hormone replacement
therapy, and incident coronary heart disease: Prospective analysis
from the Women's Health Initiative observational study. JAMA.
288:980–987. 2002. View Article : Google Scholar : PubMed/NCBI
|
|
4
|
Pedersen TR, Kjekshus J, Berg K, Haghfelt
T, Faergeman O, Faergeman G, Pyörälä K, Miettinen T, Wilhelmsen L,
Olsson AG, et al: Scandinavian Simvastatin Survival Study Group:
Randomised trial of cholesterol lowering in 4444 patients with
coronary heart disease: The Scandinavian Simvastatin Survival Study
(4S). 1994. Atheroscler Suppl. 5:81–87. 2004. View Article : Google Scholar : PubMed/NCBI
|
|
5
|
Sattelmair J, Pertman J, Ding EL, Kohl HW
III, Haskell W and Lee IM: Dose response between physical activity
and risk of coronary heart disease: A meta-analysis. Circulation.
124:789–795. 2011. View Article : Google Scholar : PubMed/NCBI
|
|
6
|
The L ancet: 40 years of percutaneous
coronary intervention: Where next? Lancet. 390:7152017. View Article : Google Scholar : PubMed/NCBI
|
|
7
|
Mottillo S, Filion KB, Joseph L and
Eisenberg MJ: Defining optimal activated clotting time for
percutaneous coronary intervention: A systematic review and
Bayesian meta-regression. Catheter Cardiovasc Interv. 89:351–366.
2017. View Article : Google Scholar : PubMed/NCBI
|
|
8
|
Takamura S, Yagi H, Hakata Y, Motozono C,
McMaster SR, Masumoto T, Fujisawa M, Chikaishi T, Komeda J, Itoh J,
et al: Specific niches for lung-resident memory CD8+ T
cells at the site of tissue regeneration enable CD69-independent
maintenance. J Exp Med. 213:3057–3073. 2016. View Article : Google Scholar : PubMed/NCBI
|
|
9
|
Duclot F and Kabbaj M: The role of early
growth response 1 (EGR1) in brain plasticity and neuropsychiatric
disorders. Front Behav Neurosci. 11:352017. View Article : Google Scholar : PubMed/NCBI
|
|
10
|
Patel MR, Bailey SR, Bonow RO, Chambers
CE, Chan PS, Dehmer GJ, Kirtane AJ, Samuel Wann L, Parker Ward R,
Douglas PS, et al: Diagnostic Catheterization Writing Group;
Technical Panel; Appropriate Use Criteria Task Force:
ACCF/SCAI/AATS/AHA/ASE/ASNC/HFSA/HRS/SCCM/SCCT/SCMR/STS 2012
appropriate use criteria for diagnostic catheterization: A report
of the American College of Cardiology Foundation Appropriate Use
Criteria Task Force, Society for Cardiovascular Angiography and
Interventions, American Association for Thoracic Surgery, American
Heart Association, American Society of Echocardiography, American
Society of Nuclear Cardiology, Heart Failure Society of America,
Heart Rhythm Society, Society of Critical Care Medicine, Society of
Cardiovascular Computed Tomography, Society for Cardiovascular
Magnetic Resonance, Society of Thoracic Surgeons. J Thorac
Cardiovasc Surg. 144:39–71. 2012. View Article : Google Scholar : PubMed/NCBI
|
|
11
|
Vandesompele J, De Preter K, Pattyn F,
Poppe B, Van Roy N, De Paepe A and Speleman F: Accurate
normalization of real-time quantitative RT-PCR data by geometric
averaging of multiple internal control genes. Genome Biol.
3:research00342002. View Article : Google Scholar : PubMed/NCBI
|
|
12
|
Shi XQ, Guo WC, Wan PJ, Zhou LT, Ren XL,
Ahmat T, Fu KY and Li GQ: Validation of reference genes for
expression analysis by quantitative real-time PCR in
Leptinotarsa decemlineata (Say). BMC Res Notes. 6:932013.
View Article : Google Scholar : PubMed/NCBI
|
|
13
|
Benjamin EJ, Blaha MJ, Chiuve SE, Cushman
M, Das SR, Deo R, de Ferranti SD, Floyd J, Fornage M, Gillespie C,
et al: American Heart Association Statistics Committee and Stroke
Statistics Subcommittee: Heart Disease and Stroke Statistics-2017
Update: A Report from the American Heart Association. Circulation.
135:e146–e603. 2017. View Article : Google Scholar : PubMed/NCBI
|
|
14
|
Carney RM and Freedland KE: Depression and
coronary heart disease. Nat Rev Cardiol. 14:145–155. 2017.
View Article : Google Scholar : PubMed/NCBI
|
|
15
|
Zhou Y, Cao ZQ, Wang HY, Cheng YN, Yu LG,
Zhang XK, Sun Y and Guo XL: The anti-inflammatory effects of Morin
hydrate in atherosclerosis is associated with autophagy induction
through cAMP signaling. Mol Nutr Food Res. 61:612017. View Article : Google Scholar
|
|
16
|
Kotseva K, Wood D, De Bacquer D, De Backer
G, Rydén L, Jennings C, Gyberg V, Amouyel P, Bruthans J, Castro
Conde A, et al: EUROASPIRE Investigators: EUROASPIRE IV: A European
Society of Cardiology survey on the lifestyle, risk factor and
therapeutic management of coronary patients from 24 European
countries. Eur J Prev Cardiol. 23:636–648. 2016. View Article : Google Scholar : PubMed/NCBI
|
|
17
|
De Bruyne B, Fearon WF, Pijls NH, Barbato
E, Tonino P, Piroth Z, Jagic N, Mobius-Winckler S, Rioufol G, Witt
N, et al: FAME 2 Trial Investigators: Fractional flow
reserve-guided PCI for stable coronary artery disease. N Engl J
Med. 371:1208–1217. 2014. View Article : Google Scholar : PubMed/NCBI
|
|
18
|
Akpek M, Sahin O, Sarli B, Baktir AO,
Saglam H, Urkmez S, Ergin A, Oguzhan A, Arinc H and Kaya MG: Acute
effects of intracoronary tirofiban on no-reflow phenomena in
patients with ST-segment elevated myocardial infarction undergoing
primary percutaneous coronary intervention. Angiology. 66:560–567.
2015. View Article : Google Scholar : PubMed/NCBI
|
|
19
|
Huang GY, Yang LJ, Wang XH, Wang YL, Xue
YZ and Yang WB: Relationship between platelet-leukocyte aggregation
and myocardial perfusion in patients with ST-segment elevation
myocardial infarction after primary percutaneous coronary
intervention. Heart Lung. 45:429–433. 2016. View Article : Google Scholar : PubMed/NCBI
|
|
20
|
Hofmann M, Oschowitzer A, Kurzhals SR,
Krüger CC and Pircher H: Thymus-resident memory CD8+ T
cells mediate local immunity. Eur J Immunol. 43:2295–2304. 2013.
View Article : Google Scholar : PubMed/NCBI
|
|
21
|
Zhu QB, Unmehopa U, Bossers K, Hu YT,
Verwer R, Balesar R, Zhao J, Bao AM and Swaab D: MicroRNA-132 and
early growth response-1 in nucleus basalis of Meynert during the
course of Alzheimer's disease. Brain. 139:908–921. 2016. View Article : Google Scholar : PubMed/NCBI
|
|
22
|
Qin X, Wang Y and Paudel HK: Early growth
response 1 (Egr-1) is a transcriptional activator of β-secretase 1
(BACE-1) in the brain. J Biol Chem. 291:22276–22287. 2016.
View Article : Google Scholar : PubMed/NCBI
|
|
23
|
Kreuger J and Phillipson M: Targeting
vascular and leukocyte communication in angiogenesis, inflammation
and fibrosis. Nat Rev Drug Discov. 15:125–142. 2016. View Article : Google Scholar : PubMed/NCBI
|


