Introduction
Oral squamous cell carcinoma (OSCC) is one of the
most common types of malignancy of the head and neck, and
>500,000 new cases are diagnosed with OSCC each year (1). The improvement of the clinical
therapeutic methods has not brought any marked parallel improvement
of the prognosis of OSCC, as the 5-year overall survival (OS) rate
of OSCC only increased from 63 to 65% in the past 8 years (1–3).
Elucidation of the underlying mechanisms of OSCC development may
provide promising biomarkers or therapeutic targets, which may lead
to improvement of the diagnosis, prognosis and therapy of OSCC.
Gene expression microarray and gene chip are
efficient and large-scale detection techniques, which are commonly
used to monitor genome-wide expression levels of genes in a given
organism or cells, and is particularly suitable for screening
differentially expressed genes (DEGs) between two samples (4). Gene chip may provide gene expression
profiles in tumour tissues, and these profiles from diverse
microarray platforms are submitted to several public databases,
including Gene Expression Omnibus (GEO; http://www.ncbi.nlm.nih.gov/geo). Several studies
using gene expression microarray and gene chip have been performed
on OSCC to explore the DEGs. However, due to sample heterogeneity,
there are numerous inconsistencies among the previous studies.
Randhawa and Acharya (5) analyzed
several gene expression profiles to identify key genes associated
with progression of OSCC stages. Zhao et al (6) identified three candidate genes
associated with survival of OSCC. Wang et al (7) analyzed two databases to screen out
differentially expressed genes of OSCC. However, as the different
databases selected in different analysis, the DEGs screened was
distinct. Furthermore, the previous studies have not taken ethnic
differences into consideration, actually, many studies have proved
the ethnic differences may has relevance with disease gene
expression profile (8,9). The integration and bioinformatics
analysis of multiple expression profiles from different sources may
cancel out the differences caused by sample heterogeneity and more
reliably predict/confirm universal DEGs associated with OSCC
development.
In the present study, four original gene expression
profiles, GSE37991 (10), GSE23558
(11), GSE30784 (12) and GSE56532, were obtained from the
GEO database. These four profiles contained a total of 244 OSCC
samples and 95 normal oral mucosa samples. The DEGs between OSCC
and normal oral mucosa were screened. Gene Ontology (GO) enrichment
analysis and Kyoto Encyclopedia of Genes and Genomes (KEGG)
enrichment analysis were performed using an online toolset.
Subsequently, the protein-protein interaction (PPI) network was
established, and the key candidate DEGs were identified and further
verified. These key DEGs may serve as potential biomarkers for
early diagnosis or as promising targets for the treatment of
OSCC.
Materials and methods
Gene expression profile information
and identification of DEGs
The GEO database was searched using the following
criteria: Search term, ‘OSCC’; study type, ‘Expression profiling by
array’; publication dates, 2010/1/1-2018/11/21; sample count,
>10. Four datasets, GSE37991, GSE30784, GSE23558 and GSE56532,
were included in the present analysis. The dataset GSE37991 was
based on GPL6883 platform (Illumina HumanRef-8 v3.0 expression
beadchip) and included 167 OSCC samples and 45 normal oral mucosa
samples (submission year, 2012; year of last update, 2017)
(10). The dataset GSE23558 was
based on GPL6480 platform and included 27 OSCC samples and 4 oral
mucosa samples (submission date, 2010; last update, 2018) (11). The GSE30784 dataset, based on the
GPL570 platform (Affymetrix U133 2.0 Plus Gene Chip arrays),
included 167 OSCC samples and 45 normal oral mucosa samples
(submission date, 2011; last update, 2018) (12). The GSE56532, based on GPL10739,
included 10 OSCC samples and 6 normal oral mucosa samples
(submission date, 2014; last update, 2014). These 4 gene expression
profiles were respectively from different regions, including North
America, Australia, China and India, thus averting the differences
caused by sample heterogeneity of single profiles and revealing
universal DEGs that apply to different ethnic groups, as it has
been reported that ethnic difference may affect disease-associated
gene expression profiles (8,9). The raw data were downloaded as MINiML
files and screened with the limma package in R (version 3.2.5;
http://www.r-project.org/) and
subsequently, the log2 of the fold change (logFC) was
calculated to screen DEGs between OSCC and normal oral mucosa
tissues. |logFC|>2 and adjusted P-value <0.05 were set as the
cut-off criteria.
Furthermore, the human OSCC data were downloaded
from The Cancer Genome Atlas (TCGA) database (https://cancergenome.nih.gov/; accession date, 21 Nov.
2018) and analyzed using UALCAN (http://ualcan.path.uab.edu/index.html) (13).
GO and pathway enrichment analyses of
DEGs
The Database for Annotation, Visualization and
Integrated Discovery (DAVID; http://david.ncifcrf.gov/home.jsp) is a bioinformatics
database that integrates biological data and data mining tools to
provide systematic, integrated biometric annotation information for
large lists of genes or proteins. GO analysis and KEGG pathway
enrichment of DEGs were performed using DAVID to identify the GO
terms in the categories biological process, cellular component,
molecular function, as well as the signaling pathways of the DEGs
involved. P<0.05 was considered to indicate statistical
significance.
PPI network construction and
identification of candidate genes
The Search Tool for the Retrieval of Interacting
Genes and Proteins (STRING; http://string-db.org) is a biological database for
searching known and predicted protein-protein interactions
(14). In the present study, STRING
was used to build PPI networks. The minimum required interaction
score was set to medium confidence (0.4) and the organism to
Homo sapiens (hsa), and Cytoscape software was then used to
visualize the network (15).
Cytoscape CentiScape (http://apps.cytoscape.org/apps/centiscape) was used to
screen key proteins in the network with a degree centrality of ≥4
set as the criterion.
Validation of the key candidate
DEGs
UALCAN (http://ualcan.path.uab.edu/index.html) is used for
analyzing cancer transcriptome data. By in-depth analyses of TCGA
gene expression data, UALCAN may provide the expression of multiple
genes in different tumour types and the association between genes
and prognosis (13). The candidate
key genes were submitted to the UCLAN database, and the TCGA data
(accession date, 21 Nov. 2018) were used to verify the association
between the expression of these genes and the prognosis of
OSCC.
Expression of plasminogen activator,
urokinase (PLAU), integrin subunit α 3 (ITGA3) and secreted
phosphoprotein 1 (SPP1) in different tumour types
In order to determine whether the key genes
identified have any specific roles in OSCC development, the
Oncomine database (https://www.oncomine.org) was used to compare the
expression of PLAU, ITGA3 and SPP1 in head and neck SCC (HNSCC),
head and neck adenoid cystic carcinoma, esophageal SCC and
esophageal adenocarcinoma (ACC), respectively. The filters were set
as follows: i) Gene: PLAU or SPP1 or ITGA3. ii) Analysis type:
Cancer vs. normal. iii) Cancer type: Oral cavity SCC, salivary
gland adenoid cystic carcinoma, esophageal SCC or esophageal ACC.
iv) Sample type: Clinical specimen. v) Data type: mRNA. vi)
Threshold settings: P<1×10⁻⁴; FC>2; gene rank, top
10%.
SPP1, ITGA3 and PLAU knockdown by
lentiviral infection
The lentiviral vectors (Lv)-small hairpin RNA
targeting SPP1 (Lv-shSPP1), Lv-shITGA3, Lv-PLAU and negative
control (Lv-sh-NC) were purchased from Genechem Co., Ltd. (Genechem
Co., Ltd, Shanghai, China). CAL-27 cells were purchased from
American Type Culture Collection (Manassas, VA, US) and were
cultured in Dulbecco's modified Eagle's medium (Invitrogen; Thermo
Fisher Scientific, Inc., Waltham, MA, USA) with 10% fetal bovine
serum (Invitrogen; Thermo Fisher Scientific, Inc.) at 37°C with 5%
CO2. Cells were seeded in six-well plates at a density
of 50,000 cells/well. After the cells attached for 24 h, the
Lv-sh-SPP1, Lv-sh-ITGA3, Lv-sh-PLAU or negative control was added
to the cells at a multiplicity of infection of 15 with 5 µl
polybrene (Sigma-Aldrich; Merck KGaA, Darmstadt, Germany) to
increase the efficiency of infection. After 96 h, the cells
transfected with the Lv vectors were selected with 1 µg/ml
puromycin and the transfection efficiency was then observed under a
fluorescence microscope to count the rate of green fluorescent
protein-positive cells (Supplementary Fig. S1). RNA was extracted and the SPP1,
ITGA and PLAU were detected using reverse
transcription-quantitative polymerase chain reaction (RT-qPCR) to
verify the knockdown of SPP1, ITGA and PLAU.
RNA extraction and RT-qPCR
CAL-27 cells with Lv-sh-SPP1, Lv-sh-ITGA3,
Lv-sh-PLAU, LV-sh-NC or Cal-27 cells without transfection were
seeded into 6-well plates at a density of 50,000 cells/well. After
48 h, total RNA was extracted using TRIzol reagent (Invitrogen;
Thermo Fisher Scientific, Inc.) and reverse-transcribed into
complementary (cDNA) using a RevertAid First Strand cDNA Synthesis
kit (Thermo Fisher Scientific, Inc.) according to manufacturer's
protocol. Real-time qPCR was performed using a Power SYBR Green PCR
Master Mix kit (Applied Biosystems; Thermo Fisher Scientific, Inc.)
according to manufacturer's protocol. The primers were as follows:
SPP1 forward, 5′-TTCTGATTGGGACAGCCGTG-3′ and reverse,
5′-TCTCATCATTGGCTTTCCGCT-3′; ITGA3 forward,
5′-TCAAATGGTTACCCTGTGC-3′ and reverse, 5′-ACTGTTTCCTTTCCCTCC-3′;
PLAU forward, 5′-CCCCGCTTTAAGATTATTGG-3′ and reverse,
5′-CGACCCAGGTAGACGATGTAG-3′. β-actin was used as the housekeeping
reference gene and the primers were as follows: Forward,
5′-CGGGAAATCGTGCGTGAC-3′ and reverse 5′-CAGGCAGCTCGTAGCTCTT-3′. The
two-step PCR was performed as follows: Pre-denaturation at 95°C for
1 min, and 40 cycles of denaturation at 95°C for 5 sec followed by
annealing/extension at 60°C for 20 sec. Absorbance values were read
at the extension stage. The expression levels were quantified
according to the 2−ΔΔCq method as reported previously
(16).
Cell Counting Kit-8 (CCK-8) cell
proliferation assay
CAL-27 cells transfected with the Lv-sh-NC or CAL-27
cells with knockdown of SPP1, PLAU or ITGA3 were seeded into
96-well plates at 1,500 cells/well and incubated for 0, 24, 48 or
72 h. Subsequently, 10 µl CCK-8 stain (Biyuntian, Beijing, China)
was added to each well. Following incubation for another 2 h at
37°C, the absorbance at 450 nm was determined.
Transwell cell migration and invasion
assays
Cell migration and invasion assays were performed in
a Transwell plate (Corning Costar, Corning, NY, USA). For the
Transwell cell migration assay, CAL-27 cells transfected with the
Lv-sh-NC or CAL-27 cells with knockdown of SPP1, PLAU or ITGA3 were
seeded at 1×10⁴ cells/well in serum-free medium in the
upper chambers of the Transwell plate, and the lower chamber
contained the culture medium with 10% fetal bovine serum. The cells
were incubated for 8 h at 37°C and subsequently, cells on the top
surface of the membrane were wiped off. The cells on the bottom
surface of the membrane were then stained with 0.5% crystal violet
(Beijing Solarbio Science & Technology Co., Ltd., Beijing,
China) and examined under a light microscope. Cells from 6 random
fields across three replicate wells were counted. The same
procedure as for the Transwell migration assay was performed for
the Transwell invasion assay, except that the membrane surface in
the upper chambers was coated with 20 µg ECM gel (cat. no. E1270;
Sigma-Aldrich; Merck KGaA).
Statistical analysis
Statistical analysis was performed using SPSS 11.5
for Windows (SPSS, Inc., Chicago, IL, USA). Values are expressed as
the mean ± standard deviation. Differences between multiple groups
were analyzed by one-way analysis of variance and Dunnett's t-test.
P<0.05 was considered to indicate statistical significance.
Results
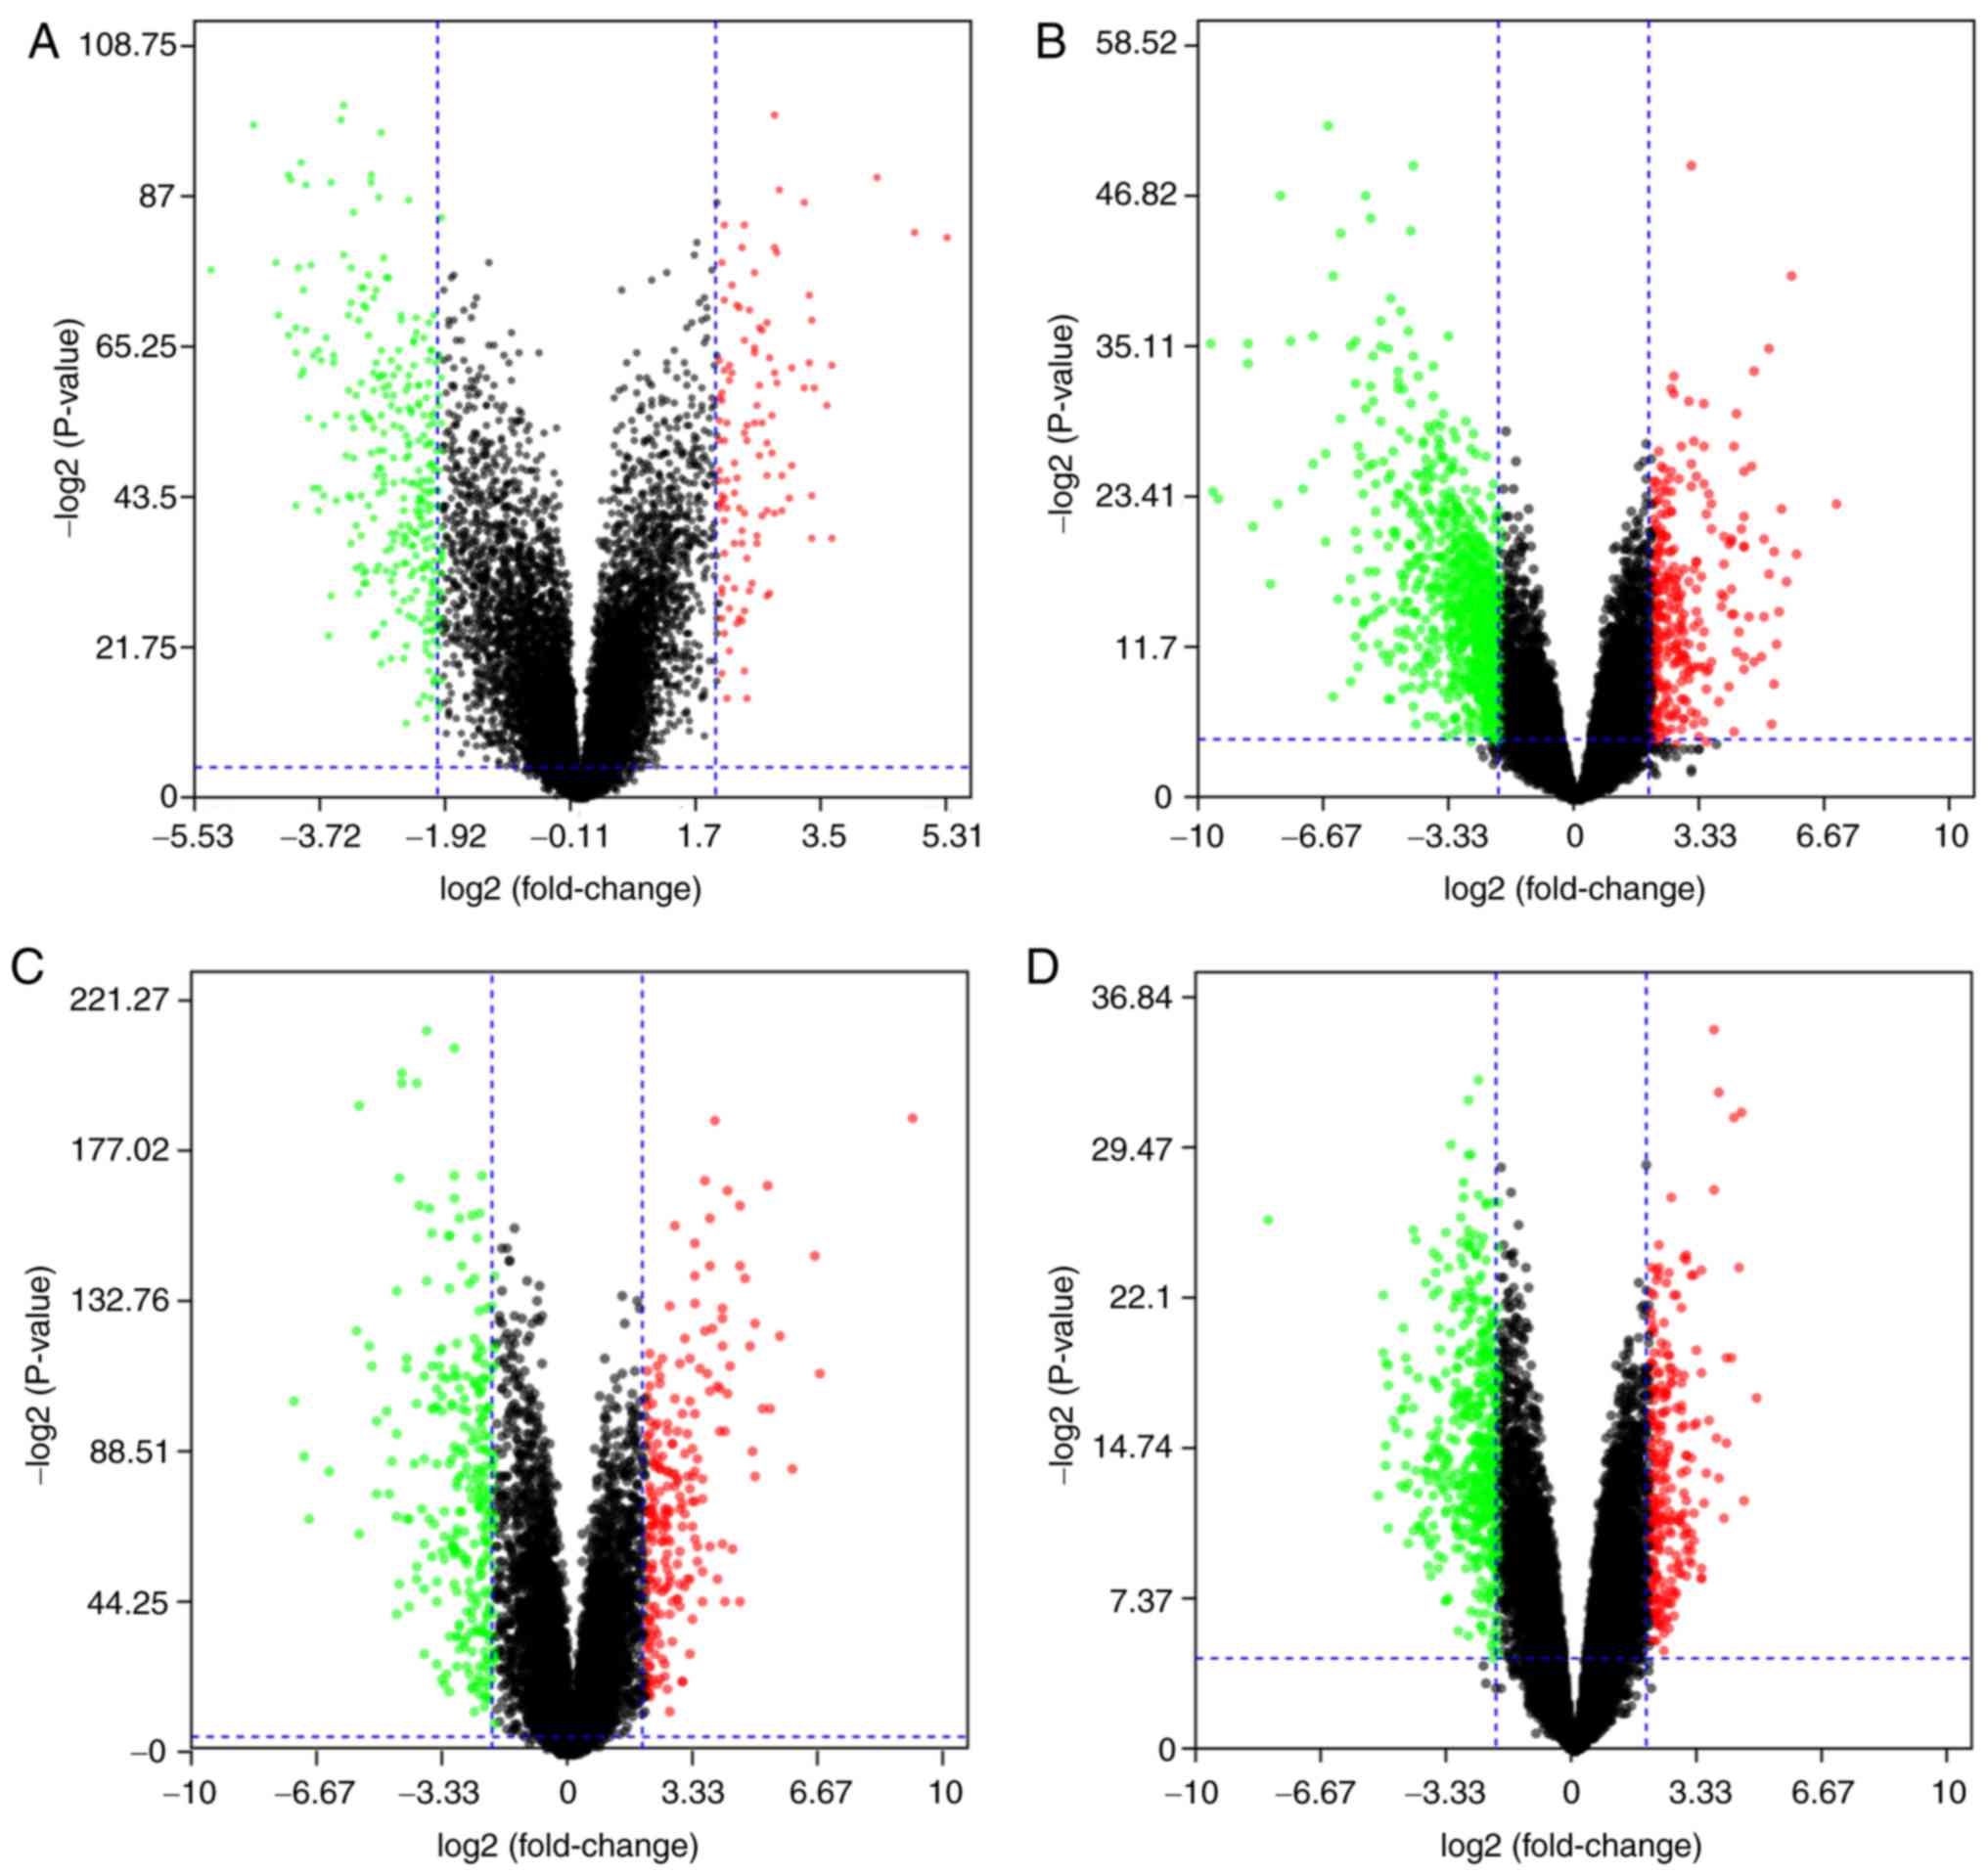
Identification of DEGs in OSCC
The 4 gene expression microarray datasets for OSCC,
GSE37991, GSE23558, GSE30784 and GSE56532, were obtained from GEO.
By screening of the data with the limma package using P<0.05 and
|logFC|>2 as cut-off criteria, 414 DEGs, including 111
upregulated and 303 downregulated genes, were obtained from the
GSE37991 expression profile data (Fig.
1A). Furthermore, 1,119 DEGs, including 242 upregulated and 877
downregulated genes, were identified from GSE23558 (Fig. 1B). From GSE30784, 498 DEGs, including
215 upregulated and 283 downregulated genes, were identified
(Fig. 1C). In addition, 466 DEGs,
including 321 upregulated and 145 downregulated genes, were
identified from GSE56532 (Fig.
1D).
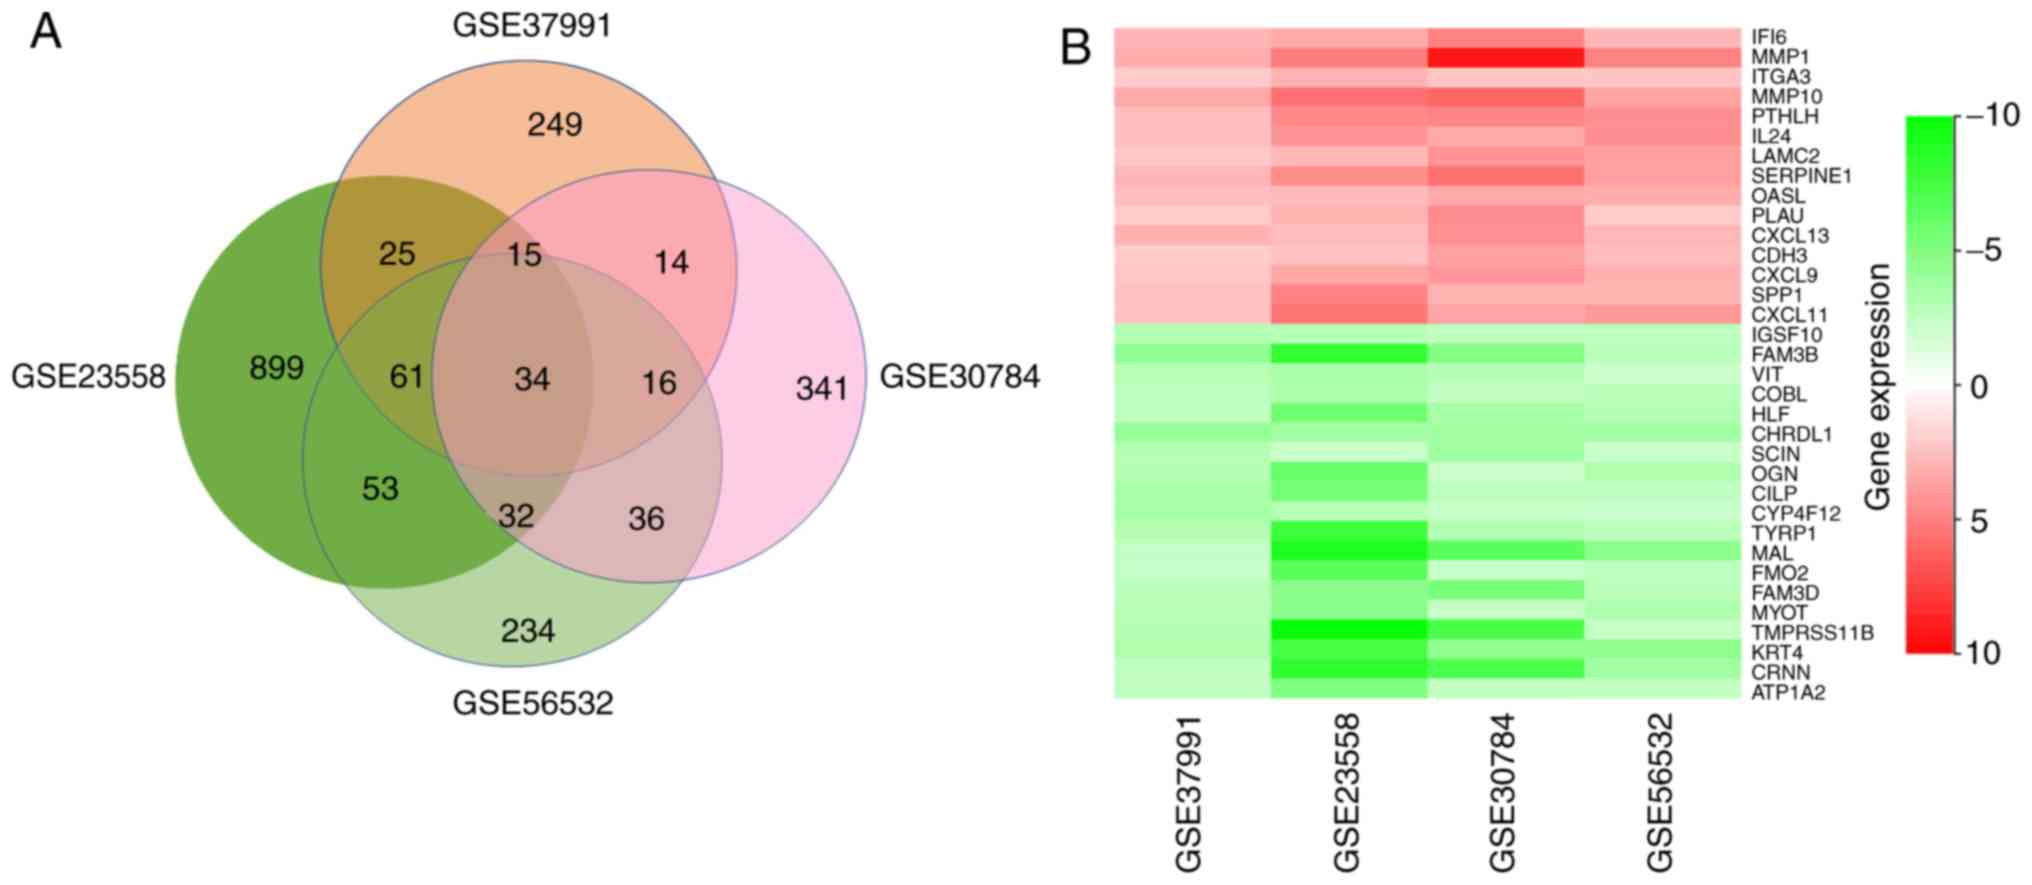
After a comprehensive analysis of the 4 datasets, 34
DEGs were identified to be differentially expressed in all of them,
among which 14 genes were upregulated and 20 were downregulated in
OSCC compared with those in normal oral mucosa tissues (Fig. 2A). Fig.
2B provides a heatmap of the 34 DEGs based on FCs that was
generated with R-heatmap software.
GO analysis and signaling pathway
enrichment of DEGs in OSCC
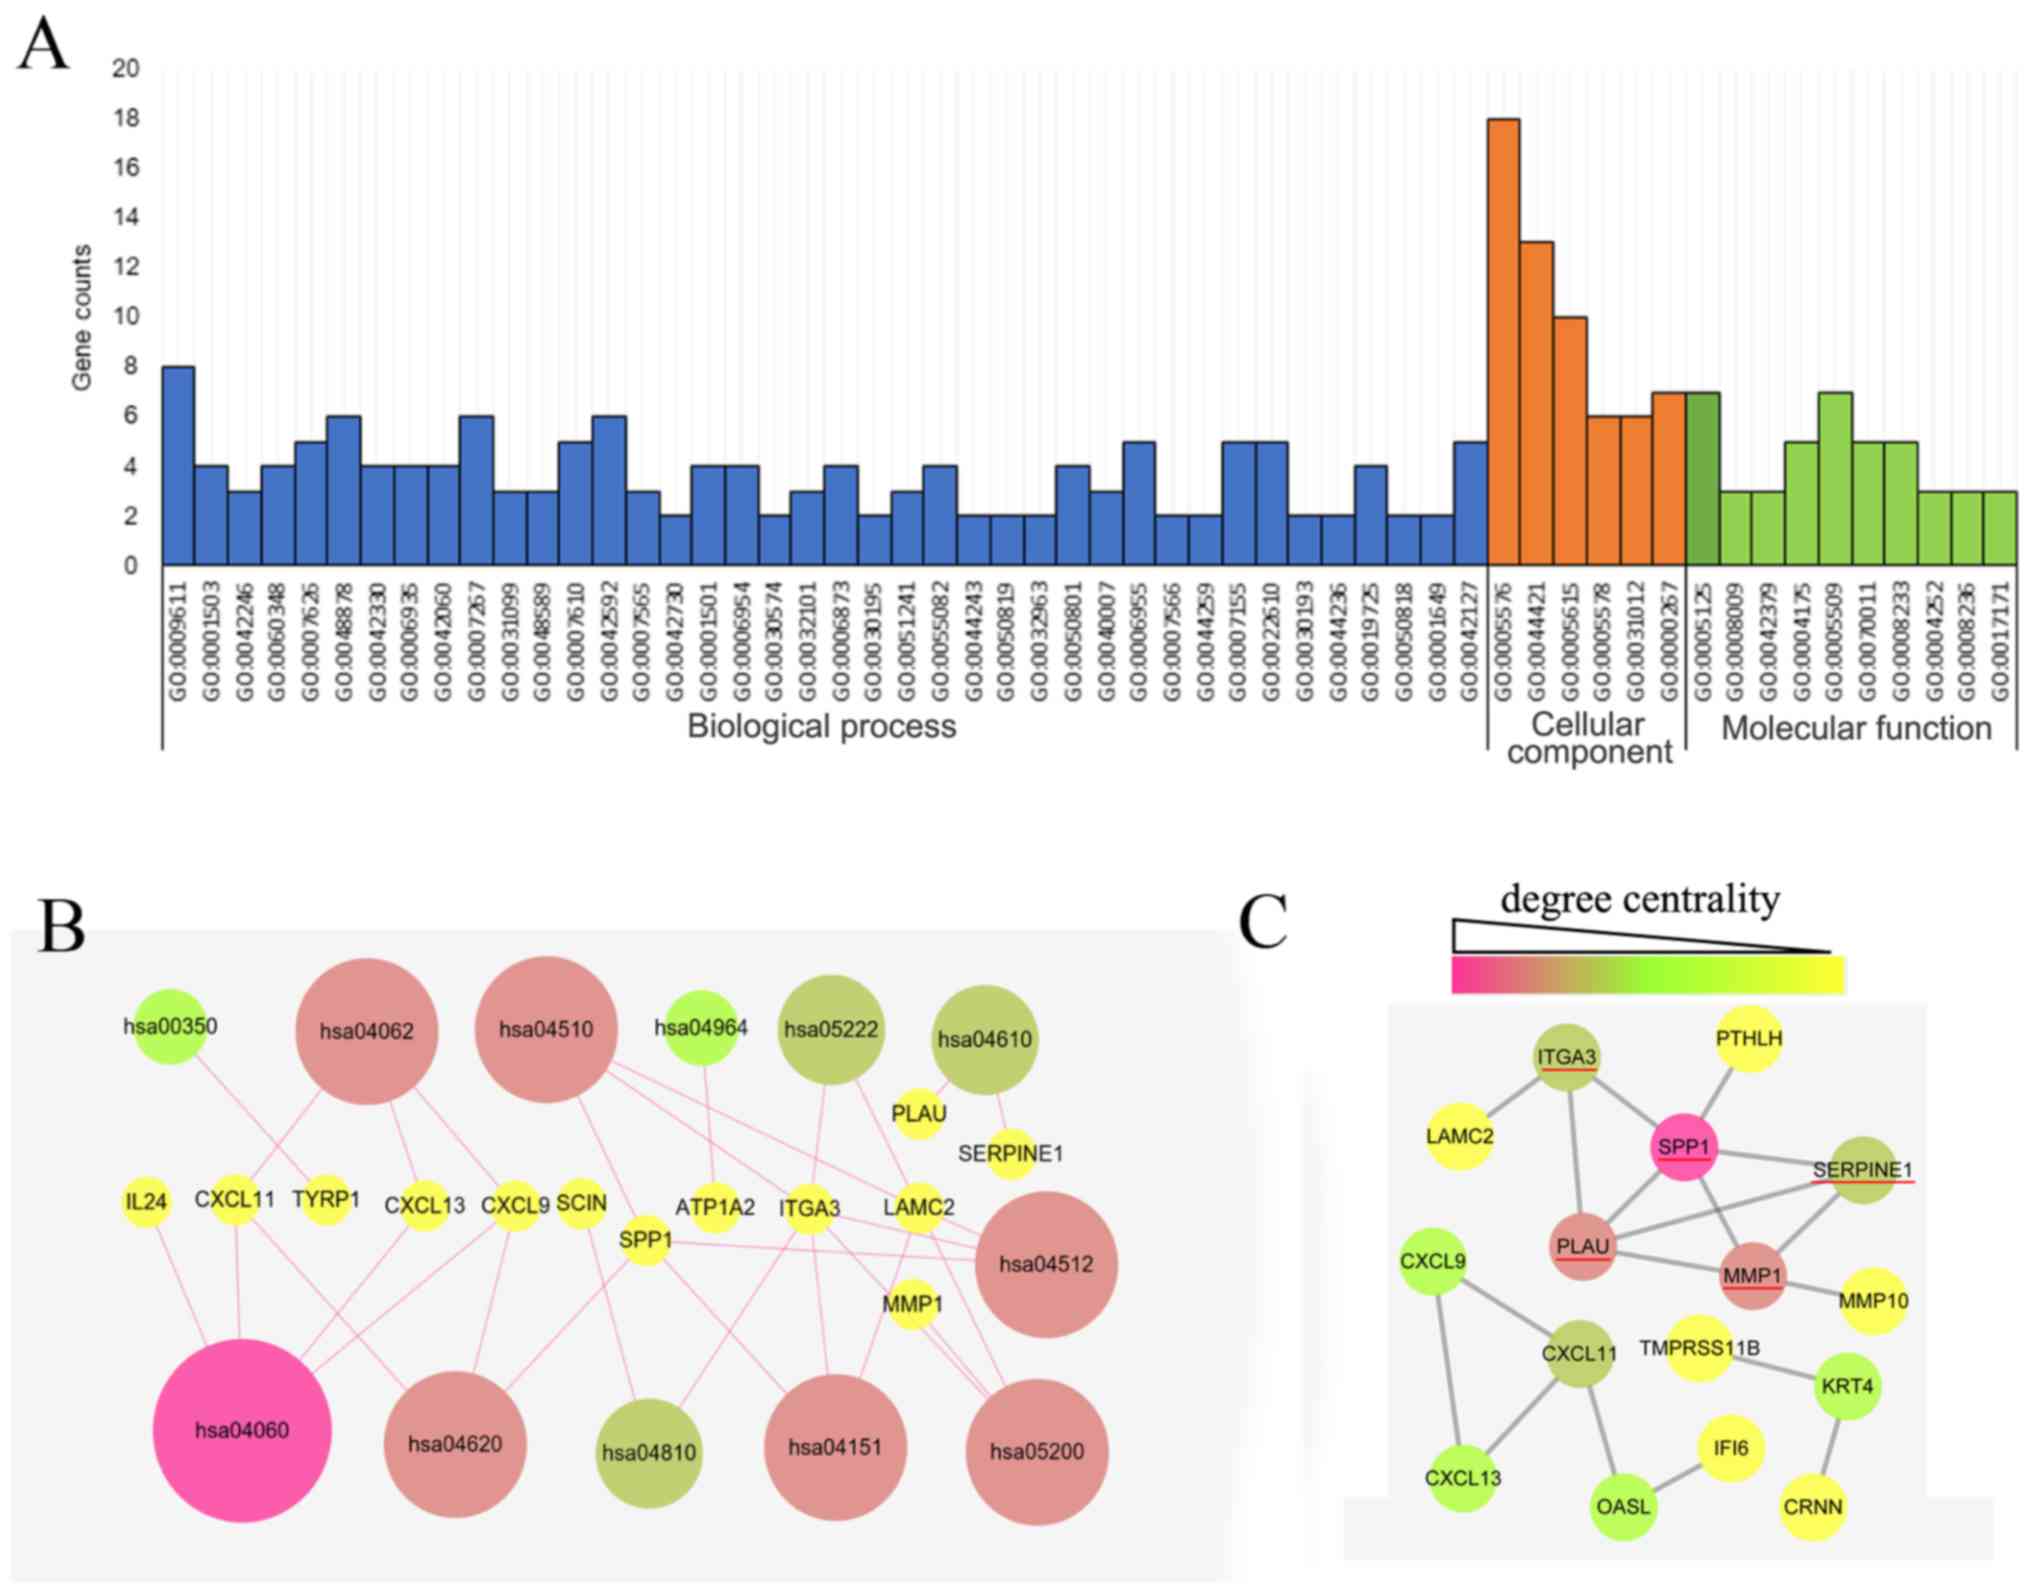
The GO analysis of the 34 DEGs was performed using
the DAVID database with a significance threshold of P<0.05. The
enrichment of the 34 DEGs in GO terms of the categories biological
process, cellular component and molecular function was determined.
As indicated in Fig. 3A, the major
GO terms enriched by the DEGs in the category biological function
were cell adhesion, cell proliferation process, chemical
homeostasis process, wounding process and immune response process.
GO analysis in the category cellular component suggested that the
DEGs were mainly accumulated in the extracellular region. The
molecular function of the DEGs was mainly associated with cytokine,
peptidase and endopeptidase activity. As presented in Fig. 3B, the KEGG pathways enriched by the
DEGs were mainly associated with the cytokine-cytokine receptor
interaction (hsa04060), Toll-like receptor (TLR) signaling pathway
(hsa04620), chemokine signaling pathway (hsa04062), focal adhesion
(hsa04510), extracellular matrix-receptor interaction (hsa04512)
and phosphoinositide-3 kinase (PI3K)/Akt signaling pathway
(hsa04151).
Identification of key candidate DEGs
by PPI network analysis
The PPI network of the DEG expression products was
constructed using Cytoscape software and the STRING database. In
total, 16 DEGs, including 12 upregulated and 4 downregulated genes,
were selected for inclusion in the PPI network according to the
criteria of ‘combined score >0.5’ (Fig. 3C). These 16 DEGs were PLAU,
interferon alpha inducible protein 6 (IFI6), C-X-C motif chemokine
ligand 9 (CXCL9), C-X-C motif chemokine ligand 11 (CXCL11), Laminin
γ2 (LAMC2), matrix metallopeptidase (MMP)1, secreted phosphoprotein
1 (SPP1), parathyroid hormone like hormone (PTHLH), keratin 4
(KRT4), serpin family E member 1 (SERPINE1), 2′-5′-oligoadenylate
synthetase like (OASL), C-X-C motif chemokine ligand 13 (CXCL13),
integrin subunit α 3 (ITGA3), matrix metallopeptidase 10 (MMP10),
cornulin (CRNN) and transmembrane serine protease 11B (TMPRSS11B).
The Cytoscape tool CentiScape was used to screen key genes in the
network, with a degree of connectivity of ≥4 as the inclusion
criterion. SPP1, SERPINE1, MMP1, ITGA3 and PLAU were finally
selected as candidate key genes.
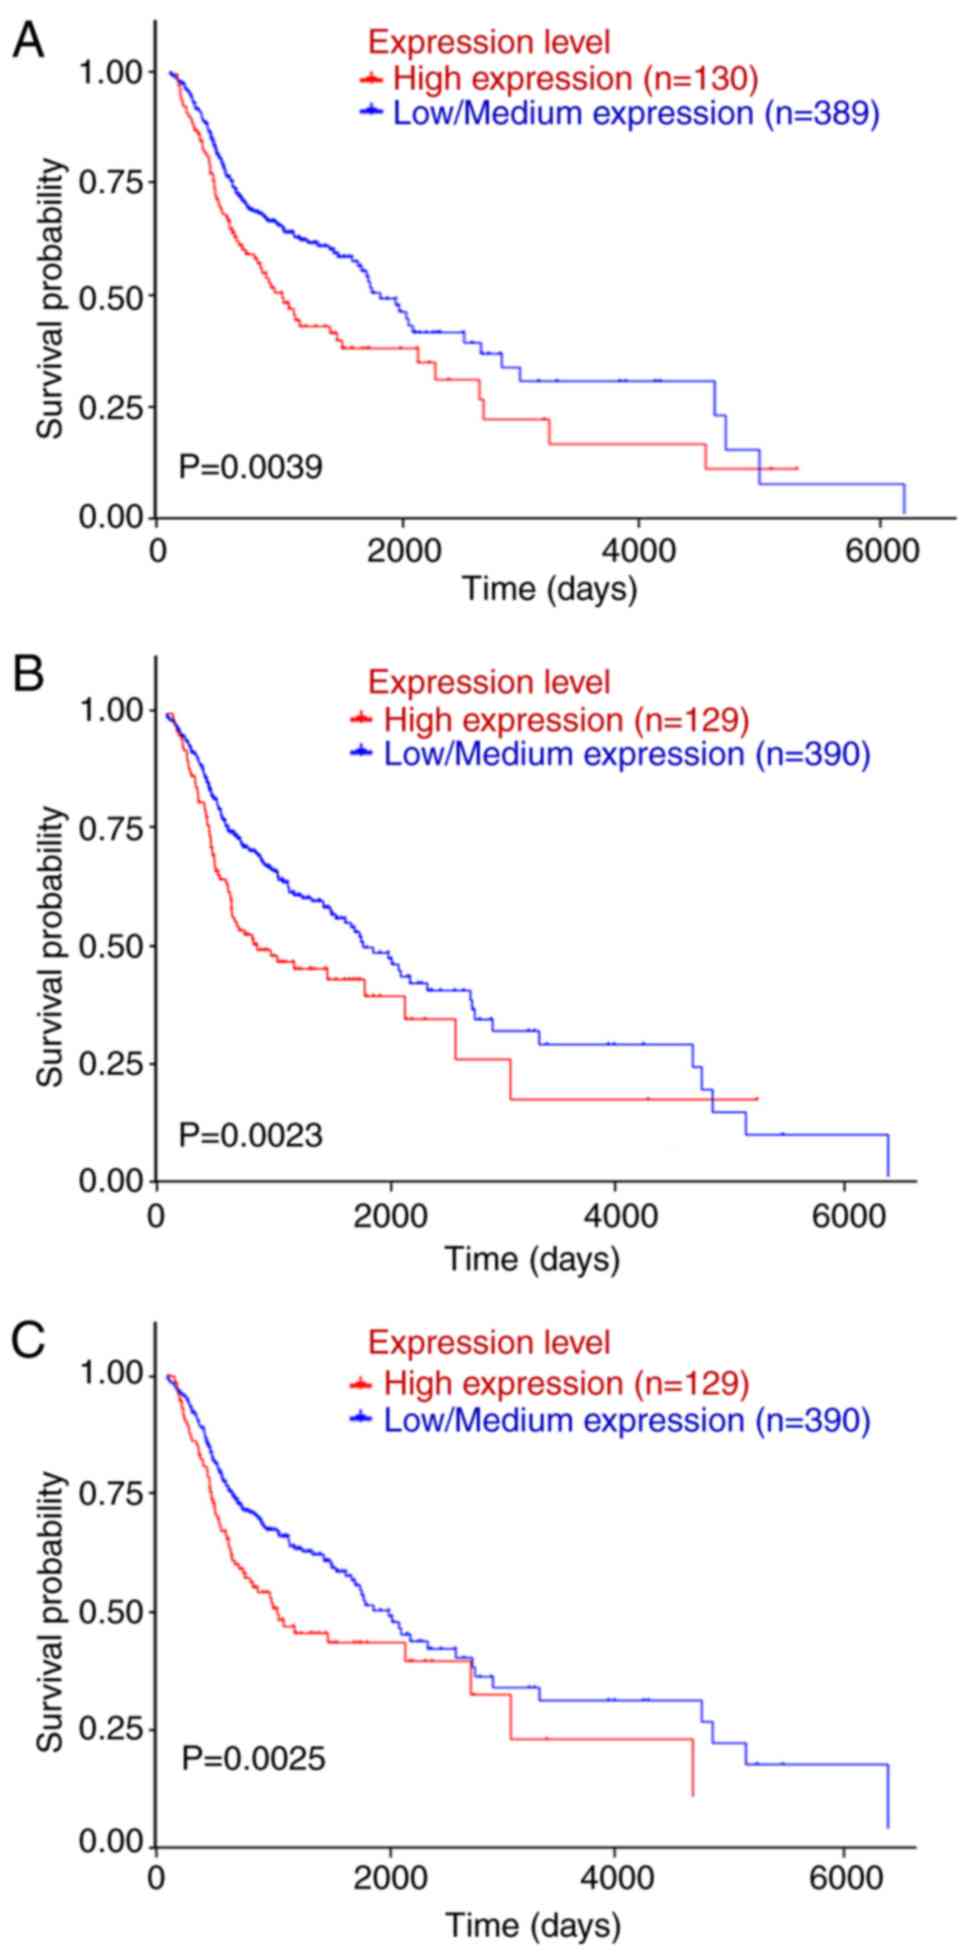
SPP1, ITGA3 and PLAU are associated
with OS of OSCC patients
Patient data from TGCA and were downloaded and
subjected to Kaplan-Meier analysis; the log-rank test was applied
to determine the influence of the expression status of the
candidate key genes on the prognosis of OSCC patients. UALCAN
(http://ualcan.path.uab.edu/index.html) was used for
analyzing gene expression and patient survival information based on
cancer transcriptome data. By in-depth analyses of TCGA gene
expression data, UALCAN provided the association between genes and
prognosis. SPP1, SERPINE1, MMP1, ITGA3 and PLAU were submitted to
the UCLA database and the data were analyzed with the log-rank
test. The survival analysis based on TCGA data revealed that OSCC
patients with high SPP1, ITGA3 or PLAU expression had a shorter OS
than those with low/intermediate expression of SPP1, ITGA3 or PLAU
(P<0.05; Fig. 4).
Comparison of SPP1, PLAU and ITGA3
expression in database of esophageal and head and neck SCC or
ACC
To determine whether SPP1, PLAU or ITGA3 are
associated with OSCC development, the expression of these genes was
compared in the Oncomine database entries for esophageal and head
and neck SCC or ACC. As presented in Fig. 5, ITGA3 was overexpressed in head and
neck SCC, esophageal SCC and esophageal ACC samples compared with
that in the corresponding para-tumour tissues; however, there were
no significant differences in ITGA3 expression between head and
neck ACC and the corresponding para-tumour tissues. The expression
of PLAU was much higher in head and neck SCC, esophageal SCC and
esophageal ACC than that in the corresponding para-tumour tissues,
whereas the expression of PLAU in head and neck ACC was not
significantly different compared with that in the corresponding
para-tumour tissues. Furthermore, the expression of SPP1 in
esophageal and head and neck SCC or ACC was upregulated compared
with that in the corresponding para-tumour tissues. These results
indicated that the association of these genes with the development
of OSCC is not specific, as they are also associated with the
development of other cancer types.
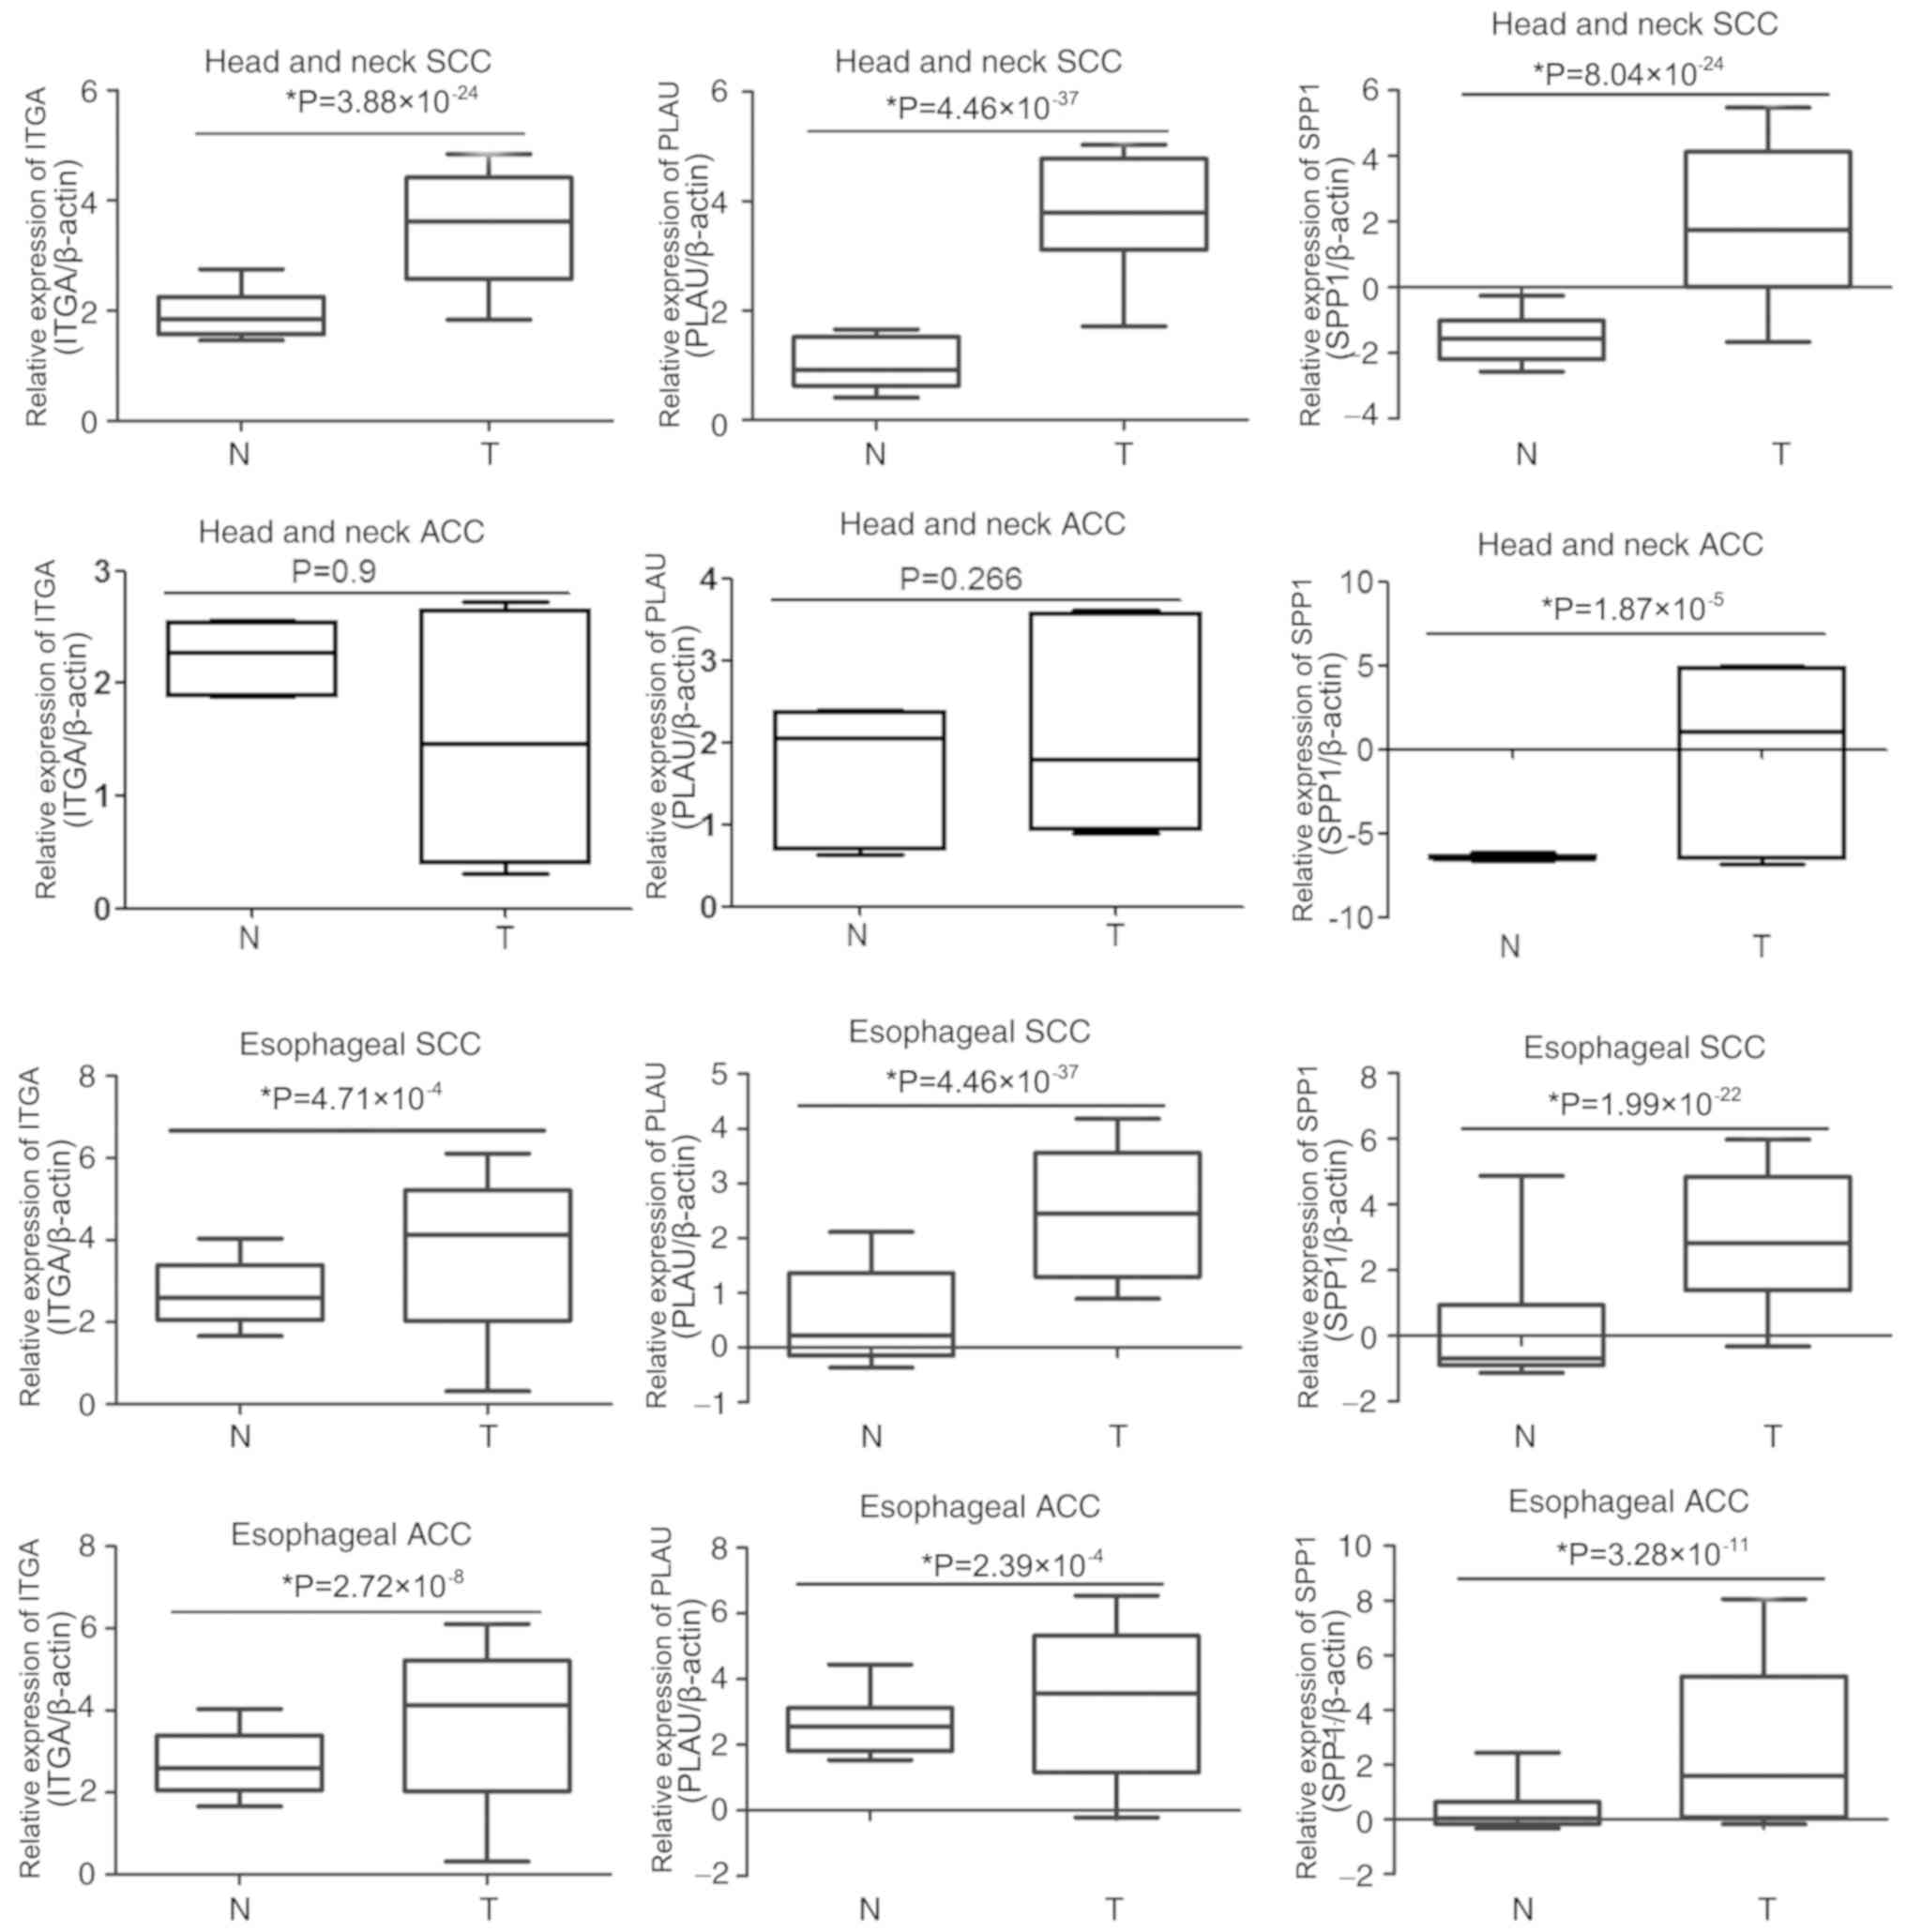 | Figure 5.Comparison of SPP1, PLAU and ITGA3
expression in esophageal and head and neck SCC or ACC. The
expression of SPP1, PLAU and ITGA3 in tumour tissues and adjacent
normal tissues of head and neck SCC, head and neck ACC, esophageal
SCC and esophageal ACC were analyzed in the Oncomine database. T,
tumour; N, normal tissue adjacent to tumour; SPP1, secreted
phosphoprotein 1; ITGA3, integrin subunit α 3; PLAU, plasminogen
activator, urokinase; SCC, squamous cell carcinoma; ACC,
adenocarcinomas. |
SPP1, ITGA3 and PLAU are associated
with cell proliferation, migration and invasion
As the Bioinformatics analysis revealed that SPP1,
PLAU and ITGA3 are associated with the prognosis of OSCC patients,
the function of these genes in OSCC was then experimentally
confirmed using cell biological techniques. To identify the
biological significance of SPP1, ITGA3 and PLAU in the development
and progression of OSCC, it was assessed whether these three genes
regulate the proliferation, migration and invasion of OSCC cells.
Using Lv transfection technique, SPP1, ITGA3 and PLAU were knocked
down in CAL-27 cells, a cell line derived from OSCC. The knockdown
rates of SPP1, ITGA3 and PLAU were determined to be 44.78, 28.17
and 31.43%, respectively, indicating successful knockdown of the
individual genes (Fig. 6A). The
CAL-27 cells transfected with Lv-sh-NC, as well as CAL-27 cells
with SPP1, ITGA3 and PLAU knockdown were cultured in a 96-well
plate for 0, 24, 48 and 72 h, and then subjected to a CCK-8 cell
proliferation assay. As presented in Fig. 6B, CAL-27 cells with knockdown of SPP1
or PLAU, but not ITGA3, possessed a lower capacity for cell
proliferation. Furthermore, the migration and invasion ability of
CAL-27 cells after knockdown of SPP1, ITGA3 or PLAU, was
determined, as presented in Fig. 6C and
D, respectively. The Transwell migration and invasion assays
indicated that CAL-27 cells with knockdown of SPP1 or PLAU, but not
ITGA3, possessed a decreased capacity for cell migration and
invasion. Therefore, the cell proliferation, migration and invasion
assays indicated that SPP1 and PLAU may function as oncogenes in
OSCC.
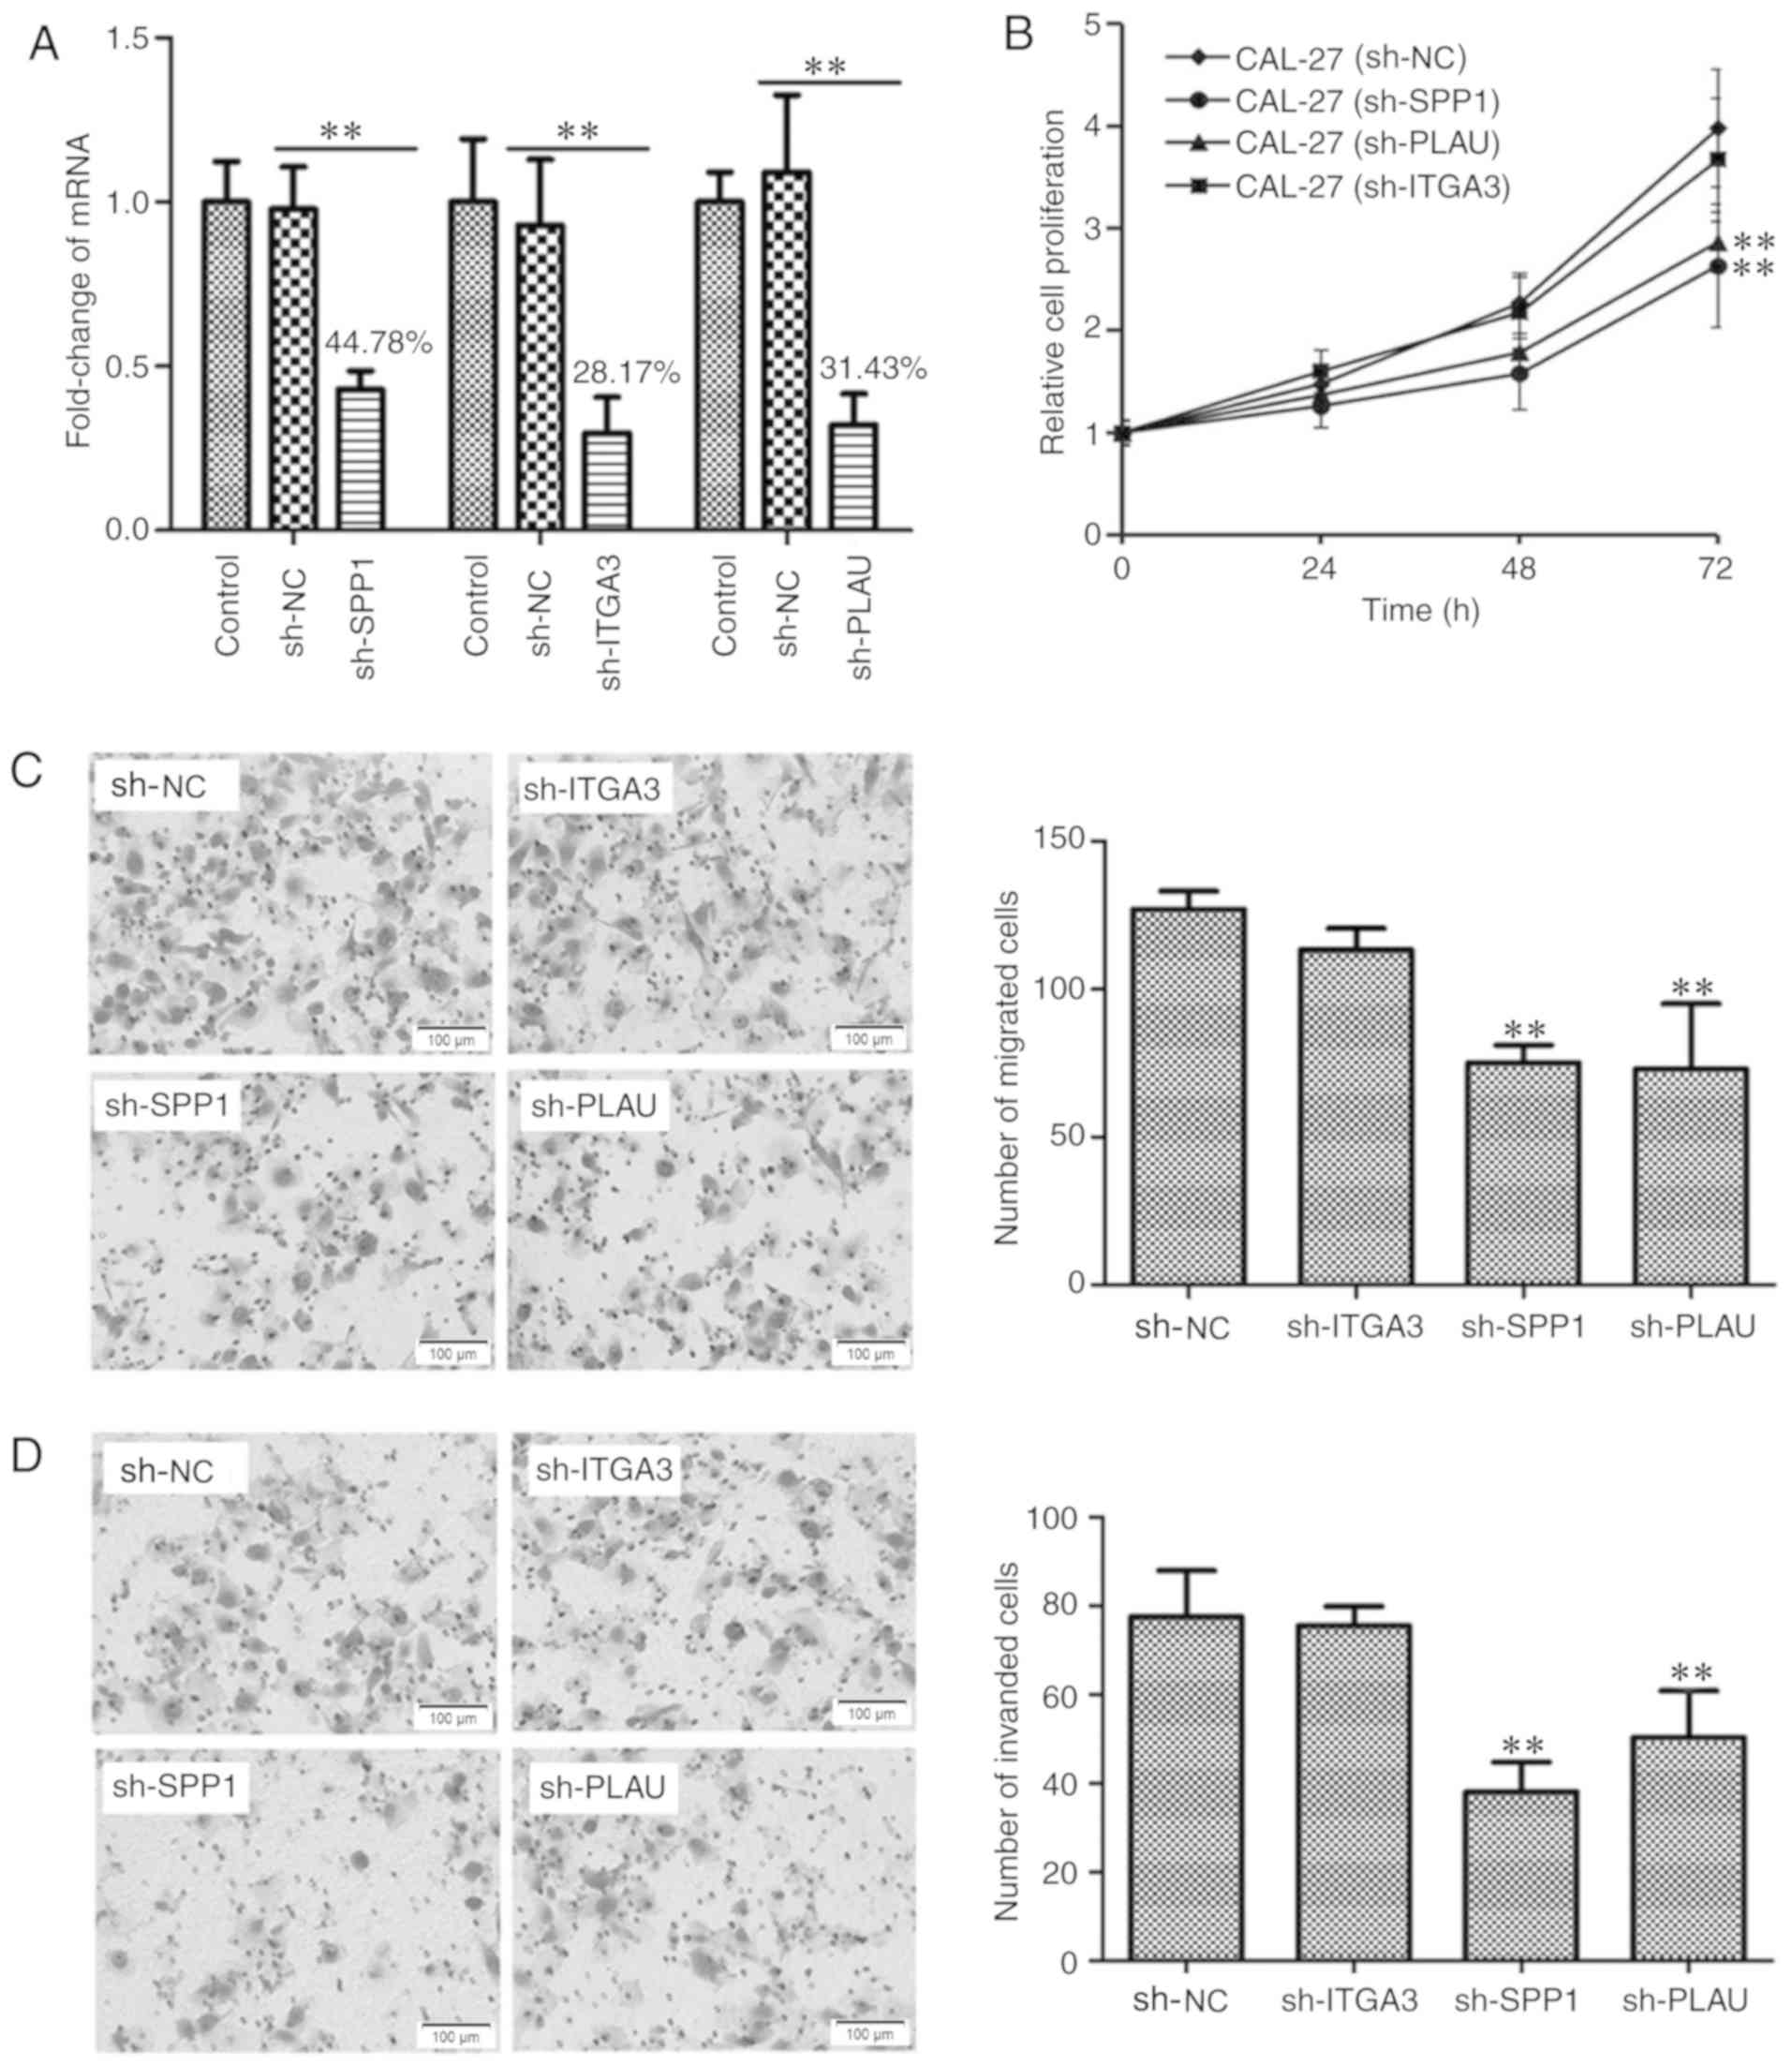 | Figure 6.Detection the function of SPP1, ITGA3
and PLAU in regulating OSCC cell proliferation, migration and
invasion. (A) Verification of knockdown of SPP1, ITGA3 or PLAU in
CAL-27 cells. SPP1, ITGA3 or PLAU were knocked down using a
lentiviral transfection technique. Reverse
transcription-quantitative polymerase chain reaction analysis was
used to verify the knockdown of SPP1, ITGA3 and PLAU. **P<0.01.
(B) Knockdown of SPP1 or PLAU inhibited CAL-27 cell proliferation
at 72 h as indicated by at Cell Counting Kit-8 assay. **P<0.01
vs. CAL-27 sh-NC group. (C) Knockdown of SPP1 or PLAU inhibited
CAL-27 cell migration as indicated by a Transwell migration assay.
Photomicrographs of migrated cells are provided in the left panel
and quantified migrated cells from 6 separate fields of three
replicate wells are provided in the right panel. **P<0.01 vs.
sh-NC group. (D) Knockdown of SPP1 or PLAU inhibited CAL-27 cell
invasion. The CAL-27 cells, CAL-27 cell with SPP1, ITGA3 or PLAU
knockdown as indicated by a Transwell invasion assay.
Photomicrographs of invaded cells are provided in the left panel
and quantified invaded cells from 6 separate fields of three
replicate wells are provided in the right panel. **P<0.01 vs.
sh-NC group. Values are expressed as the mean ± standard deviation
(n=3 in A and n=6 in B-D). Groups: Control, empty control with no
treatment; sh-NC, CAL-27 cells transfected with negative control
lentivirus; sh-SPP1, CAL-27 cells with SPP1 knockdown; sh-PLAU,
CAL-27 cells with PLAU knockdown; sh-ITGA3, CAL-27 cells with ITGA3
knockdown. SPP1, secreted phosphoprotein 1; ITGA3, integrin subunit
α 3; PLAU, plasminogen activator, urokinase. |
Discussion
OSCC is one of the most common types of HNSCC
(1). OSCC is a type of malignant
tumour with properties of rapid progression, high metastatic
capacity and high mortality; however, biomarkers or targets for
OSCC diagnosis and therapy are currently insufficient. Searching
for genes that are differentially expressed in tumour vs. normal
tissues will lead to the further elucidation of the pathogenesis of
OSCC and may provide promising biomarkers or targets for early
diagnosis and therapy.
In the field of genomics, microarray and
high-throughput sequencing technologies are widely used for
exploring changes in the genetic aspects of a disease. In recent
decades, several microarray and high-throughput sequencing
technologies have been used in OSCC; however, the molecular
mechanisms and pathogenesis of OSCC remain to be fully elucidated.
In the present study, four gene expression profiles were integrated
and deeply analyzed using Bioinformatics methods. Finally, 34 DEGs
were identified, including 14 upregulated and 20 downregulated
genes in the first step. The upregulated DEGs were MMP1, PLAU,
ITGA3, PTHLH, cadherin 3, SPP1, SERPINE1, IFI6, MMP10, CXCL11,
interleukin 24, LAMC2, OASL and CXCL9, and the downregulated DEGs
were family with sequence similarity 3 member B, flavin containing
monooxygenase 2, tyrosinase related protein 1, TMPRSS11B, mal, T
cell differentiation protein, osteoglycin, HLF transcription
factor, PAR bZIP family member, cartilage intermediate layer
protein, KRT4, myotilin, ATPase Na+/K+ transporting subunit alpha
2, chordin like 1, cordon-bleu WH2 repeat protein, immunoglobulin
superfamily member 10, CRNN, vitrin, family with sequence
similarity 3 member D, cytochrome P450 family 4 subfamily F member
12, CXCL13 and scinderin.
These 34 DEGs were then subjected to GO term and
KEGG signaling pathway enrichment analysis. In addition, the PPI
network was constructed and 5 key candidate DEGs were identified.
The GO analysis indicated that the DEGs were mainly involved in
immune response, cell adhesion and cell proliferation. The KEGG
pathway analysis revealed that the DEGs were mainly associated with
cytokine-cytokine receptor interaction, as well as the TLR,
chemokine and PI3K/Akt signaling pathways. This was consistent with
previous studies, which reported that immune response, cell
proliferation and adhesion, and TLR signaling (17), as well as PI3K/Akt signaling
(18), have important roles in the
genesis and progression of OSCC.
TLR signaling has been reported to be involved in
activating innate and adaptive immune responses and promote cell
proliferation, invasion and angiogenesis in a variety of cancer
types (19,20). Activation of the TLR signaling
pathway promotes malignant cell invasion and the associated
metastatic potential by regulating MMPs, interferon-l1, p53, PTEN,
VEGF, TIMP-1 and integrin/focal adhesion kinase signaling (21–24);
therefore, TLR agonists have been suggested to be promising
anti-tumour agents (24). In
addition, activation of TLR signaling by either extrinsic or
intrinsic factors drives tumorigenesis and tumour growth via
regulation of a positive feedback loop that amplifies inflammatory
and stemness-associated properties in cancer cells (25). In the present study, 3 candidate
genes involved in the TLR signaling pathway were identified,
including SPP1, CXCL11 and CXCL9. CXCL9 and CXCL11 belong to the
chemokine CXC family, and may be induced by interferon-γ, which is
associated with the regulation of immune cells (26,27).
Previous studies have indicated that CXCL9 and CXCL11 were
overexpressed and functioned as tumour suppressors in several types
of cancer, including ovarian cancer (28), breast cancer (29), lung cancer (30), prostate cancer (27), gastric cancer (31), lymphoma (32) and colorectal cancer (33). Recent studies have also indicated
that CXCL9/11 upregulates the expression of PD-L1, suggesting that
CXCL9/11 may be factors influencing the effects of immunotherapy
(31). However, the biological
significance of CXCL9 and CXCL11 in OSCC remains to be fully
elucidated; therefore, further study is required to illustrate the
role of CXCL9/11 in OSCC development (26).
The PI3K/Akt signaling pathway, which is one of the
most frequently dysregulated pathways in cancer, is responsible for
several physiological and pathological processes, including cell
proliferation, differentiation, apoptosis, angiogenesis and
metabolism (34–37). Abnormal activation of PI3K/AKT
signaling pathway is associated with the progression and drug
resistance of multiple solid tumour types and hematologic
malignancies (38–40). It has been reported that the PI3K/Akt
signaling pathway regulates the development of tumours by mediating
the epithelial-mesenchymal transition directly and by engaging in
cross-talk with other signaling pathways (41). In the present study, 3 candidate
genes involved in PI3K/Akt signaling pathway, including LAMC2,
ITGA3 and SPP1, were identified. LAMC2 is a laminin component and
is involved in the development and progression of a variety of
tumour types. Huang et al (42) reported that LAMC2 was overexpressed
in colorectal cancer and promotes the proliferation and migration
of cancer cells; furthermore, LAMC2 was positively correlated with
lymph node metastasis and negatively correlated with the survival
rate of colorectal cancer patients. In other tumour types,
including lung ACC, non-small cell lung cancer, pancreatic ACC and
OSCC, the overexpression of LAMC2 was also associated with poor
clinical outcome (43,44).
Based on the PPI network and CentiScape, several
candidate genes were selected, including SPP1, SERPINE1, MMP1,
ITGA3 and PLAU. Furthermore, SPP1, ITGA3 and PLAU were confirmed to
be closely associated with the survival rate of OSCC patients.
Hubbard et al (45)
constructed a mouse model with high expression of SPP1 and revealed
that SPP1 induced cell proliferation and differentiation,
indicating that SPP1 may have an important role in cancer
progression. Further studies suggested that SPP1 was overexpressed
in various types of cancer, including lung ACC, colorectal cancer
and ovarian cancer, and significantly associated with the
clinicopathological characteristics (46–49).
Another study indicated that SPP1 has an important role in
mediating macrophage polarization and this may be one of the
important mechanisms for its involvement in tumour regulation
(50). PLAU has already been
reported to be involved in tumour metastasis. Furthermore, PLAU was
demonstrated to have an important role in suppressing the function
of human and murine regulatory T cells (51), indicating that PLAU may be associated
with the tumour immune escape. ITGA3, a member of the integrin
family, has been reported to be aberrantly expressed in numerous
types of malignant human tumour, including colorectal cancer,
bladder cancer and prostate cancer (52–54).
To further illustrate the roles of SPP1, PLAU and
ITGA3 in the genesis and progression of OSCC, the genes were
individually knocked down in CAL-27 cells, a cell line of OSCC, and
the resultant effect on the cell proliferation, migration and
invasion was assessed. It was indicated that SPP1 and PLAU were
associated with cell proliferation, migration and invasion,
suggesting that SPP1 and PLAU may exert key functions in OSCC.
However, ITGA3 was not significantly associated with CAL-27 cell
proliferation, migration and invasion, indicating that, at least in
CAL-27 cells, ITGA3 does not significantly affect those cell
functions; however, whether this is a specific phenomenon in CAL-27
cells or a universal phenomenon in OSCC requires further
elucidation.
Of note, a previous Bioinformatics study has
determined DEGs in OSCC (5). One
discordant point between the present study and the previous one was
the datasets selected, as the present study used four datasets from
different regions, including North America, Australia, China and
India, thus averting the differences caused by sample heterogeneity
revealing universal DEGs that apply to different ethnic groups, as
it has been reported that ethnic difference may affect
disease-associated gene expression profiles (8,9). The
other discordant point was that the previous study focused on
cancer stage-specific candidate genes, while the present study paid
attention to genes associated with the prognosis of OSCC. The
previous study screened several genes that were different from
those identified in the present study; this may due to the
different datasets included and/or the fact that genes associated
with the stage of OSCC are different from those associated with
prognosis.
In conclusion, the present study identified 34 DEGs
from four OSCC datasets using integrated Bioinformatics analysis;
these DEGs were significantly enriched in the TLR, chemokine and
PI3K/Akt signaling pathways. It was further confirmed that SPP1,
ITGA3 and PLAU were closely associated with the survival rate of
OSCC patients. Finally, it was experimentally demonstrated that
SPP1 and PLAU regulate cell proliferation, migration and invasion
of CAL-27 cells. These results may enhance the current
understanding of the pathogenesis of OSCC, and these key candidate
DEGs may be important biomarkers for early diagnosis and potential
targets for the treatment of OSCC. Further studies are required to
detect the function of these genes in OSCC and the molecular
mechanisms.
Supplementary Material
Supporting Data
Acknowledgements
Not applicable.
Funding
This study was supported by the Medicine and Health
Science Technology Development Plan Project of Shandong province
(grant no. 2017WSA15041) and the National Natural Science
Foundation of China (grant nos. 81472530 and 81602374).
Availability of data and materials
The datasets generated and/or analyzed during the
present study are available in the Figshare repository (https://figshare.com/s/53be0ebc409d8ca1c806).
Authors' contributions
BZ performed Gene Ontology and pathway enrichment
analyses of DEGs and drafted the manuscript. JLi analyzed the PPI
using STRING and Cytoscape software. KX performed the gene
knockdown experiments and reverse transcription-quantitative
polymerase chain reaction. JLiu worked on cell culture. DY
performed the Transwell migration and invasion assays. ZM analyzed
the association between the candidate genes and prognosis, and as
one of the corresponding authors, ZM also participated the design
of the study. BZ was the major contributor in designing the present
study. All authors read and approved the final manuscript.
Ethics approval and consent to
participate
Not applicable.
Patient consent for publication
Not applicable.
Competing interests
The authors declare that they have no competing
interests.
References
|
1
|
Siegel RL, Miller KD and Jemal A: Cancer
statistics, 2018. CA Cancer J Clin. 68:7–30. 2018. View Article : Google Scholar : PubMed/NCBI
|
|
2
|
Siegel RL, Miller KD and Jemal A: Cancer
statistics, 2016. CA Cancer J Clin. 66:7–30. 2016. View Article : Google Scholar : PubMed/NCBI
|
|
3
|
Siegel RL, Miller KD and Jemal A: Cancer
statistics, 2017. CA Cancer J Clin. 67:7–30. 2017. View Article : Google Scholar : PubMed/NCBI
|
|
4
|
Petryszak R, Burdett T, Fiorelli B,
Fonseca NA, Gonzalez-Porta M, Hastings E, Huber W, Jupp S, Keays M,
Kryvych N, et al: Expression atlas update-a database of gene and
transcript expression from microarray- and sequencing-based
functional genomics experiments. Nucleic Acids Res 42 (Database
Issue). D926–D932. 2014. View Article : Google Scholar
|
|
5
|
Randhawa V and Acharya V: Integrated
network analysis and logistic regression modeling identify
stage-specific genes in oral squamous cell carcinoma. BMC Med
Genomics. 8:392015. View Article : Google Scholar : PubMed/NCBI
|
|
6
|
Zhao X, Sun S, Zeng X and Cui L:
Expression profiles analysis identifies a novel three-mRNA
signature to predict overall survival in oral squamous cell
carcinoma. Am J Cancer Res. 8:450–461. 2018.PubMed/NCBI
|
|
7
|
Wang Y, Fan H and Zheng L: Biological
information analysis of differentially expressed genes in oral
squamous cell carcinoma tissues in GEO database. J BUON.
23:1662–1670. 2018.PubMed/NCBI
|
|
8
|
Mitchell KA, Zingone A, Toulabi L,
Boeckelman J and Ryan BM: Comparative transcriptome profiling
reveals coding and noncoding RNA differences in NSCLC from African
Americans and European Americans. Clin Cancer Res. 23:7412–7425.
2017. View Article : Google Scholar : PubMed/NCBI
|
|
9
|
Hardiman G, Savage SJ, Hazard ES, Wilson
RC, Courtney SM, Smith MT, Hollis BW, Halbert CH and Gattoni-Celli
S: Systems analysis of the prostate transcriptome in
African-American men compared with European-American men.
Pharmacogenomics. 17:1129–1143. 2016. View Article : Google Scholar : PubMed/NCBI
|
|
10
|
Lee CH, Chang JS, Syu SH, Wong TS, Chan
JY, Tang YC, Yang ZP, Yang WC, Chen CT, Lu SC, et al: IL-1beta
promotes malignant transformation and tumor aggressiveness in oral
cancer. J Cell Physiol. 230:875–884. 2015. View Article : Google Scholar : PubMed/NCBI
|
|
11
|
Ambatipudi S, Gerstung M, Pandey M, Samant
T, Patil A, Kane S, Desai RS, Schäffer AA, Beerenwinkel N and
Mahimkar MB: Genome-wide expression and copy number analysis
identifies driver genes in gingivobuccal cancers. Genes Chromosomes
Cancer. 51:161–173. 2012. View Article : Google Scholar : PubMed/NCBI
|
|
12
|
Chen C, Méndez E, Houck J, Fan W,
Lohavanichbutr P, Doody D, Yueh B, Futran ND, Upton M, Farwell DG,
et al: Gene expression profiling identifies genes predictive of
oral squamous cell carcinoma. Cancer Epidemiol Biomarkers Prev.
17:2152–2162. 2008. View Article : Google Scholar : PubMed/NCBI
|
|
13
|
Chandrashekar DS, Bashel B, Balasubramanya
SAH, Creighton CJ, Ponce-Rodriguez I, Chakravarthi BVSK and
Varambally S: UALCAN: A portal for facilitating tumor subgroup gene
expression and survival analyses. Neoplasia. 19:649–658. 2017.
View Article : Google Scholar : PubMed/NCBI
|
|
14
|
Franceschini A, Szklarczyk D, Frankild S,
Kuhn M, Simonovic M, Roth A, Lin J, Minguez P, Bork P, von Mering C
and Jensen LJ: STRING v9.1: Protein-protein interaction networks,
with increased coverage and integration. Nucleic Acids Res 41
(Database Issue). D808–D815. 2013.
|
|
15
|
Shannon P, Markiel A, Ozier O, Baliga NS,
Wang JT, Ramage D, Amin N, Schwikowski B and Ideker T: Cytoscape: A
software environment for integrated models of biomolecular
interaction networks. Genome Res. 13:2498–2504. 2003. View Article : Google Scholar : PubMed/NCBI
|
|
16
|
Livak KJ and Schmittgen TD: Analysis of
relative gene expression data using real-time quantitative PCR and
the 2(-Delta Delta C(T)) method. Methods. 25:402–408. 2001.
View Article : Google Scholar : PubMed/NCBI
|
|
17
|
Wang L, Zhu R, Huang Z, Li H and Zhu H:
Lipopolysaccharide-induced toll-like receptor 4 signaling in cancer
cells promotes cell survival and proliferation in hepatocellular
carcinoma. Dig Dis Sci. 58:2223–2236. 2013. View Article : Google Scholar : PubMed/NCBI
|
|
18
|
Koundouros N and Poulogiannis G:
Phosphoinositide 3-kinase/Akt signaling and redox metabolism in
cancer. Front Oncol. 8:1602018. View Article : Google Scholar : PubMed/NCBI
|
|
19
|
Gay NJ, Symmons MF, Gangloff M and Bryant
CE: Assembly and localization of Toll-like receptor signalling
complexes. Nat Rev Immunol. 14:546–558. 2014. View Article : Google Scholar : PubMed/NCBI
|
|
20
|
Shcheblyakov DV, Logunov DY, Tukhvatulin
AI, Shmarov MM, Naroditsky BS and Gintsburg AL: Toll-like receptors
(TLRs): The role in tumor progression. Acta Naturae. 2:21–29.
2010.PubMed/NCBI
|
|
21
|
Wang W and Wang J: Toll-like receptor 4
(TLR4)/Cyclooxygenase-2 (COX-2) regulates prostate cancer cell
proliferation, migration, and invasion by NF-kappaB activation. Med
Sci Monit. 24:5588–5597. 2018. View Article : Google Scholar : PubMed/NCBI
|
|
22
|
Wang F, Jin R, Zou BB, Li L, Cheng FW, Luo
X, Geng X and Zhang SQ: Activation of toll-like receptor 7
regulates the expression of IFN-λ1, p53, PTEN, VEGF, TIMP-1 and
MMP-9 in pancreatic cancer cells. Mol Med Rep. 13:1807–1812. 2016.
View Article : Google Scholar : PubMed/NCBI
|
|
23
|
Lin CH, Lin HH, Kuo CY and Kao SH:
Aeroallergen Der p 2 promotes motility of human non-small cell lung
cancer cells via toll-like receptor-mediated up-regulation of
urokinase-type plasminogen activator and integrin/focal adhesion
kinase signaling. Oncotarget. 8:11316–11328. 2017.PubMed/NCBI
|
|
24
|
Braunstein MJ, Kucharczyk J and Adams S:
Targeting toll-like receptors for cancer therapy. Target Oncol.
13:583–598. 2018. View Article : Google Scholar : PubMed/NCBI
|
|
25
|
Yeh DW, Chen YS, Lai CY, Liu YL, Lu CH, Lo
JF, Chen L, Hsu LC, Luo Y, Xiang R and Chuang TH: Downregulation of
COMMD1 by miR-205 promotes a positive feedback loop for amplifying
inflammatory- and stemness-associated properties of cancer cells.
Cell Death Differ. 23:841–852. 2016. View Article : Google Scholar : PubMed/NCBI
|
|
26
|
Tokunaga R, Zhang W, Naseem M, Puccini A,
Berger MD, Soni S, McSkane M, Baba H and Lenz HJ: CXCL9, CXCL10,
CXCL11/CXCR3 axis for immune activation - A target for novel cancer
therapy. Cancer Treat Rev. 63:40–47. 2018. View Article : Google Scholar : PubMed/NCBI
|
|
27
|
Tan S, Wang K, Sun F, Li Y and Gao Y:
CXCL9 promotes prostate cancer progression through inhibition of
cytokines from T cells. Mol Med Rep. 18:1305–1310. 2018.PubMed/NCBI
|
|
28
|
Bronger H, Singer J, Windmüller C, Reuning
U, Zech D, Delbridge C, Dorn J, Kiechle M, Schmalfeldt B, Schmitt M
and Avril S: CXCL9 and CXCL10 predict survival and are regulated by
cyclooxygenase inhibition in advanced serous ovarian cancer. Br J
Cancer. 115:553–563. 2016. View Article : Google Scholar : PubMed/NCBI
|
|
29
|
Bronger H, Karge A, Dreyer T, Zech D,
Kraeft S, Avril S, Kiechle M and Schmitt M: Induction of cathepsin
B by the CXCR3 chemokines CXCL9 and CXCL10 in human breast cancer
cells. Oncol Lett. 13:4224–4230. 2017. View Article : Google Scholar : PubMed/NCBI
|
|
30
|
Spaks A: Role of CXC group chemokines in
lung cancer development and progression. J Thorac Dis. 9 (Suppl
3):S164–S171. 2017. View Article : Google Scholar : PubMed/NCBI
|
|
31
|
Zhang C, Li Z, Xu L, Che X, Wen T, Fan Y,
Li C, Wang S, Cheng Y, Wang X, et al: CXCL9/10/11, a regulator of
PD-L1 expression in gastric cancer. BMC Cancer. 18:4622018.
View Article : Google Scholar : PubMed/NCBI
|
|
32
|
Ruiduo C, Ying D and Qiwei W: CXCL9
promotes the progression of diffuse large B-cell lymphoma through
up-regulating beta-catenin. Biomed Pharmacother. 107:689–695. 2018.
View Article : Google Scholar : PubMed/NCBI
|
|
33
|
Han B, Feng D, Yu X, Liu Y, Yang M, Luo F,
Zhou L and Liu F: MicroRNA-144 mediates chronic inflammation and
tumorigenesis in colorectal cancer progression via regulating C-X-C
motif chemokine ligand 11. Exp Ther Med. 16:1935–1943.
2018.PubMed/NCBI
|
|
34
|
Mayer IA and Arteaga CL: The PI3K/AKT
pathway as a target for cancer treatment. Annu Rev Med. 67:11–28.
2016. View Article : Google Scholar : PubMed/NCBI
|
|
35
|
Spangle JM, Roberts TM and Zhao JJ: The
emerging role of PI3K/AKT-mediated epigenetic regulation in cancer.
Biochim Biophys Acta Rev Cancer. 1868:123–131. 2017. View Article : Google Scholar : PubMed/NCBI
|
|
36
|
Cao Y, Xia F, Wang P and Gao M:
MicroRNA935p promotes the progression of human retinoblastoma by
regulating the PTEN/PI3K/AKT signaling pathway. Mol Med Rep.
18:5807–5814. 2018.PubMed/NCBI
|
|
37
|
Lunardi A, Webster KA, Papa A, Padmani B,
Clohessy JG, Bronson RT and Pandolfi PP: Role of aberrant PI3K
pathway activation in gallbladder tumorigenesis. Oncotarget.
5:894–900. 2014. View Article : Google Scholar : PubMed/NCBI
|
|
38
|
Dong J, Zhai B, Sun W, Hu F, Cheng H and
Xu J: Activation of phosphatidylinositol 3-kinase/AKT/snail
signaling pathway contributes to epithelial-mesenchymal
transition-induced multi-drug resistance to sorafenib in
hepatocellular carcinoma cells. PLoS One. 12:e01850882017.
View Article : Google Scholar : PubMed/NCBI
|
|
39
|
Xu S, Li Y, Lu Y, Huang J, Ren J, Zhang S,
Yin Z, Huang K, Wu G and Yang K: LZTS2 inhibits PI3K/AKT activation
and radioresistance in nasopharyngeal carcinoma by interacting with
p85. Cancer Lett. 420:38–48. 2018. View Article : Google Scholar : PubMed/NCBI
|
|
40
|
Xu W, Yang Z, Xie C, Zhu Y, Shu X, Zhang
Z, Li N, Chai N, Zhang S, Wu K, et al: PTEN lipid phosphatase
inactivation links the hippo and PI3K/Akt pathways to induce
gastric tumorigenesis. J Exp Clin Cancer Res. 37:1982018.
View Article : Google Scholar : PubMed/NCBI
|
|
41
|
Hamzehzadeh L, Atkin SL, Majeed M, Butler
AE and Sahebkar A: The versatile role of curcumin in cancer
prevention and treatment: A focus on PI3K/AKT pathway. J Cell
Physiol. 233:6530–6537. 2018. View Article : Google Scholar : PubMed/NCBI
|
|
42
|
Huang D, Du C, Ji D, Xi J and Gu J:
Overexpression of LAMC2 predicts poor prognosis in colorectal
cancer patients and promotes cancer cell proliferation, migration,
and invasion. Tumour Biol. 39:10104283177058492017. View Article : Google Scholar : PubMed/NCBI
|
|
43
|
Korbakis D, Dimitromanolakis A, Prassas I,
Davis GJ, Barber E, Reckamp KL, Blasutig I and Diamandis EP: Serum
LAMC2 enhances the prognostic value of a multi-parametric panel in
non-small cell lung cancer. Br J Cancer. 113:484–491. 2015.
View Article : Google Scholar : PubMed/NCBI
|
|
44
|
Moon YW, Rao G, Kim JJ, Shim HS, Park KS,
An SS, Kim B, Steeg PS, Sarfaraz S, Changwoo Lee L, et al: LAMC2
enhances the metastatic potential of lung adenocarcinoma. Cell
Death Differ. 22:1341–1352. 2015. View Article : Google Scholar : PubMed/NCBI
|
|
45
|
Hubbard NE, Chen QJ, Sickafoose LK, Wood
MB, Gregg JP, Abrahamsson NM, Engelberg JA, Walls JE and Borowsky
AD: Transgenic mammary epithelial osteopontin (spp1) expression
induces proliferation and alveologenesis. Genes Cancer. 4:201–212.
2013. View Article : Google Scholar : PubMed/NCBI
|
|
46
|
Ng L, Wan T, Chow A, Iyer D, Man J, Chen
G, Yau TC, Lo O, Foo CC, Poon JT, et al: Osteopontin overexpression
induced tumor progression and chemoresistance to oxaliplatin
through induction of stem-like properties in human colorectal
cancer. Stem Cells Int. 2015:2478922015. View Article : Google Scholar : PubMed/NCBI
|
|
47
|
Choe EK, Yi JW, Chai YJ and Park KJ:
Upregulation of the adipokine genes ADIPOR1 and SPP1 is related to
poor survival outcomes in colorectal cancer. J Surg Oncol.
117:1833–1840. 2018. View Article : Google Scholar : PubMed/NCBI
|
|
48
|
Zeng B, Zhou M, Wu H and Xiong Z: SPP1
promotes ovarian cancer progression via Integrin β1/FAK/AKT
signaling pathway. Onco Targets Therapy. 11:1333–1343. 2018.
View Article : Google Scholar
|
|
49
|
Zhang W, Fan J, Chen Q, Lei C, Qiao B and
Liu Q: SPP1 and AGER as potential prognostic biomarkers for lung
adenocarcinoma. Oncol Lett. 15:7028–7036. 2018.PubMed/NCBI
|
|
50
|
Zhang Y, Du W, Chen Z and Xiang C:
Upregulation of PD-L1 by SPP1 mediates macrophage polarization and
facilitates immune escape in lung adenocarcinoma. Exp Cell Res.
359:449–457. 2017. View Article : Google Scholar : PubMed/NCBI
|
|
51
|
He F, Chen H, Probst-Kepper M, Geffers R,
Eifes S, Del Sol A, Schughart K, Zeng AP and Balling R: PLAU
inferred from a correlation network is critical for suppressor
function of regulatory T cells. Mol Syst Biol. 8:6242012.
View Article : Google Scholar : PubMed/NCBI
|
|
52
|
Kurozumi A, Goto Y, Matsushita R, Fukumoto
I, Kato M, Nishikawa R, Sakamoto S, Enokida H, Nakagawa M, Ichikawa
T and Seki N: Tumor-suppressive microRNA-223 inhibits cancer cell
migration and invasion by targeting ITGA3/ITGB1 signaling in
prostate cancer. Cancer Sci. 107:84–94. 2016. View Article : Google Scholar : PubMed/NCBI
|
|
53
|
Sakaguchi T, Yoshino H, Yonemori M,
Miyamoto K, Sugita S, Matsushita R, Itesako T, Tatarano S, Nakagawa
M and Enokida H: Regulation of ITGA3 by the dual-stranded
microRNA-199 family as a potential prognostic marker in bladder
cancer. Br J Cancer. 116:1077–1087. 2017. View Article : Google Scholar : PubMed/NCBI
|
|
54
|
Sa KD, Zhang X, Li XF, Gu ZP, Yang AG,
Zhang R, Li JP and Sun JY: A miR-124/ITGA3 axis contributes to
colorectal cancer metastasis by regulating anoikis susceptibility.
Biochem Biophys Res Commun. 501:758–764. 2018. View Article : Google Scholar : PubMed/NCBI
|