Introduction
Obesity has become a major global healthcare issue
with increasing prevalence across the world. The condition is
highly associated with dyslipidemia, metabolic syndrome, type 2
diabetes, hypertension, hyperuricemia and many other diseases, and
is an independent risk factor for mortality and lower quality of
life for patients (1,2). Obesity is often considered to result in
decreased high-density lipoprotein-cholesterol (HDL-C), whilst the
level of HDL-C is negatively correlated with the incidence of
coronary heart disease (3). Numerous
studies have demonstrated that HDL has a protective effect on the
arterial wall therefore apolipoproteins related to the metabolism
of HDL are increasingly gaining attention. A recently discovered
apolipoprotein, ApoM, is an important part of HDL and contributes
considerably to the metabolism of HDL-C (4). Currently, it remains unclear whether
HDL-C deficiency in the blood is associated with ApoM level.
Furthermore, obesity is typically accompanied by hyperleptinemia
and hyperadiponectinemia, and certain studies have revealed that
leptin is associated with ApoM. However, it has not yet been
reported whether there is an association between adiponectin and
ApoM. Therefore, the present study investigated the underlying
mechanism of blood HDL-C deficiency during obesity via detection of
ApoM expression in obese mice, and also the possible association
between ApoM and adiponectin.
Insulin resistance (IR) is closely associated to
obesity (5,6) and can aggravate the progress of the
condition whilst promoting the development of diabetes,
hyperlipidemia and hypertension. IR is characterized by the
insensitivity of the target tissue to insulin, and also decreased
uptake and utilization of glucose in peripheral tissues. The liver
and peripheral tissues (fat and muscle) are the main sites of IR.
HepG2 cells are derived from hepatocytes and retain many of the
properties of hepatocytes. Following co-incubation with high
concentrations of insulin, HepG2 cells exhibit the functional
defects of insulin receptors and post-receptors (7–10). IR
induced by a high concentration of insulin in HepG2 cells is an
ideal cell model for studying this condition (11–14).
Presently, adiponectin is the only adipocyte-derived cytokine found
to have a protective effect on humans and can significantly improve
IR (15). In order to explore the
mechanism of adiponectin on ApoM, the effects of adiponectin on IR
in obese mice and IR HepG2 cells were investigated.
Materials and methods
Materials and reagents
C57BL/6N male mice (at 3 weeks of age) were
purchased from the Shanghai Experimental Animal Center of the
Chinese Academy of Sciences. The human hepatoblastoma cell line
HepG2 was kindly provided by the Xiangya School of Medicine,
Central South University (Changsha, China). Fluorescent
quantitative polymerase chain reaction (PCR) kit was purchased from
Promega Corporation. The antibody for ApoM detection was obtained
from Abcam (cat. no. ab66379) and an insulin ELISA kit (cat. no.
10-1247-01) was obtained from Mercodia. All PCR primers were
synthesized by Aoke Biotechnology Company, Ltd. (Table I). TRIzol® reagent was
purchased from Invitrogen (Thermo Fisher Scientific, Inc.). A
plasma insulin detection kit was purchased from Mercodia.
Recombinant mouse adiponectin was obtained from Abcam (cat. no.
ab54483).
 | Table I.Sequences of primers used for reverse
transcription-quantitative polymerase chain reaction. |
Table I.
Sequences of primers used for reverse
transcription-quantitative polymerase chain reaction.
| Gene | Resource | Primer | Sequence |
|---|
| ApoM | Mu | Forward |
5′-CAGTGCCCTGAGCACAGTCAA-3′ |
|
|
| Reverse |
5′-GCTGCTCCCGCAATAAAGTACC-3′ |
| ApoM | Hs | Forward |
5′-CTGACAACTCTGGGCGTGGA-3′ |
|
|
| Reverse |
5′-CAGAGCCAGCAGCCATATTGAA-3′ |
| Foxa2 | Mu | Forward |
5′-GTCGTCCGAGCAGCAACATC-3 |
|
|
| Reverse |
5′-GGGTAGTGCATGACCTGTTCGTAG-3′ |
| Foxa2 | Hs | Forward |
5′-CGTCCGACTGGAGCAGCTACTAT-3 |
|
|
| Reverse |
5′-CGGCGTTCATGTTGCTCAC-3′ |
| GAPDH | Mu | Forward |
5′-ACAGCAACAGGGTGGTGGAC-3′ |
|
|
| Reverse |
5′-TTTGAGGGTGCAGCGAACTT-3′ |
| GAPDH | Hs | Forward |
5′-CCATGTTCGTCATGGGTGTGAACCA-3′ |
|
|
| Reverse |
5′-GCCAGTAGAGGCAGGGATGATGTTC-3′ |
Animal grouping and treatment
The Ethics Committee of the Xiangya Hospital of
Central South University reviewed and approved this study. A total
of 32 C57BL/6N male mice (3 weeks of age), initially weighing ~9.5
g, were observed for 1 week whilst housed in single-cages (12-h
light/dark cycle; temperature 24–28°C, relative humidity 60–75%)
and fed individually. Mice were then randomly and evenly
distributed into four groups: The control group where mice were fed
with a regular diet for 12 weeks; the obese group where mice were
fed with a fat-rich diet (from Research Diets D12492) for 12 weeks;
the obese group with intervention where mice were fed with a
fat-rich diet (Research Diets D12492) for 12 weeks then treated
with adiponectin for a further 7 days; and the normal group with
intervention where mice were fed with a regular diet for 12 weeks
followed by 7 days of treatment with adiponectin. The recombinant
mouse adiponectin was dissolved in PBS reaching a final
concentration of 0.5 µg/µl. Adiponectin was administered to mice
intraperitoneally (IP) at 1.5 mg/kg body weight once per day for 7
days. It was administered at a speed of 10 µl/min from 17:00. Mice
had free access to food and water. At the end of the experiment,
body weight, fasting blood glucose and plasma adiponectin levels
were measured following which all mice were sacrificed under
anesthesia to minimize suffering. Mice were anesthetized by IP
injection of sodium pentobarbital (2%, 40 mg/kg) and executed by
cardiac puncture. Liver tissue was isolated and preserved in liquid
nitrogen. Visceral adipose tissue weight was obtained by measuring
the wet weight of the epididymidis and adipose tissue surrounding
the kidney with an electronic balance (the adhering tissue fluid
was removed by suction with filter paper). Plasma insulin and
adiponectin levels were determined by ELISA. Mice were fasted for
6–8 h then blood samples were obtained from the caudal vein to
determine fasting plasma glucose (FPG) level with a One-Touch blood
glucose meter (LifeScan, Inc.) The formula for calculation of IR
index was: IR index [Homeostatic model assessment (HOMA)-IR]=FPG ×
fasting insulin/22.5.
Animal diets
The basal diet was prepared by the Animal Laboratory
of Xiangya School of Medicine, providing energy of 15 kJ/g, with a
contribution of 23% protein, 65% carbohydrates and 12% fat. The
fat-rich diet (D12492) was provided by Research Diets Company,
providing energy of 22 kJ/g, with a contribution of 20% protein,
20% carbohydrates and 60% fat.
Maintenance and subculture of the
HepG2 cell line
The HepG2 cell line was cultured with Dulbecco's
modified Eagle's medium (Gibco; Thermo Fisher Scientific, Inc.),
supplemented with 10% fetal bovine serum (Tian Hang Biotechnology
Company) and 1.0×10⁵ U/l penicillin-streptomycin and
incubated under standard conditions (37°C, 5% CO2).
Medium was replaced every other day and subculture was performed
using 0.25% trypsin to detach cells from the culture vessel.
The liver is the organ with highest metabolic
activity in humans and is responsible for a variety of important
functions, such as lipid metabolism, therefore it is reasonable to
employ hepatic cells in studies on lipid metabolism in
vitro. It is extremely difficult to obtain normal hepatic cells
under physiological conditions, and normal human hepatic cells
usually exhibit marked individual differences that make it hard to
achieve stable subcultures. For example, the human hepatic cell
line HL-7702, which is derived from normal human hepatic tissue,
shows dramatic biological differences to primary hepatic cell
cultures. Human hepatic cell lines, L-02, LX-1 and LX-2 could be
regarded as good representatives of the human liver (16); however, they possess defective
regeneration abilities which makes them less suitable options for
in vitro experiments (17).
The HepG2 cell line, derived from human hepatoblastoma, possesses a
strong regenerative ability as well as the majority of all
liver-related functions (18,19), and
could effectively mimic the in vivo environment for lipid
metabolism. Therefore, the HepG2 cell line was selected to perform
all in vitro experiments.
Establishment of IR in HepG2 cell
model
Studies typically use glucose consumption as a
criterion to determine whether IR is successful (20–22).
HepG2 cells at logarithmic growth stage were digested, the cell
density adjusted to 5×10⁴ cells/ml using
serum-containing medium, then 200 µl cell suspension was added to
each well of a 96-well culture plate. Samples were divided into
either control group (no insulin stimulation, normal cultured
cells) or IR model group. Following monolayer adherence,
serum-containing medium was discarded and cells washed with PBS.
Serum-free medium was added to the control group and serum-free
medium containing 10−7 mol/l insulin was added to the
model group. The supernatant was removed from the culture medium 24
h following treatment, then glucose content was measured using the
glucose oxidase assay kit (Zhongbei Biotechnology Co., Ltd.). The
glucose consumption was determined by calculating the difference
between glucose content in the cell culture medium without cells
and glucose content in the experimental group.
Cell groups and interventions
Adiponectin was used as an intervention in IR HepG2
cells and HepG2 cells for 24 h. All chemicals were dissolved in
dimethyl sulphoxide (DMSO) and the final concentration of DMSO in
media was maintained at 0.1% (v/v). The treatment groups were as
follows: Control group, which was treated with 0.1% DMSO; IR group,
which was treated with 10−7 mol/l insulin; adiponectin
intervention IR group, which was treated with a combination of
10−7 mol/l insulin and 30 µg/ml adiponectin; and
adiponectin intervention group, which was treated with 30 µg/ml
adiponectin. All treatments lasted 24 h, then glucose consumption
and ApoM and forkhead box A2 (Foxa2) gene expression were evaluated
in each group.
Reverse transcription-quantitative
polymerase chain reaction (RT-qPCR)
Total RNA was extracted from mouse liver and other
tissues using TRIzol (Invitrogen; Thermo Fisher Scientific, Inc.)
according to the manufacturer's protocol. RNA was inspected under
ultraviolet light following formaldehyde-denatured agarose gel
electrophoresis for 10 min (stained with ethidium bromide, buffered
with 1X MOPS, applied with constant voltage of 5 V/cm). The
synthesis of cDNA was performed according to the Avian
Myeloblastosis Virus reverse transcriptase protocol (Promega
Corporation), and purified via the PAGE method. GAPDH mRNA was
employed as the loading control to ensure even loading of all RNA
samples. The buffer for SYBR Green Real Time PCR and reaction
conditions were selected based on the manufacturer's protocol for
the Real Time PCR Master kit (Promega Corporation): 50°C for 2 min,
95°C for 10 min for the first cycle, and 95°C for 15 sec, 61°C for
45 sec and 61°C for 10 sec for 40 cycles, until the reaction ended.
The transcription level of target genes (Table I) in all samples was normalized to
the internal reference gene GAPDH and analyzed via the
2−∆∆Cq method (23).
Detection of ApoM expression by
western blot analysis
Proteins were extracted using RIPA lysis buffer
(Shanghai Biyuntian Biotechnology Co., Ltd.) from cultured
cells or mouse livers. Proteins were then determined via a BCA
assay. For each sample, 50 µg of total protein was diluted in
loading buffer, boiled in a 100°C water bath for 10 min then stored
on ice. Protein samples were separated by 6% SDS-PAGE then
transferred onto polyvinylidene difluoride membranes and blocked
with 5% skimmed milk for 2 h. Then the membrane was incubated with
primary antibody ApoM (1:500) at 4°C overnight. Membranes were
washed in a mixture of tris-buffered saline and Polysorbate (TBST)
three times (10 min/wash) then incubated in horseradish
peroxidase-conjugated secondary antibody (1:2,000) for 1 h at RT
then washed in TBST three more times. X-ray films were used to
capture the signals from membranes that had been processed using a
western blot chemiluminescence detection reagent kit (Pierce;
Thermo Fisher Scientific, Inc.) The bands on films were analyzed
with TINA 2.09 image processing software (Raytest). Densitometry
analysis was performed with the control group set as 100% for
comparisons with bands of other groups and for related quantitative
analysis. β-actin was used as loading control.
Statistical analysis
All experimental data are presented as the mean ±
standard deviation and analyzed with the software SPSS 15.0 (SPSS,
Inc.). Comparisons among groups were evaluated using one-way
analysis of variance and Student-Newman-Keuls test. P<0.05 was
considered to indicate significant difference.
Results
Comparisons of body weight, visceral
adipose tissue weight, blood glucose, insulin, HOMA-IR and plasma
adiponectin amongst groups
At the end of week 12, body weight and visceral
adipose tissue weight of the obese group and the obese group with
intervention were significantly higher compared with the control
group (P<0.05; Table II). The
levels of blood glucose, insulin and HOMA-IR were all elevated
compared with the control group which indicated that the continuous
fat-rich diet could lead to elevated blood glucose,
hyperinsulinemia and IR. The adiponectin level in the obese group
was markedly decreased when compared with the control group
(P<0.05; Table II). Intervention
with adiponectin in obese mice was associated with lower levels of
blood glucose, insulin and HOMA-IR compared with the obese group
(P<0.05; Table II). Plasma
adiponectin in the obese group with intervention was significantly
higher compared with the obese group, however there was no
significant difference in visceral adipose tissue weight
(P>0.05; Table II). Intervention
in the control group led to elevated plasma adiponectin level
compared with the control group without intervention, however no
significant differences were observed in terms of visceral adipose
tissue weight, levels of blood glucose, insulin and HOMA-IR
(P>0.05; Table II).
| Table II.Comparisons of body weight, visceral
adipose tissue weight, levels of blood glucose, insulin, HOMA-IR
and plasma adiponectin. |
Table II.
Comparisons of body weight, visceral
adipose tissue weight, levels of blood glucose, insulin, HOMA-IR
and plasma adiponectin.
| Variables | Control | Obesity | Obesity with
intervention | Control with
intervention |
|---|
| Body weight by the
end of 12th week (g) | 29.21±1.51 |
42.37±1.42a |
42.67±1.33a | 28.92±1.32 |
| Visceral adipose
tissue weight (g) | 0.55±0.02 |
1.81±0.50a |
1.79±0.32a | 0.54±0.03 |
| Blood glucose
(mmol/l) | 8.69±1.13 |
13.66±1.27a |
11.23±1.23a,b | 8.50±1.17 |
| Plasma insulin
(ng/ml) | 0.35±0.02 |
0.75±0.05a |
0.60±0.07a,b | 0.33±0.02 |
| HOMA-IR | 0.13±0.01 |
0.45±0.03a |
0.30±0.05a,b | 0.12±0.01 |
| Adiponectin
(mg/l) | 2.11±0.03 |
1.32±0.07a |
1.97±0.03b |
3.19±0.07a |
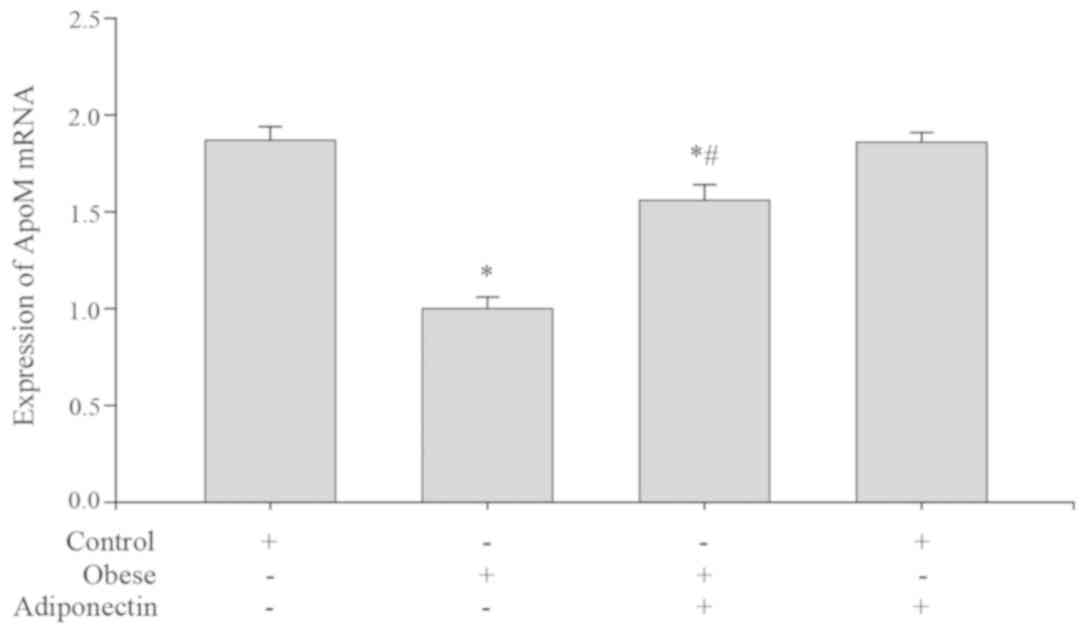
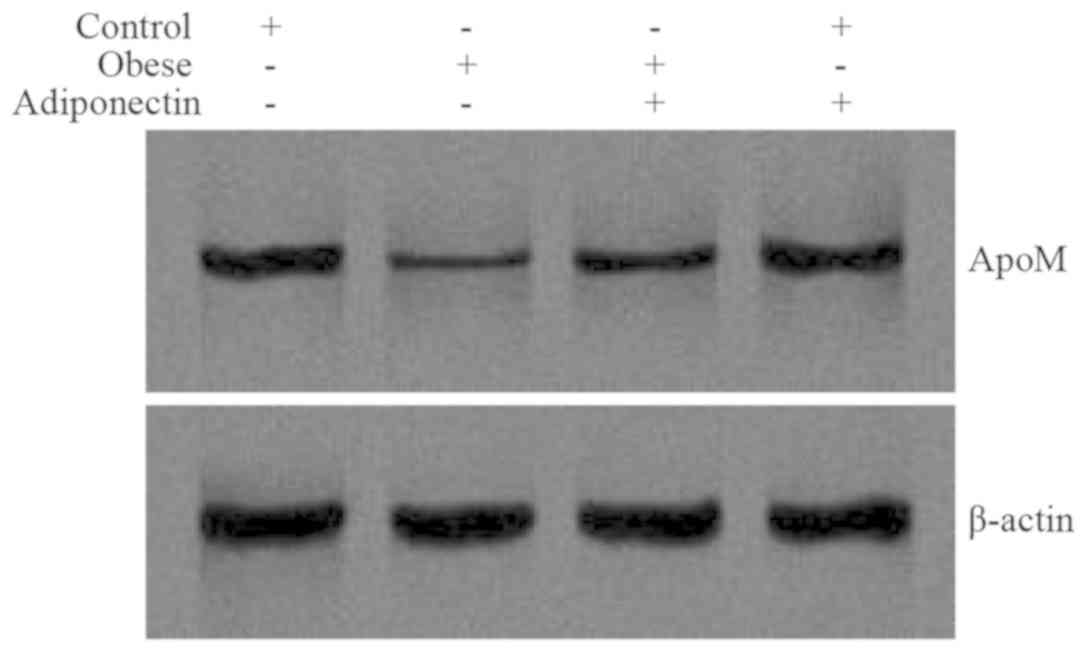
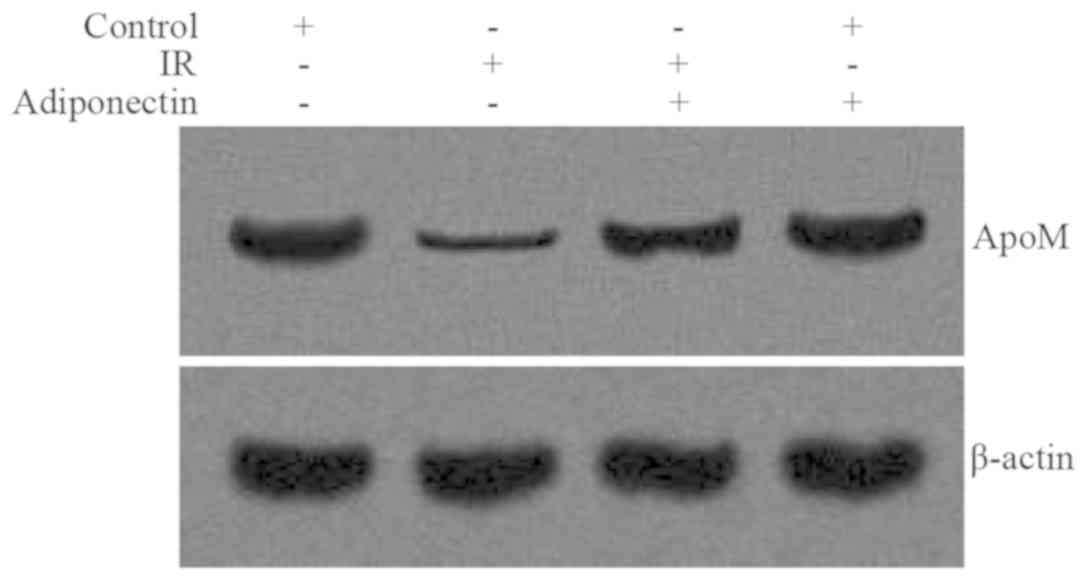
Levels of ApoM mRNA and protein in
mouse livers
ApoM mRNA expression (Fig. 1) and protein levels (Fig. 2) in the obese group were markedly
decreased when compared with the control group (P<0.05).
Following intervention with adiponectin, ApoM mRNA expression
(Fig. 1) and protein levels
(Fig. 2) were elevated in the obese
group with intervention, compared with the obese group. There was
no significant difference between the control group with
intervention and the control group (P>0.05).
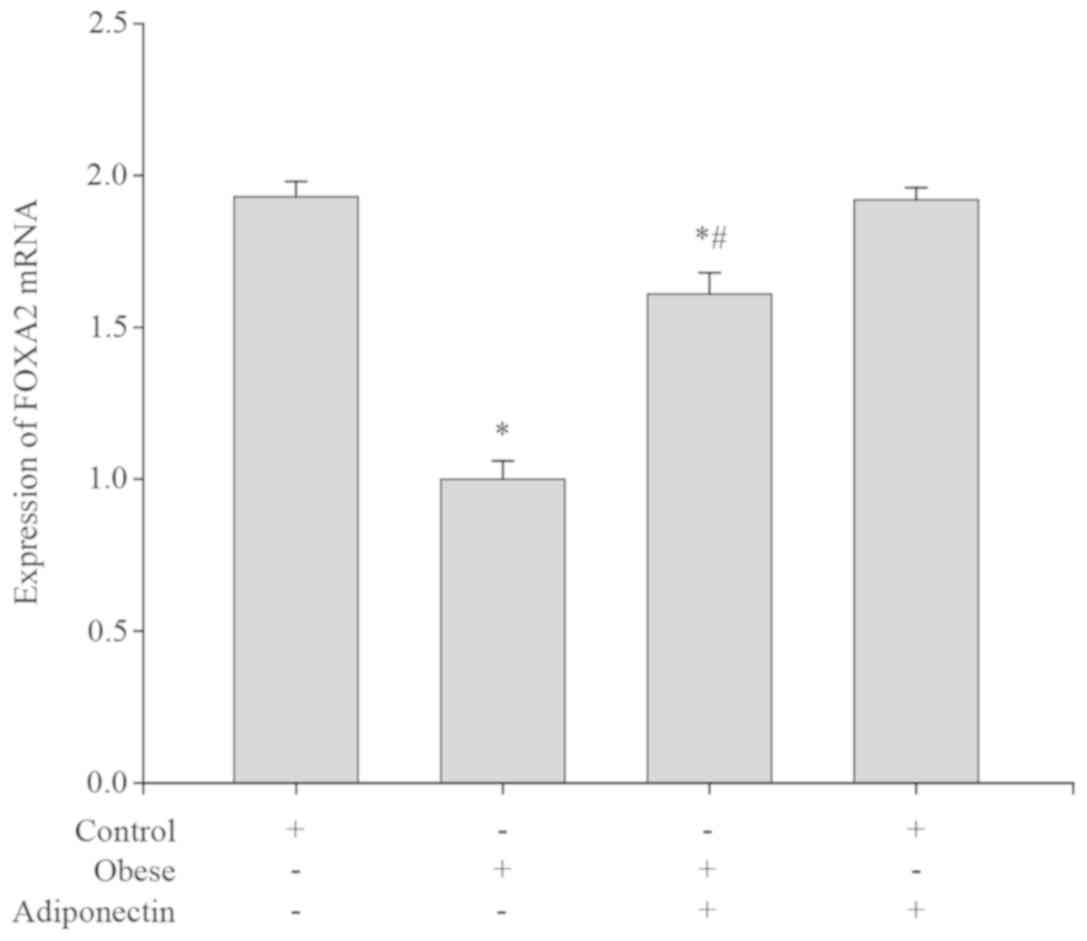
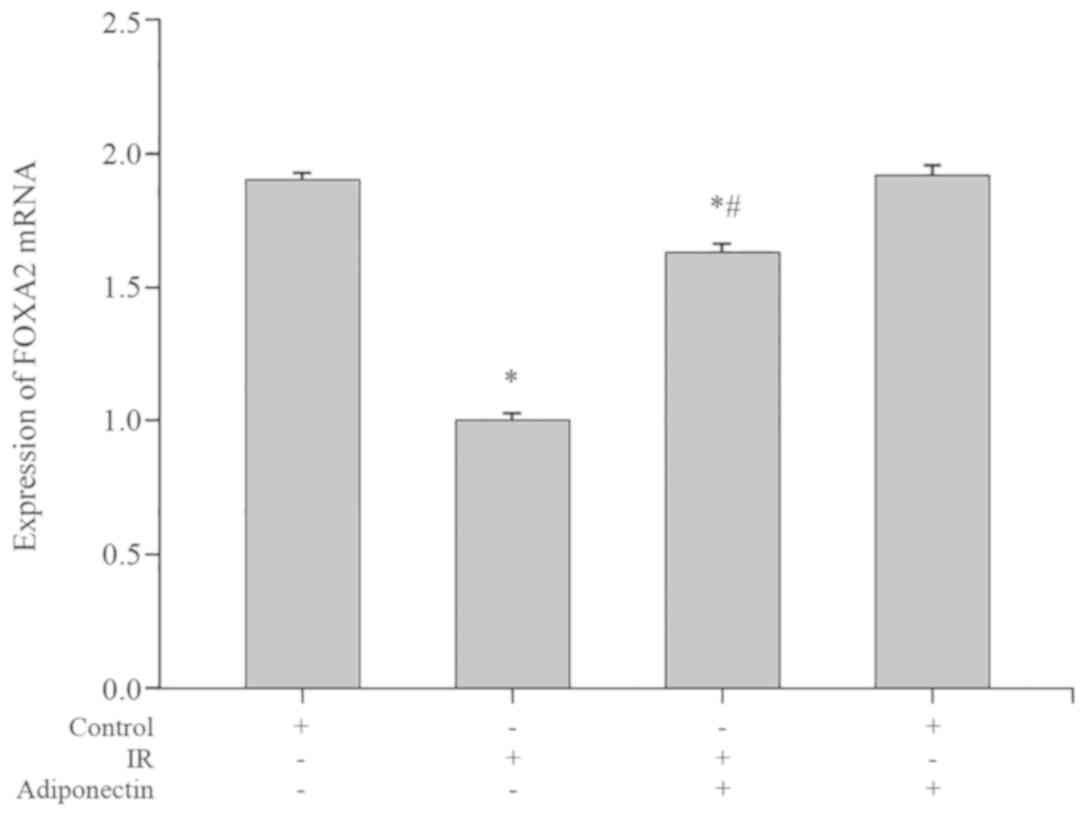
Foxa2 mRNA expression levels in mouse
livers
Compared with the control group, the Foxa2 mRNA
expression levels were significantly lower in the obese group
(P<0.05; Fig. 3). Following
intervention with adiponectin, the Foxa2 mRNA expression level was
markedly elevated in the obese group with intervention compared
with the obese group (P<0.05; Fig.
3). However, there was no significant difference in Foxa2 mRNA
expression levels between the control group and the control group
with intervention (P>0.05; Fig.
3).
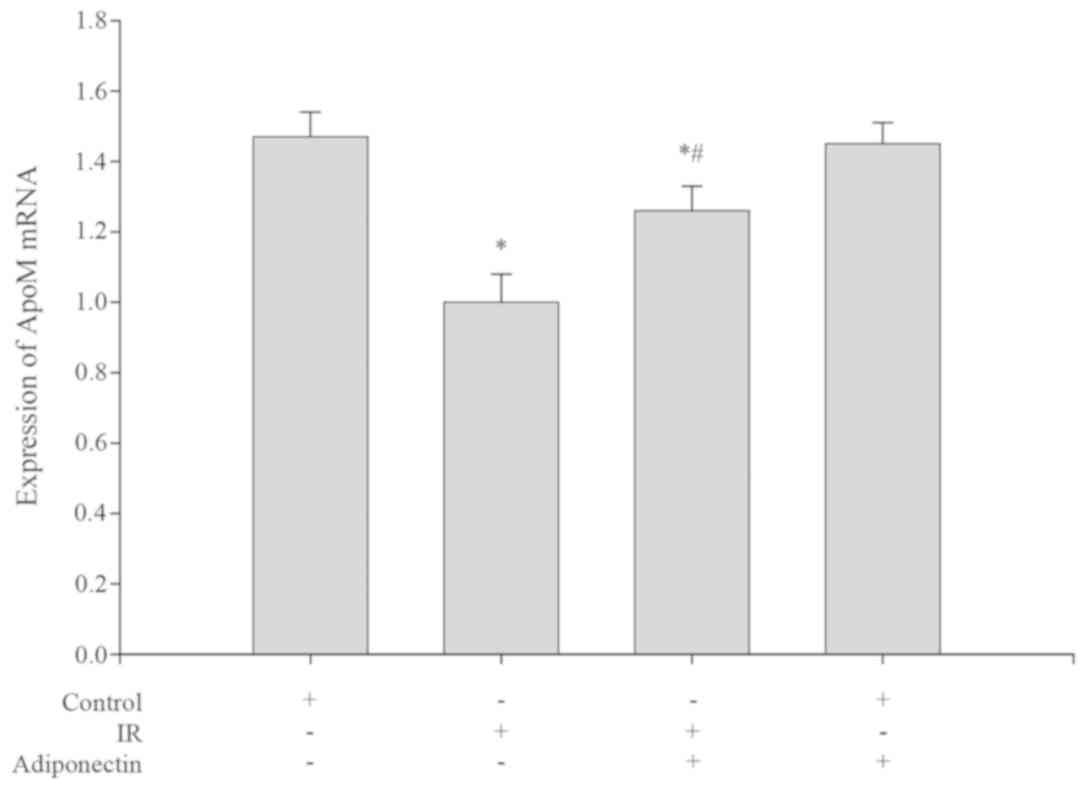
Levels of ApoM mRNA and protein in
HepG2 cells
Compared with the control group, the levels of ApoM
mRNA expression and protein were significantly decreased in the IR
group (P<0.05; Figs. 4 and
5). Following intervention, the
levels of ApoM mRNA expression and protein were both significantly
increased in the adiponectin intervention IR group compared with
the IR group (P<0.05; Figs. 4 and
5). There were no significant
differences in ApoM mRNA expression or protein levels between the
control group and the adiponectin intervention group (P>0.05;
Figs. 4 and 5).
Foxa2 mRNA expression levels in HepG2
cells
Compared with the control group, the Foxa2 mRNA
expression levels were significantly decreased in the IR group
(P<0.05; Fig. 6). Following
treatment with adiponectin, the Foxa2 mRNA expression levels were
significantly increased in the adiponectin intervention IR group
compared with the IR group (P<0.05; Fig. 6). However, no significant difference
in Foxa2 mRNA expression levels were observed between the control
group and the adiponectin intervention group (P>0.05; Fig. 6).
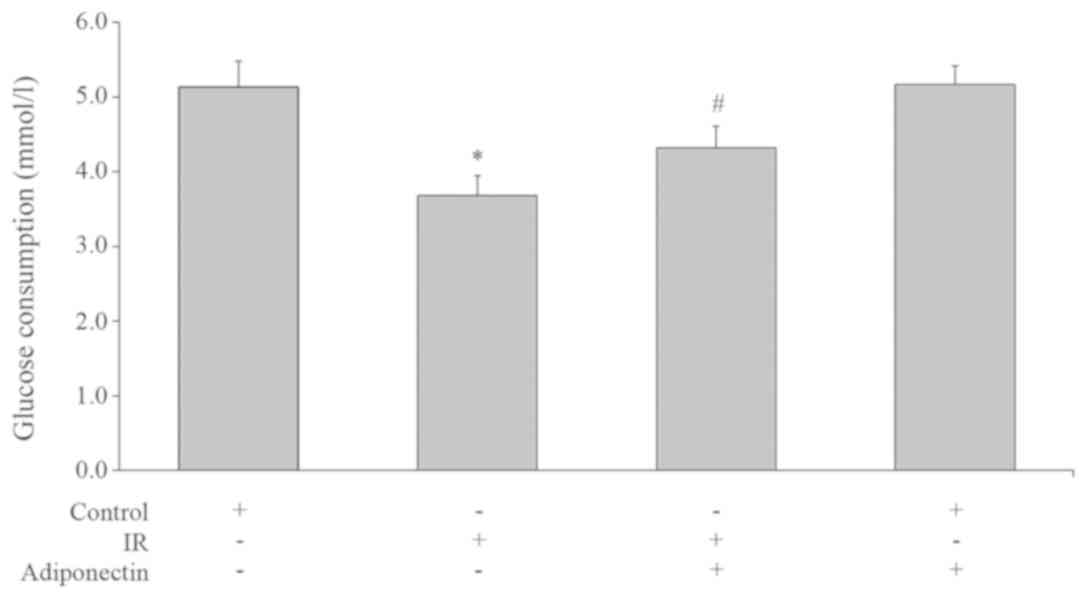
Glucose consumption in HepG2
cells
Glucose consumption in the IR group was
significantly lower than the control group (P<0.05; Fig. 7). This suggested that the glucose
consumption capacity of the cells in the IR group was decreased,
and the glucose uptake and utilization was impaired, which resulted
in IR. Glucose consumption of the adiponectin intervention IR group
was higher than the IR group (P<0.05; Fig. 7) which suggested that adiponectin
could increase the glucose consumption of IR HepG2 cells. There was
no significant difference in glucose consumption between
adiponectin intervention group and control group (P>0.05;
Fig. 7).
Discussion
Obesity is closely associated with cardiovascular
diseases, and is an independent risk factor for mortality and lower
quality of life. Obesity is often correlated with disorders in
carbohydrate and fat metabolism, the most significant of which is
HDL-C deficiency, a risk factor for coronary heart disease.
However, the mechanism by which HDL-C deficiency occurs in obesity
remains unclear. Current evidence indicates that HDL-C deficiency
could occur in obese patients because its particle size is small
enough to easily penetrate the filter structure of the kidney and
due to an overactive catabolism (24). ApoM is a recently discovered
apolipoprotein that is closely associated with HDL-C. Increased
HDL-C in plasma was observed in ApoM over-expressing mice whilst
silencing of the ApoM gene resulted in a significant decrease in
plasma HDL-C levels and a complete abolishment of pre-β-HDL, the
primary form of HDL during its maturation as well as an important
cholesterol receptor in somatic cells. The clearance rate of HDL
from plasma and the uptake rate by somatic cells lacking ApoM were
significantly increased (4). It has
also been demonstrated that ApoM is the receptor for
sphingosine-1-phosphate (S1P) in HDL particles with function
primarily achieved via the ApoM/S1P axis (25–27).
Furthermore, studies have identified that ApoM gene polymorphism is
related to the metabolism of HDL in obese Korean male adults
(28). The aforementioned findings
demonstrate that ApoM is an important regulator in HDL-C
metabolism. The present study demonstrated that mouse liver ApoM
gene expression was significantly decreased in obese mice, which
indicated that the decreased level of ApoM could be the underlying
cause of HDL-C deficiency in obese patients. Since ApoM may affect
the retro-trafficking of cholesterol via regulating the synthesis
of pre-β-HDL, it was speculated that an abnormal ApoM level could
lead to attenuated retro-trafficking of cholesterol in obese
patients and subsequently accelerate the progression of
obesity-related atherosclerosis.
In addition to its energy storage function, adipose
tissue may also have some endocrinal functions and be closely
associated with cardiovascular diseases via a series of
adipocytokines (29). Both in
vitro and in vivo studies have revealed that an
adipocytokine, leptin, is an important regulator for ApoM
expression (30,31). Studies have reported that the level
of another adipocytokine, adiponectin, is positively correlated
with HDL-C (32,33). Therefore, the present study
speculated that the metabolism of HDL might be related to
adiponectin and the effect of adiponectin on ApoM was
investigated.
Adiponectin is mainly secreted by adipose tissue and
is currently the only known protective adipocytokine effectively
alleviating IR and demonstrating anti-inflammatory and
anti-atherosclerosis properties (34,35). The
present study demonstrated that obese mice exhibited an elevated
plasma adiponectin level and ApoM expression was upregulated
following adiponectin-treatment. Adiponectin intervention IR cells
also exhibited marked upregulation of ApoM expression, which
collectively suggested that the decreased ApoM expression in
obesity was correlated with decreased adiponectin levels.
Therefore, elevated adiponectin level may upregulate ApoM
expression, indicating that adiponectin is another adipocytokine
responsible for ApoM expression regulation. It is notable that the
regulatory role of adiponectin on ApoM expression was only observed
in IR HepG2 cells and not in normal HepG2 cells, suggesting that IR
is required as a pre-condition for the regulatory effects of
adiponectin. This was supported by the observation that adiponectin
intervention in normal mice failed to upregulate ApoM
expression.
Foxa2 is a crucial nuclear factor influencing the
development of the liver and pancreas, and is also responsible for
regulation of carbohydrate metabolism in hepatic and β cells
(36,37). Wolfrum et al (38) confirmed the existence of a binding
site for Foxa2 located 474 bp upstream of the promoter for ApoM
gene, and demonstrated that ApoM expression was decreased in
Foxa2(+/−) mice. In addition, injection of adenovirus
encoding Foxa2 into mice could markedly elevate ApoM expression,
which indicated that ApoM was a target gene of Foxa2. In the
scenario of IR, insulin could inhibit transcription activity via
the insulin/PI3K/AKT signaling pathway to downregulate the activity
of Foxa2. Since hyperinsulinemia and IR usually accompany obesity,
adiponectin is likely to indirectly regulate ApoM expression via
ameliorating IR. This is supported by the observation of the
present study that insulin sensitivity was increased in obese mice
following adiponectin intervention. Adiponectin intervention in
obese mice and IR HepG2 cells markedly upregulated Foxa2 mRNA
expression however it had minimal effect on normal mice, which
indicated that adiponectin could indirectly upregulate Foxa2
expression via ameliorating IR, and therefore exert influence on
ApoM.
In summary, ApoM gene expression in obese mice was
markedly decreased, the mechanism of which may be associated with
hypoadiponectinemia. Adiponectin promoted ApoM expression via
upregulating Foxa2 gene expression, with this function of
adiponectin most likely achieved indirectly by ameliorating IR.
Acknowledgements
Not applicable.
Funding
The present study was supported by the Natural
Science Foundation of Hunan Province, China (grant no. 14JJ7006),
and the Science and Technology Innovation Planning Project of Hunan
Province, China (grant no. 2017SK50104).
Availability of data and materials
The datasets used and/or analyzed during the current
study are available from the corresponding author on reasonable
request.
Authors' contributions
LY, TL, SPZ and SDZ conceived and designed the
experiments. LY and TL performed the experiments. LY and TL
collected and analyzed the data. LY and TL wrote the manuscript.
All authors read and approved the final manuscript.
Ethics approval and consent to
participate
Animal care and handling were completed in
accordance with the National Institutes of Health Guide for the
Care and Use of Laboratory Animals. All procedures were approved by
the Ethics Committee of the Xiangya Hospital of Central South
University (Changsha, China).
Patient consent for publication
Not applicable.
Competing interests
The authors declare that they have no competing
interests.
References
|
1
|
Ravussin A and Bouchard C: Human genomics
and obesity: Finding appropriate drug targets. Eur J Pharmacol.
410:131–145. 2000. View Article : Google Scholar : PubMed/NCBI
|
|
2
|
Abbasi F, Brown BW Jr, Lamendola C,
McLaughlin T and Reaven GM: Relationship between obesity, insulin
resistance, and coronary heart disease risk. J Am Coll Cardiol.
40:937–943. 2002. View Article : Google Scholar : PubMed/NCBI
|
|
3
|
Sacks FM; Expert Group on HDL Cholesterol,
: The role of high-density lipoprotein (HDL) cholesterol in the
prevention and treatment of coronary heart disease: Expert group
recommendations. AM J cardiol. 90:139–143. 2002. View Article : Google Scholar : PubMed/NCBI
|
|
4
|
Wolfrum C, Poy MN and Stoffel M:
Apolipoprotein M is required for prebeta-HDL formation and
cholesterol efflux to HDL and protects against atherosclerosis. Nat
Med. 11:418–422. 2005. View
Article : Google Scholar : PubMed/NCBI
|
|
5
|
Everson SA, Goldbeng DE, Helmrich SP,
Lakka TA, Lynch JW, Kaplan GA and Salonen JT: Weight gain and the
risk of developing insulin resistance syndrome. Diabetes Care.
21:1637–1643. 1998. View Article : Google Scholar : PubMed/NCBI
|
|
6
|
Caro JF: Clinical review 26: Insulin
resistance in obese and nonobese man. J Clin Endocrinol Metab.
73:691–695. 1991. View Article : Google Scholar : PubMed/NCBI
|
|
7
|
Podskalny JM, Takeda S, Silverman RE, Tran
D, Carpentier JL, Orci L and Gorden P: Insulin receptors and
bioresponses in a human liver cell line (Hep G-2). Eur J Biochem.
1502:401–407. 1985. View Article : Google Scholar
|
|
8
|
Brillon DJ, Freidenberg GR, Henry RR and
Olefsky JM: Mechanism of defective insulin-receptor kinase activity
in NIDDM. Evidence for two receptor populations. Diabetes.
38:397–403. 1989. View Article : Google Scholar : PubMed/NCBI
|
|
9
|
Hari J and Roth RA: Defective
internalization of insulin and its receptor in cells expressing
mutated insulin receptors lacking kinase activity. J Biol Chem.
262:15341–15344. 1987.PubMed/NCBI
|
|
10
|
Amatruda JM and Roncone AM: Normal hepatic
insulin receptor autophosphorylation in nonketotic diabetes
mellitus. Biochem Biophys Res Commun. 129:163–170. 1985. View Article : Google Scholar : PubMed/NCBI
|
|
11
|
Changgui L, Guang N and Jialun C:
Establishing and identifing insulin resistant HepG2 cell line. Chin
J Diabetes. 7:198–199. 1999.
|
|
12
|
Xie P, Liu ML, Gu YP, Lu J, Xu X, Zeng WM
and Song HP: Oestrogen improves glucose metabolism and insulin
signal transduction in HepG2 cells. Clin Exp Pharmacol Physiol.
30:643–648. 2003. View Article : Google Scholar : PubMed/NCBI
|
|
13
|
Zhang HJ, Ji BP, Chen G, Zhou F, Luo YC,
Yu HQ, Gao FY, Zhang ZP and Li HY: A combination of grape
seed-derived procyanidins and gypenosides alleviates insulin
resistance in mice and HepG2 cells. J Food Sci. 74:H1–H7. 2009.
View Article : Google Scholar : PubMed/NCBI
|
|
14
|
Xie W, Wang W, Su H, Xing D, Pan Y and Du
L: Effect of ethanolic extracts of Ananas comosus L. leaves on
insulin sensitivity in rats and HepG2. Comp Biochem Physiol C
Toxicol Pharmacol. 143:429–435. 2006. View Article : Google Scholar : PubMed/NCBI
|
|
15
|
Haluzik M, Parízková J and Haluzík MM:
Adiponectin and its role in the obesity induced insulin resistance
and related complications. Physiol Res. 53:123–129. 2004.PubMed/NCBI
|
|
16
|
Yamashita R, Saito T, Satoh S, Kaburagi Y
and Sekihara H: Effects of dehydroepiandrosterone on gluconeogenic
enzymes and glucose uptake in human hepatoma cell line, HepG2.
Endocr J. 52:727–733. 2005. View Article : Google Scholar : PubMed/NCBI
|
|
17
|
Chavez-Tapia NC, Rosso N and Tiribelli C:
In vitro models for the study of non-alcoholic fatty liver disease.
Curr Med Chem. 18:1079–1084. 2011. View Article : Google Scholar : PubMed/NCBI
|
|
18
|
Pullinger CR, North JD, Teng BB, Rifici
VA, Ronhild de Brito AE and Scott J: The apolipoprotein B gene is
constituently expressed in HepG2 cells: Regulation by oleic acid,
albumin, and insulin, and measurement of the mRNA half life. J
Lipid Res. 30:1065–1077. 1989.PubMed/NCBI
|
|
19
|
Chao PM and Kuo YH, Lin YS, Chen CH, Chen
SW and Kuo YH: The metabolic benefits of Polygonum hypoleucum Ohwi
in HepG2 cells and Wistar rats under lipogenic stress. J Agric Food
Chem. 58:5174–5180. 2010. View Article : Google Scholar : PubMed/NCBI
|
|
20
|
Liu Z, Kuang W, Xu X, Li D, Zhu W, Lan Z
and Zhang X: Putative identification of components in Zengye
Decoction and their effects on glucose consumption and lipogenesis
in insulin-induced insulin-resistant HepG2 cells. J Chromatogr B
Analyt Technol Biomed Life Sci. 1073:145–153. 2018. View Article : Google Scholar : PubMed/NCBI
|
|
21
|
Zheng X, Ke Y, Feng A, Yuan P, Zhou J, Yu
Y, Wang X and Feng W: The Mechnism by which amentoflavone improves
insulin resistance in HepG2 cells. Molecules. 21(pii): E6242016.
View Article : Google Scholar : PubMed/NCBI
|
|
22
|
Nie J, Chang Y, Li Y, Zhou Y, Qin J, Sun Z
and Li H: Caffeic acid phenethyl ester (Propolis Extract)
ameliorates insulin resistance by inhibiting JNK and NF-κB
inflammatory pathways in diabetic mice and HepG2 cell models. J
Agric Food Chem. 65:9041–9053. 2017. View Article : Google Scholar : PubMed/NCBI
|
|
23
|
Livak KJ and Schmittgen TD: Analysis of
relative gene expression data using real-time quantitative PCR and
the 2(-Delta Delta C(T)) method. Methods. 25:402–408. 2001.
View Article : Google Scholar : PubMed/NCBI
|
|
24
|
Horowitz BS, Goldberg IJ, Merab J, Vanni
TM, Ramakrishnan R and Ginsberg HN: Increased plasma and renal
clearance of an exchangeable pool of apolipoprotein A-I in subjects
with low levels of high density lipoprotein cholesterol. J Clin
Invest. 91:1743–1752. 1993. View Article : Google Scholar : PubMed/NCBI
|
|
25
|
Ruiz M, Frej C, Holmér A, Guo LJ, Tran S
and Dahlbäck B: High-density lipoprotein-associated apolipoprotein
M limits endothelial inflammation by delivering
Sphingosine-1-phosphate to the Sphingosine-1-phosphate receptor 1.
Arterioscler Thromb Vasc Biol. 37:118–129. 2017. View Article : Google Scholar : PubMed/NCBI
|
|
26
|
Ruiz M, Okada H and Dahlbäck B:
HDL-associated ApoM is anti-apoptotic by delivering sphingosine
1-phosphate to S1P1 & S1P3 receptors on vascular endothelium.
Lipids Health Dis. 16:362017. View Article : Google Scholar : PubMed/NCBI
|
|
27
|
Frej C, Mendez AJ, Ruiz M, Castillo M,
Hughes TA, Dahlbäck B and Goldberg RB: A shift in ApoM/S1P between
HDL-Particles in women with type 1 diabetes mellitus is associated
with impaired anti-Inflammatory effects of the ApoM/S1P complex.
Arterioscler Thromb Vasc Biol. 37:1194–1205. 2017. View Article : Google Scholar : PubMed/NCBI
|
|
28
|
Lee M, Kim JI, Choi S, Jang Y and Sorn SR:
The effect of apoM polymorphism associated with HDL metabolism on
obese Korean Adults. J Nutrigenet Nutrigenomics. 9:306–317. 2016.
View Article : Google Scholar : PubMed/NCBI
|
|
29
|
Calabro P and Yeh ET: Obesity,
inflammation, and vascular disease: The role of the adipose tissue
as an endocrine organ. Subcell Biochem. 42:63–91. 2007. View Article : Google Scholar : PubMed/NCBI
|
|
30
|
Xu N, Nilsson-Ehle P, Hurtig M and Ahrén
B: Both leptin and leptin-receptor are essential for apolipoprotein
M expression in vivo. Biochem Biophys Res Commun. 321:916–921.
2004. View Article : Google Scholar : PubMed/NCBI
|
|
31
|
Luo G, Hurtig M, Zhang X, Nilsson-Ehle P
and Xu N: Leptin inhibits apolipoprotein M transcription and
secretion in human hepatoma cell line, HepG2 cells. Biochim Biophys
Acta. 1734:198–202. 2005. View Article : Google Scholar : PubMed/NCBI
|
|
32
|
Tsubakio-Yamamoto K, Sugimoto T, Nishida
M, Okano R, Monden Y, Kitazume-Taneike R, Yamashita T, Nakaoka H,
Kawase R, Yuasa-Kawase M, et al: Serum adiponectin level is
correlated with the size of HDL and LDL particles determined by
high performance liquid chromatography. Metabolism. 61:1763–1770.
2012. View Article : Google Scholar : PubMed/NCBI
|
|
33
|
Altinova AE, Toruner F, Bukan N, Yasar DG,
Akturk M, Cakir N and Arslan M: Decreased plasma adiponectin is
associated with insulin resistance and HDL cholesterol in
overweight subjects. Endocr J. 54:221–226. 2007. View Article : Google Scholar : PubMed/NCBI
|
|
34
|
Zietz B, Herfaah H, Paul G, Ehling A,
Müller-Ladner U, Schölmerich J and Schäffler A: Adiponectin
represents and independent cardiovascular risk factor predicting
serum HDL-C levels in type 2 diabetes. FEBS Lett. 545:103–104.
2003. View Article : Google Scholar : PubMed/NCBI
|
|
35
|
Dullaart RP, de Vries R, van Tol A and
Sluiter WJ: Lower plasma adiponectin is a marker of increased
intima-media thickness assiciated with type 2 diabetes mellitus and
with male gender. Eur J Endocrinol. 156:387–394. 2007. View Article : Google Scholar : PubMed/NCBI
|
|
36
|
Sund NJ, Vatamaniuk MZ, Casey M, Ang SL,
Magnuson MA, Stoffers DA, Matschinsky FM and Kaestner KH:
Tissue-specific deletion of Foxa2 in pancreatic beta cells results
in hyperinsulinemic hypoglycemia. Genes Dev. 15:1706–1715. 2001.
View Article : Google Scholar : PubMed/NCBI
|
|
37
|
Lee CS, Friedman JR, Fulmer JT and
Kaestner KH: The initiation of liver development is dependent on
Foxa transcription factors. Nature. 435:944–947. 2005. View Article : Google Scholar : PubMed/NCBI
|
|
38
|
Wolfrum C, Howell JJ, Ndungo E and Stoffel
M: Foxa2 activity increases plasma high density lipoprotein levels
by regulating apolipoprotein M. J Biol Chem. 283:16940–16949. 2008.
View Article : Google Scholar : PubMed/NCBI
|