Introduction
Reprogramming of the energy metabolism and evasion
of immune surveillance are two emerging hallmarks of cancer
(1). Cancer cells feature enhanced
glucose uptake and utilize glycolysis as a major way of energy
metabolism. The glycolytic pathway is active in cancer cells, even
under normoxic conditions, and supports their rapid proliferation.
This phenomenon is generally known as aerobic glycolysis or the
Warburg effect (2,3). Due to the defective vasculature in
tumor tissues, hypoxia is common among various types of cancer and
is also an important trigger for glycolysis (4). Abnormal expression of oncogenes and
mitochondrial DNA mutations may also contribute to the enhanced
glycolysis in cancer cells (3).
Previous studies have indicated that the Warburg effect may
increase the production of ATP and provide more metabolic
intermediates and precursors, which may be used for the
biosynthesis of macromolecules. Furthermore, this process can
enhance the tolerance of cancer cells to chemotherapies (5).
Recent studies have suggested that, in addition to
the direct stimulation of the growth of cancer cells, glycolysis
has an important role in the induction of immune tolerance of
cancer. Carmona-Fontaine et al (6) reported that hypoxia and cancer-derived
lactate, which is a by-product of glycolysis, may induce the
expression of arginase 1 and macrophage mannose receptor 1
proteins, also known as M2-like markers, by tumor-associated
macrophages (TAMs). TAMs are one of the most important components
of the tumor microenvironment, accounting for 6–14% of total cells
in the tumor tissue (7). A previous
study by our group has also suggested that bladder cancer cells are
able to re-program RAW264.7 cells into M2-like macrophages in
microfluidic tumor microenvironment chips (8). However, the detailed effects of lactate
on macrophages, particularly under hypoxic conditions, have
remained largely elusive.
In the present study, an in-depth analysis of the
transcriptome data of bone marrow-derived macrophages (BMDMs)
stimulated by lactate and hypoxia, which were reported by
Carmona-Fontaine et al (6),
was performed. The algorithms, including gene enrichment analysis,
gene set enrichment analysis (GSEA) and weighted gene co-expression
network analysis (WGCNA), were jointly utilized in order to analyze
the influence of lactate and hypoxia on macrophages, and to provide
insight to the therapeutic applications of cancer cell metabolism
in targeted therapies for cancer.
Materials and methods
Data accession and pre-processing
Raw mRNA read count data were retrieved from the
GSE93702 dataset of the gene expression omnibus (GEO) database
(https://www.ncbi.nlm.nih.gov/geo/).
The GSE93702 dataset contains the mRNA sequencing data of 4 groups
of mouse BMDMs, including untreated BMDMs (control group) as well
as BMDMs treated with 25 mM sodium lactate (lactate group),
cultured in 1% oxygen (hypoxia group) or both (hypoxia-lactate
group) in vitro for 24 h. Three duplicates were performed in
each group (6). Rlog normalization
was performed to obtain the expression matrix of the samples using
the DESeq2 Package (version 1.14.1).
Screening for differentially expressed
genes (DEGs) and enrichment analysis
Untreated BMDMs were used as controls and the DEGs
of the lactate, hypoxia and lactate-hypoxia groups were separately
calculated based on the Wald test and the generalized linear model
using the DESeq2 package (9) of the
R software. The threshold for DEGs was set at |log(fold change)
|>log21.5, P-value <0.05 and
Benjamini-Hochberg-adjusted P-value <0.1. Volcano plots and heat
maps were used to display the DEGs of the three experimental groups
vs. the control group. Kyoto encyclopedia of genes and genomes
(KEGG) pathway enrichment analysis was performed using the Database
for Annotation, Visualization and Integrated Discovery (DAVID;
version 6.8), and P<0.05 was used as the threshold (10). The pathways, which exhibited
significant alterations in at least two groups, were further
displayed using the bubble plot. The volcano plot, heat map and
bubble plot were drawn using the ggplot2 package (version 2.2.1) of
the R software (11).
GSEA
GSEA was performed for each of the three groups
separately using GSEA software (version 3.0), and the KEGG gene
sets (version 6.2) were used as the annotation gene set (12). The cut-off values were set at
P<0.05 and false discovery rate<0.25. Significantly enriched
pathways were further displayed using the GSEA plot.
WGCNA
WGCNA was performed using the WCGNA package (version
1.63) of the R software. A step-by-step network construction and
module detection approach were selected. The soft-threshold power
was set at 10 according to the scale-free fit index and mean degree
of connectivity. The method of dynamic tree cut from the package
dynamic TreeCut was used for identifying modules. The correlation
between the modules identified and the features of the culturing
conditions in each group of cells was then determined. The modules
with significant correlations with lactate or hypoxia treatment
were further annotated using DAVID. The dendrogram, heat map and
scatter plot were used to display the major results using the WGCNA
package.
Results
Screening of DEGs and enrichment
analysis
Compared with the untreated BMDM group, a total of
6, 101 and 764 upregulated genes were identified in the lactate,
hypoxic and lactate-hypoxic group, respectively, while 4, 41 and
588 genes were downregulated in these three respective groups
(Fig. 1A and B). Among them, heat
shock protein family A member 1 like (HSPA1L), interferon-induced
transmembrane protein 6, FXYD domain-containing ion transport
regulator 2, HSPA1B, HSPA1A and metastasis-associated lung
adenocarcinoma transcript 1 were upregulated in all three groups,
while CD33, interleukin 12 receptor subunit β 2, cysteine- and
glycine-rich protein 1 and transglutaminase 2 were downregulated in
all three groups (Fig. 1C and D).
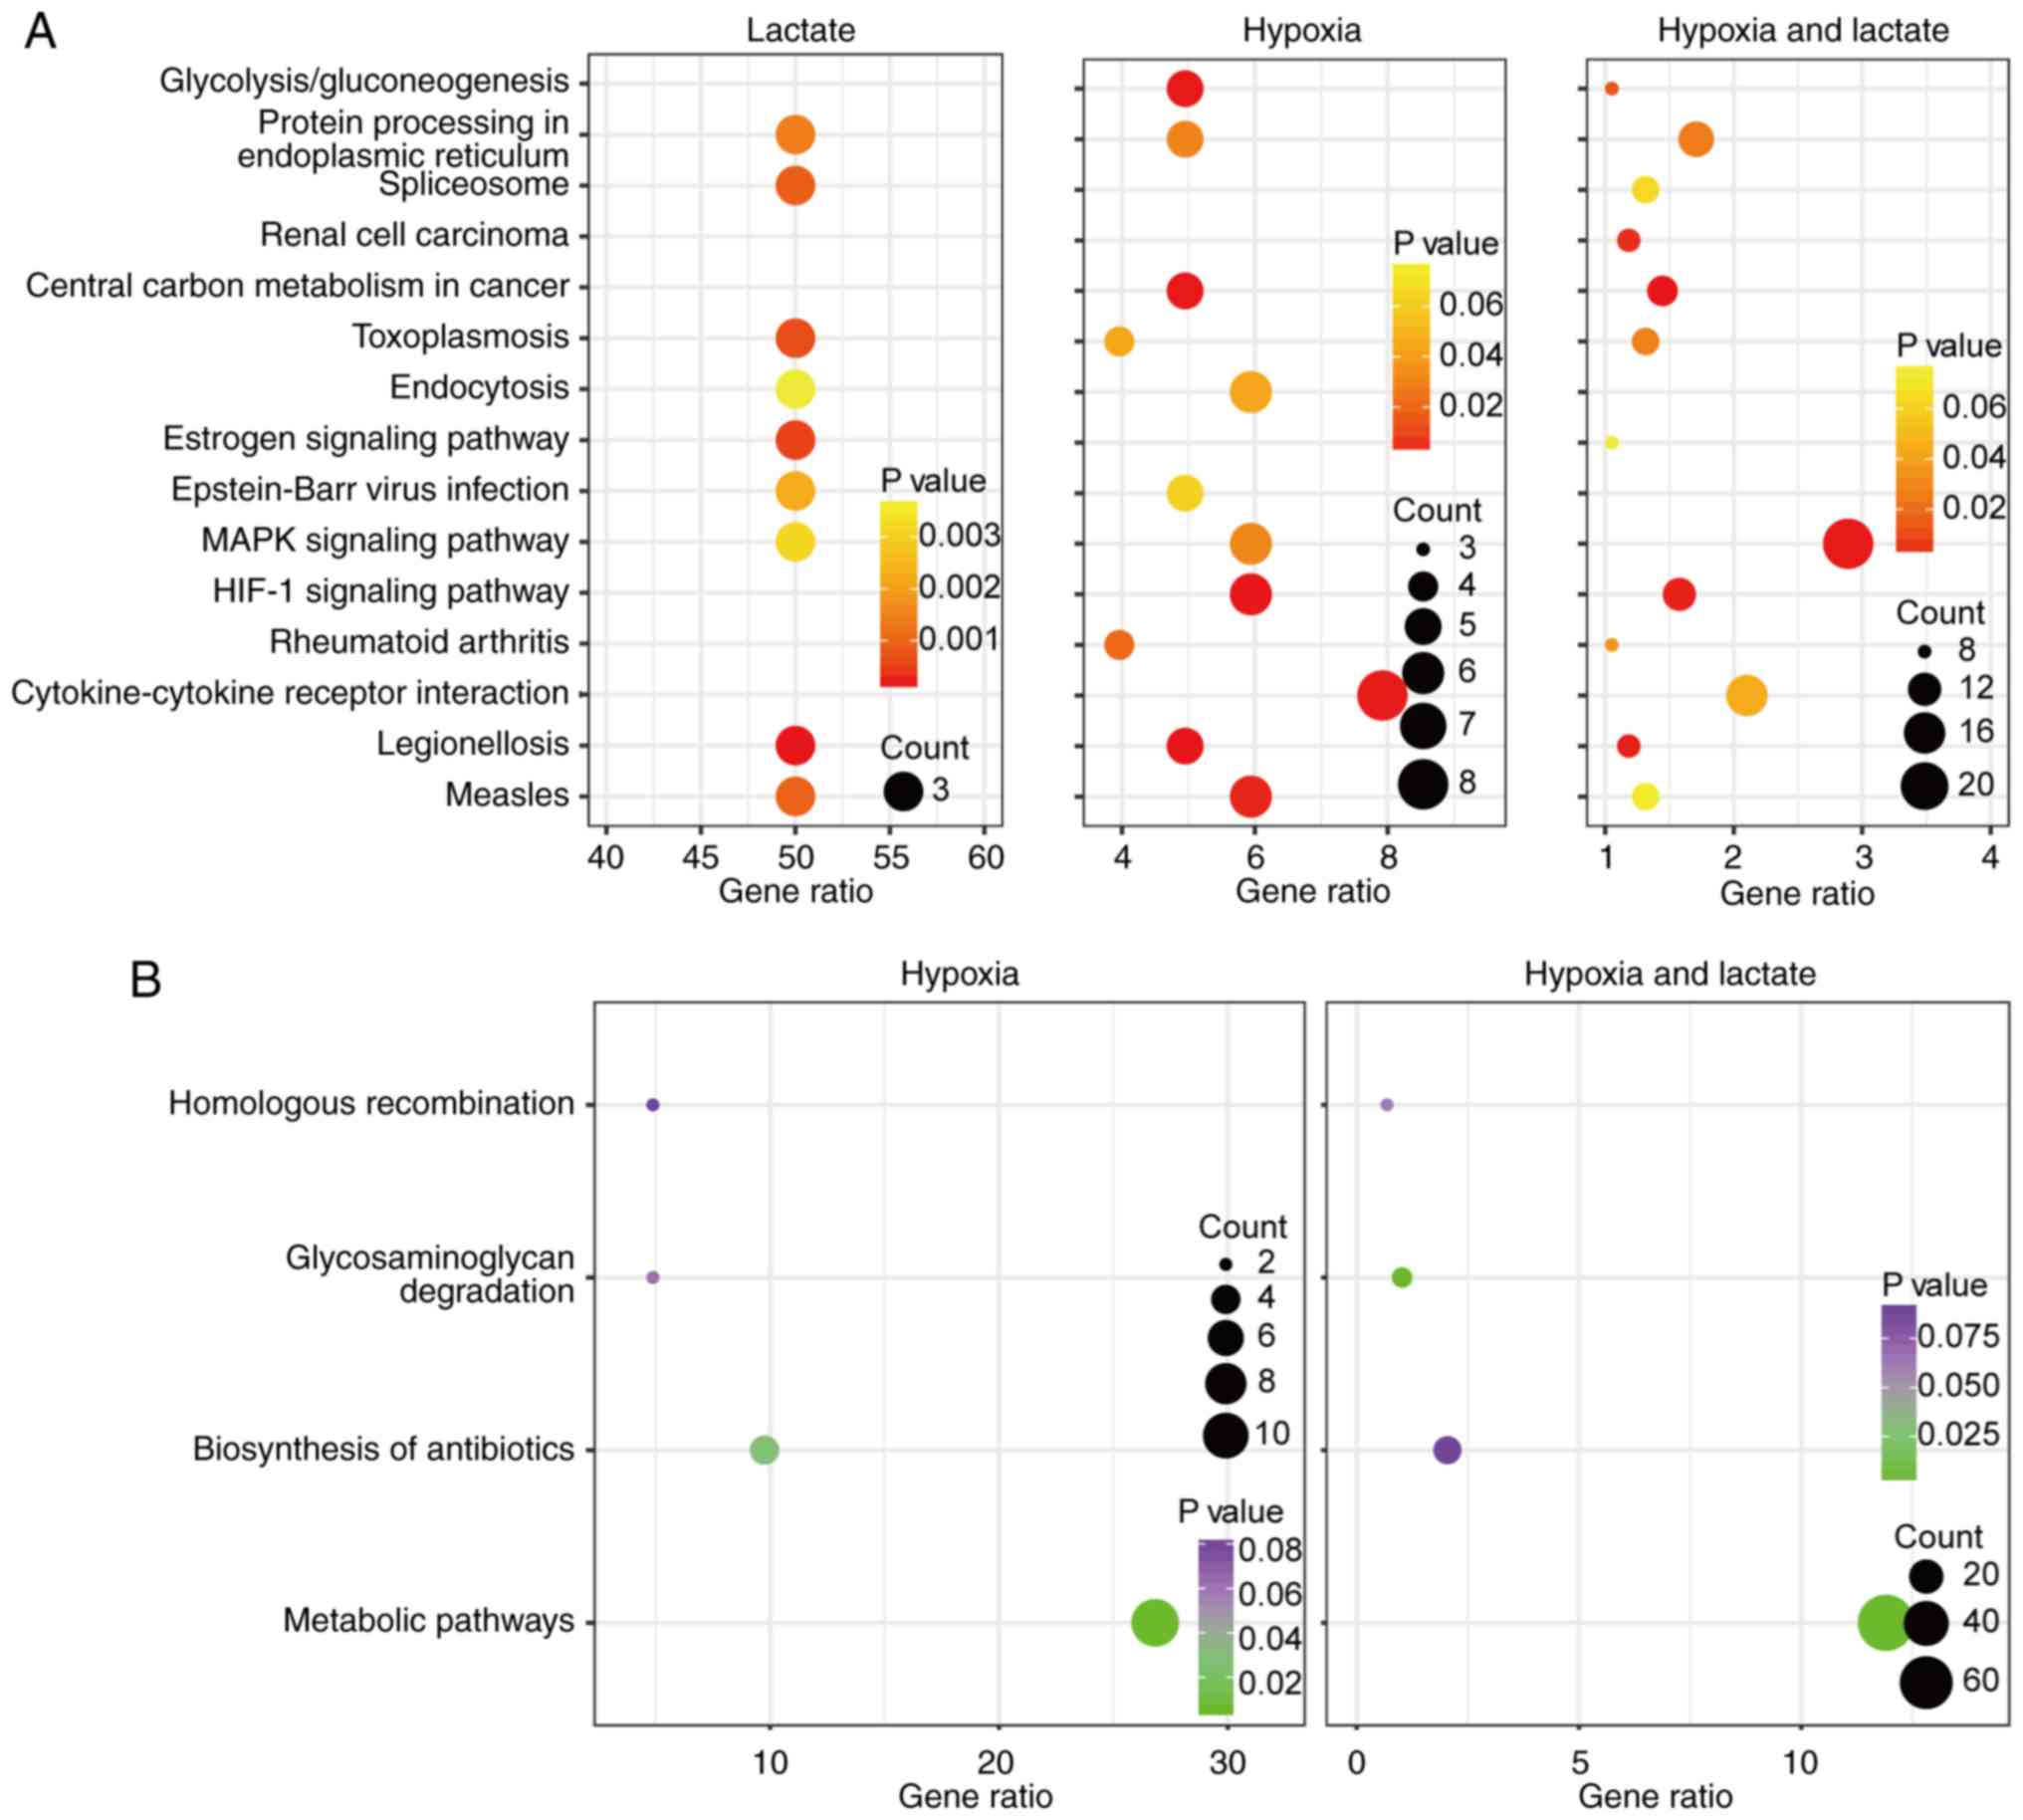
Furthermore, KEGG pathway enrichment analyses were performed using
DAVID software in order to assess the function of the DEGs
identified. The upregulated genes of the lactate group were
accumulated in the pathways legionellosis, antigen processing and
presentation, estrogen signaling, toxoplasmosis and
mitogen-activated protein kinase (MAPK) signaling, whereas the
upregulated genes in the hypoxia group were accumulated in
legionellosis, hypoxia-inducible factor-1 (HIF-1) signaling,
central carbon metabolism in cancer, glycolysis/gluconeogenesis and
cytokine-cytokine receptor interaction pathways. The focal
adhesion, central carbon metabolism in cancer, MAPK signaling,
legionellosis and HIF-1 signaling pathways were enriched by the
upregulated genes of the hypoxia-lactate group. The downregulated
genes in the hypoxia group were enriched in metabolic and
biosynthesis of antibiotics pathways. Metabolic function, DNA
replication, glycosaminoglycan degradation, mismatch repair and
oxidative phosphorylation pathways were enriched by the
downregulated genes of the hypoxia-lactate group. Details regarding
the DEG-enriched pathways are presented in Table I. Significant pathways identified in
at least two groups were further displayed using bubble plots to
demonstrate any differences or commonalities between the three
groups (Fig. 2A and B). The KEGG
database of pathways is a collection of manually selected
functionally-associated gene sets representing the knowledge on
molecular interaction, reaction and association networks. There are
various overlaps among pathways, as numerous genes have roles in
several different pathways. In the present case, enrichment in
legionellosis pathways does not necessarily mean that there is an
on-going legionellosis infection in these cells, but it means that
there may be common features with certain processes of
legionellosis infection.
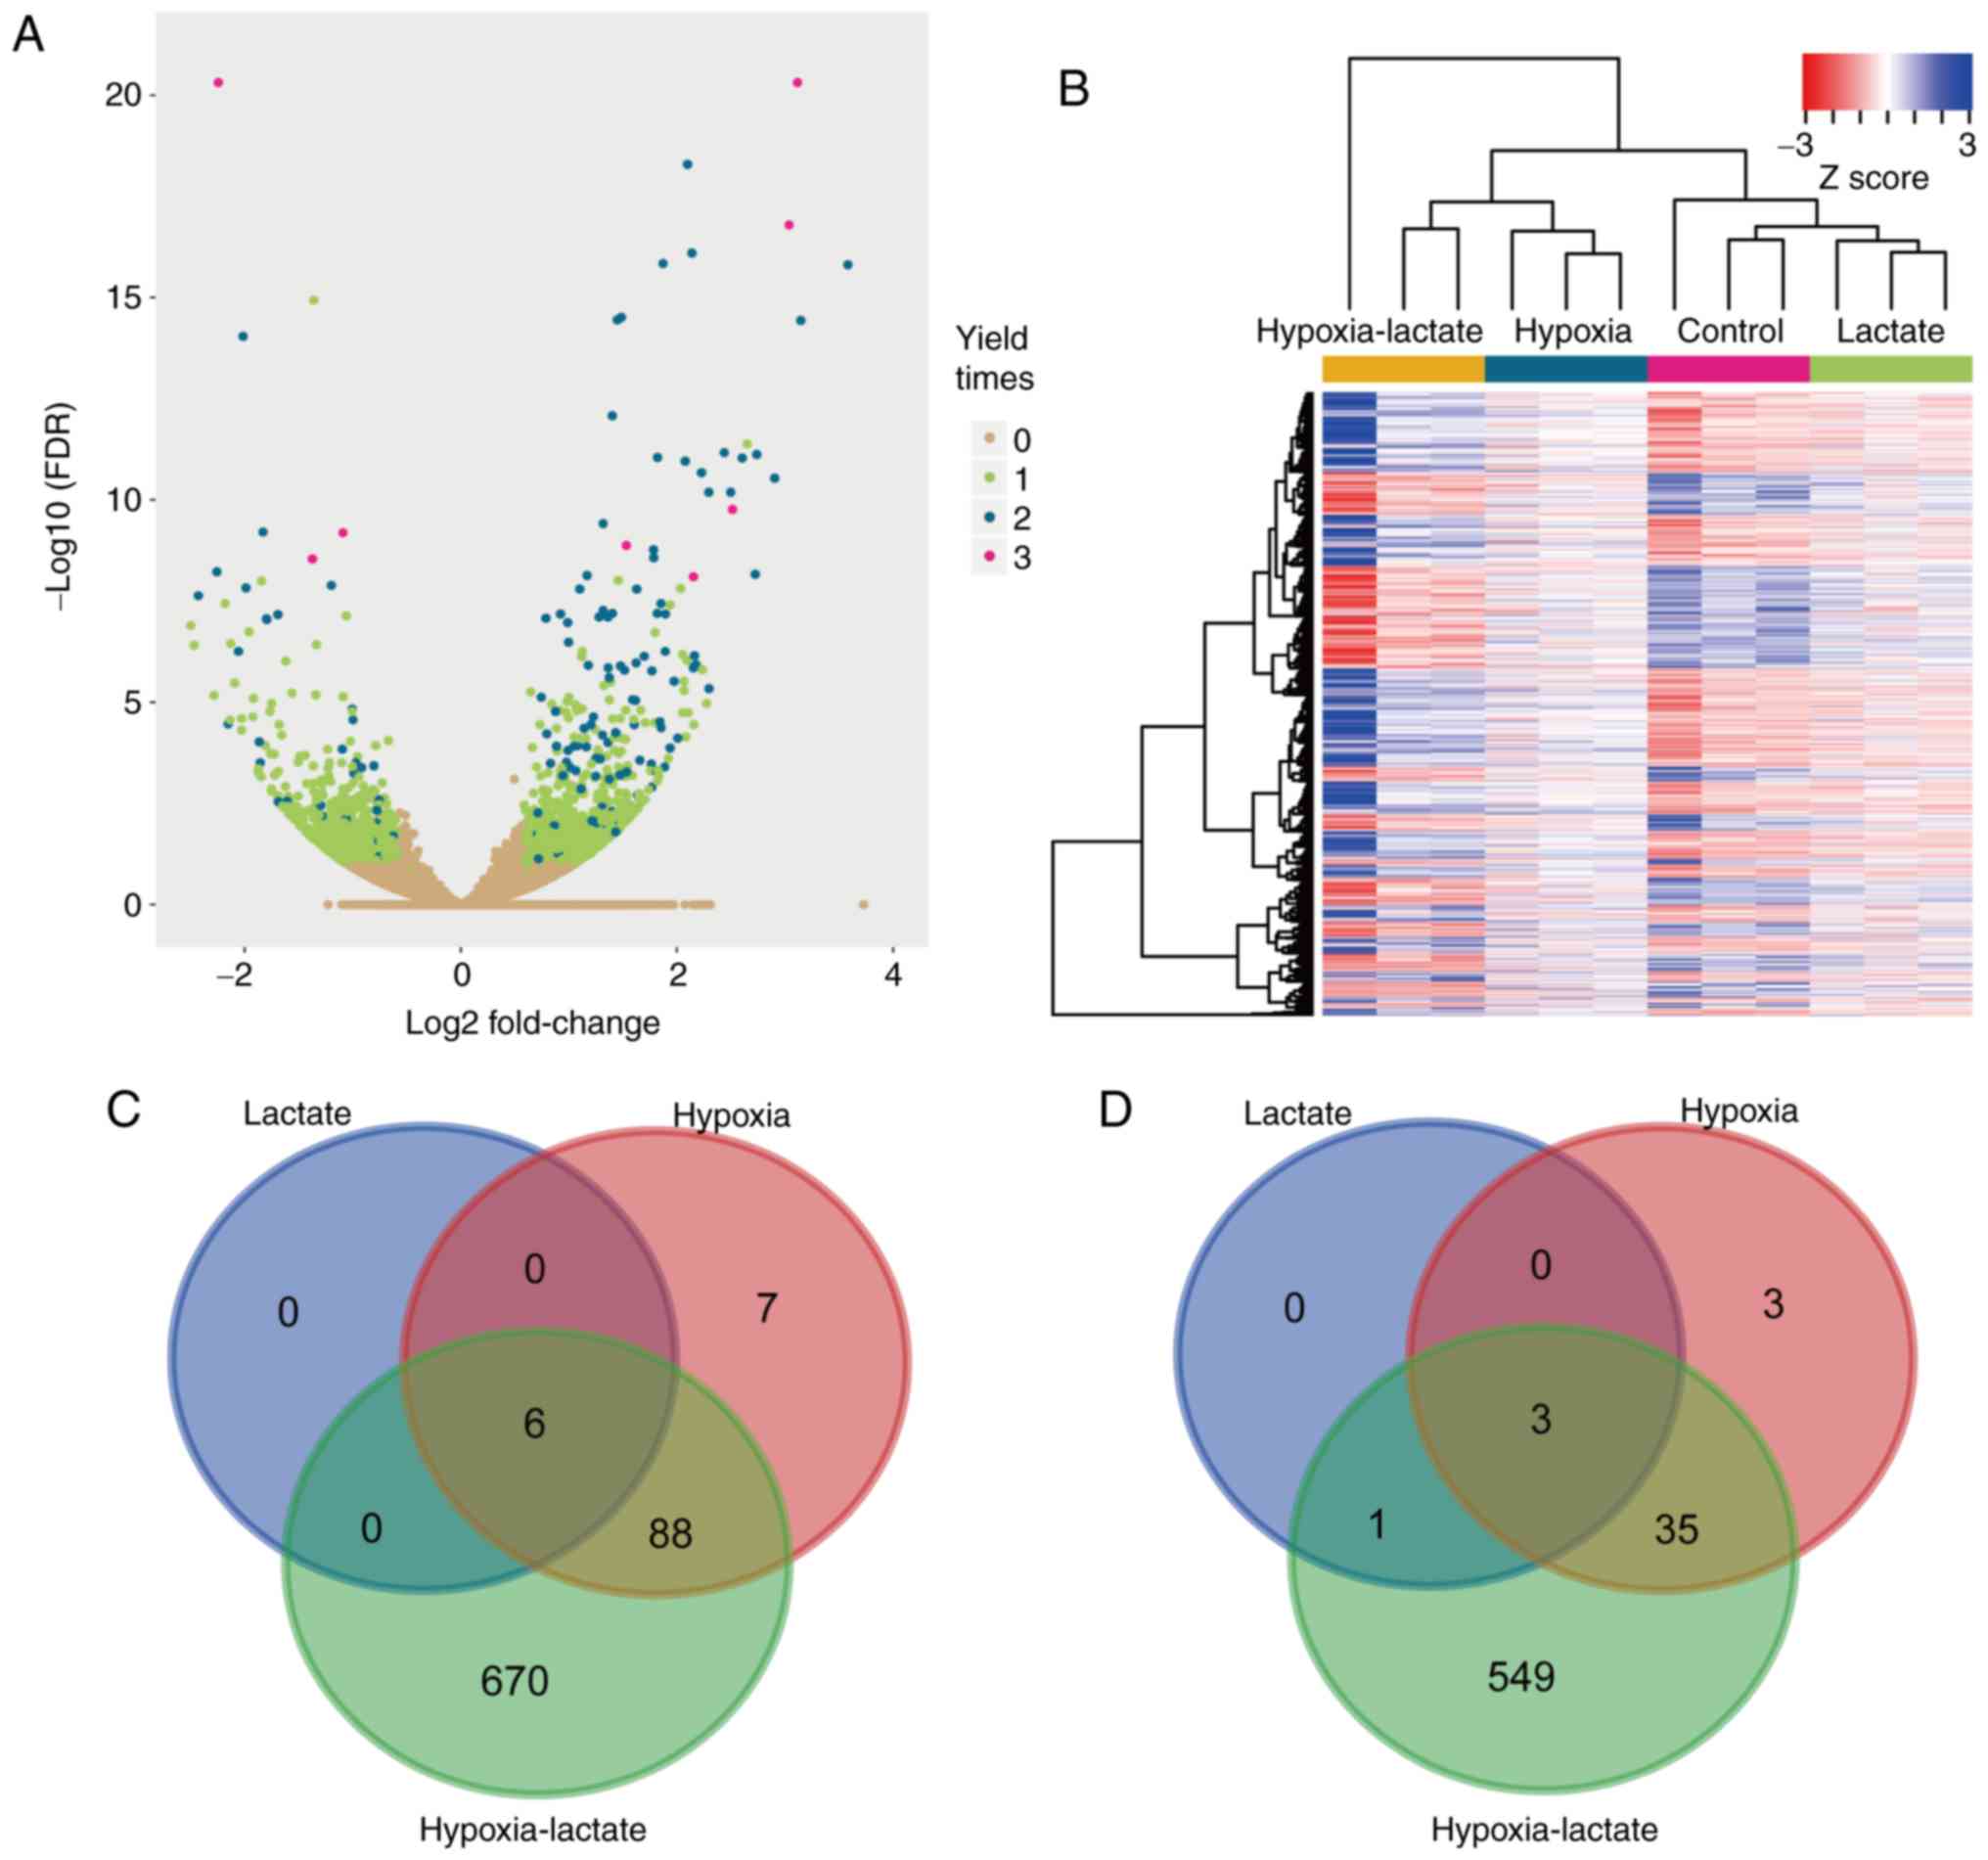 | Figure 1.Screening of DEGs. (A) Transcriptome
data of the lactate, hypoxia and hypoxia-lactate group were
compared with the data of the control group. The log2 (fold change)
and -log10 (FDR) value of each gene in the hypoxia-lactate group
are presented. Genes with no significant change in all three
comparisons are displayed in yellow color and genes identified as
DEGs in 1, 2 or 3 comparisons are indicated in green, blue and
pink, respectively. (B) Expression of genes identified as DEGs in
at least one comparison displayed in a heat map. The
hypoxia-lactate group exhibited the most significant alteration in
gene expression among the test groups. (C) Overlaps of upregulated
genes of the hypoxia, lactate and hypoxia-lactate groups indicated
in a Venn diagram. The hypoxia-lactate group had the highest number
of DEGs. The expression of HSPA1L, interferon-induced transmembrane
protein 6, FXYD domain-containing ion transport regulator 2,
HSPA1B, HSPA1A and metastasis-associated lung adenocarcinoma
transcript 1 was upregulated in all three groups, and most of the
upregulated DEGs in the hypoxia group and lactate group were also
DEGs in the hypoxia-lactate group. (D) Overlaps of downregulated
genes in the hypoxia, lactate and hypoxia-lactate groups displayed
in a Venn diagram. The expression of CD33, interleukin 12 receptor
subunit β 2, cysteine- and glycine-rich protein 1 and
transglutaminase 2 was downregulated in all three groups. DEG,
differentially expressed gene; FDR, false discovery rate; HSPA1 L,
heat shock protein family A member 1 like. |
 | Table I.Top 10 up- and down-regulated Kyoto
Encyclopedia of Genes and Genomes pathways of differentially
expressed genes. |
Table I.
Top 10 up- and down-regulated Kyoto
Encyclopedia of Genes and Genomes pathways of differentially
expressed genes.
| A, Lactate group |
|---|
|
|---|
| Pathway | P-value |
|---|
| Upregulated |
|
|
Legionellosis | <0.001 |
| Antigen
processing and presentation | <0.001 |
| Estrogen
signaling pathway | <0.001 |
|
Toxoplasmosis | 0.001 |
|
Spliceosome | 0.001 |
|
Measles | 0.001 |
| Protein
processing in endoplasmic reticulum | 0.001 |
| Influenza
A | 0.001 |
|
Epstein-Barr virus
infection | 0.002 |
| MAPK
signaling pathway | 0.003 |
|
| B, Hypoxia
group |
|
| Pathway | P-value |
|
| Upregulated |
|
Glycolysis/gluconeogenesis | 0.001 |
|
Cytokine-cytokine receptor
interaction | 0.001 |
| Central
carbon metabolism in cancer | 0.001 |
| HIF-1
signaling pathway | 0.001 |
|
Measles | 0.002 |
|
Legionellosis | 0.001 |
|
Hematopoietic cell
lineage | 0.021 |
|
Biosynthesis of
antibiotics | 0.016 |
|
Rheumatoid arthritis | 0.019 |
| MAPK
signaling pathway | 0.031 |
| Downregulated |
|
Metabolic pathways | 0.003 |
|
Biosynthesis of
antibiotics | 0.028 |
|
| C,
Hypoxia-lactate group |
|
| Pathway | P-value |
|
| Upregulated |
| Focal
adhesion | <0.001 |
|
Transcriptional misregulation
in cancer | <0.001 |
| Central
carbon metabolism in cancer | <0.001 |
|
Dorso-ventral axis
formation | <0.001 |
| MAPK
signaling pathway | 0.001 |
|
Pathways in cancer | 0.001 |
|
Regulation of actin
cytoskeleton | 0.001 |
|
Legionellosis | 0.001 |
|
Proteoglycans in cancer | 0.002 |
| HIF-1
signaling pathway | 0.002 |
| Downregulated |
|
Metabolic pathways | <0.001 |
| DNA
replication | <0.001 |
|
Glycosaminoglycan
degradation | <0.001 |
|
Mismatch repair | 0.005 |
| Base
excision repair | 0.005 |
|
Oxidative phosphorylation | 0.006 |
|
Nucleotide excision
repair | 0.014 |
|
Huntington's disease | 0.028 |
| Purine
metabolism | 0.032 |
|
Non-alcoholic fatty liver
disease | 0.033 |
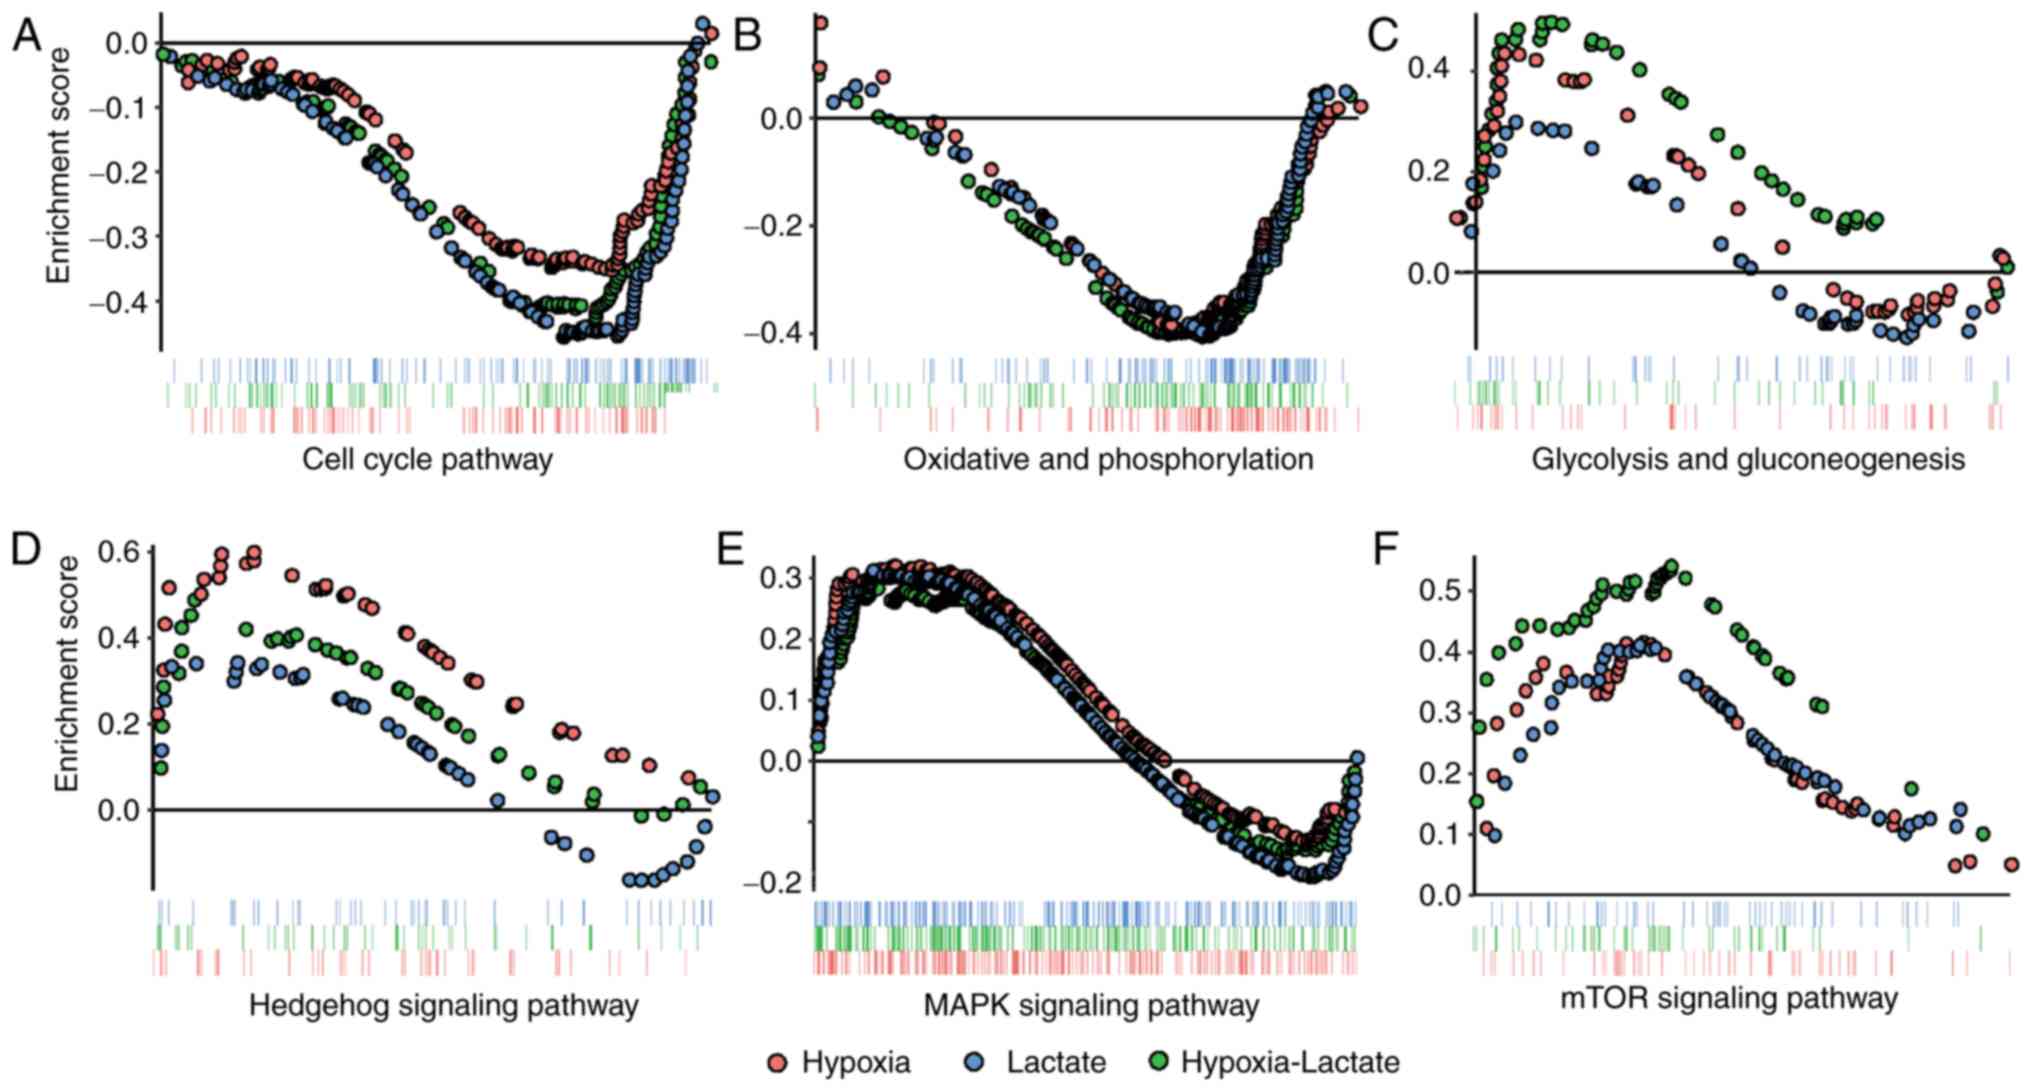
GSEA analysis
Subsequently, GSEA analysis was performed on the
three groups in order to avoid the deviation caused by single-gene
analysis. Downregulation of the cell cycle and oxidative
phosphorylation pathways were identified in the lactate group,
while enrichment of the Hedgehog signaling pathway and
downregulation of oxidative phosphorylation was noted in the
hypoxic group. Enhancement of the mTOR, Hedgehog and MAPK signaling
pathways, as well as the glycolysis-gluconeogenesis pathway, were
identified in the hypoxia-lactate group, whereas the cell cycle and
oxidative phosphorylation pathways were downregulated in the
hypoxia-lactate group (Fig. 3;
Table II).
| Table II.Significantly altered pathways in the
gene set enrichment analysis. |
Table II.
Significantly altered pathways in the
gene set enrichment analysis.
| A, Lactate
group |
|---|
|
|---|
| Term | ES | NES | P-value | FDR |
|---|
| Cell cycle | −0.47 | −1.53 | <0.01 | 0.06 |
| Oxidative
phosphorylation | −0.41 | −1.35 |
0.04 | 0.13 |
|
| B, Hypoxia
group |
|
| Term | ES | NES | P-value | FDR |
|
| Hedgehog signaling
pathway |
0.60 |
1.66 | 0.01 | 0.04 |
| Oxidative
phosphorylation | −0.40 | −1.39 | 0.02 | 0.14 |
|
| C,
Hypoxia-lactate group |
|
| Term | ES | NES | P-value | FDR |
|
| mTOR signaling
pathway | 0.54 | 1.77 | 0.01 | 0.01 |
| Glycolysis
gluconeogenesis | 0.49 | 1.59 | 0.01 | 0.04 |
| Hedgehog signaling
pathway | 0.48 | 1.54 | 0.01 | 0.04 |
| Oxidative
phosphorylation | −0.41 | −1.35 | 0.05 | 0.12 |
| Cell cycle | −0.44 | −1.41 | 0.02 | 0.15 |
| MAPK signaling
pathway | 0.28 | 1.18 | 0.05 | 0.19 |
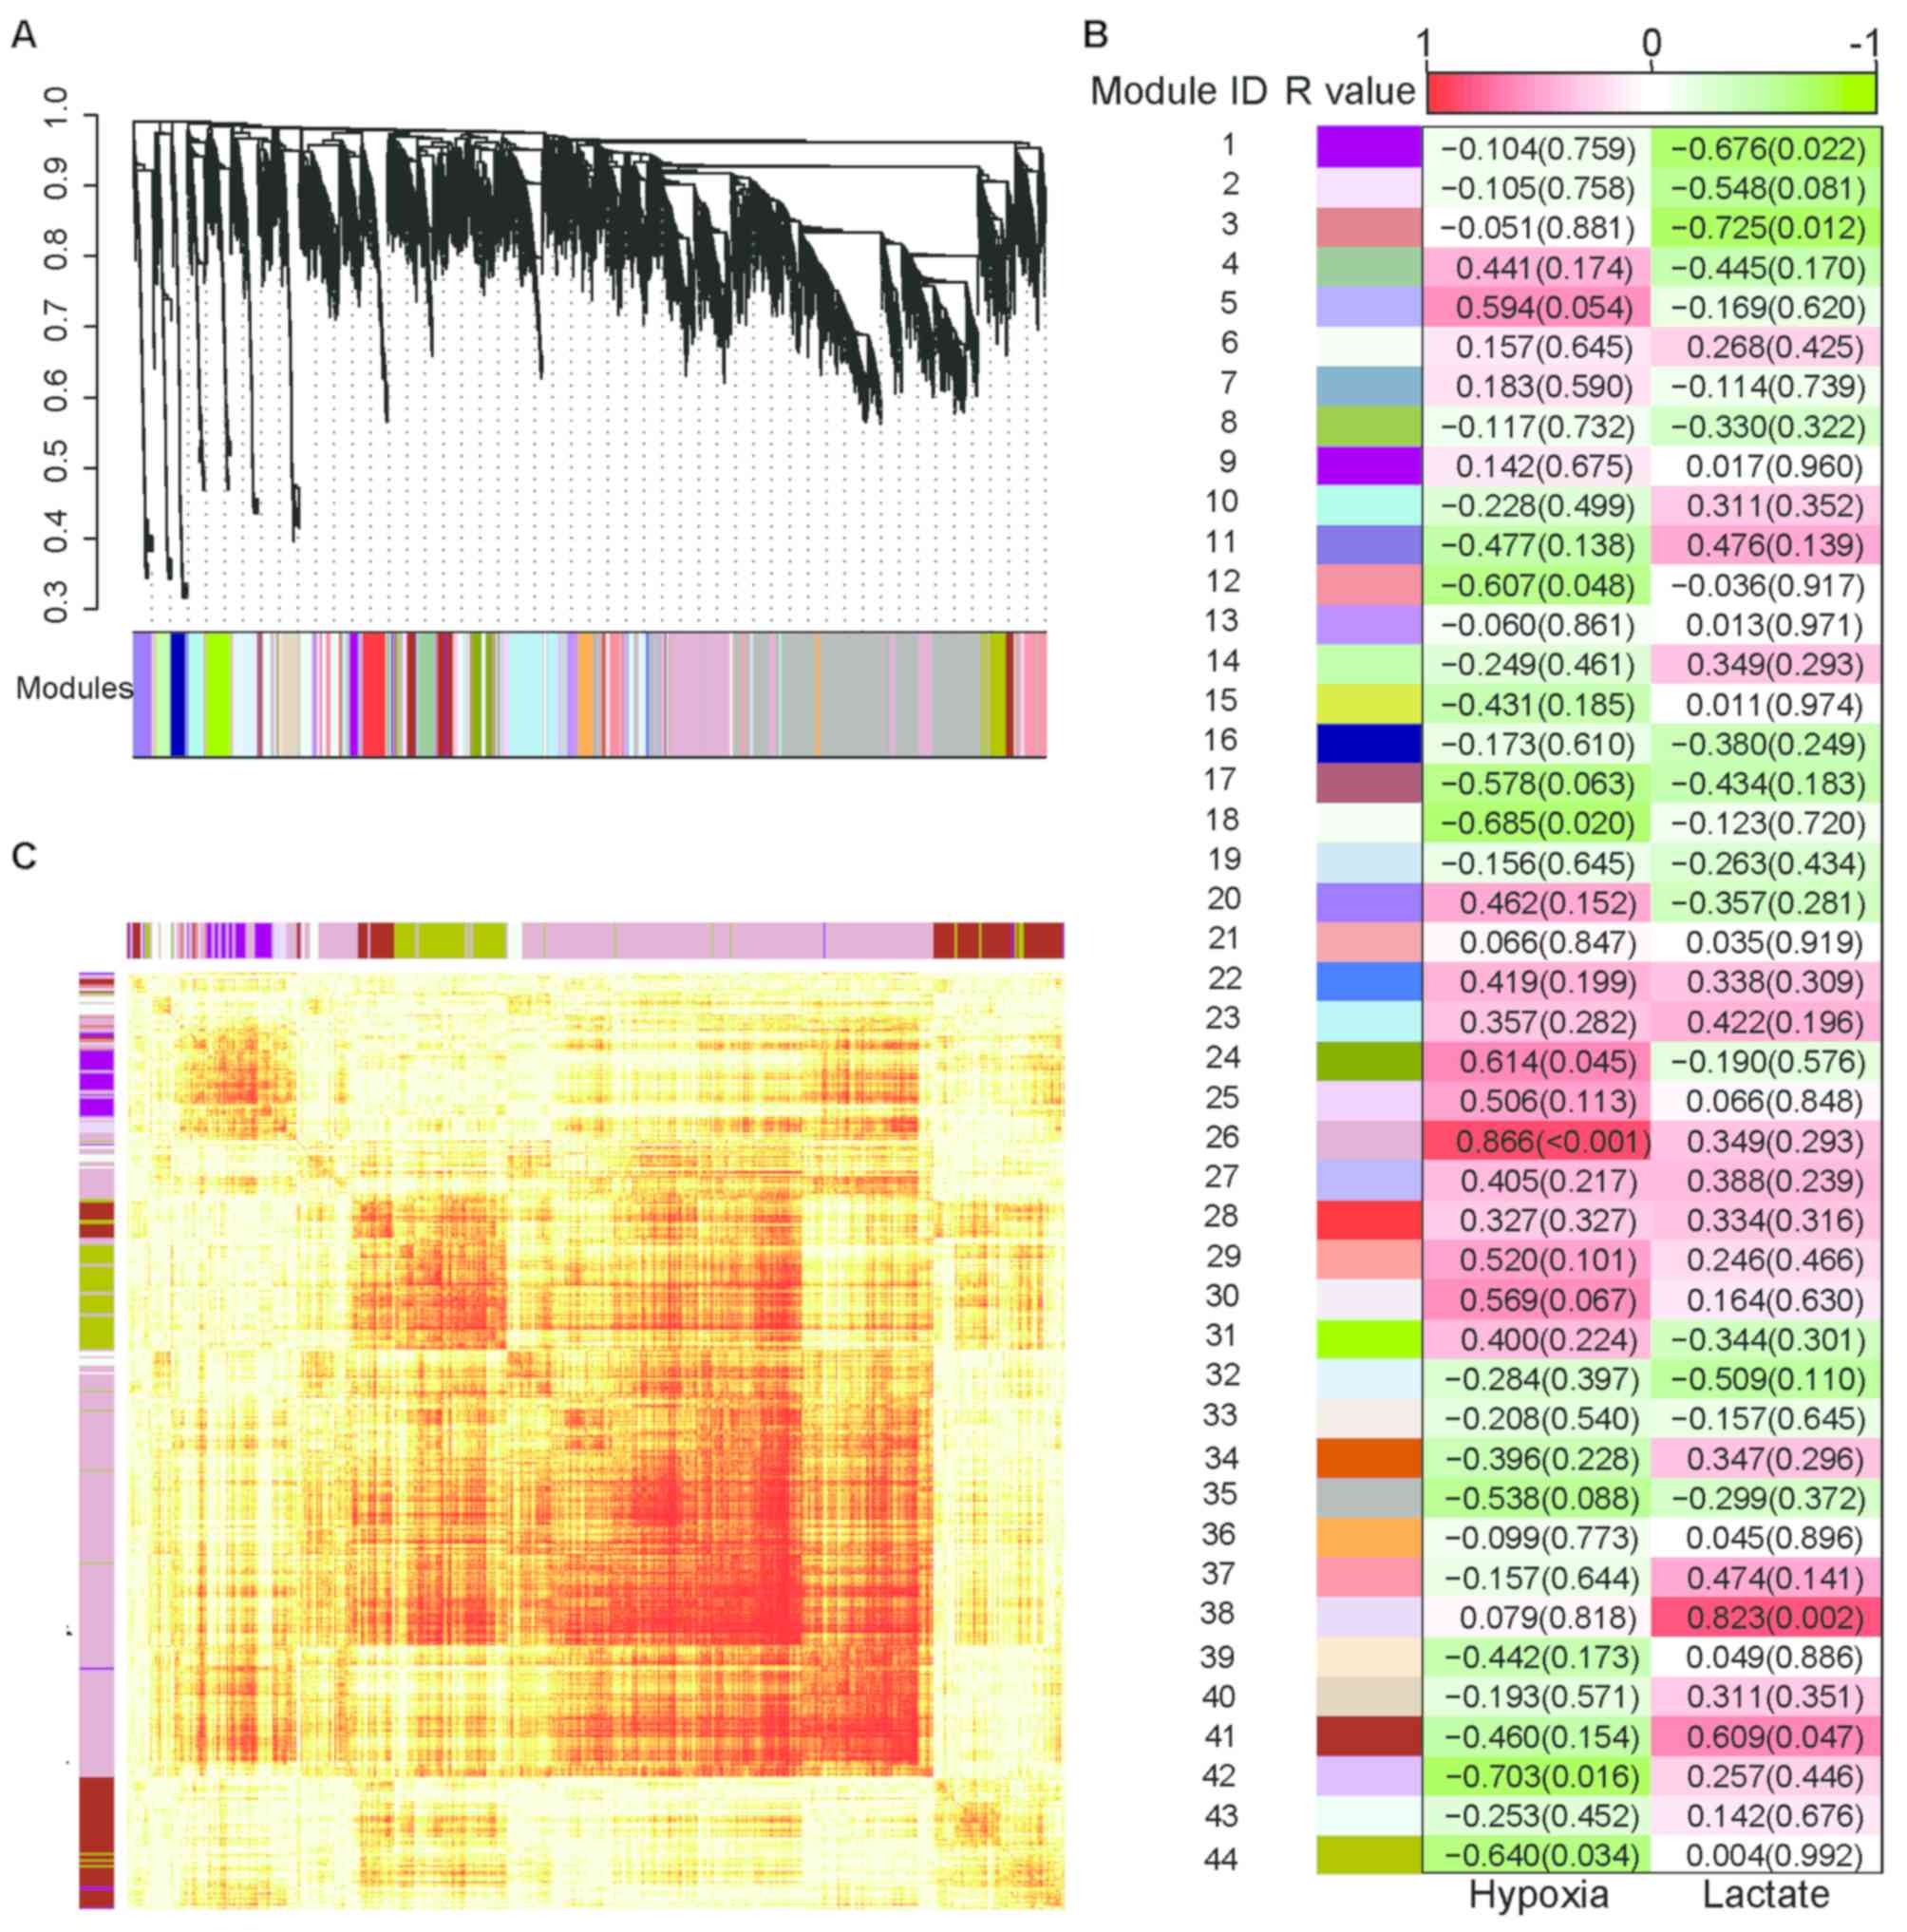
WGCNA analysis
Furthermore, WGCNA analysis was performed to search
for possible gene network modules with significant correlations to
lactate treatment or hypoxic treatment. Using a step-by-step
network construction and module detection approach, 44 gene modules
were identified (Fig. 4A). Modules
38 and 41 were positively correlated with lactate treatment
(r=0.823 and 0.609; P=0.002 and P=0.047, respectively), while
modules 1 and 3 were negatively correlated with lactate treatment
(r=−0.676 and −0.725; P=0.022 and 0.012, respectively). With regard
to the oxygenation condition, modules 24 and 26 were positively
correlated with hypoxia (r=0.614 and 0.866, P=0.045 and P<0.001,
respectively), while modules 18, 12, 42 and 44 were negatively
correlated with hypoxia (r=−0.685, −0.607, −0.703 and −0.640;
P=0.020, 0.048, 0.016 and 0.034, respectively; Fig. 4B; Table
III). Module 38 was mainly composed of enriched gene sets for
the Rap1 signaling pathway, whereas module 41 was enriched in gene
sets associated with base excision repair, pyruvate metabolism,
hippo signaling and tight junction pathways. Module 1 was enriched
in the focal adhesion pathway gene sets. Module 26 was enriched in
the metabolic, central carbon metabolism in cancer, HIF-1 signaling
pathway and glycolysis-gluconeogenesis gene sets. Module 24 was
composed of enriched genes in dopaminergic synapse, adrenergic
signaling in cardiomyocytes, neurotrophin signaling and
sphingolipid signaling pathways. Module 12 was enriched in gene
sets involved in the regulation of actin cytoskeleton, cell
adhesion molecules, glycerophospholipid metabolism and Rap1
signaling pathways. Module 44 was enriched in gene sets involved in
carbon metabolism, mTOR signaling and 5′-adenosine
monophosphate-activated protein kinase signaling pathways. Finally,
modules 18 and 42 were enriched in gene sets associated with
protein processing of the endoplasmic reticulum and metabolic
pathways, respectively (Table
III). The topological overlap matrix among 1,000 randomly
selected genes was presented using a heatmap (Fig. 4C).
| Table III.Enrichment analysis of the modules
significantly correlated with hypoxia or lactate treatment. |
Table III.
Enrichment analysis of the modules
significantly correlated with hypoxia or lactate treatment.
| A, Lactate |
|---|
|
|---|
| KEGG pathways | R-value | P-value |
|---|
| Module 41 | 0.61 |
|
| Base
excision repair |
| 0.016 |
|
Pyruvate metabolism |
| 0.023 |
| Hippo
signaling pathway |
| 0.027 |
| Tight
junction |
| 0.043 |
| Module 38: | 0.82 |
|
| Rap1
signaling pathway |
| 0.025 |
| Module 1: | −0.68 |
|
| Focal
adhesion |
| 0.033 |
| Module 3: | −0.73 |
|
| Not
applicable |
| >0.999 |
|
| B,
Hypoxia |
|
| KEGG
pathways | R-value | P-value |
|
| Module 26 | 0.87 |
|
| Renal
cell carcinoma |
| <0.001 |
|
Pertussis |
| <0.001 |
|
Lysosome |
| <0.001 |
|
Metabolic pathways |
| <0.001 |
| Amino
sugar and nucleotide |
| <0.001 |
| sugar
metabolism |
| Central
carbon metabolism in cancer |
| <0.001 |
|
Pathways in cancer |
| 0.001 |
|
Biosynthesis of
antibiotics |
| 0.001 |
| Focal
adhesion |
| 0.001 |
| HIF-1
signaling pathway |
| 0.001 |
| Module 12 | −0.61 |
|
|
Regulation of actin
cytoskeleton |
| 0.012 |
| Cell
adhesion molecules |
| 0.014 |
|
Morphine addiction |
| 0.022 |
|
Glycerophospholipid
metabolism |
| 0.023 |
| Rap1
signaling pathway |
| 0.029 |
|
Rheumatoid arthritis |
| 0.043 |
|
Regulation of lipolysis in
adipocytes |
| 0.044 |
|
Hematopoietic cell
lineage |
| 0.047 |
| Module 42:
Metabolic pathways | −0.70 | 0.008 |
| Module 44 | −0.64 |
|
|
Biosynthesis of
antibiotics |
| <0.001 |
|
Metabolic pathways |
| <0.001 |
|
Colorectal cancer |
| 0.004 |
|
Progesterone-mediated oocyte
maturation |
| 0.004 |
| Carbon
metabolism |
| 0.006 |
| Steroid
biosynthesis |
| 0.009 |
| mTOR
signaling pathway |
| 0.012 |
| Central
carbon metabolism in cancer |
| 0.017 |
| Insulin
signaling pathway |
| 0.017 |
| Chronic
myeloid leukemia |
| 0.027 |
Discussion
Macrophages have an important role in the
inflammatory response and tissue repair process. Macrophages are
able to engulf pathogens, present antigens to T cells and secrete
pro-inflammatory factors in order to activate and promote the
immune response. In addition, they exhibit immune-modulatory
functions by secreting anti-inflammatory factors, including IL-4,
IL-10 and transforming growth factor-β (13). During the growth and progression of
the tumor, macrophages are recruited to the tumor niche and
contribute to the initiation of the anti-tumor immune response.
However, cancer cells may also re-program macrophages into
immune-modulatory macrophages, known as M2 TAMs. The functional
status of TAMs is notably associated with the survival of cancer
patients, while the M2-polarization of TAMs may be a promising
target for cancer therapy (14,15).
Although previous studies have examined TAM
reprogramming, the high heterogeneity noted in several types of
solid tumor has led to a lack of consensus on the detailed
mechanism of this process. However, solid tumors share certain
characteristics, including malformation of tumor vessels and
aerobic glycolysis, resulting in hypoxia and lactic acidosis, which
are considered two hallmarks of the tumor microenvironment. Hypoxia
has been indicated to induce the M2 polarization of TAMs via
stabilization of HIF-1 (16).
Previous studies have further suggested that melanoma, colon
carcinoma and bladder transitional cell carcinoma cells may induce
the M2-polarization of TAMs via lactate shuttling (8,17).
Furthermore, previous studies that investigated inflammatory organ
injury indicated that lactate was able to inhibit the
pro-inflammatory function of lipopolysaccharide (LPS)-stimulated
macrophages (18–20), and may therefore be a common
regulator of TAM function in the tumor microenvironment.
Carmona-Fontaine et al (6) provided transcriptome data of BMDMs
treated by hypoxia or lactate. The study simultaneously assessed
the differences between the hypoxia+lactate group and all other
samples, including the samples from the normoxic group, the
normoxia+lactate group and the hypoxic group. The factors under
investigation were lactate and hypoxia, and the heterogeneity
between the three groups was taken into account. This may reduced
the reliability of the results obtained of that study. In the
present study, these transcriptome data were explored using DEG
screening, KEGG enrichment, GSEA and WGCNA in order to enhance the
current knowledge on the effect of hypoxia and lactate on TAMS.
Overall, the lactate treatment had a relatively mild
effect on macrophages, with only two significantly altered GSEA
pathways and 10 DEGs. In the hypoxic group, 142 DEGs and two GSEA
pathways were identified. By contrast, the hypoxia+lactate
treatment had a significant effect on the function of macrophages,
with 1,352 DEGs and six significantly altered pathways.
Furthermore, all DEGs in the lactate group exhibited the same trend
in the hypoxia and hypoxia-lactate groups, whereas all altered
pathways obtained in the lactate and hypoxia groups by GSEA
analysis were also identified in the hypoxia-lactate group.
Therefore, the production of lactate and the presence of hypoxia
may work synergistically in the re-programming of macrophages.
The activation and regulation of the immune response
are key functions of macrophages. In the present study, the HIF-1
and Hedgehog signaling pathways were enriched by the DEGs of the
hypoxic and the hypoxia-lactate groups. Upregulation of the mTOR
and the Hedgehog pathways in the hypoxia-lactate group was
identified by GSEA. Furthermore, module 26, which was positively
correlated with hypoxia, was enriched in the HIF-1 pathway gene
sets. The HIF-1 pathway is considered the key pathway in the
reprogramming of TAMs (8,17), and the mTOR and Hedgehog pathways
were recently reported to contribute to the alternative activation
of macrophages and to the inhibition of the secretion of
pro-inflammatory factors (21,22).
These results suggested that lactate and hypoxia promote the
M2-like function of macrophages. However, the present results
further demonstrated significant enrichment of the MAPK signaling
pathway in the DEGs of all three groups. The upregulation of the
DEGs of the MAPK pathway in the hypoxia-lactate group was also
demonstrated by GSEA and was specifically identified in module 26.
The MAPK pathway may increase the expression of pro-inflammatory
factors, including IL1β and tumor necrosis factor-α (23). These data suggested that hypoxia and
lactate may potentiate the M1-like pro-inflammatory function of
macrophages. However, activation of MAPK by hypoxia and lactate may
not be sufficient to activate an effective anti-tumor immune
response. At present, there is insufficient data to support the
alteration of the other inflammatory pathways and more importantly,
due to several previous studies demonstrating that lactate was able
to inhibit the pro-inflammatory response of LPS-stimulated
macrophages (18,19).
The accumulation of immune cells was mostly noted in
the well-perfused region, including the stroma and the invasive
margin surrounding the tumor islets (24,25). The
production of lactate by the tumor may decrease the pH and have an
important role in the formation of this spatial structure (25). In the present study, GSEA
demonstrated that lactate treatment downregulated the cell cycle
pathway in a hypoxia-independent manner, even in a neutral pH
environment. Thus, lactate may inhibit the in situ
proliferation of macrophages under inflammatory conditions
(26). The results further indicated
that the DEGs of the hypoxia and hypoxia-lactate groups, including
C-C motif chemokine receptor 1 (CCR1) and CCR5, were enriched in
the cytokine-cytokine receptor interaction pathway. Module 26 was
significantly associated with lactate levels and exhibited
enrichment in the chemokine signaling pathway. These results
suggested that hypoxia was further involved in the regulation of
macrophage localization in the tumor microenvironment.
Several studies have indicated that hypoxia inhibits
oxidative phosphorylation and promotes glycolysis (27,28). In
the present study, the inhibition of oxidative phosphorylation and
the activation of the glycolytic pathway were identified by the
KEGG enrichment analysis, as well as GSEA and WGCNA, as specific
biological processes that may be induced by hypoxia. Furthermore,
GSEA demonstrated that lactate inhibits the oxidative
phosphorylation pathway of macrophages, although it did not
demonstrate any significant enhancement of the glycolysis pathway.
The detailed energy metabolism status of macrophages under lactic
acidosis conditions remains elusive and further studies are
required to investigate this process.
In conclusion, lactate exhibited a weak effect on
macrophages under normoxic conditions. However, the combination of
lactate and hypoxia markedly promoted the M2-polarization of
macrophages via the HIF-1, Hedgehog and mTOR pathways. Lactate and
hypoxia may also contribute to the formation of the spatial
structure of tumor niches by inhibiting the in situ
proliferation of tissue-resident macrophages and by regulating the
recruitment of peripheral macrophages.
Acknowledgements
Not applicable.
Funding
The present study was supported by a grant from the
National Natural Science Foundation of China (grant no. 30901481)
and the Major Research Program of Shandong Province (grant no.
2017GSF221016).
Availability of data and materials
The datasets generated and/or analyzed during the
current study are available in the GEO database (http://www.ncbi.nlm.nih.gov/geo) with the
accession no. GSE93702.
Authors' contributions
WGCNA analysis was performed by XW, GG JHW and YX.
GSEA was performed by BZ and YZ. YDS, TG and YJZ performed the DEG
screening and KEGG enrichment analysis.
Ethics approval and consent to
participate
Not applicable.
Patient consent for publication
Not applicable.
Competing interests
The authors declare that they have no competing
interests.
References
|
1
|
Hanahan D and Weinberg RA: Hallmarks of
cancer: The next generation. Cell. 144:646–674. 2011. View Article : Google Scholar : PubMed/NCBI
|
|
2
|
Hsu PP and Sabatini DM: Cancer cell
metabolism: Warburg and beyond. Cell. 134:703–707. 2008. View Article : Google Scholar : PubMed/NCBI
|
|
3
|
Koppenol WH, Bounds PL and Dang CV: Otto
Warburg's contributions to current concepts of cancer metabolism.
Nat Rev Cancer. 11:325–337. 2011. View
Article : Google Scholar : PubMed/NCBI
|
|
4
|
Nurwidya F, Takahashi F, Minakata K,
Murakami A and Takahashi K: From tumor hypoxia to cancer
progression: The implications of hypoxia-inducible factor-1
expression in cancers. Anat Cell Biol. 45:73–78. 2012. View Article : Google Scholar : PubMed/NCBI
|
|
5
|
Ganapathy-Kanniappan S and Geschwind JF:
Tumor glycolysis as a target for cancer therapy: Progress and
prospects. Mol Cancer. 12:1522013. View Article : Google Scholar : PubMed/NCBI
|
|
6
|
Carmona-Fontaine C, Deforet M, Akkari L,
Thompson CB, Joyce JA and Xavier JB: Metabolic origins of spatial
organization in the tumor microenvironment. Proc Natl Acad Sci USA.
114:2934–2939. 2017. View Article : Google Scholar : PubMed/NCBI
|
|
7
|
Eruslanov E, Neuberger M, Daurkin I,
Perrin GQ, Algood C, Dahm P, Rosser C, Vieweg J, Gilbert SM and
Kusmartsev S: Circulating and tumor-infiltrating myeloid cell
subsets in patients with bladder cancer. Int J Cancer.
130:1109–1119. 2012. View Article : Google Scholar : PubMed/NCBI
|
|
8
|
Zhao Y, Wang D, Xu T, Liu P, Cao Y, Wang
Y, Yang X, Xu X, Wang X and Niu H: Bladder cancer cells re-educate
TAMs through lactate shuttling in the microfluidic cancer
microenvironment. Oncotarget. 6:39196–39210. 2015. View Article : Google Scholar : PubMed/NCBI
|
|
9
|
Love MI, Huber W and Anders S: Moderated
estimation of fold change and dispersion for RNA-seq data with
DESeq2. Genome Biol. 15:5502014. View Article : Google Scholar : PubMed/NCBI
|
|
10
|
Liang B, Li C and Zhao J: Identification
of key pathways and genes in colorectal cancer using bioinformatics
analysis. Med Oncol. 33:1112016. View Article : Google Scholar : PubMed/NCBI
|
|
11
|
Wickham H: ggplot2: Elegant graphics for
data analysis. 2009.
|
|
12
|
Subramanian A, Tamayo P, Mootha VK,
Mukherjee S, Ebert BL, Gillette MA, Paulovich A, Pomeroy SL, Golub
TR, Lander ES and Mesirov JP: Gene set enrichment analysis: A
knowledge-based approach for interpreting genome-wide expression
profiles. Proc Natl Acad Sci USA. 102:15545–15550. 2005. View Article : Google Scholar : PubMed/NCBI
|
|
13
|
Malyshev I and Malyshev Y: Current concept
and update of the macrophage plasticity concept: Intracellular
mechanisms of reprogramming and M3 macrophage ‘Switch’ phenotype.
Biomed Res Int. 2015:3413082015. View Article : Google Scholar : PubMed/NCBI
|
|
14
|
Mantovani A, Marchesi F, Malesci A, Laghi
L and Allavena P: Tumour-associated macrophages as treatment
targets in oncology. Nat Rev Clin Oncol. 14:399–416. 2017.
View Article : Google Scholar : PubMed/NCBI
|
|
15
|
Nielsen SR and Schmid MC: Macrophages as
key drivers of cancer progression and metastasis. Mediators
Inflamm. 2017:96247602017. View Article : Google Scholar : PubMed/NCBI
|
|
16
|
Noman MZ, Hasmim M, Messai Y, Terry S,
Kieda C, Janji B and Chouaib S: Hypoxia: A key player in antitumor
immune response. A Review in the Theme: Cellular responses to
hypoxia. Am J Physiol Cell Physiol. 309:C569–C579. 2015. View Article : Google Scholar : PubMed/NCBI
|
|
17
|
Colegio OR, Chu NQ, Szabo AL, Chu T,
Rhebergen AM, Jairam V, Cyrus N, Brokowski CE, Eisenbarth SC,
Phillips GM, et al: Functional polarization of tumour-associated
macrophages by tumour-derived lactic acid. Nature. 513:559–563.
2014. View Article : Google Scholar : PubMed/NCBI
|
|
18
|
Hoque R, Farooq A, Ghani A, Gorelick F and
Mehal WZ: Lactate reduces liver and pancreatic injury in Toll-like
receptor- and inflammasome-mediated inflammation via GPR81-mediated
suppression of innate immunity. Gastroenterology. 146:1763–1774.
2014. View Article : Google Scholar : PubMed/NCBI
|
|
19
|
Errea A, Cayet D, Marchetti P, Tang C,
Kluza J, Offermanns S, Sirard JC and Rumbo M: Lactate inhibits the
Pro-inflammatory response and metabolic reprogramming in murine
macrophages in a GPR81-independent manner. PLoS One.
11:e01636942016. View Article : Google Scholar : PubMed/NCBI
|
|
20
|
Iraporda C, Romanin DE, Bengoa AA, Errea
AJ, Cayet D, Foligné B, Sirard JC, Garrote GL, Abraham AG and Rumbo
M: Local treatment with lactate prevents intestinal inflammation in
the TNBS-induced colitis model. Front Immunol. 7:6512016.
View Article : Google Scholar : PubMed/NCBI
|
|
21
|
Pereira TA, Xie G, Choi SS, Syn WK, Voieta
I, Lu J, Chan IS, Swiderska M, Amaral KB, Antunes CM, et al:
Macrophage-derived Hedgehog ligands promotes fibrogenic and
angiogenic responses in human schistosomiasis mansoni. Liver Int.
33:149–161. 2013. View Article : Google Scholar : PubMed/NCBI
|
|
22
|
Karnam A, Holla S and Balaji KN: Sonic
hedgehog-responsive lipoxygenases and cyclooxygenase-2 modulate
Dectin-1-induced inflammatory cytokines. Mol Immunol. 68:280–289.
2015. View Article : Google Scholar : PubMed/NCBI
|
|
23
|
Yang Y, Kim SC, Yu T, Yi YS, Rhee MH, Sung
GH, Yoo BC and Cho JY: Functional roles of p38 mitogen-activated
protein kinase in macrophage-mediated inflammatory responses.
Mediators Inflamm. 2014:3523712014. View Article : Google Scholar : PubMed/NCBI
|
|
24
|
Lavin Y, Kobayashi S, Leader A, Amir ED,
Elefant N, Bigenwald C, Remark R, Sweeney R, Becker CD, Levine JH,
et al: Innate immune landscape in early lung adenocarcinoma by
paired single-cell analyses. Cell. 169:750–765.e17. 2017.
View Article : Google Scholar : PubMed/NCBI
|
|
25
|
Carmona-Fontaine C, Bucci V, Akkari L,
Deforet M, Joyce JA and Xavier JB: Emergence of spatial structure
in the tumor microenvironment due to the Warburg effect. Proc Natl
Acad Sci USA. 110:19402–19407. 2013. View Article : Google Scholar : PubMed/NCBI
|
|
26
|
Jenkins SJ, Ruckerl D, Cook PC, Jones LH,
Finkelman FD, van Rooijen N, MacDonald AS and Allen JE: Local
macrophage proliferation, rather than recruitment from the blood,
is a signature of TH2 inflammation. Science. 332:1284–1288. 2011.
View Article : Google Scholar : PubMed/NCBI
|
|
27
|
Roiniotis J, Dinh H, Masendycz P, Turner
A, Elsegood CL, Scholz GM and Hamilton JA: Hypoxia prolongs
monocyte/macrophage survival and enhanced glycolysis is associated
with their maturation under aerobic conditions. J Immunol.
182:7974–7981. 2009. View Article : Google Scholar : PubMed/NCBI
|
|
28
|
Durnova GN, Kaplanskii AS and Portugalov
VV: The effect of hypoxia on the function and metabolism of
alveolar macrophages. Biull Eksp Biol Med. 79:113–115. 1975.(In
Russian). View Article : Google Scholar : PubMed/NCBI
|