Introduction
Primary biliary cholangitis (PBC) is a chronic and
progressive immune-mediated cholestatic liver disease (1). The survival periods of patients with
PBC vary. For patients diagnosed at the early stage, the survival
periods are similar to those of healthy individuals after
ursodeoxycholic acid (UDCA) treatment (2). The median survival time is 6–10 years
for patients with advanced PBC (3).
According to clinical practice guidelines, risk stratification has
a vital role in the clinical management of patients with PBC
(4). For risk stratification of
patients with PBC, it is required to assess the probability of
adverse events and perform a prediction of the prognosis prior to
treatment. In order to predict the survival of patients with PBC,
several prognostic models based on clinical parameters have been
developed, including the GLOBE score, UK-PBC risk score and Mayo
risk score (5–8).
All of the continuous scoring systems mentioned
above have been widely used for prognostic evaluation in patients
with PBC. Furthermore, several studies were performed to explore
novel prognostic indices or models (5,7). Their
results suggested that existing prognostic models of PBC may be
improved by taking other variables into account. In previous years,
erythroid-associated parameters have been indicated to be linked to
liver-associated diseases (9,10). A
previous study has reported that the erythrocyte count in
peripheral blood was associated with survival after surgery in
patients with primary liver cancer (11). Several other studies have reported
that the red blood cell distribution width (RDW) may serve as a
predictive index for histological severity and a potential
prognostic indicator of chronic liver diseases (12–14).
While the mechanism underlying the clinical relevance of
erythrocytes in PBC remains elusive, previous studies have
indicated that erythroid parameters, including the erythrocyte
count, are potential prognostic indicators for PBC (12,13).
In the present study, the prognostic value of the
erythrocyte count in Chinese patients with PBC was analyzed.
Correlations of the erythrocyte count with liver-associated indices
were investigated. Furthermore, a novel predictive model for the
prognosis of PBC was developed by incorporating the erythrocyte
count and other biochemical indices.
Patients and methods
Patients
The present study was approved by the Ethics
Committee of Xijing Hospital (Xi'an, China) and all patients had
signed an informed consent form. The present study was performed in
accordance with the Declaration of Helsinki. The present study
retrospectively enrolled 301 patients with PBC who received
treatment at the Department of Gastroenterology at Xijing Hospital
(Xi'an, China) from March 2006 to August 2018. Initiation of UDCA
treatment was between March 2006 and January 2017. The inclusion
criteria were as follows: i) Patients diagnosed with PBC meeting at
least two of the following criteria: Alkaline phosphatase (ALP)
>2-fold of the upper limit normal (ULN) or gamma-glutamyl
transpeptidase (GGT) >5-fold of the ULN, titer of
anti-mitochondrial antibody >1:40 and liver biopsy exhibiting
florid bile duct lesions; ii) UDCA treatment was initiated and
maintained for at least 12 months at the dosage of 13–15 mg/kg/day
after diagnosis of PBC. The exclusion criteria were as follows: i)
Concurrence of other liver diseases, including viral hepatitis,
primary sclerosing cholangitis, autoimmune hepatitis, alcoholic
liver disease, hemochromatosis, Wilsons disease or non-alcoholic
steatohepatitis; ii) baseline clinical data were incomplete; iii)
for patients with transplant-free survival, the duration of
follow-up was <1 year. All patients had been followed up at
intervals of 1–6 months during UDCA treatment. The ULN of ALP was
150 U/l and the ULN of GGT was 50 U/l.
Study design
Clinical data were retrieved from the patients'
records at baseline and after 1 year of treatment. The data
included the erythrocyte count, haemoglobin (HGB), hematocrit
(HCT), erythrocyte mean corpuscular volume (MCV), age, sex,
platelets (PLT), alanine aminotransferase (ALT), aspartate
aminotransferase (AST), albumin (ALB), globulin (GLB), total
bilirubin (TBIL), ALP, GGT, cholesterol, triglyceride (TG),
creatinine (CRE), prothrombin time (PT), activated partial
thromboplastin time (APTT), fibrinogen and thrombin time. Other
demographic indices, including body mass index and status of
smoking and drinking, were not included in the analysis, as they
were not available. The GLOBE score and UK-PBC risk score were
calculated after 1 year of treatment and the Mayo risk score was
determined at baseline. Liver stiffness (LS) (15) and Fibrosis-4 (FIB-4) (16) were recorded at baseline and taken as
indicators of liver fibrosis. LS was detected by transient
elastography with FibroTouch (Wuxi Hisky Medical Technology Co.,
Ltd.). According to the formula in the Formulae of predictive
models section below, the FIB-4 score was determined from four
baseline variables, including age, AST, ALT and PLT. Pathological
stages were classified according to Ludwig's classification
(17) and presented as categorical
data. The end-points were defined as liver transplantation or
death.
Histological analysis
Liver biopsies were analyzed by two experienced
hepatic pathologists (Professor Zengshan Li and Dr Lin Chen,
Department of Pathology, Xijing Hospital, Fourth Military Medical
University). Histological features were recorded as stage 1 (portal
stage), stage 2 (periportal stage), stage 3 (septal stage) and
stage 4 (cirrhosis) (17,18), according to Ludwig's
classification.
Statistical analysis
Continuous variables with a normal distribution are
expressed as the mean ± standard deviation, while variables with a
non-normal distribution are presented as the median (lower
quartile-upper quartile). Shapiro-Wilk test was applied to assess
normality of distribution. Categorical variables were expressed as
n (%). For comparison of categorical data, Fisher's exact test was
performed. The Kruskal-Wallis H-test and Mann-Whitney U-test with
Bonferroni correction were used for continuous values with a
non-normal distribution. Hazard ratios (HRs) and 95% CIs of
biochemical parameters were calculated using the Cox regression
model in univariate and multivariate analyses. Bivariate
correlation analysis was applied to determine correlations between
erythrocyte count and liver-associated parameters and Spearman
correlation coefficients were obtained. Receiver operating
characteristic (ROC) curve analysis was utilized for evaluating the
prognostic value of biochemical parameters and predictive models.
Comparisons of areas under receiver operating characteristic curve
(AUCs) of biochemical parameters and predictive models were
accomplished by the Delong-Delong non-parametric method. Based on
binary multivariate logistic regression analysis, a predictive
model was constructed for estimating the prognosis at baseline. The
Hosmer-Lemeshow test was applied to test for the goodness of fit of
the predictive model. Analyses were accomplished using SPSS 19.0
(IBM Corp.), except for the comparisons of AUCs, which were
performed with MedCalc Statistical Software version 15.2.2 (MedCalc
Software bvba). The P-values were two-sided and P<0.05 was
considered to indicate a statistically significant difference.
Formulae of predictive models
i) GLOBE score=0.044378 × age (years) at baseline +
0.93982 × ln(TBIL times ULN at one-year follow-up) + 0.335648 ×
ln(ALP times the ULN at one-year follow-up) −2.266708 × ALB times
the lower limit of normal (LLN) at one-year follow-up −0.002581 ×
PLT count per 109/l at one-year follow-up + 1.216865
(6).
ii) UK-PBC risk score=1-0.9820.0287854 × (ALP
at one-year follow-up/ULN-1.722136304) −0.0422873 × {[1/(AST at
one-year follow-up/ULN/10)] −8.675729006} + 1.4199 × [ln(TBIL at
one-year follow-up/ULN/10) + 2.709607778]-1.960303 ×
(ALB/LLN-1.17673001) −0.4161954 × (PLT/LLN-1.873564875)
(7).
iii) FIB-4=[age (years) × AST (U/l)]/[PLT
(109/l) × ALT(U/l)]
(16).
iv) Mayo risk score=0.039 × age (years) + 0.871 ×
ln[serum bilirubin (mg/dl)] −2.53 × ln[albumin (mg/dl)] + 2.38 ×
ln[prothrombin time (sec)] + 0.859 × ascites; (ascites: no=0,
yes=1) (8).
Results
Patient characteristics
The demographic and clinical data of the present
cohort are provided in Table I. A
total of 301 Chinese patients with PBC were retrospectively
reviewed, including 258 (85.7%) females and 43 (14.3%) males. The
average age of the patients at baseline was 51.89 years. The median
follow-up time was 44 months. Furthermore, 41 patients (13.6%)
underwent liver transplantation or died during the follow-up.
 | Table I.Features at baseline and after one
year of therapy. |
Table I.
Features at baseline and after one
year of therapy.
| Parameter | Normal limit | Baseline | After one year of
therapy | P-value |
|---|
| Erythrocytes
(1012/l) | >4.00 | 3.94
(3.52–4.29) | 4.24
(3.88–4.56) | <0.001 |
| HGB (g/l) | >120.00 | 119.00
(105.00–131.00) | 127.00
(111.00–137.00) | <0.001 |
| HCT (%) | >40.0 | 36.7
(32.5–39.5) | 38.9
(34.8–41.5) | <0.001 |
| MCV (fl) | >80.00 | 93.00
(89.80–96.20) | 92.40
(87.98–95.78) | 0.064 |
| PLT
(109/l) | >100.00 | 137.00
(83.00–202.00) | 146.00
(84.50–210.00) | 0.304 |
| ALT (U/l) | <40.00 | 58.00
(37.00–94.00) | 33.00
(23.00–55.75) | <0.001 |
| AST (U/l) | <40.00 | 63.00
(43.00–96.00) | 38.00
(29.00–59.75) | <0.001 |
| ALB (g/l) | >35.00 | 39.20
(36.00–41.80) | 43.00
(39.90–45.50) | <0.001 |
| GLB (g/l) | <32.00 | 30.75
(28.00–34.40) | 31.80
(28.50–35.10) | 0.178 |
| TBIL (µmol/l) | <17.10 | 19.00
(12.70–32.00) | 14.50
(10.83–21.40) | <0.001 |
| ALP (U/l) | <150.00 | 263.00
(161.00–427.50) | 162.50
(111.00–243.25) | <0.001 |
| GGT (U/l) | <50.00 | 268.00
(118.50–425.00) | 101.50
(42.00–211.50) | <0.001 |
| CHO (mmol/l) | <5.18 | 4.43
(3.65–5.71) | 4.85
(3.92–5.60) | 0.090 |
| TG (mmol/l) | <1.70 | 1.17
(0.77–1.69) | 1.25
(0.92–1.84) | 0.006 |
| CRE (µmol/l) | <133.00 | 75.00
(66.00–84.00) | 80.00
(72.00–88.50) | <0.001 |
| PT (sec) | <13.00 | 12.90
(12.20–13.90) | 12.90
(12.30–13.70) | 0.929 |
| APTT (sec) | <37.00 | 39.85
(36.20–43.73) | 38.75
(35.48–42.58) | 0.161 |
| Fibrinogen
(g/l) | >2.00 | 2.96
(2.50–3.52) | 3.00
(2.51–3.54) | 0.862 |
| TT (sec) | <16.00 | 17.20
(16.40–18.00) | 17.10
(16.30–18.40) | 0.571 |
| Age (years) |
| 51.89±9.98 |
|
|
| Female sex (%) |
| 258 (85.7%) |
|
|
| Follow-up
timea (months) |
| 44 (27–60) |
|
|
| Stage
(1/2/3/4) |
| 22/119/48/65 |
|
|
| Transplant-free
survivalb (%) |
| 260 (86.4%) |
|
|
| LS (kPa) |
| 9.91
(6.82–19.56) |
|
|
| FIB-4 |
| 3.287
(1.836–6.383) |
|
|
| Mayo risk
score |
| 4.847
(4.251–5.708) |
|
|
| GLOBE score |
|
| 0.191
(−0.468–1.053) |
|
| UK-PBC risk
score |
|
| 0.0306
(0.0153–0.0726) |
|
Prognostic factors of survival by
univariate and multivariate regression analysis
According to the univariate Cox regression analysis,
the baseline erythrocyte count, MCV, HGB, HCT, age, PLT, AST, ALB,
GLB, TBIL, CRE, PT and APTT were associated with patient survival.
A multivariate analysis was then performed for each of these
baseline factors. The results indicated that only the erythrocyte
count (P=0.042, HR: 0.524, 95%CI: 0.281–0.976), ALB (P<0.001,
HR: 0.844, 95%CI: 0.792–0.900) and TBIL (P<0.001, HR: 1.008,
95%CI: 1.005–1.012) at baseline were independent risk factors and
associated with patient prognosis (Table II).
| Table II.Prognostic value of baseline
parameters in Cox regression analysis. |
Table II.
Prognostic value of baseline
parameters in Cox regression analysis.
|
| Univariate
analysis | Multivariate
analysis |
|---|
|
|
|
|
|---|
| Baseline
parameter | P-value | Hazard ratio | 95% CI | P-value | Hazard ratio | 95% CI |
|---|
| Age | <0.001 | 1.059 | 1.021–1.099 |
|
|
|
| Sex
(female/male) | 0.960 | 0.978 | 0.411–2.328 |
|
|
|
| Erythrocyte | <0.001 | 0.246 | 0.166–0.365 | 0.042 | 0.524 | 0.281–0.976 |
| HGB | <0.001 | 0.969 | 0.958–0.981 |
|
|
|
| HCT | <0.001 | 0.001 | 0.000–0.001 |
|
|
|
| MCV | 0.304 | 1.008 | 0.993–1.022 |
|
|
|
| PLT | 0.007 | 0.994 | 0.989–0.998 |
|
|
|
| ALT | 0.725 | 0.999 | 0.994–1.004 |
|
|
|
| AST | 0.057 | 1.003 | 1.000–1.006 |
|
|
|
| ALB | <0.001 | 0.819 | 0.782–0.858 | <0.001 | 0.844 | 0.792–0.900 |
| GLB | 0.053 | 1.044 | 0.999–1.091 |
|
|
|
| TBIL | <0.001 | 1.011 | 1.008–1.014 | <0.001 | 1.008 | 1.005–1.012 |
| ALP | 0.410 | 1.000 | 0.999–1.002 |
|
|
|
| GGT | 0.341 | 0.999 | 0.998–1.001 |
|
|
|
| CHO | 0.776 | 0.978 | 0.838–1.141 |
|
|
|
| TG | 0.910 | 0.979 | 0.684–1.403 |
|
|
|
| CRE | 0.028 | 0.973 | 0.949–0.997 |
|
|
|
| PT | <0.001 | 1.385 | 1.215–1.579 |
|
|
|
| APTT | 0.001 | 1.076 | 1.030–1.124 |
|
|
|
| Fibrinogen | 0.234 | 0.779 | 0.516–1.175 |
|
|
|
| TT | 0.973 | 0.999 | 0.953–1.047 |
|
|
|
Correlation of erythrocyte count with
biochemical and fibrosis indices
Bivariate correlation analysis was used for
determining linear correlation coefficients between the erythrocyte
count and other baseline biochemical indices (Table SI). Close correlations were
identified between the erythrocyte count and other parameters,
including the PLT, ALB and TBIL (P<0.001). A positive
correlation of the erythrocyte count with ALB (r=0.555) and PLT
(r=0.329) was determined, as well as a negative correlation with
TBIL (r=−0.406). The correlations between the erythrocyte count and
hepatic fibrosis parameters were investigated to verify whether the
erythrocyte count in the peripheral blood was associated with the
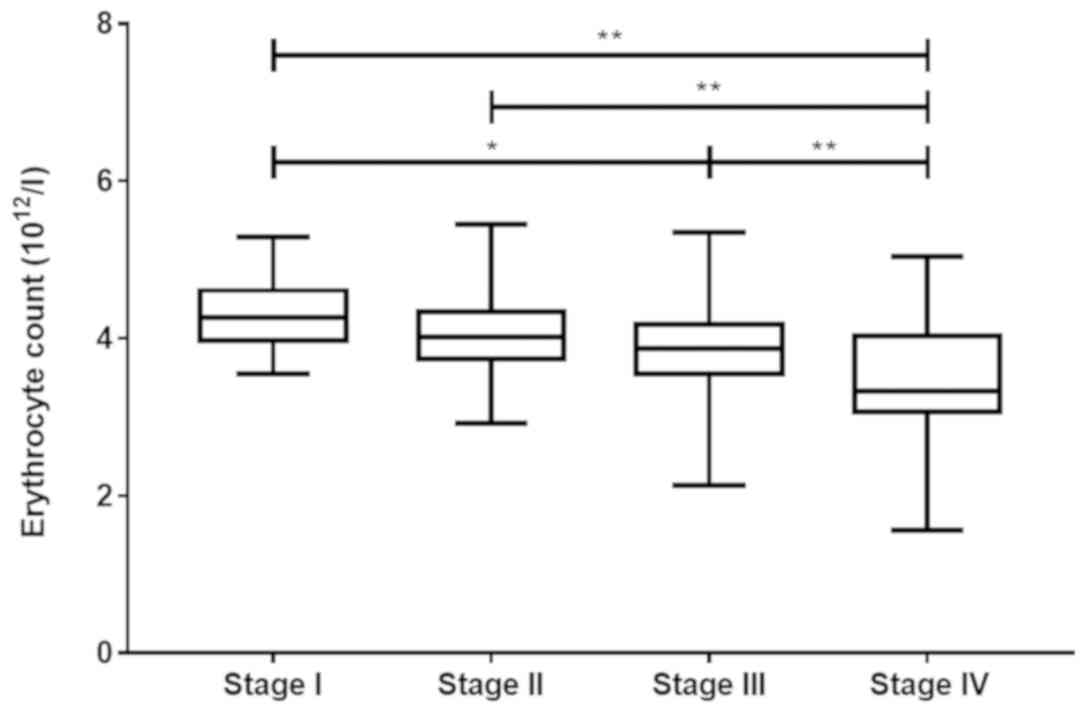
progression of PBC. The erythrocyte count decreased as the
pathological stage increased (P<0.001; Fig. 1; Table
SII). There was a negative correlation between the erythrocyte
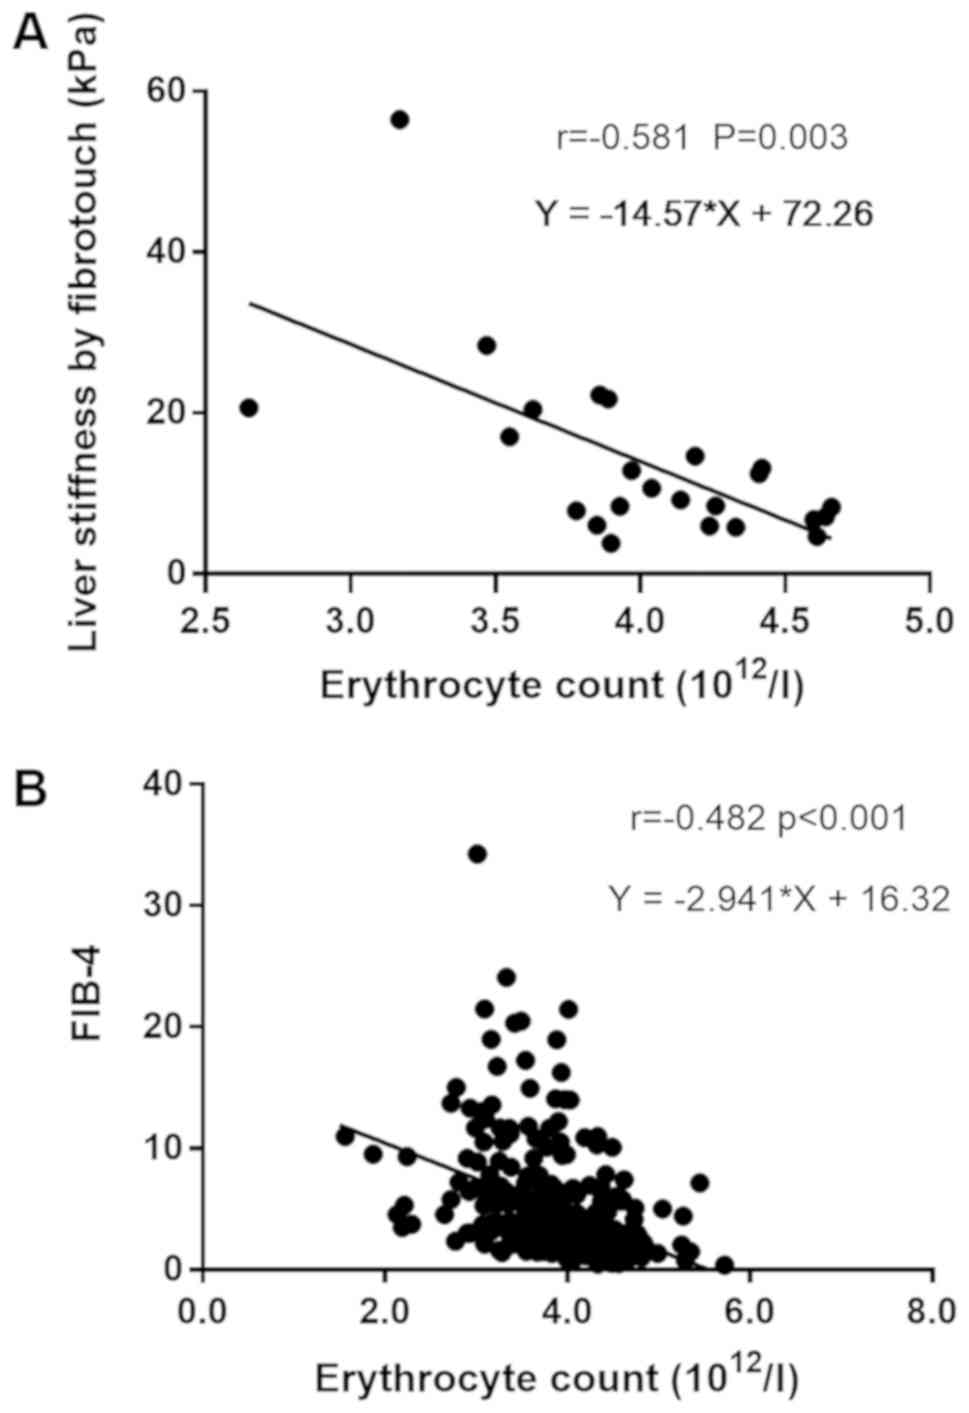
count and the pathological stage (r=−0.410, P<0.001; Fig. S1). Furthermore, a bivariate
correlation analysis was performed, suggesting that the erythrocyte
count was closely linearly correlated to LS (r=−0.581, P=0.003) and
FIB-4 (r=−0.482, P<0.001), indicating that the erythrocyte count
was associated with the progression of cirrhosis in Chinese
patients with PBC (Fig. 2).
Predictive performance of erythroid
parameters for patient prognosis
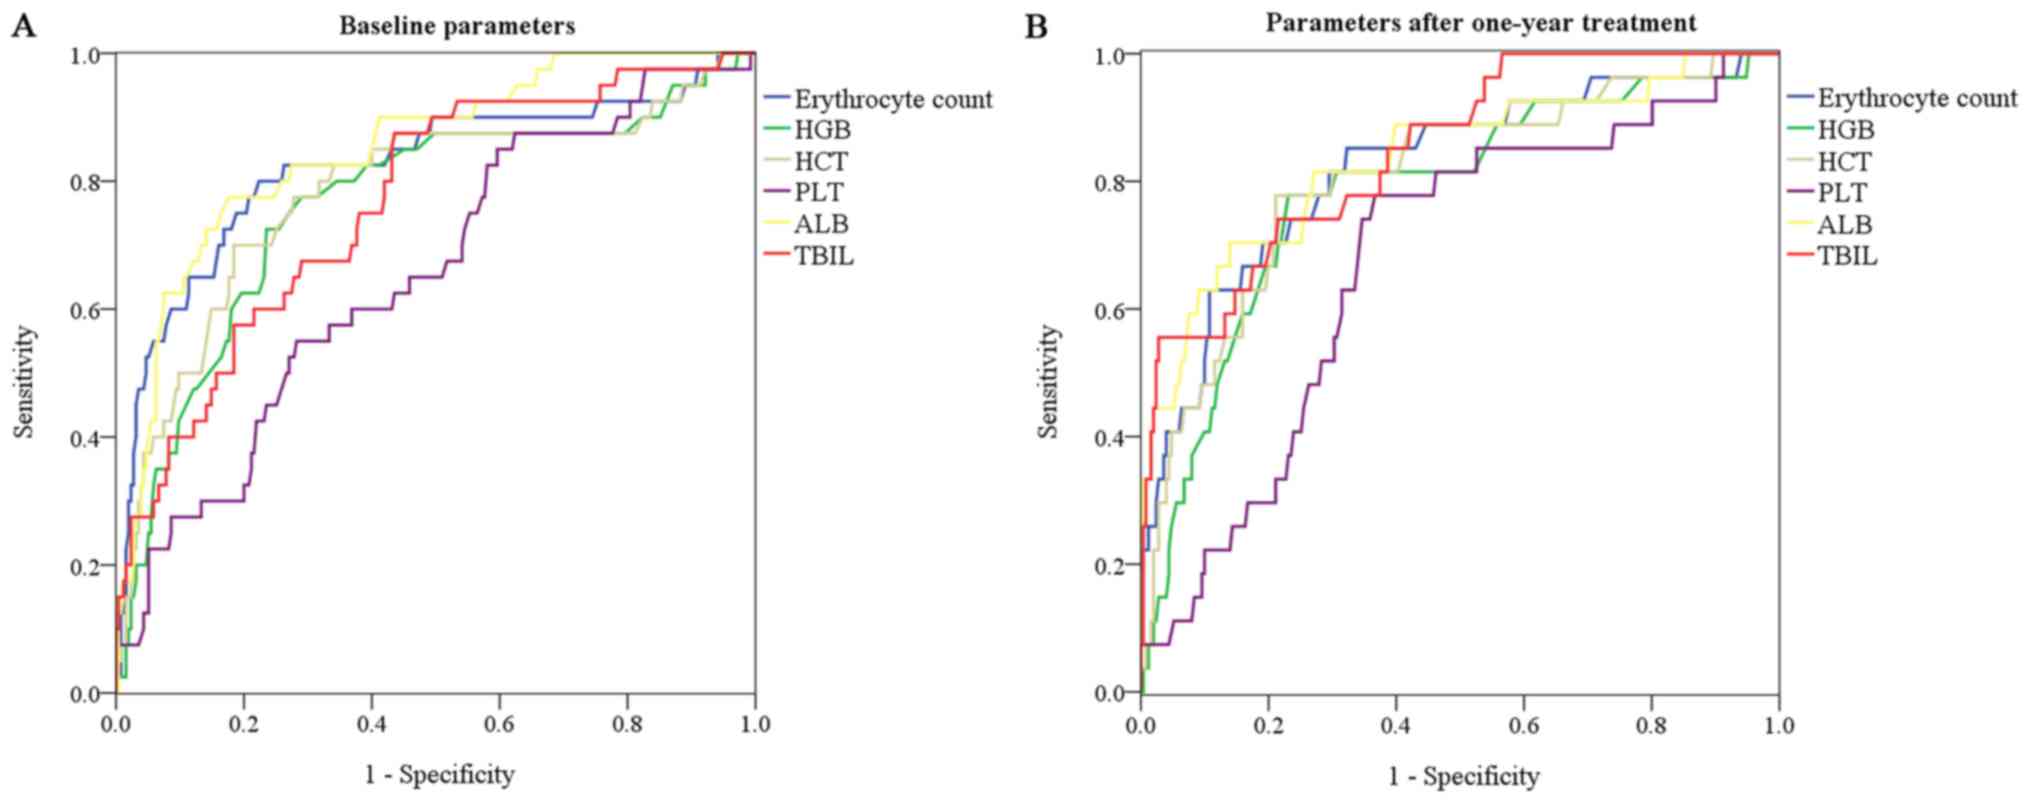
The prognostic value of various biochemical indices
was determined using ROC curve analysis at baseline and at the
one-year follow-up. At baseline, the erythrocyte count had a
significantly higher AUC value than HGB (0.822 vs. 0.762,
P<0.001), HCT (0.822 vs. 0.782, P=0.002) and PLT (0.822 vs.
0.654, P=0.003; Fig. 3A). After UDCA
treatment for one year, the erythrocyte count still had a
significantly higher AUC value than PLT (0.821 vs. 0.676, P=0.006;
Fig. 3B; Table III). The AUC of the erythrocyte
count was comparable to that of ALB and TBIL (P>0.05) at
baseline and at the one-year follow-up (Table SIII).
| Table III.Prognostic value of parameters at
baseline and after one year of therapy. |
Table III.
Prognostic value of parameters at
baseline and after one year of therapy.
| A, Baseline |
|---|
|
|---|
|
|
|
| Asymptotic 95%
confidence interval |
|---|
|
|
|
|
|
|---|
| Parameter | Area | P-value | Lower | Upper |
|---|
| Erythrocyte
count | 0.822 | <0.001 | 0.738 | 0.906 |
| HGB | 0.762 | <0.001 | 0.674 | 0.851 |
| HCT | 0.782 | <0.001 | 0.693 | 0.870 |
| PLT | 0.654 | 0.002 | 0.563 | 0.744 |
| ALB | 0.849 | <0.001 | 0.785 | 0.914 |
| TBIL | 0.765 | <0.001 | 0.687 | 0.843 |
|
| B, After one
year of treatment |
|
|
|
|
| Asymptotic 95%
confidence interval |
|
|
|
|
|
|
Parameter | Area | P-value | Lower | Upper |
|
| Erythrocyte
count | 0.821 | <0.001 | 0.730 | 0.912 |
| HGB | 0.783 | <0.001 | 0.687 | 0.879 |
| HCT | 0.807 | <0.001 | 0.715 | 0.898 |
| PLT | 0.676 | 0.003 | 0.575 | 0.777 |
| ALB | 0.835 | <0.001 | 0.743 | 0.927 |
| TBIL | 0.846 | <0.001 | 0.772 | 0.921 |
Derivation of predictive model for
prognosis
Multivariate logistic regression analysis was
performed on potential prognostic risk factors to construct a
predictive model. Only variables identified in the multivariate Cox
regression were included in the model. Ln transformations were
applied for erythrocyte count and TBIL. The predictive model was
constructed as follows:
P=1/{1 + e−[6.140–3.193 × Ln(erythrocyte count)
−0.184 × ALB + 0.827 × LnTBIL]}.
Regarding goodness of fit, the result of the Hosmer-
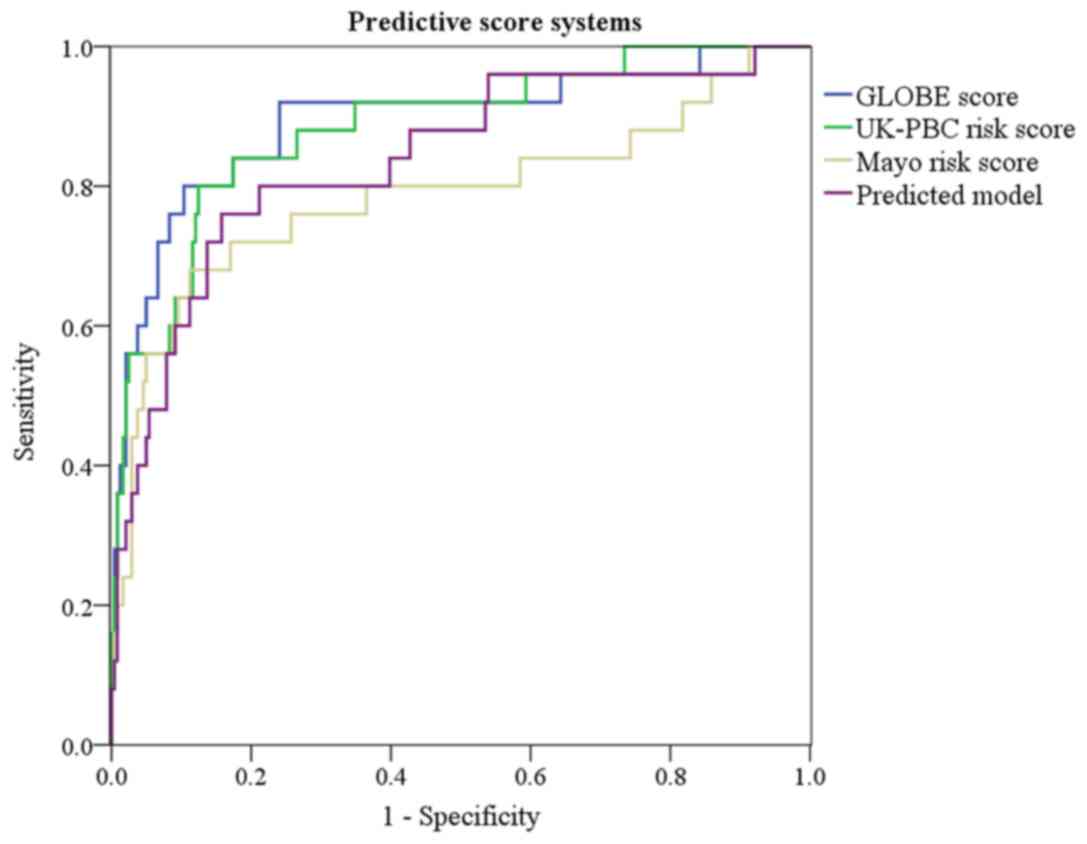
Lemeshow test was P=0.454. Subsequently, the performance of the
novel predictive model was compared using the GLOBE score, UK-PBC
risk score and Mayo risk score. At baseline, the novel model had a
greater AUC value than the Mayo risk score (0.838 vs. 0.787), while
the novel model had a similar AUC value compared with the GLOBE
score and the UK-PBC risk score (P>0.05; Fig. 4; Table
IV; Table SIV). The sensitivity
and specificity of the predictive model were 80.0 and 85.1% for
predicting transplant-free survival according to the maximum Youden
index.
| Table IV.Receiver operating characteristic
parameters presenting the prognostic value of predictive score
systems. |
Table IV.
Receiver operating characteristic
parameters presenting the prognostic value of predictive score
systems.
|
|
|
| Asymptotic 95%
confidence interval |
|
|
|---|
|
|
|
|
|
|
|
|---|
| Scoring system | Area under
curve | P-value | Lower | Upper | Sensitivity
(%) | Specificity
(%) |
|---|
| Predictive model
(>0.16) | 0.838 | <0.001 | 0.747 | 0.929 | 80.0 | 85.1 |
| Mayo risk score
(>6.10) | 0.787 | <0.001 | 0.668 | 0.907 | 74.4 | 88.5 |
| GLOBE score
(>0.83) | 0.893 | <0.001 | 0.812 | 0.974 | 92.9 | 76.4 |
| UK-PBC risk score
(>0.092) | 0.884 | <0.001 | 0.809 | 0.959 | 78.6 | 87.2 |
Discussion
Abnormalities of peripheral blood erythroid
parameters have been observed in several liver diseases. In recent
years, certain studies with limited patients indicated a potential
prognostic value of erythroid parameters in patients with PBC
(12,13). The decrease in erythrocyte count may
be attributed to several aspects. As a common reason for the
decrease of the erythocyte count, hemolysis presents in up to 50%
of patients with chronic liver disease regardless of etiologies
(19). Complications of cirrhosis,
including splenomegaly, are the major reasons for hemolysis in
patients with end-stage disease. Alterations of the lipid
composition, which were detected in the erythrocyte membrane of
patients with liver diseases, have been associated with liver
damage (20,21). The erythrocyte count in peripheral
blood may be associated with chronic hepatic injury due to the
impairment of the erythrocyte membrane structure caused by
alteration of the lipid composition. Furthermore, certain studies
suggested that the deficiency of hematopoietic precursors due to
immune injury of the hematopoietic system was also linked to a
reduced erythrocyte count in patients with PBC (22,23).
Other causes of erythrocyte deficiency included malnutrition, iron
deficiency, bone marrow depression, cirrhosis and medications
(22,24).
Splenomegaly is a cause of decreased erythrocyte
count in patients with end-stage PBC and it is considered to be
linked to poor prognosis. However, in the present study,
splenomegaly was not subjected to multivariate Cox regression
analysis, as the results of the imaging examination at baseline
were not available for all patients. The relevance of splenomegaly
regarding the prognostic value of the erythrocyte count requires to
be clarified. The mechanisms underlying the correlations between
erythrocytes and liver fibrosis or dysfunction in patients with PBC
also require to be further clarified. In the present study, a close
correlation between erythrocyte count and liver function
parameters, including ALB and TBIL, was identified. Furthermore,
the erythrocyte count decreased as the pathological stage and liver
fibrosis progressed. The increase in erythrocyte count after UDCA
treatment was accompanied by the improvement of liver function and
liver fibrosis score. Therefore, the decrease of the erythrocyte
count may reflect the severity of liver disease and the extent of
liver function deficiency in patients with PBC, which is in
accordance with a previous study in patients with primary liver
cancer (11).
Early prognostic models are important for risk
stratification for patients with PBC. In the present study, the
prognostic value of the erythrocyte count was investigated as a
simple, routinely tested parameter in Chinese patients with PBC.
The novel predictive model incorporating the erythrocyte count had
a better prognostic performance than the Mayo risk score, one of
the most widely used prognostic systems (25), and was comparable with the GLOBE
score and UK-PBC risk score in the evaluation of the prognosis
regarding transplant-free survival. The GLOBE score and UK-PBC risk
score involve parameters after one year of UDCA treatment. The
novel model included only parameters at baseline, which may be
helpful for early prognosis evaluation prior to initiation of UDCA
treatment.
The present study has certain limitations. First,
the present study was a retrospective study performed in only one
clinical center. More prospective studies are required to confirm
the results of the present study. Furthermore, no validation of the
novel model was performed in another PBC cohort. The present cohort
was only comprised of Chinese patients with PBC from one hospital.
Although the sample size of the cohort was relatively big, it is
still required to validate the prognostic model in other cohorts in
China and other populations. Furthermore, RDW has been reported to
be of prognostic value in PBC patients. RDW data were missing from
the clinical data of the present cohort, making it impossible to
verify the results of previous studies and to determine whether RDW
is a surrogate parameter for the erythrocyte count in the prognosis
of PBC.
In conclusion, the present study indicated that the
erythrocyte count is a useful prognostic parameter in Chinese
patients with PBC. The peripheral blood erythrocyte count was
closely correlated with liver dysfunction and fibrosis. The model
incorporating the erythrocyte count, ALB and TBIL may serve as an
early prognostic tool for PBC.
Supplementary Material
Supporting Data
Acknowledgements
The authors would like to thank Professor Zengshan
Li and Dr Lin Chen (Department of Pathology, Xijing Hospital,
Fourth Military Medical University) for the analyses of liver
biopsies.
Funding
The present study was funded by the National Natural
Science Foundation of China (grant no. 81770569).
Availability of data and materials
The datasets used and/or analyzed during the present
study are available from the corresponding author on reasonable
request.
Authors' contributions
YiC conceived experiments, recruited patients, and
acquired and analyzed data. CG contributed to the conception of the
experiment and revised the manuscript. GG, ZY and GJ contributed to
the acquisition of data and the patient recruitment. XZ, JW, ZH,
YuC reviewed the manuscript and contributed to the interpretation
of results. YH designed experiments and reviewed the
manuscript.
Ethics approval and consent to
participate
This study was approved by the Ethics Committee of
Xijing Hospital (Xi'an, China) and all patients had provided
written informed consent. The study was performed in accordance
with the Declaration of Helsinki.
Patient consent for publication
Not applicable.
Competing interests
The authors declare that they have no competing
interests.
Glossary
Abbreviations
Abbreviations:
|
PBC
|
primary biliary cholangitis
|
|
UDCA
|
ursodeoxycholic acid
|
|
RDW
|
red blood cell distribution width
|
|
ALP
|
alkaline phosphatase
|
|
ULN
|
upper limit of normal
|
|
GGT
|
gamma-glutamyltranspeptidase
|
|
HGB
|
haemoglobin
|
|
HCT
|
hematocrit
|
|
MCV
|
erythrocyte mean corpuscular
volume
|
|
PLT
|
platelet
|
|
ALT
|
alanine aminotransferase
|
|
AST
|
aspartate aminotransferase
|
|
ALB
|
albumin
|
|
GLB
|
globulin
|
|
TBIL
|
total bilirubin
|
|
CHO
|
cholesterol
|
|
TG
|
triglyceride
|
|
CRE
|
creatinine
|
|
PT
|
prothrombin time
|
|
APTT
|
activated partial thromboplastin
time
|
|
TT
|
thrombin time
|
|
LS
|
liver stiffness
|
|
FIB-4
|
fibrosis-4
|
References
|
1
|
Hirschfield GM and Gershwin ME: The
immunobiology and pathophysiology of primary biliary cirrhosis. Ann
Rev Pathol. 8:303–330. 2013. View Article : Google Scholar
|
|
2
|
Parés A, Caballería L and Rodés J:
Excellent long-term survival in patients with primary biliary
cirrhosis and biochemical response to ursodeoxycholic Acid.
Gastroenterol. 130:715–720. 2006. View Article : Google Scholar
|
|
3
|
Carey EJ, Ali AH and Lindor KD: Primary
biliary cirrhosis. Lancet. 386:1565–1575. 2015. View Article : Google Scholar : PubMed/NCBI
|
|
4
|
European Association for the Study of the
Liver. Electronic address, . easloffice@easloffice.eu; European
Association for the Study of the Liver: EASL clinical practice
guidelines: The diagnosis and management of patients with primary
biliary cholangitis. J Hepatol. 67:145–172. 2017. View Article : Google Scholar : PubMed/NCBI
|
|
5
|
Chen S, Duan W, You H and Jia J: A brief
review on prognostic models of primary biliary cholangitis. Hepatol
Int. 11:412–418. 2017. View Article : Google Scholar : PubMed/NCBI
|
|
6
|
Lammers WJ, Hirschfield GM, Corpechot C,
Nevens F, Lindor KD, Janssen HL, Floreani A, Ponsioen CY, Mayo MJ,
Invernizzi P, et al: Development and validation of a scoring system
to predict outcomes of patients with primary biliary cirrhosis
receiving ursodeoxycholic acid therapy. Gastroenterology.
149:1804–1812. 2015. View Article : Google Scholar : PubMed/NCBI
|
|
7
|
Carbone M, Sharp SJ, Flack S, Paximadas D,
Spiess K, Adgey C, Griffiths L, Lim R, Trembling P, Williamson K,
et al: The UK-PBC risk scores: Derivation and validation of a
scoring system for long-term prediction of end-stage liver disease
in primary biliary cholangitis. Hepatology. 63:930–950. 2016.
View Article : Google Scholar : PubMed/NCBI
|
|
8
|
Lammers WJ, Kowdley KV and van Buuren HR:
Predicting outcome in primary biliary cirrhosis. Ann Hepatol.
13:316–326. 2014. View Article : Google Scholar : PubMed/NCBI
|
|
9
|
Hu Z, Sun Y, Wang Q, Han Z, Huang Y, Liu
X, Ding C, Hu C, Qin Q and Deng A: Red blood cell distribution
width is a potential prognostic index for liver disease. Clin Chem
Lab Med. 51:1403–1408. 2013. View Article : Google Scholar : PubMed/NCBI
|
|
10
|
Wei TT, Tang QQ, Qin BD, Ma N, Wang LL,
Zhou Lin and Zhong RQ: Elevated red blood cell distribution width
is associated with liver function tests in patients with primary
hepatocellular carcinoma. Clin Hemorheol Microcirc. 64:149–155.
2016. View Article : Google Scholar : PubMed/NCBI
|
|
11
|
Xie X, Yao M, Chen X, Lu W, Lv Q, Wang K,
Zhang L and Lu F: Reduced red blood cell count predicts poor
survival after surgery in patients with primary liver cancer.
Medicine. 94:e5772015. View Article : Google Scholar : PubMed/NCBI
|
|
12
|
Wang LL, Wei TT, Yin JR, Qin BD, Ma N,
Tang QQ, Zhou L and Zhong RQ: Red blood cell distribution width and
mean platelet volume are potential prognostic indices for patients
with primary biliary cirrhosis. Clin Chem Lab Med. 55:e127–e129.
2017. View Article : Google Scholar : PubMed/NCBI
|
|
13
|
Wang H, Xu H, Wang X, Wu R, Gao X, Jin Q
and Niu J: Red blood cell distribution width to platelet ratio is
related to histologic severity of primary biliary cirrhosis.
Medicine (Baltimore). 95:e31142016. View Article : Google Scholar : PubMed/NCBI
|
|
14
|
Wang H, Xu H, Qu L, Wang X, Wu R, Gao X,
Jin Q and Niu J: Red blood cell distribution width and globulin,
noninvasive indicators of fibrosis and inflammation in chronic
hepatitis patients. Eur J Gastroenterol Hepatol. 28:997–1002. 2016.
View Article : Google Scholar : PubMed/NCBI
|
|
15
|
Roccarina D, Rosselli M, Genesca J and
Tsochatzis EA: Elastography methods for the non-invasive assessment
of portal hypertension. Expert Rev Gastroenterol Hepatol.
12:155–164. 2018. View Article : Google Scholar : PubMed/NCBI
|
|
16
|
Tsai E and Lee TP: Diagnosis and
evaluation of nonalcoholic fatty liver disease/nonalcoholic
steatohepatitis, including noninvasive biomarkers and transient
elastography. Clin Liver Dis. 22:73–92. 2018. View Article : Google Scholar : PubMed/NCBI
|
|
17
|
Chan AW, Chan RC, Wong GL, Wong VW, Choi
PC, Chan HL and To KF: Evaluation of histological staging systems
for primary biliary cirrhosis: Correlation with clinical and
biochemical factors and significance of pathological parameters in
prognostication. Histopathology. 65:174–186. 2014. View Article : Google Scholar : PubMed/NCBI
|
|
18
|
Reshetnyak VI: Primary biliary cirrhosis:
Clinical and laboratory criteria for its diagnosis. World J
Gastroenterol. 21:7683–7708. 2015. View Article : Google Scholar : PubMed/NCBI
|
|
19
|
Gonzalez-Moreno EI, Martinez-Cabriales SA,
Cruz-Moreno MA, Borjas-Almaguer OD, Cortez-Hernandez CA,
Bosques-Padilla FJ, Garza AA, Gonzalez-Gonzalez JA, Garcia-Compean
D, Ocampo-Candiani J and Maldonado-Garza HJ: Primary biliary
cholangitis associated with warm autoimmune hemolytic anemia. J Dig
Dis. 17:128–131. 2016. View Article : Google Scholar : PubMed/NCBI
|
|
20
|
Arendt BM, Ma DW, Simons B, Noureldin SA,
Therapondos G, Guindi M, Sherman M and Allard JP: Nonalcoholic
fatty liver disease is associated with lower hepatic and
erythrocyte ratios of phosphatidylcholine to
phosphatidylethanolamine. Appl Physiol Nutr Metab. 38:334–340.
2013. View Article : Google Scholar : PubMed/NCBI
|
|
21
|
Notarnicola M, Caruso MG, Tutino V,
Bonfiglio C, Cozzolongo R, Giannuzzi V, De Nunzio V, De Leonardis
G, Abbrescia DI, Franco I, et al: Significant decrease of
saturation index in erythrocytes membrane from subjects with
non-alcoholic fatty liver disease (NAFLD). Lipids Health Dis.
16:1602017. View Article : Google Scholar : PubMed/NCBI
|
|
22
|
Tsikrikoni A, Rigopoulou EI, Zachou K,
Liaskos C, Kyriakou D and Dalekos GN: Bone marrow findings in
patients with autoimmune liver diseases. J Gastroenterol Hepatol.
23:e416–e421. 2008. View Article : Google Scholar : PubMed/NCBI
|
|
23
|
Kyriakou DS, Alexandrakis MG, Zachou K,
Passam F, Stathakis NE and Dalekos GN: Hemopoietic progenitor cells
and bone marrow stromal cells in patients with autoimmune hepatitis
type 1 and primary biliary cirrhosis. J Hepatol. 39:679–685. 2003.
View Article : Google Scholar : PubMed/NCBI
|
|
24
|
Karagöz E and Tanoglu A: Red blood cell
distribution width: A potential prognostic index for liver disease?
Clin Chem Lab Med. 52:e2012014. View Article : Google Scholar : PubMed/NCBI
|
|
25
|
Purohit T and Cappell MS: Primary biliary
cirrhosis: Pathophysiology, clinical presentation and therapy.
World J Hepatol. 7:926–941. 2015. View Article : Google Scholar : PubMed/NCBI
|